EP2207481B1 - Method of measuring and displaying the position of a radiographically contrasted material within luminal body organs - Google Patents
Method of measuring and displaying the position of a radiographically contrasted material within luminal body organs Download PDFInfo
- Publication number
- EP2207481B1 EP2207481B1 EP08837148.9A EP08837148A EP2207481B1 EP 2207481 B1 EP2207481 B1 EP 2207481B1 EP 08837148 A EP08837148 A EP 08837148A EP 2207481 B1 EP2207481 B1 EP 2207481B1
- Authority
- EP
- European Patent Office
- Prior art keywords
- image
- radiographic
- lumen
- fields
- targets
- Prior art date
- Legal status (The legal status is an assumption and is not a legal conclusion. Google has not performed a legal analysis and makes no representation as to the accuracy of the status listed.)
- Active
Links
- 238000000034 method Methods 0.000 title claims description 60
- 210000000056 organ Anatomy 0.000 title claims description 25
- 239000000463 material Substances 0.000 title description 10
- 239000002872 contrast media Substances 0.000 claims description 62
- 238000003384 imaging method Methods 0.000 claims description 25
- 238000012545 processing Methods 0.000 claims description 13
- 229910052788 barium Inorganic materials 0.000 claims description 9
- DSAJWYNOEDNPEQ-UHFFFAOYSA-N barium atom Chemical compound [Ba] DSAJWYNOEDNPEQ-UHFFFAOYSA-N 0.000 claims description 9
- 210000001035 gastrointestinal tract Anatomy 0.000 claims description 6
- 238000003780 insertion Methods 0.000 claims 1
- 230000037431 insertion Effects 0.000 claims 1
- 238000005259 measurement Methods 0.000 description 11
- 230000000875 corresponding effect Effects 0.000 description 10
- 210000003238 esophagus Anatomy 0.000 description 9
- 210000000111 lower esophageal sphincter Anatomy 0.000 description 8
- 230000008569 process Effects 0.000 description 8
- 238000004458 analytical method Methods 0.000 description 7
- 238000004422 calculation algorithm Methods 0.000 description 7
- 230000005855 radiation Effects 0.000 description 7
- 210000003484 anatomy Anatomy 0.000 description 6
- 238000013459 approach Methods 0.000 description 5
- 230000008602 contraction Effects 0.000 description 5
- 238000002059 diagnostic imaging Methods 0.000 description 5
- 230000006870 function Effects 0.000 description 5
- 238000012937 correction Methods 0.000 description 4
- 238000003745 diagnosis Methods 0.000 description 4
- 210000001942 upper esophageal sphincter Anatomy 0.000 description 4
- TZCXTZWJZNENPQ-UHFFFAOYSA-L barium sulfate Chemical compound [Ba+2].[O-]S([O-])(=O)=O TZCXTZWJZNENPQ-UHFFFAOYSA-L 0.000 description 3
- 230000008859 change Effects 0.000 description 3
- 230000000694 effects Effects 0.000 description 3
- 238000005516 engineering process Methods 0.000 description 3
- 230000003902 lesion Effects 0.000 description 3
- 230000007246 mechanism Effects 0.000 description 3
- 230000004899 motility Effects 0.000 description 3
- 230000007310 pathophysiology Effects 0.000 description 3
- 230000035479 physiological effects, processes and functions Effects 0.000 description 3
- 238000009877 rendering Methods 0.000 description 3
- 210000005070 sphincter Anatomy 0.000 description 3
- 230000002123 temporal effect Effects 0.000 description 3
- 208000019505 Deglutition disease Diseases 0.000 description 2
- 208000005872 Diffuse Esophageal Spasm Diseases 0.000 description 2
- 208000000289 Esophageal Achalasia Diseases 0.000 description 2
- 206010020772 Hypertension Diseases 0.000 description 2
- 206010030136 Oesophageal achalasia Diseases 0.000 description 2
- 201000000621 achalasia Diseases 0.000 description 2
- 230000004075 alteration Effects 0.000 description 2
- 238000009530 blood pressure measurement Methods 0.000 description 2
- 239000003086 colorant Substances 0.000 description 2
- 238000010276 construction Methods 0.000 description 2
- 230000002596 correlated effect Effects 0.000 description 2
- 238000002405 diagnostic procedure Methods 0.000 description 2
- 208000037265 diseases, disorders, signs and symptoms Diseases 0.000 description 2
- 238000002594 fluoroscopy Methods 0.000 description 2
- 230000001631 hypertensive effect Effects 0.000 description 2
- 230000006872 improvement Effects 0.000 description 2
- 229910052751 metal Inorganic materials 0.000 description 2
- 239000002184 metal Substances 0.000 description 2
- 238000012986 modification Methods 0.000 description 2
- 230000004048 modification Effects 0.000 description 2
- 230000007659 motor function Effects 0.000 description 2
- 210000003205 muscle Anatomy 0.000 description 2
- 230000004118 muscle contraction Effects 0.000 description 2
- 230000007170 pathology Effects 0.000 description 2
- 230000008855 peristalsis Effects 0.000 description 2
- 230000001766 physiological effect Effects 0.000 description 2
- 238000012552 review Methods 0.000 description 2
- 210000002784 stomach Anatomy 0.000 description 2
- 210000002438 upper gastrointestinal tract Anatomy 0.000 description 2
- 230000000007 visual effect Effects 0.000 description 2
- ZCYVEMRRCGMTRW-UHFFFAOYSA-N 7553-56-2 Chemical compound [I] ZCYVEMRRCGMTRW-UHFFFAOYSA-N 0.000 description 1
- 241000167880 Hirundinidae Species 0.000 description 1
- 241000699666 Mus <mouse, genus> Species 0.000 description 1
- 241000699670 Mus sp. Species 0.000 description 1
- 208000031481 Pathologic Constriction Diseases 0.000 description 1
- 230000005856 abnormality Effects 0.000 description 1
- 238000003491 array Methods 0.000 description 1
- 210000004204 blood vessel Anatomy 0.000 description 1
- 238000004364 calculation method Methods 0.000 description 1
- 150000001875 compounds Chemical class 0.000 description 1
- 238000004590 computer program Methods 0.000 description 1
- 229940039231 contrast media Drugs 0.000 description 1
- 230000001419 dependent effect Effects 0.000 description 1
- 238000001514 detection method Methods 0.000 description 1
- 208000028299 esophageal disease Diseases 0.000 description 1
- 238000011156 evaluation Methods 0.000 description 1
- 238000013213 extrapolation Methods 0.000 description 1
- 239000000835 fiber Substances 0.000 description 1
- 239000012530 fluid Substances 0.000 description 1
- 230000005484 gravity Effects 0.000 description 1
- 238000002847 impedance measurement Methods 0.000 description 1
- 230000000977 initiatory effect Effects 0.000 description 1
- 230000010354 integration Effects 0.000 description 1
- 230000003993 interaction Effects 0.000 description 1
- 229910052740 iodine Inorganic materials 0.000 description 1
- 239000011630 iodine Substances 0.000 description 1
- 230000001788 irregular Effects 0.000 description 1
- 238000000691 measurement method Methods 0.000 description 1
- 230000015654 memory Effects 0.000 description 1
- 239000000203 mixture Substances 0.000 description 1
- 238000009206 nuclear medicine Methods 0.000 description 1
- 238000011017 operating method Methods 0.000 description 1
- 230000001151 other effect Effects 0.000 description 1
- 238000005192 partition Methods 0.000 description 1
- 230000002572 peristaltic effect Effects 0.000 description 1
- 230000002085 persistent effect Effects 0.000 description 1
- 210000003800 pharynx Anatomy 0.000 description 1
- 230000000704 physical effect Effects 0.000 description 1
- 238000002601 radiography Methods 0.000 description 1
- 230000009467 reduction Effects 0.000 description 1
- 238000007670 refining Methods 0.000 description 1
- 230000002441 reversible effect Effects 0.000 description 1
- 239000004065 semiconductor Substances 0.000 description 1
- 239000000758 substrate Substances 0.000 description 1
- 210000001635 urinary tract Anatomy 0.000 description 1
- 210000002229 urogenital system Anatomy 0.000 description 1
- 230000002792 vascular Effects 0.000 description 1
- 230000009278 visceral effect Effects 0.000 description 1
- 238000012800 visualization Methods 0.000 description 1
Images


Classifications
-
- A—HUMAN NECESSITIES
- A61—MEDICAL OR VETERINARY SCIENCE; HYGIENE
- A61B—DIAGNOSIS; SURGERY; IDENTIFICATION
- A61B6/00—Apparatus for radiation diagnosis, e.g. combined with radiation therapy equipment
- A61B6/48—Diagnostic techniques
- A61B6/481—Diagnostic techniques involving the use of contrast agents
-
- A—HUMAN NECESSITIES
- A61—MEDICAL OR VETERINARY SCIENCE; HYGIENE
- A61B—DIAGNOSIS; SURGERY; IDENTIFICATION
- A61B6/00—Apparatus for radiation diagnosis, e.g. combined with radiation therapy equipment
- A61B6/12—Devices for detecting or locating foreign bodies
-
- A—HUMAN NECESSITIES
- A61—MEDICAL OR VETERINARY SCIENCE; HYGIENE
- A61B—DIAGNOSIS; SURGERY; IDENTIFICATION
- A61B90/00—Instruments, implements or accessories specially adapted for surgery or diagnosis and not covered by any of the groups A61B1/00 - A61B50/00, e.g. for luxation treatment or for protecting wound edges
- A61B90/06—Measuring instruments not otherwise provided for
- A61B2090/064—Measuring instruments not otherwise provided for for measuring force, pressure or mechanical tension
-
- A—HUMAN NECESSITIES
- A61—MEDICAL OR VETERINARY SCIENCE; HYGIENE
- A61B—DIAGNOSIS; SURGERY; IDENTIFICATION
- A61B90/00—Instruments, implements or accessories specially adapted for surgery or diagnosis and not covered by any of the groups A61B1/00 - A61B50/00, e.g. for luxation treatment or for protecting wound edges
- A61B90/36—Image-producing devices or illumination devices not otherwise provided for
- A61B2090/364—Correlation of different images or relation of image positions in respect to the body
-
- A—HUMAN NECESSITIES
- A61—MEDICAL OR VETERINARY SCIENCE; HYGIENE
- A61B—DIAGNOSIS; SURGERY; IDENTIFICATION
- A61B5/00—Measuring for diagnostic purposes; Identification of persons
- A61B5/03—Detecting, measuring or recording fluid pressure within the body other than blood pressure, e.g. cerebral pressure; Measuring pressure in body tissues or organs
- A61B5/036—Detecting, measuring or recording fluid pressure within the body other than blood pressure, e.g. cerebral pressure; Measuring pressure in body tissues or organs by means introduced into body tracts
-
- A—HUMAN NECESSITIES
- A61—MEDICAL OR VETERINARY SCIENCE; HYGIENE
- A61B—DIAGNOSIS; SURGERY; IDENTIFICATION
- A61B6/00—Apparatus for radiation diagnosis, e.g. combined with radiation therapy equipment
- A61B6/48—Diagnostic techniques
- A61B6/486—Diagnostic techniques involving generating temporal series of image data
- A61B6/487—Diagnostic techniques involving generating temporal series of image data involving fluoroscopy
-
- A—HUMAN NECESSITIES
- A61—MEDICAL OR VETERINARY SCIENCE; HYGIENE
- A61B—DIAGNOSIS; SURGERY; IDENTIFICATION
- A61B8/00—Diagnosis using ultrasonic, sonic or infrasonic waves
- A61B8/48—Diagnostic techniques
- A61B8/481—Diagnostic techniques involving the use of contrast agent, e.g. microbubbles introduced into the bloodstream
Definitions
- Radiography is frequently used for this purpose, and fluoroscopy is one technology that allows for real time imaging of structures in motion-Fluoroscopic images are formed by measuring the intensity of radiation passing through the patient. The intensity varies with the radiopacity of the imaged region of the patient such that the intensity is representative of the structure of the imaged regions.
- fluoroscopic imaging the intensity of the detected radiation is represented as a visible image. Successive images are captured, each one representing a frame of a video image. Such a video image allows motion of the structures in the region of interest to be observed.
- the video image may be displayed in real time or may be recorded and/or played back on a monitor for analysis after it is captured.
- fluoroscopic imaging is used in real time to aid in the positioning of guadewires or stents in bodily lumens.
- the guidewire or stent may be built with radiopaque markers to absorb or scatter the majority of x-ray radiation such that when imaged, the markers clearly contrast with relatively radiolucent surroundings.
- the markers may be placed at strategic positions in the guidewire or stent, such as the distal end, to enable a technician to easily determine the location of the devices.
- a contrast material may be introduced into the patient to delineate anatomy as part of a study using fluoroscopic imaging.
- the contrast material may reveal functioning of blood vessels, the genitourinary system, or the gastrointestinal (GI) tract, for example.
- GI gastrointestinal
- Known contrast materials include barium, in the form of barium sulfate (BaSO4), which may be administered orally or rectally for GI tract evaluation, and iodine in various proprietary forms. These contrast materials absorb or scatter significant amounts of x-ray radiation and may be used with real time imaging to demonstrate dynamic bodily processes.
- US 2002/0115931 A1 discloses methods and systems for localizing intravascular lesion in a body lumen.
- the methods comprise providing or acquiring an image of the body lumen and displaying information about the lesion with or on the image.
- an intravascular catheter having detectors is percutaneously introduced into the body lumen and advanced to the target region to acquire real time information and/or images of the lesion in the body lumen.
- a contrast medium is released from the catheter to localize the position of the catheter during transit through the body lumen. The released contrast medium opacifies the body lumen and allows fluoroscopic images of the body lumen to be obtained.
- the contrast medium delivered into the body lumen will diffuse over time and image of the opacified body lumen will diffuse over time and the image of the opacified body lumen will be lost. Consequently, the images of the body lumen are saved in a computer memory to create "ghost images" of the body lumen that can later be recalled to create a background for the data obtained by the detectors.
- EP 0 370 636 A1 discloses methods of determining, and apparatus for creating, images representing partition coefficient and/or fluid flow.
- US 2007/0167750 A1 discloses an operating method for an X-ray machine for examining a patient by using a contrast agent to determine a contrast agent curve, wherein a series of attenuation values relating to defined scanning instants are acquired at a set scanning position.
- the contrast agent curve is determined on the basis of the attenuation values, and is stored for a follow-up examination.
- the contrast agent curve can be loaded during a follow-up examination and need not be determined anew, and so a reduction is attained in the contrast agent used, the applied radiation dose and the examination time.
- Esophageal peristalsis refers to the contraction of circular muscles in the esophagus to propel food and drink through the esophagus to the stomach. For a healthy individual, the contractions begin at the upper end of the esophagus and propagate downwardly toward the lower esophageal sphincter (LES). Though, there are medical conditions under which the normal pattern of contractions is interrupted. This conditions include achalasia, dysphagia, diffuse esophageal spasm, ineffective esophageal motility, and hypertensive LES.
- Diagnosis of certain medical conditions may be improved by quantitatively measuring the location and size of contrast material within luminal organs.
- the location and size of the contrast material may be ascertained by processing images made using known medical imaging techniques. Such measurements may be made by identifying fields within a radiographic image representative of regions of the luminal organ. Intensity within the fields may then be used to derive a quantitative indication of the amount of contrast material at locations, corresponding to the fields, along the luminal organ.
- the present invention provides a method of collecting diagnostic data according to appended Claim 1, and a system according to Claim 11.
- Optional features are set out in the dependent claims.
- the fields are identified by introducing into the luminal organ one or more targets detectable in an image.
- the targets are used to define local image fields representing segments along the luminal organ.
- a contrast material e.g., a bolus of suspended barium sulfate within the esophagus during a "barium swallow” study
- the radiographic image intensity in these local image fields indicates the position and approximate amount of the contrast material at locations along the luminal organ.
- the data from one image may be used to display a profile of the material distribution at a given point in time. If data from successive images is collected, the data may be used to generate a spatiotemporal plot showing detected amounts of the material as a function of both position and time.
- Positional information on the bolus may be co-registered with other data relating to the luminal organ and displayed for analysis. For example, pressure data representing muscular contractions may be displayed co-registered with bolus positional information to enhance study of the luminal organ or diagnosis of a patient.
- the inventor has recognized an appreciated that new insights into the physiology and pathophysiology of bodily organs in general and in individual clinical cases may be obtained through analysis and display of medical imaging data. Such insights may be obtained through quantitative measurements of the location and size of contrast material within a luminal organ determined using medical imaging and new image processing and display techniques.
- radiopaque targets may be introduced into the bodily lumen to serve as reference points in the radiographic image.
- the reference points may be used for the construction of local image fields in which the intensity of the image (e.g., brightness, opacity) is measured.
- the image intensity within the fields is indicative of the amount of the contrast material at locations along the lumen.
- Movement of the contrast material may be quantitatively tracked over time from a sequence of radiographic images. Suitable methods for displaying the quantitative measurements enable a quicker and more reliable diagnosis of certain disorders of the luminal organ, such as motility disorders.
- An embodiment of a system for collecting diagnostic data described herein comprises a computing device and a display device.
- the computing device is configured to receive a plurality of radiographic images from a radiographic imaging system, each of the plurality of images representing a region containing a plurality of radiopaque targets and a contrast material, each radiopaque target associated with a location in the radiographic image, and configured to compute a plurality of values from each radiographic image, each value being computed from at least an intensity of the radiographic image in a local image field for a position along a path, the path being based on at least the locations of the plurality of radiopaque targets.
- the display device is configured to display the plurality of values as a function of the position along the path for each of the plurality of radiographic images.
- a computer storage medium comprising computer executable instructions that, when executed on a computer, perform a method of processing diagnostic data using frames from a radiographic imaging system, the frames comprising intensity data indicative of attenuation of radiation passing through a bodily lumen of a patient, the frames being acquired at a plurality of successive times during which a member is present in the lumen, the member comprising a plurality of radiopaque regions identifiable in the frames.
- the method comprises, for each frame, determining within the frame a plurality of fields, each field representing a region around a corresponding radiopaque region of the plurality of radiopaque regions; for each field of the plurality of fields within the frame computing, based on the intensity within the field, a value indicative of a quantity of contrast material in the frame; and associating in computer storage media coupled to the computer the computed value indicative of the quantity with a spatial position along the lumen, the lumen being based on the position of the corresponding radiopaque region along the member.
- radiopaque targets may be fixed along the length of a catheter which is introduced into the bodily lumen.
- a radiographic image may be taken before introduction of the contrast material to determine the background or baseline intensity. Contrast material is then introduced into the lumen and radiographic images are sequentially captured to observe the movement of the contrast material.
- the catheter may also carry sensors that can be used to collect data about the bodily lumen, such as pressure data. This data may be co-registered temporally and spatially with the bolus position information extracted by processing the radiographic image. As a result, the data may be displayed or otherwise processed together.
- the images may then be processed in real time or after the procedure to quantitatively measure the location and size of the contrast material.
- the radiopaque targets may be automatically or manually identified in the image. For example, detection via the shape and contrast of the radiopaque targets may be used as a basis of a suitable identification algorithm.
- a curve may be constructed that connects in sequence a key characteristic of the radiopaque targets (e.g., their image centroids). The curve may then be subdivided into segments and local image fields associated with each segment. In each local image field the intensity in the local image field may be measured by integrating the image intensity within the field.
- the baseline intensity, determined from the baseline radiographic image may be subtracted to enhance the contrast of the contrast material.
- a profile of the contrast material may be constructed from the intensity measurements determined from the local image fields as a function of the position of the local image field along the curve.
- the profiles may then be presented in any suitable way for analysis and diagnosis. For example, the profiles may be individually plotted, animated, or displayed as part of a spatiotemporal plot.
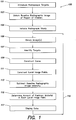
- a method 100 of collecting diagnostic data according to some embodiments is described with reference to the flow chart of FIG. 1 .
- one or more radiopaque targets are introduced into a region of interest, such as a bodily lumen.
- Targets may be made of any suitable material, such as a metal or metal-containing film or compound.
- suitable material such as a metal or metal-containing film or compound.
- the suitability of a material may depend on the energy of radiation used for imaging.
- the targets are made relatively fixed with respect to one another and the lumen.
- the targets may be incorporated along the length of a substrate, such as a catheter used to introduce the targets into the bodily lumen.
- the catheter may contain sensors, which may act as targets.
- targets may be located adjacent to the sensors.
- a catheter may include pressure sensors which also serve as radiopaque targets.
- a baseline image covering a region of interest is taken.
- Any suitable instrument may be used to obtain the radiographic image.
- a radiographic image may be formed using a fluoroscope or any other suitable imaging system.
- the radiographic image may be a monochromatic image.
- the radiographic image may be represented in grayscale, with radiopaque points indicated with black, and radiolucent points indicated with white. In such an image the radiopaque targets will appear as dark portions.
- the baseline radiographic image may be taken before a contrast material is introduced into the lumen such that variations in the image intensity (aside from the radiopaque targets) may be attributed to the properties of the lumen and surrounding bodily structure. This background intensity may stay relatively constant during the radiographic study.
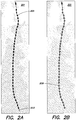
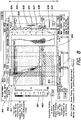
- FIG. 2A is an example of a baseline image 201 acquired in step 103.
- Clearly visible in the example image 201 are a catheter 203 having 36 radiopaque targets 205 positioned inside a bodily lumen.
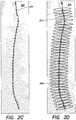
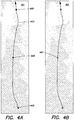
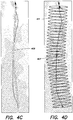
- Another example of a baseline image is shown in FIG. 4A .
- catheter 403 has only 3 targets 405.
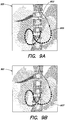
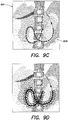
- FIG. 9A Yet another example is shown in FIG. 9A where a catheter 903 and associated targets 905 has assumed a convoluted shape.
- a radiographic study is initiated.
- the study may be conducted as is known in the art, which may include initiating passage of a contrast material through the lumen. If for example, the radiopaque targets have been distributed within the esophagus of a patient, a barium swallow or other suitable bolus may be used.
- a series of radiographic images are taken (step 106), for example, using the same instrument used in step 103.
- the images may be taken sequentially to capture, for example, the movement of the contrast material.
- a suitable fixed frame rate or irregular frame rate may be used. Images may be time stamped to enable proper temporal reconstruction.
- Steps 107, 109, 111, 113, 115, and 117 may be performed for each image in the series. In some embodiments, these steps may be performed in real time. For example, the steps may be pipelined, or performed before returning via return path 119 to step 106 to obtain another image. Alternatively, the steps may be performed at any suitable later time. For example, after the diagnostic procedure has been performed.
- radiographic images are processed post hoc based on stored data. In yet other embodiments, radiographic images are processed during a study and may be processed again post hoc.
- the locations of the radiopaque targets introduced in step 101 are identified (step 107).
- a computer system may be programmed with a suitable algorithm for identifying the targets or configured to permit manual identification.
- a location of a target is generally identified, a key characteristic of the targets may be used to identify a precise position. For example, the position may be defined by the target's image centroid.
- FIG. 2B show an example where the positions of the radiopaque targets 205 in radiographic image 201 are identified with crosshairs 209. Similarly, target positions are identified with crosshairs 407 and 907 as shown in FIGs. 4B and 9B , respectively.
- FIG. 3A provides a method 300 for identifying target locations by raster scan.
- the routine scans one or more rows of the image for changes in image intensity indicative of a radiopaque target.
- the rows being scanned are incremented until all targets are found or the entire image has been scanned.
- the raster scan is initialized and various parameters may be set.
- the parameters may include the image to be scanned, minimum and maximum target diameter, brightness threshold, rows to simultaneously scan, and number of rows per increment.
- a next row(s) e.g., initially the top row or rows
- the image is scanned to identify candidate targets.
- Candidate targets may be identified as those areas corresponding to a change in image intensity, along the scanned row or set of rows, above a specified threshold followed by a change in the reverse direction where the distance between the changes is not greater than the maximum target diameter. If targets are in the row, the target locations are saved (step 305). If there are more rows to investigate (step 307), the rows to be scanned are updated (step 309) and the identification process is repeated (step 303).
- Super candidate target locations may be defined as contiguous candidate locations in adjacent rows.
- the number of adjacent rows in which a candidate target location is present before a target location is identified as a super candidate may be determined in any suitable way. For example, the number of rows may be specified by a user or determined from the target sizes and image resolution.
- the timing at which super candidate locations are identified may be varied. For example, after each sequential row is scanned, the target locations for the row may be analyzed with the target locations from previously scanned rows to identify super candidate target locations.
- the super candidate locations may then be further discriminated in step 311 by a variety of algorithmically implemented constraints including: being not more than the maximum target size, having the candidate target shape (and rotations thereof), having a known target spacing, and lying along a curve consistent with the minimum bend radius of the catheter to which the targets may be attached and/or tubular organ under study.
- those candidate target locations that are not part of super candidate location are not further processed.
- Processing at step 311 may further include refining the target location.
- a key characteristic of a target in combination with the target shape may be used to define the target location. For example, a center of mass calculation may be used to determine the center of each target identified. Additionally, the targets may be ordered for the subsequent forming a curve in step 109 ( FIG. 1 ).
- FIG. 3B provides a method 312 for identifying the targets using a window slightly larger than the maximum target size.
- the routine is initialized and initial parameters such as window position, size, and scan path may be specified.
- initial parameters such as window position, size, and scan path may be specified.
- For each position a determination is made of the presence of a target in the window (step 315). Targets may be recognized for example, by size, contrast, and/or shape. If a target is present, the target position is saved (step 317) and if there is more image to scan (step 319) the window position is incremented (step 323). The process is repeated for each window position until the entire image has been scanned or all targets detected. By making the increment of window movement sufficient small, it can be assured that each target will lie in the window at least once.
- step 321 may be performed to resolve any ambiguities or duplicates in target locations and to order targets as in step 311.
- GUI graphical user interface
- a GUI may be provided for a user to manually identify target locations.
- a GUI may be constructed in which the user simply positions a cursor over each visual is identified target and designates its position (e.g., using a mouse or trackball).
- Such a GUI may also be used to review and correct positions identified automatically.
- a curve is constructed based on the positions of the targets.
- Any suitable curve forming algorithm may be used.
- FIG. 2C provides an example in which a curve 211 is constructed to pass through each of the target locations 209 ( FIG. 2B ).
- a polynomial curve fitting technique may be applied to the array of target positions.
- Some curve forming algorithms may require the sequence (i.e., order) of targets be specified to ensure the fitting algorithm correctly connects sequential targets. The appropriate sequence may be determined, for example, based on a known target spacing along a catheter.
- one suitable algorithm constructs a curve from a series of lines connecting the locations of targets adjacent in the sequence, such as for curve 409 of FIG. 4C .
- Other situations, such as that shown in FIG. 9C may require slightly more sophisticated curve forming algorithm. For example, it is clear from the image 901 that the curve 909 may be correctly resolved by setting a minimum radius of curvature.
- step 111 local image fields are constructed along the curve formed in step 109.
- Each local image field defines a region of the radiographic image within which a measurement of image intensity is made.
- Any suitable technique may be used. Several illustrative examples are provided such that an order resulting in a curve with a radius of curvature less than the minimum may be deemed unlikely and otherwise possible curves may be constructed.
- local image fields are constructed at each target location as in the example shown in FIG. 2D .
- Local image fields 213 are illustrated as ellipses with the major axis of the ellipse normal to the curve 211 centered at the target locations indicated by crosshairs 209.
- any suitable shape or orientation may be used.
- rectangular image fields are defined with centers at the target locations and with a long dimension normal to the curve at the associated target point.
- a different number of targets and local image fields may be desired.
- Local image fields may be associated with points defined along the curve irrespective of the target locations. These points may serve as reference locations for local image fields.
- Radiographic image 401 shown in FIGs. 4A-4D illustrates such an example.
- a suitable number of points are defined along curve 409 ( FIG. 4C ) and a local image field is defined for each point.
- FIG. 4D shows the constructed local image fields 411.
- the local image fields are illustrated as ellipses but here the major axis of each ellipse is normal to the curve at the corresponding reference point rather than a target location.
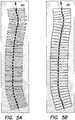
- FIG. 5B illustrates an alternative construction of the local image fields with radiographic image 201, originally introduced in FIG. 2A .
- lines of equal length are centered on and normal to the curve between the target locations.
- the lateral ends of each field are formed by interconnecting the ends of the equal length lines as shown to form closed regions that define local image fields.
- the local image fields in this example have the appearance of a ladder-type structure.
- Each quadrilateral region is the local image field associated with the target location at or near its center. This particular example ensures that all the area within a specified distance from the curve is covered by the fields and that there is no overlap among the fields when the radius of curvature of the curve is sufficiently small (or equivalently the lines perpendicular to the curve are sufficiently short).
- step 113 the baseline intensity, determined from the baseline radiographic image obtained in step 103, is optionally subtracted for each radiographic image.
- the subtraction provides a correction of the baseline offset residual in each image and may enhance the contrast of the contrast material.
- Two example embodiments of step 113 are provided. However, it should be appreciated that step 113 may be performed in any suitable way. The first is described presently, and the second is described after the description of step 115.
- the baseline radiographic image in the entire region of interest is subtracted from each radiographic image in the series.
- the intensity values of each pixel may be subtracted on a pixel by pixel basis.
- the intensity of the image in each local image field is determined in any suitable way.
- the image intensity within the local image field is integrated over the local image field area to determine the field intensity. For example, for a pixilated image the pixel value of all pixels within a given local image field may be summed, the sum representing the field intensity.
- the integral may be weighted by the total area of the local image field, for example, by dividing the integral by the area of the local image field (e.g., the number of pixels in the field). This may be useful, for example, when the local image fields are not of uniform size (e.g., as with the ladder structure).
- the field intensity is indicative of the size of the contrast material in the vicinity of the reference point associated with the local image field.
- step 113 local image fields are defined for the baseline radiographic image in the same way described in step 111, which can be done at any sutiable time, such as during the study, post hoc, or both.
- Baseline field intensities are then determined for each field of the baseline image in the same way described in step 115.
- the baseline field intensities are subtracted from the corresponding field intensities in each of the series of radiographic images.
- FIG. 5C illustrates a resulting intensity profile for an image formed with no contrast material.
- local image fields are formed in the ladder structure as described above.
- plot 510 the baseline field intensity in the local image fields are represented as opacity of the objects in the image. As shown, opacity is plotted as a function of the position along the curve defined at step 109.
- the opacity profile in plot 510 is subtracted from the field intensity profile determined for each image in step 115. This correction reduces the bias in each field's subsequent intensity that results from variations in the baseline image intensity.
- Plot 520 illustrates that in the ideal case, when the baseline is subtracted from intensity values associated with the local image fields of an image containing no contrast material, the opacity profile is zero along the curve.
- a baseline may be determined for an entire image. The baseline may then be subtracted from subsequent frames as they are collected.
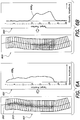
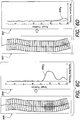
- FIGs. 6A-6D illustrate a series of sequential radiographic images 601, 603, 605, and 607, or frames, of a barium swallow passing through a patient's esophagus. These images have been corrected to cancel the baseline image contribution according to the first example embodiment of step 113. In each of the images, the bolus appears as a darkish blob, and within the blob are noticeable spots at the radiopaque target locations. The bolus clearly appears to advance downwards over the sequence of images. Notice also that a ladder local image field structure is superimposed for illustrative purposes.
- line plots 651, 653, 655, and 657 provide a quantitative indication of the bolus location by determining the opacity within each local image field.
- the ladder structure 213 has been used to define the local image fields at successive intervals in time as a bolus of contrast material moves through a lumen.
- the profiles 659 1 ,..., 659 4 illustrate quantitatively the progression of the bolus down the patient's esophagus.
- plots 651, 653, 655 and 657 are 2-D plots, each indicating quantity as a function of position.
- position is measured along the curve defined at step 109.
- the distance along the curve in this example is determined based on the equally spaced targets that were used to define local image fields.
- the position along the curve may not correlate directly to locations in the image. It may be desirable when analyzing data to view data displayed positionally relative to the curve rather than image coordinates because the curve follows the bodily lumen. In this way, the data may more intuitively represent movement though the bodily lumen. Therefore the plot may provide a depiction of measured data that facilitates understand of the functioning of the bodily lumen.
- the quantitative indication of the amount of contrast material may be an indication of the cross-sectional width of the bolus at each target location.
- a quantitative indication may serve as an indication of volume.
- the quantitative indication be a volume or otherwise have any specific dimensions.
- FIGs. 7A-7D provides analysis of the same dataset using the second example embodiment of step 113.
- the background structure, observed initially in the baseline image 201 ( FIG. 5C ) is recognizable in each of the radiographic images 701, 703, 705, and 707.
- the intensity in the local image fields is determined in each radiographic image and then the baseline intensity, plotted in subfigure 510 of FIG. 5C , is subtracted from the respective field intensity for each image.
- the results are plotted in plots 751, 753, 755, and 757.
- the profile data 759 1 ,..., 759 4 of FIGs. 7A-7D to the respective profile data 659 1 ,..., 659 4 in FIGs. 6A-6D , it is clear that in this example, the results are quite similar using either approach for adjusting for baseline image intensity.
- the process continues in step 117, where the collected data is displayed.
- the display may be rendered by a computer on a display device, though any suitable device may be used.
- the profile data may be displayed in any suitable way.
- the profile data may simply be plotted as a series of line plots as was done in FIGs. 6A-6D and FIGs. 7A-7D .
- the line plots may be superimposed onto a single axis and distinguished using, for example, different colors, patterns, markers, or any suitable combination thereof.
- the line plots are displayed in succession, registered to a common coordinate system so as to appear as an animation or video to a viewer.
- data collected from a series of frames may be collectively displayed on a spatiotemporal plot having a time axis and a spatial axis.
- the time axis may represent the relative time of acquisition of each radiographic image.
- the spatial axis represents the position along the curve with which the field intensity data is associated.
- the field intensity may be represented using color, contour lines, density patterns, or any other suitable representation. In this way a viewer may observe registered data determined from multiple radiographic images simultaneously on a single plot.
- the data representing the specified distribution of the contrast material is combined and co-registered for display with other high-resolution physiological data, such as pressure.
- physiological data such as pressure.
- the relationship between the contrast material position and distribution of the other physiological property can be readily identified and may provide new insight into the physiology and pathophysiology of the organ in general and individual clinical cases in particular.
- FIG. 8 An example of such co-registration of data is shown in FIG. 8 .
- the data is displayed in a user interface that allows a user to manipulate the appearance and presentation of the data.
- FIG. 8 illustrates an embodiment using the ManoViewTM software user interface 800 developed for display and analysis of pressure data along a bodily lumen.
- the profile data indicates the location of a bolus in a patient's upper GI tract in combination with pressure data, which may serve as an indication of muscle contractions in the GI tract.
- the user interface may display the profile data in any suitable way.
- the display may include multiple different representations of the data simultaneously.
- a contour display region 810 and a profile display region 830 are displayed in combination with a radiographic image 820.
- the contour display region 810 provides a spatiotemporal plot of the bolus position and pressure data.
- the spatial axis 840 extends vertically and the time axis 850 extends horizontally.
- the interface may allow a user to manipulate the displayed data with any suitable zoom controller 813, scroll bar 815, or similar display control that may be used to select which portion of the swallow sequence is displayed in embodiments in which the data is displayed after a study is completed.
- Profile display region 830 shows the data at an instant of time. For post-hoc display, that instant of time may be selected by the position of time control 811. For real time data display, the profile plot may display data as it is collected.
- the bolus positional data displayed in the contour display region 810 may be superimposed with other data spatially and temporally co-registered with the axes.
- pressure data is data is presented with the positional data in the contour display region 810.
- the positional or pressure data may have a variable transparency.
- the positional and pressure data may be displayed using different color scales to enable both datasets to be viewed simultaneously on the same set of axes.
- a display scale 891 is provided to indicate the color and/or transparency used to represent pressure data.
- a second display scale 893 is provided to indicate the color and/or transparency used to represent bolus positional data.
- a continuum of colors and/or transparencies are each type of data.
- the interaction of pressure and bolus position may be precisely and intuitively visualized.
- the pressure measurements may be readily correlated positionally to measurement of the quantity of bolus in the vicinity of the targets. Though, other registration approaches are possibly.
- Such a display may facilitate review of data.
- pressure measurement alone, it is not always possible to determine where the bolus is and whether it has cleared properly during a swallow sequence.
- radiographic profile data alone the movement of the bolus is seen, but it is not always possible to identify the degree to which movement or lack thereof is the result of motor function within the organ (such as peristaltic contraction and appropriate contraction or relaxation of sphincter muscles) or of other effects such as gravity or structural effects.
- motor function physiological pressure
- the profile display region 830 in the example user interface 800 provides a line plot 831 of the bolus profile. Also shown is a pressure profile 837 which may be measured using sensors correlated positionally to the radiopaque targets.
- the contour plot and the profile plots may be displayed so that the position axis 840 of the profile display region 830 may be registered with the position axis of contour display region 810.
- the profile display region 830 may be configured to display the bolus profile 831 at the time on the time axis 850 indicated by the time bar 811.
- the user interface 800 also may be configured to display a radiographic image 820 from which the bolus profile 831 is determined. The radiographic image may be displayed after subtraction of the baseline image; without baseline correction; with or without the local image fields, target locations, or curve superimposed; or in any other suitable way.
- an illustration of anatomy of the region where measurements were taken may be shown along with the data.
- the measurement data is collected along the upper gastrointestinal (GI) tract.
- a reference rendering 835 of the anatomy of that region of the body is shown as part of the profile display region 830.
- the reference rendering 835 may have a number of reference features to clearly illustrate the position of the measurement data relative to important features of the surrounding area.
- the reference features may include the pharynx 832, upper esophageal sphincter (UES), esophagus 836, lower esophageal sphincter (LES), stomach 839, and the like.
- a user interface 800 presenting an illustration of anatomy may have one or more landmarks, such as landmarks 834 and 838 corresponding to the UES and LES respectively.
- the landmarks may act as control features, allowing a user or computer processing to specify the location of the certain portions of the anatomy relative to the axis 840 based on displayed pressure data.
- a user for example, could position these landmarks based portions of the pressure data showing relatively high pressure associated with sphincter activity.
- the computer may adjust the illustration of the anatomy by scaling and positioning it relative to spatial axis 840 for the specific situation, e.g., patients of different sizes.
- Method 100 has been described by reference to a radiographic imaging system according to an embodiment of the present invention, which uses radiopaque targets and a suitable contrast material.
- a radiographic imaging system which uses radiopaque targets and a suitable contrast material.
- an ultrasonic imaging system may be used.
- suitable targets and contrast material may be of sufficient density to appear with high contrast in the ultrasonic image.
- radionuclide imaging techniques known from nuclear medicine may be used.
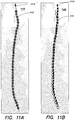
- the catheter may move during the course of a radiographic study.
- FIG. 11 shows an example of the catheter moving during the course of the radiographic study.
- the target locations 1111 initially identified from radiographic image 1110 are no longer accurate with respect to radiographic image 1120.
- the movement may be tracked and the target locations relative to the image frames may be adjusted dynamically. Tracking such movement and repositioning the local fields dynamically may be complicated by the fact that the radiopaque contrast media may obscure the targets at some times. Processing images based on target locations when some targets are not observable may be achieved in several ways. For example, targets that remain visible during passage of the contrast material may be tracked and the position of the obscured targets and fields estimated by interpolation or extrapolation.
- the targets may be re-identified after passage of the material (e.g., between swallows in a barium swallow study) and the location and orientation of the resulting local image fields established.
- the local image fields may then be made mobile by interpolating their positions and orientations in time between their initial positions and orientations and their re-established positions and orientations.
- FIG. 10 illustrates a system 1000 according to some embodiments.
- the system 1000 has one or more targets 1011 positioned in a region of interest 1010, an imaging system 1020, a computing device 1030, and a display 1040.
- a commercially available medical imaging system may be used, but any imaging system 1020 suitable for imaging the region of interest 1010 may be used.
- the targets 1011 are of suitable size, shape, and material composition so as to be detected by imaging system 1020 and identifiable as targets once imaged.
- the imaging system 1020 may image the region of interest prior to the introduction of a contrast material to establish a baseline image. Once a suitable contrast material is introduced into the region of interest 1010, the imaging system may be configured to acquire a series of images.
- the computing device 1030 may be of a type known in the art for processing medical image data, and may be operably connected to the imaging system 1020 to receive the series of images in real time or any subsequent time.
- the computing device 1030 may be configured to perform steps of method 100 using computer-executable modules stored in a computer storage medium 1037 of the device and executed by a suitable processor 1038.
- the computing device may have a target identification module 1031 for identifying target locations in each image.
- a user interface module 1036 may be provided for a user to manually designate target positions.
- a curve generation module 1032 may be used to generate a suitable curve.
- An image field generation module 1033 may be used to generate the local image fields using the curve and/or target location information.
- a baseline correction module 1034 may optionally be used to cancel the contribution of the baseline image.
- a field intensity integration module 1035 may be used to determine the field intensity in local image fields.
- a user interface module 1036 may be configured to output the data for display on display 1040. Any suitable display technique may be used.
- some embodiments enable a physician to rapidly and quantitatively assess transit of the contrast material through a bodily lumen.
- the physician can simply scroll through temporal plots of the resulting data (e.g. a temporally continuous contour plot) and obtain a complete representation of the bolus movement without needing to take the time to watch each swallow as a video.
- a physician may be able to observe and diagnose abnormalities indicative of esophageal diseases such as achalasia, dysphagia, diffuse esophageal spasm, ineffective esophageal motility, and hypertensive LES.
- a physician may reliably identify lumenal obstructions (e.g., structural effects such as strictures) via persistent low bolus signal throughout a swallow sequence.
- bolus position information is just one example of a mechanism by which the information can be reviewed.
- the quantitative positional information can be displayed on a contour plot, which allows a quantitative history of bolus position during a swallow study or other procedure to be viewed in a single image.
- conventional approaches required the reviewer to watch a video of the swallow and combine in his imagination the salient features of the swallow to make a determination of normalcy or pathology.
- the quantitative information allows, in certain pathologies, landmarks (e.g. UES and LES) to be more easily identified in one modality (e.g. pressure or fluoroscopy or other radiographic image) versus the other.
- one modality e.g. pressure or fluoroscopy or other radiographic image
- the landmarks may be identified in whichever modality is most suitable and that information can help interpret the results of the modality in which the landmark may not be reliably identified.
- bolus position data obtained according to method 100 provides a reliable, quantitative indication of, for example, bolus movement.
- bolus measurement methods only provided qualitative measurement of bolus movement leaving ambiguity in the determination of swallow performance. For example, ambiguity exists in multichannel intraluminal impedance measurements as to whether sufficient bolus has cleared the lumen, whether the bolus substantially remains in the lumen, or whether meaningful "bolus escape" (i.e., retrograde flow) has occurred.
- intensity measurements obtained from changes in the local image fields may be displayed using techniques other than profile or spatiotemporal contour plots.
- the local image fields may be specified post hoc and the changes measured over time therein used to generate a spatiotemporal data set describing the contrasted media movement over time.
- the method may be applied to other areas than the esophagus and outside the GI tract in general.
- it may be employed in the urinary tract, vascular network, and other visceral systems in which mobile material may be imaged and a target device may be introduced.
- embodiments are described in which quantitative information about position of contrast material is derived by constructing fields based on locations of targets in a radiographic image.
- Other approaches for constructing fields are possible, including using the image of the contrast material to define the fields.
- a barium swallow fluoroscopic study could be reviewed and landmarks along the lumen identified, either manually by a reviewer or using computer analysis, via their radiographic signatures (e.g. constriction of the barium bolus image at a sphincter).
- a line or curve could then be constructed along the axis of the lumen image by identifying the path of the contrast material as it transits through the lumen.
- Multiple local image fields constructed along this line or curve. Once lical fields are constructed, the change in intensity in those local fields can be measured as it is in the case where radiopaque markers are introduced.
- a computer may be embodied in any of a number of forms, such as a rack-mounted computer, a desktop computer, a laptop computer, or a tablet computer. Additionally, a computer may be embedded in a device not generally regarded as a computer but with suitable processing capabilities, including a Personal Digital Assistant (PDA), a smart phone or any other suitable portable or fixed electronic device.
- PDA Personal Digital Assistant
- a computer may have one or more input and output devices. These devices can be used, among other things, to present a user interface. Examples of output devices that can be used to provide a user interface include pointers or display screens for visual presentation of output and speakers or other sound generating devices for audible presentation of output. Examples of input devices that can be used for a user interface include keyboards, and pointing devices, such as mice, touch pads, and digitizing tablets. As another example, a computer may receive input information through speech recognition or in other audible format.
- Such computers may be interconnected by one or more networks in any suitable form, including as a local area network or a wide area network, such as an enterprise network or the Internet.
- networks may be based on any suitable technology and may operate according to any suitable protocol and may include wireless networks, wired networks or fiber optic networks.
- the various methods or processes outlined herein may be coded as software that is executable on one or more processors that employ any one of a variety of operating systems or platform. Additionally, such software may be written using any of a number of suitable programming languages and/or programming or scripting tools, and also may be compiled as executable machine language code or intermediate code that is executed on a framework or virtual machine.
- a computer readable medium (or multiple computer readable media) (e.g., a computer memory, one or more floppy discs, compact discs, optimal discs, magnetic tapes, flash memories, circuit configurations in Field Programmable Gate Arrays or other semiconductor devices, or other tangible computer storage medium) encoded with one or more programs that, when executed on one or more computers or other processors, perform methods that implement the various embodiments of the invention discussed above.
- the computer readable medium or media can be transportable, such that the program or programs stored thereon can be loaded onto one or more different computers or other processors to implement various processes as discussed above.
- program or “software” are used herein in a generic sense to refer to any type of computer code or set of computer-executable instructions that can be employer to program a computer or other processor to implement various processes discussed above. Additionally, it should be appreciated that according to one aspect of this embodiment, one or more computer programs that when executed perform methods of the present invention need not reside on a single computer or processor, but may be distributed in a modular fashion amongst a number of different computers or processors.
- Computer-executable instructions may be in many forms, such as program modules, executed by one or more computers or other devices.
- program modules include routines, programs, objects, components, data structures, etc. that perform particular tasks or implement particular abstract data types.
- functionality of the program modules may be combined or distributed as desired in various embodiments.
- data structures may be stored in computer-readable media in any suitable form.
- data structures may be shown to have fields that are related through location in the data structure. Such relationships may likewise be achieved by assigning storage for the fields with locations in a computer-readable medium that conveys relationship between the fields.
- any suitable mechanism may be used to establish a relationship between information in fields of a data structure, including through the use of pointers, tags or other mechanisms that establish relationship between data elements.
- the invention may be embodied as a method, of which an example has been provided.
- the acts performed as part of the method may be ordered in any suitable way. Accordingly, embodiments may be constructed in which acts are performed in an order different than illustrated, which may include performing some acts simultaneously, even though shown as sequential acts in illustrative embodiments.
Applications Claiming Priority (2)
| Application Number | Priority Date | Filing Date | Title |
|---|---|---|---|
| US99852607P | 2007-10-11 | 2007-10-11 | |
| PCT/US2008/011666 WO2009048617A2 (en) | 2007-10-11 | 2008-10-10 | Method of measuring and displaying the position of a radiographically contrasted material within luminal body organs |
Publications (3)
| Publication Number | Publication Date |
|---|---|
| EP2207481A2 EP2207481A2 (en) | 2010-07-21 |
| EP2207481A4 EP2207481A4 (en) | 2011-05-11 |
| EP2207481B1 true EP2207481B1 (en) | 2017-11-29 |
Family
ID=40549782
Family Applications (1)
| Application Number | Title | Priority Date | Filing Date |
|---|---|---|---|
| EP08837148.9A Active EP2207481B1 (en) | 2007-10-11 | 2008-10-10 | Method of measuring and displaying the position of a radiographically contrasted material within luminal body organs |
Country Status (6)
| Country | Link |
|---|---|
| US (1) | US8306604B2 (ja) |
| EP (1) | EP2207481B1 (ja) |
| JP (2) | JP5513394B2 (ja) |
| CN (1) | CN101868182B (ja) |
| CA (1) | CA2702347A1 (ja) |
| WO (1) | WO2009048617A2 (ja) |
Families Citing this family (20)
| Publication number | Priority date | Publication date | Assignee | Title |
|---|---|---|---|---|
| KR100954989B1 (ko) * | 2006-10-18 | 2010-04-30 | 주식회사 메디슨 | 대상체의 크기를 측정하기 위한 초음파 진단 장치 및 방법 |
| US8306290B2 (en) * | 2007-04-20 | 2012-11-06 | Sierra Scientific Instruments, Llc | Diagnostic system for display of high-resolution physiological data of multiple properties |
| JP5561578B2 (ja) * | 2009-08-03 | 2014-07-30 | 国立大学法人名古屋大学 | 医用画像観察支援装置 |
| EP2544589A2 (en) | 2010-03-12 | 2013-01-16 | Wellsense Technologies Ltd | System and method for rapid data collection from pressure sensors in a pressure sensing system |
| CA2827897A1 (en) * | 2011-02-24 | 2012-08-30 | Enhanced Surface Dynamics, Inc. | Pressure monitoring system and method |
| JP2014521082A (ja) | 2011-07-13 | 2014-08-25 | エンハンスド サーフェイス ダイナミクス,インコーポレイテッド | 圧力検出マットの製造及び初期化の方法及びシステム |
| EP2830485B1 (en) * | 2012-03-27 | 2021-03-10 | Koninklijke Philips N.V. | Integration delayed optical feedback in image guidance |
| EP2846688A4 (en) * | 2012-05-08 | 2015-09-23 | Angiometrix Corp | LINEAR MAPPING SYSTEMS OF LIGHTS |
| WO2013190557A2 (en) * | 2012-06-21 | 2013-12-27 | Given Imaging Ltd. | System and method for spatiotemporally synchronizing and displaying bodily organ images and physiological parameter(s) related thereto |
| JP6308728B2 (ja) * | 2013-06-18 | 2018-04-11 | キヤノン株式会社 | 放射線撮影システム及び放射線撮影システムの作動方法 |
| DE102013214388B4 (de) * | 2013-07-23 | 2023-04-20 | Siemens Healthcare Gmbh | Medizinisches Instrument zur Verwendung mit einer Phasenkontrastbildgebung und Röntgenaufnahmesystem mit Phasenkontrastbildgebung |
| WO2015107963A1 (ja) * | 2014-01-15 | 2015-07-23 | 株式会社 日立メディコ | X線ct装置及び造影撮影方法 |
| JP5889495B2 (ja) * | 2014-02-14 | 2016-03-22 | オリンパス株式会社 | 内視鏡システム |
| US9767559B1 (en) * | 2014-03-27 | 2017-09-19 | Given Imaging Ltd. | System and method for reconstructing sensor locations in radiographic images |
| US11083418B2 (en) | 2016-11-04 | 2021-08-10 | Wellsense, Inc. | Patient visualization system |
| US10492734B2 (en) | 2016-11-04 | 2019-12-03 | Wellsense, Inc. | Patient visualization system |
| US11730395B2 (en) | 2017-01-12 | 2023-08-22 | Navix International Limited | Reconstruction of an anatomical structure from intrabody measurements |
| CN111050641B (zh) * | 2017-08-17 | 2023-06-09 | 纳维斯国际有限公司 | 基于场梯度的远程成像 |
| WO2020087000A1 (en) * | 2018-10-26 | 2020-04-30 | Adventist Health System/Sunbelt, Inc. | Intravascular ultrasound catheter systems |
| US11707242B2 (en) * | 2019-01-11 | 2023-07-25 | Pie Medical Imaging B.V. | Methods and systems for dynamic coronary roadmapping |
Citations (1)
| Publication number | Priority date | Publication date | Assignee | Title |
|---|---|---|---|---|
| US5150292A (en) * | 1989-10-27 | 1992-09-22 | Arch Development Corporation | Method and system for determination of instantaneous and average blood flow rates from digital angiograms |
Family Cites Families (43)
| Publication number | Priority date | Publication date | Assignee | Title |
|---|---|---|---|---|
| US3608061A (en) * | 1968-08-21 | 1971-09-21 | Edmund F Mcnally | Radiopaque esophageal marshmallow bolus |
| US4850351A (en) * | 1985-05-22 | 1989-07-25 | C. R. Bard, Inc. | Wire guided laser catheter |
| US5045071A (en) * | 1985-12-17 | 1991-09-03 | Mbo Laboratories, Inc. | Double wall catheter with internal printing and embedded marker |
| US4930510A (en) * | 1986-11-24 | 1990-06-05 | Picker International, Inc. | Parameterization for CT blood flow mapping with xenon gas enhancement |
| JPH02136126A (ja) * | 1988-11-17 | 1990-05-24 | Kobayashi Pharmaceut Co Ltd | 胃食道用カテーテル |
| US5024240A (en) * | 1989-01-03 | 1991-06-18 | Mcconnel Fred M S | Manofluorography system, method for forming a manofluorogram and method for preparing a swallowing profile |
| US5209730A (en) * | 1989-12-19 | 1993-05-11 | Scimed Life Systems, Inc. | Method for placement of a balloon dilatation catheter across a stenosis and apparatus therefor |
| EP0581866B1 (en) * | 1991-04-24 | 1998-03-04 | Baxter International Inc. | Exchangeable integrated-wire balloon catheter |
| US5239982A (en) * | 1991-06-07 | 1993-08-31 | Baxter International Inc. | Catheter depth gauge and method of use |
| US5263928A (en) * | 1991-06-14 | 1993-11-23 | Baxter International Inc. | Catheter and endoscope assembly and method of use |
| US5419324A (en) * | 1993-11-24 | 1995-05-30 | Endovascular Technologies, Inc. | Radiological marker board with movable indicators |
| US5411016A (en) * | 1994-02-22 | 1995-05-02 | Scimed Life Systems, Inc. | Intravascular balloon catheter for use in combination with an angioscope |
| US5606981A (en) * | 1994-03-11 | 1997-03-04 | C. R. Bard, Inc. | Catheter guidewire with radiopaque markers |
| US5571093A (en) * | 1994-09-21 | 1996-11-05 | Cruz; Cosme | Multiple-lumen catheter |
| EP0723786A1 (en) * | 1995-01-30 | 1996-07-31 | Cardiovascular Concepts, Inc. | Lesion measurement catheter and method |
| US5678563A (en) * | 1995-11-16 | 1997-10-21 | Addington; W. Robert | Aspiration screening process for assessing need for modified barium swallow study |
| US5968068A (en) * | 1996-09-12 | 1999-10-19 | Baxter International Inc. | Endovascular delivery system |
| US5921971A (en) * | 1996-09-13 | 1999-07-13 | Boston Scientific Corporation | Single operator exchange biliary catheter |
| US6036682A (en) * | 1997-12-02 | 2000-03-14 | Scimed Life Systems, Inc. | Catheter having a plurality of integral radiopaque bands |
| US6796976B1 (en) * | 1998-03-06 | 2004-09-28 | Scimed Life Systems, Inc. | Establishing access to the body |
| US6210338B1 (en) * | 1998-08-21 | 2001-04-03 | Aga Medical Corp. | Sizing catheter for measuring cardiovascular structures |
| US6278767B1 (en) * | 1999-04-28 | 2001-08-21 | General Electric Company | Methods for measuring curved distances on 3D and MIP images |
| US8442618B2 (en) * | 1999-05-18 | 2013-05-14 | Mediguide Ltd. | Method and system for delivering a medical device to a selected position within a lumen |
| US6233476B1 (en) * | 1999-05-18 | 2001-05-15 | Mediguide Ltd. | Medical positioning system |
| US7778688B2 (en) * | 1999-05-18 | 2010-08-17 | MediGuide, Ltd. | System and method for delivering a stent to a selected position within a lumen |
| US6540774B1 (en) * | 1999-08-31 | 2003-04-01 | Advanced Cardiovascular Systems, Inc. | Stent design with end rings having enhanced strength and radiopacity |
| JP2001149360A (ja) * | 1999-11-25 | 2001-06-05 | Toshiba Corp | X線診断装置 |
| US6856827B2 (en) * | 2000-04-28 | 2005-02-15 | Ge Medical Systems Global Technology Company, Llc | Fluoroscopic tracking and visualization system |
| US7228165B1 (en) * | 2000-06-26 | 2007-06-05 | Boston Scientific Scimed, Inc. | Apparatus and method for performing a tissue resection procedure |
| US20020115931A1 (en) * | 2001-02-21 | 2002-08-22 | Strauss H. William | Localizing intravascular lesions on anatomic images |
| US20030088195A1 (en) * | 2001-11-02 | 2003-05-08 | Vardi Gil M | Guidewire having measurement indicia |
| US7056319B2 (en) * | 2001-12-04 | 2006-06-06 | Wilson-Cook Medical, Inc. | Sphincterotome and manometry catheter |
| CA2485490A1 (en) * | 2002-05-17 | 2003-11-27 | Vincent B. Ho | Respiratory referenced imaging |
| US7004176B2 (en) * | 2003-10-17 | 2006-02-28 | Edwards Lifesciences Ag | Heart valve leaflet locator |
| US7553323B1 (en) * | 2004-01-08 | 2009-06-30 | Perez Juan I | Steerable endovascular graft delivery system |
| JP2005291945A (ja) * | 2004-03-31 | 2005-10-20 | Masaki Esashi | センサ装置 |
| US20060190024A1 (en) * | 2005-02-24 | 2006-08-24 | Bei Nianjiong | Recovery catheter apparatus and method |
| CN102225023B (zh) * | 2005-07-21 | 2014-04-02 | 泰科医疗集团有限合伙公司 | 治疗中空解剖结构的系统和方法 |
| JP2007044418A (ja) * | 2005-08-12 | 2007-02-22 | Hitachi Medical Corp | 診断画像処理方法、画像診断装置及び診断画像処理プログラム |
| US7970187B2 (en) * | 2005-09-06 | 2011-06-28 | Pie Medical Imaging B.V. | Method, apparatus and computer program for contour detection of vessels using x-ray densitometry |
| DE102006055167A1 (de) * | 2005-12-23 | 2007-07-05 | Siemens Ag | Betriebsverfahren für eine Röntgeneinrichtung zur Untersuchung eines Patienten unter Einsatz eines Kontrastmittels |
| US8273016B2 (en) * | 2006-03-10 | 2012-09-25 | Biosense Webster, Inc. | Esophagus isolation device |
| US20080097249A1 (en) * | 2006-10-20 | 2008-04-24 | Ellipse Technologies, Inc. | External sensing system for gastric restriction devices |
-
2008
- 2008-10-10 US US12/249,805 patent/US8306604B2/en active Active
- 2008-10-10 JP JP2010528898A patent/JP5513394B2/ja active Active
- 2008-10-10 CA CA2702347A patent/CA2702347A1/en not_active Abandoned
- 2008-10-10 CN CN2008801176634A patent/CN101868182B/zh active Active
- 2008-10-10 WO PCT/US2008/011666 patent/WO2009048617A2/en active Application Filing
- 2008-10-10 EP EP08837148.9A patent/EP2207481B1/en active Active
-
2014
- 2014-03-26 JP JP2014064054A patent/JP5832573B2/ja active Active
Patent Citations (1)
| Publication number | Priority date | Publication date | Assignee | Title |
|---|---|---|---|---|
| US5150292A (en) * | 1989-10-27 | 1992-09-22 | Arch Development Corporation | Method and system for determination of instantaneous and average blood flow rates from digital angiograms |
Also Published As
| Publication number | Publication date |
|---|---|
| EP2207481A2 (en) | 2010-07-21 |
| EP2207481A4 (en) | 2011-05-11 |
| CA2702347A1 (en) | 2009-04-16 |
| JP5832573B2 (ja) | 2015-12-16 |
| JP2014158932A (ja) | 2014-09-04 |
| CN101868182A (zh) | 2010-10-20 |
| WO2009048617A2 (en) | 2009-04-16 |
| CN101868182B (zh) | 2012-12-05 |
| US8306604B2 (en) | 2012-11-06 |
| JP5513394B2 (ja) | 2014-06-04 |
| WO2009048617A9 (en) | 2009-07-16 |
| JP2011500147A (ja) | 2011-01-06 |
| US20090257554A1 (en) | 2009-10-15 |
| WO2009048617A3 (en) | 2009-06-04 |
Similar Documents
| Publication | Publication Date | Title |
|---|---|---|
| EP2207481B1 (en) | Method of measuring and displaying the position of a radiographically contrasted material within luminal body organs | |
| US11523782B2 (en) | Guidance system for localization and cannulation of the coronary sinus | |
| JP6789944B2 (ja) | インタラクティブな心臓テストデータならびに関連するデバイス、システム、及び方法 | |
| US8079965B2 (en) | System for displaying esophageal function | |
| EP3403582B1 (en) | Method and apparatus for determining blood velocity in x-ray angiography images | |
| US8306290B2 (en) | Diagnostic system for display of high-resolution physiological data of multiple properties | |
| CN105228518B (zh) | 用于诊断冠状微脉管疾病的系统和方法 | |
| JP2022517581A (ja) | 冠動脈の動的ロードマップを提供するための方法およびシステム | |
| US11191423B1 (en) | Endoscopic system and methods having real-time medical imaging | |
| US7819824B2 (en) | Method and a dual-array transducer probe for real time mechanical imaging of prostate | |
| US7922674B2 (en) | Method and device for real time mechanical imaging of prostate | |
| CN106489152A (zh) | 在存在医学设备的情况下的图像分析 | |
| US10143416B2 (en) | Quantitation and display of impedance data for estimating gastroenterology tract parameters | |
| JP2015509026A (ja) | 生体内画像ストリーム中の運動性事象を表示するためのシステムおよび方法 | |
| US20180110491A1 (en) | Dynamic image processor | |
| US10827995B2 (en) | System and method for spatiotemporally synchronizing and displaying bodily organ images and physiological parameter(s) related thereto | |
| JP7073661B2 (ja) | 動態解析装置及び動態解析システム | |
| Pervez | CHARACTERIZATION OF CYCLIC MOTOR PATTERNS AND HAUSTRAL ACTIVITIES IN THE HUMAN COLON BY HIGH-RESOLUTION MANOMETRY | |
| CN109478240A (zh) | 自动图像特征移除 |
Legal Events
| Date | Code | Title | Description |
|---|---|---|---|
| PUAI | Public reference made under article 153(3) epc to a published international application that has entered the european phase |
Free format text: ORIGINAL CODE: 0009012 |
|
| 17P | Request for examination filed |
Effective date: 20100428 |
|
| AK | Designated contracting states |
Kind code of ref document: A2 Designated state(s): AT BE BG CH CY CZ DE DK EE ES FI FR GB GR HR HU IE IS IT LI LT LU LV MC MT NL NO PL PT RO SE SI SK TR |
|
| AX | Request for extension of the european patent |
Extension state: AL BA MK RS |
|
| A4 | Supplementary search report drawn up and despatched |
Effective date: 20110407 |
|
| RAP1 | Party data changed (applicant data changed or rights of an application transferred) |
Owner name: SIERRA SCIENTIFIC INSTRUMENTS, LLC |
|
| DAX | Request for extension of the european patent (deleted) | ||
| RAP1 | Party data changed (applicant data changed or rights of an application transferred) |
Owner name: GIVEN IMAGING (LOS ANGELES) LLC |
|
| 17Q | First examination report despatched |
Effective date: 20131002 |
|
| GRAP | Despatch of communication of intention to grant a patent |
Free format text: ORIGINAL CODE: EPIDOSNIGR1 |
|
| INTG | Intention to grant announced |
Effective date: 20170523 |
|
| GRAS | Grant fee paid |
Free format text: ORIGINAL CODE: EPIDOSNIGR3 |
|
| RAP1 | Party data changed (applicant data changed or rights of an application transferred) |
Owner name: COVIDIEN LP |
|
| GRAA | (expected) grant |
Free format text: ORIGINAL CODE: 0009210 |
|
| AK | Designated contracting states |
Kind code of ref document: B1 Designated state(s): AT BE BG CH CY CZ DE DK EE ES FI FR GB GR HR HU IE IS IT LI LT LU LV MC MT NL NO PL PT RO SE SI SK TR |
|
| REG | Reference to a national code |
Ref country code: GB Ref legal event code: FG4D |
|
| REG | Reference to a national code |
Ref country code: CH Ref legal event code: EP |
|
| REG | Reference to a national code |
Ref country code: AT Ref legal event code: REF Ref document number: 949635 Country of ref document: AT Kind code of ref document: T Effective date: 20171215 |
|
| REG | Reference to a national code |
Ref country code: IE Ref legal event code: FG4D |
|
| REG | Reference to a national code |
Ref country code: DE Ref legal event code: R096 Ref document number: 602008053198 Country of ref document: DE |
|
| REG | Reference to a national code |
Ref country code: NL Ref legal event code: MP Effective date: 20171129 |
|
| REG | Reference to a national code |
Ref country code: LT Ref legal event code: MG4D |
|
| REG | Reference to a national code |
Ref country code: AT Ref legal event code: MK05 Ref document number: 949635 Country of ref document: AT Kind code of ref document: T Effective date: 20171129 |
|
| PG25 | Lapsed in a contracting state [announced via postgrant information from national office to epo] |
Ref country code: NO Free format text: LAPSE BECAUSE OF FAILURE TO SUBMIT A TRANSLATION OF THE DESCRIPTION OR TO PAY THE FEE WITHIN THE PRESCRIBED TIME-LIMIT Effective date: 20180228 Ref country code: ES Free format text: LAPSE BECAUSE OF FAILURE TO SUBMIT A TRANSLATION OF THE DESCRIPTION OR TO PAY THE FEE WITHIN THE PRESCRIBED TIME-LIMIT Effective date: 20171129 Ref country code: FI Free format text: LAPSE BECAUSE OF FAILURE TO SUBMIT A TRANSLATION OF THE DESCRIPTION OR TO PAY THE FEE WITHIN THE PRESCRIBED TIME-LIMIT Effective date: 20171129 Ref country code: LT Free format text: LAPSE BECAUSE OF FAILURE TO SUBMIT A TRANSLATION OF THE DESCRIPTION OR TO PAY THE FEE WITHIN THE PRESCRIBED TIME-LIMIT Effective date: 20171129 Ref country code: SE Free format text: LAPSE BECAUSE OF FAILURE TO SUBMIT A TRANSLATION OF THE DESCRIPTION OR TO PAY THE FEE WITHIN THE PRESCRIBED TIME-LIMIT Effective date: 20171129 |
|
| PG25 | Lapsed in a contracting state [announced via postgrant information from national office to epo] |
Ref country code: LV Free format text: LAPSE BECAUSE OF FAILURE TO SUBMIT A TRANSLATION OF THE DESCRIPTION OR TO PAY THE FEE WITHIN THE PRESCRIBED TIME-LIMIT Effective date: 20171129 Ref country code: GR Free format text: LAPSE BECAUSE OF FAILURE TO SUBMIT A TRANSLATION OF THE DESCRIPTION OR TO PAY THE FEE WITHIN THE PRESCRIBED TIME-LIMIT Effective date: 20180301 Ref country code: HR Free format text: LAPSE BECAUSE OF FAILURE TO SUBMIT A TRANSLATION OF THE DESCRIPTION OR TO PAY THE FEE WITHIN THE PRESCRIBED TIME-LIMIT Effective date: 20171129 Ref country code: AT Free format text: LAPSE BECAUSE OF FAILURE TO SUBMIT A TRANSLATION OF THE DESCRIPTION OR TO PAY THE FEE WITHIN THE PRESCRIBED TIME-LIMIT Effective date: 20171129 Ref country code: BG Free format text: LAPSE BECAUSE OF FAILURE TO SUBMIT A TRANSLATION OF THE DESCRIPTION OR TO PAY THE FEE WITHIN THE PRESCRIBED TIME-LIMIT Effective date: 20180228 |
|
| PG25 | Lapsed in a contracting state [announced via postgrant information from national office to epo] |
Ref country code: NL Free format text: LAPSE BECAUSE OF FAILURE TO SUBMIT A TRANSLATION OF THE DESCRIPTION OR TO PAY THE FEE WITHIN THE PRESCRIBED TIME-LIMIT Effective date: 20171129 |
|
| PG25 | Lapsed in a contracting state [announced via postgrant information from national office to epo] |
Ref country code: CZ Free format text: LAPSE BECAUSE OF FAILURE TO SUBMIT A TRANSLATION OF THE DESCRIPTION OR TO PAY THE FEE WITHIN THE PRESCRIBED TIME-LIMIT Effective date: 20171129 Ref country code: SK Free format text: LAPSE BECAUSE OF FAILURE TO SUBMIT A TRANSLATION OF THE DESCRIPTION OR TO PAY THE FEE WITHIN THE PRESCRIBED TIME-LIMIT Effective date: 20171129 Ref country code: CY Free format text: LAPSE BECAUSE OF FAILURE TO SUBMIT A TRANSLATION OF THE DESCRIPTION OR TO PAY THE FEE WITHIN THE PRESCRIBED TIME-LIMIT Effective date: 20171129 Ref country code: EE Free format text: LAPSE BECAUSE OF FAILURE TO SUBMIT A TRANSLATION OF THE DESCRIPTION OR TO PAY THE FEE WITHIN THE PRESCRIBED TIME-LIMIT Effective date: 20171129 Ref country code: DK Free format text: LAPSE BECAUSE OF FAILURE TO SUBMIT A TRANSLATION OF THE DESCRIPTION OR TO PAY THE FEE WITHIN THE PRESCRIBED TIME-LIMIT Effective date: 20171129 |
|
| REG | Reference to a national code |
Ref country code: DE Ref legal event code: R097 Ref document number: 602008053198 Country of ref document: DE |
|
| PG25 | Lapsed in a contracting state [announced via postgrant information from national office to epo] |
Ref country code: RO Free format text: LAPSE BECAUSE OF FAILURE TO SUBMIT A TRANSLATION OF THE DESCRIPTION OR TO PAY THE FEE WITHIN THE PRESCRIBED TIME-LIMIT Effective date: 20171129 Ref country code: IT Free format text: LAPSE BECAUSE OF FAILURE TO SUBMIT A TRANSLATION OF THE DESCRIPTION OR TO PAY THE FEE WITHIN THE PRESCRIBED TIME-LIMIT Effective date: 20171129 Ref country code: PL Free format text: LAPSE BECAUSE OF FAILURE TO SUBMIT A TRANSLATION OF THE DESCRIPTION OR TO PAY THE FEE WITHIN THE PRESCRIBED TIME-LIMIT Effective date: 20171129 |
|
| REG | Reference to a national code |
Ref country code: FR Ref legal event code: PLFP Year of fee payment: 11 |
|
| PLBE | No opposition filed within time limit |
Free format text: ORIGINAL CODE: 0009261 |
|
| STAA | Information on the status of an ep patent application or granted ep patent |
Free format text: STATUS: NO OPPOSITION FILED WITHIN TIME LIMIT |
|
| 26N | No opposition filed |
Effective date: 20180830 |
|
| PG25 | Lapsed in a contracting state [announced via postgrant information from national office to epo] |
Ref country code: SI Free format text: LAPSE BECAUSE OF FAILURE TO SUBMIT A TRANSLATION OF THE DESCRIPTION OR TO PAY THE FEE WITHIN THE PRESCRIBED TIME-LIMIT Effective date: 20171129 |
|
| REG | Reference to a national code |
Ref country code: CH Ref legal event code: PL |
|
| REG | Reference to a national code |
Ref country code: BE Ref legal event code: MM Effective date: 20181031 |
|
| PG25 | Lapsed in a contracting state [announced via postgrant information from national office to epo] |
Ref country code: LU Free format text: LAPSE BECAUSE OF NON-PAYMENT OF DUE FEES Effective date: 20181010 Ref country code: MC Free format text: LAPSE BECAUSE OF FAILURE TO SUBMIT A TRANSLATION OF THE DESCRIPTION OR TO PAY THE FEE WITHIN THE PRESCRIBED TIME-LIMIT Effective date: 20171129 |
|
| REG | Reference to a national code |
Ref country code: IE Ref legal event code: MM4A |
|
| PG25 | Lapsed in a contracting state [announced via postgrant information from national office to epo] |
Ref country code: CH Free format text: LAPSE BECAUSE OF NON-PAYMENT OF DUE FEES Effective date: 20181031 Ref country code: BE Free format text: LAPSE BECAUSE OF NON-PAYMENT OF DUE FEES Effective date: 20181031 Ref country code: LI Free format text: LAPSE BECAUSE OF NON-PAYMENT OF DUE FEES Effective date: 20181031 |
|
| PG25 | Lapsed in a contracting state [announced via postgrant information from national office to epo] |
Ref country code: IE Free format text: LAPSE BECAUSE OF NON-PAYMENT OF DUE FEES Effective date: 20181010 |
|
| PG25 | Lapsed in a contracting state [announced via postgrant information from national office to epo] |
Ref country code: MT Free format text: LAPSE BECAUSE OF NON-PAYMENT OF DUE FEES Effective date: 20181010 |
|
| PG25 | Lapsed in a contracting state [announced via postgrant information from national office to epo] |
Ref country code: TR Free format text: LAPSE BECAUSE OF FAILURE TO SUBMIT A TRANSLATION OF THE DESCRIPTION OR TO PAY THE FEE WITHIN THE PRESCRIBED TIME-LIMIT Effective date: 20171129 |
|
| PG25 | Lapsed in a contracting state [announced via postgrant information from national office to epo] |
Ref country code: PT Free format text: LAPSE BECAUSE OF FAILURE TO SUBMIT A TRANSLATION OF THE DESCRIPTION OR TO PAY THE FEE WITHIN THE PRESCRIBED TIME-LIMIT Effective date: 20171129 |
|
| PG25 | Lapsed in a contracting state [announced via postgrant information from national office to epo] |
Ref country code: HU Free format text: LAPSE BECAUSE OF FAILURE TO SUBMIT A TRANSLATION OF THE DESCRIPTION OR TO PAY THE FEE WITHIN THE PRESCRIBED TIME-LIMIT; INVALID AB INITIO Effective date: 20081010 |
|
| PG25 | Lapsed in a contracting state [announced via postgrant information from national office to epo] |
Ref country code: IS Free format text: LAPSE BECAUSE OF FAILURE TO SUBMIT A TRANSLATION OF THE DESCRIPTION OR TO PAY THE FEE WITHIN THE PRESCRIBED TIME-LIMIT Effective date: 20180329 |
|
| PGFP | Annual fee paid to national office [announced via postgrant information from national office to epo] |
Ref country code: GB Payment date: 20230920 Year of fee payment: 16 |
|
| PGFP | Annual fee paid to national office [announced via postgrant information from national office to epo] |
Ref country code: FR Payment date: 20230920 Year of fee payment: 16 |
|
| PGFP | Annual fee paid to national office [announced via postgrant information from national office to epo] |
Ref country code: DE Payment date: 20230920 Year of fee payment: 16 |