EP3403582B1 - Method and apparatus for determining blood velocity in x-ray angiography images - Google Patents
Method and apparatus for determining blood velocity in x-ray angiography images Download PDFInfo
- Publication number
- EP3403582B1 EP3403582B1 EP17171126.0A EP17171126A EP3403582B1 EP 3403582 B1 EP3403582 B1 EP 3403582B1 EP 17171126 A EP17171126 A EP 17171126A EP 3403582 B1 EP3403582 B1 EP 3403582B1
- Authority
- EP
- European Patent Office
- Prior art keywords
- frame
- centreline
- point
- velocity
- vessel
- Prior art date
- Legal status (The legal status is an assumption and is not a legal conclusion. Google has not performed a legal analysis and makes no representation as to the accuracy of the status listed.)
- Active
Links
- 238000000034 method Methods 0.000 title claims description 76
- 238000002583 angiography Methods 0.000 title claims description 16
- 239000008280 blood Substances 0.000 title description 11
- 210000004369 blood Anatomy 0.000 title description 11
- 238000012545 processing Methods 0.000 claims description 27
- 239000002872 contrast media Substances 0.000 claims description 23
- 238000003384 imaging method Methods 0.000 claims description 22
- 238000002347 injection Methods 0.000 claims description 18
- 239000007924 injection Substances 0.000 claims description 18
- 230000015654 memory Effects 0.000 claims description 16
- 210000004204 blood vessel Anatomy 0.000 claims description 12
- 238000004364 calculation method Methods 0.000 claims description 9
- 230000006870 function Effects 0.000 claims description 8
- 238000005206 flow analysis Methods 0.000 claims description 4
- 239000012530 fluid Substances 0.000 claims description 3
- 230000000644 propagated effect Effects 0.000 claims description 2
- 238000002565 electrocardiography Methods 0.000 description 24
- 230000017531 blood circulation Effects 0.000 description 17
- 210000004351 coronary vessel Anatomy 0.000 description 16
- 238000013459 approach Methods 0.000 description 14
- 238000001514 detection method Methods 0.000 description 13
- 230000002123 temporal effect Effects 0.000 description 12
- 230000000747 cardiac effect Effects 0.000 description 11
- 238000004422 calculation algorithm Methods 0.000 description 10
- 238000005259 measurement Methods 0.000 description 10
- 208000010125 myocardial infarction Diseases 0.000 description 9
- 230000033001 locomotion Effects 0.000 description 7
- 210000001367 artery Anatomy 0.000 description 6
- 238000004891 communication Methods 0.000 description 6
- 208000029078 coronary artery disease Diseases 0.000 description 6
- 238000010586 diagram Methods 0.000 description 6
- 239000011159 matrix material Substances 0.000 description 6
- 230000004087 circulation Effects 0.000 description 5
- 238000013146 percutaneous coronary intervention Methods 0.000 description 5
- 230000010412 perfusion Effects 0.000 description 5
- 238000002059 diagnostic imaging Methods 0.000 description 4
- 230000000694 effects Effects 0.000 description 4
- 230000002537 thrombolytic effect Effects 0.000 description 4
- 230000000007 visual effect Effects 0.000 description 4
- 208000007177 Left Ventricular Hypertrophy Diseases 0.000 description 3
- 238000004590 computer program Methods 0.000 description 3
- 230000001419 dependent effect Effects 0.000 description 3
- 230000010339 dilation Effects 0.000 description 3
- 238000012986 modification Methods 0.000 description 3
- 230000004048 modification Effects 0.000 description 3
- 230000003287 optical effect Effects 0.000 description 3
- 230000008569 process Effects 0.000 description 3
- 230000002829 reductive effect Effects 0.000 description 3
- 238000013519 translation Methods 0.000 description 3
- ZCYVEMRRCGMTRW-UHFFFAOYSA-N 7553-56-2 Chemical compound [I] ZCYVEMRRCGMTRW-UHFFFAOYSA-N 0.000 description 2
- 238000004458 analytical method Methods 0.000 description 2
- 238000002591 computed tomography Methods 0.000 description 2
- 238000012937 correction Methods 0.000 description 2
- 230000001186 cumulative effect Effects 0.000 description 2
- 239000006185 dispersion Substances 0.000 description 2
- 238000006073 displacement reaction Methods 0.000 description 2
- 239000003814 drug Substances 0.000 description 2
- 229940079593 drug Drugs 0.000 description 2
- 238000005516 engineering process Methods 0.000 description 2
- 238000001914 filtration Methods 0.000 description 2
- 229910052740 iodine Inorganic materials 0.000 description 2
- 239000011630 iodine Substances 0.000 description 2
- 230000000670 limiting effect Effects 0.000 description 2
- 210000004165 myocardium Anatomy 0.000 description 2
- 210000000056 organ Anatomy 0.000 description 2
- 230000000541 pulsatile effect Effects 0.000 description 2
- 238000000718 qrs complex Methods 0.000 description 2
- 238000004445 quantitative analysis Methods 0.000 description 2
- 230000009467 reduction Effects 0.000 description 2
- 230000004044 response Effects 0.000 description 2
- 230000011218 segmentation Effects 0.000 description 2
- 210000001519 tissue Anatomy 0.000 description 2
- 230000003936 working memory Effects 0.000 description 2
- IJJWOSAXNHWBPR-HUBLWGQQSA-N 5-[(3as,4s,6ar)-2-oxo-1,3,3a,4,6,6a-hexahydrothieno[3,4-d]imidazol-4-yl]-n-(6-hydrazinyl-6-oxohexyl)pentanamide Chemical compound N1C(=O)N[C@@H]2[C@H](CCCCC(=O)NCCCCCC(=O)NN)SC[C@@H]21 IJJWOSAXNHWBPR-HUBLWGQQSA-N 0.000 description 1
- 238000012935 Averaging Methods 0.000 description 1
- 230000005461 Bremsstrahlung Effects 0.000 description 1
- 201000000057 Coronary Stenosis Diseases 0.000 description 1
- 208000031481 Pathologic Constriction Diseases 0.000 description 1
- 210000003484 anatomy Anatomy 0.000 description 1
- QVGXLLKOCUKJST-UHFFFAOYSA-N atomic oxygen Chemical compound [O] QVGXLLKOCUKJST-UHFFFAOYSA-N 0.000 description 1
- 230000003190 augmentative effect Effects 0.000 description 1
- 230000006399 behavior Effects 0.000 description 1
- 230000005540 biological transmission Effects 0.000 description 1
- 230000036770 blood supply Effects 0.000 description 1
- 230000008859 change Effects 0.000 description 1
- 238000006243 chemical reaction Methods 0.000 description 1
- 230000000295 complement effect Effects 0.000 description 1
- 238000002586 coronary angiography Methods 0.000 description 1
- 238000000354 decomposition reaction Methods 0.000 description 1
- 230000007423 decrease Effects 0.000 description 1
- 230000003247 decreasing effect Effects 0.000 description 1
- 238000003745 diagnosis Methods 0.000 description 1
- 238000009792 diffusion process Methods 0.000 description 1
- 230000002526 effect on cardiovascular system Effects 0.000 description 1
- 238000011156 evaluation Methods 0.000 description 1
- 238000000605 extraction Methods 0.000 description 1
- 210000001105 femoral artery Anatomy 0.000 description 1
- 238000002594 fluoroscopy Methods 0.000 description 1
- 230000010247 heart contraction Effects 0.000 description 1
- 230000000004 hemodynamic effect Effects 0.000 description 1
- 238000010191 image analysis Methods 0.000 description 1
- 238000002608 intravascular ultrasound Methods 0.000 description 1
- 230000001788 irregular Effects 0.000 description 1
- 230000002427 irreversible effect Effects 0.000 description 1
- 208000028867 ischemia Diseases 0.000 description 1
- 238000002955 isolation Methods 0.000 description 1
- 238000013507 mapping Methods 0.000 description 1
- 238000002324 minimally invasive surgery Methods 0.000 description 1
- 238000012544 monitoring process Methods 0.000 description 1
- 238000009659 non-destructive testing Methods 0.000 description 1
- 229910052760 oxygen Inorganic materials 0.000 description 1
- 239000001301 oxygen Substances 0.000 description 1
- 230000036961 partial effect Effects 0.000 description 1
- 230000035515 penetration Effects 0.000 description 1
- 230000002085 persistent effect Effects 0.000 description 1
- 238000004321 preservation Methods 0.000 description 1
- 238000000513 principal component analysis Methods 0.000 description 1
- 238000007639 printing Methods 0.000 description 1
- 238000011002 quantification Methods 0.000 description 1
- 210000002321 radial artery Anatomy 0.000 description 1
- 230000005855 radiation Effects 0.000 description 1
- 230000010410 reperfusion Effects 0.000 description 1
- 238000011160 research Methods 0.000 description 1
- 230000027756 respiratory electron transport chain Effects 0.000 description 1
- 230000029058 respiratory gaseous exchange Effects 0.000 description 1
- 238000012552 review Methods 0.000 description 1
- 238000004335 scaling law Methods 0.000 description 1
- 238000001228 spectrum Methods 0.000 description 1
- 230000003068 static effect Effects 0.000 description 1
- 208000037804 stenosis Diseases 0.000 description 1
- 230000036262 stenosis Effects 0.000 description 1
- 230000002966 stenotic effect Effects 0.000 description 1
- 238000002560 therapeutic procedure Methods 0.000 description 1
- 230000002792 vascular Effects 0.000 description 1
- 230000002861 ventricular Effects 0.000 description 1
Images


Classifications
-
- G—PHYSICS
- G06—COMPUTING; CALCULATING OR COUNTING
- G06T—IMAGE DATA PROCESSING OR GENERATION, IN GENERAL
- G06T7/00—Image analysis
- G06T7/20—Analysis of motion
-
- A—HUMAN NECESSITIES
- A61—MEDICAL OR VETERINARY SCIENCE; HYGIENE
- A61B—DIAGNOSIS; SURGERY; IDENTIFICATION
- A61B5/00—Measuring for diagnostic purposes; Identification of persons
- A61B5/24—Detecting, measuring or recording bioelectric or biomagnetic signals of the body or parts thereof
- A61B5/316—Modalities, i.e. specific diagnostic methods
- A61B5/318—Heart-related electrical modalities, e.g. electrocardiography [ECG]
-
- A—HUMAN NECESSITIES
- A61—MEDICAL OR VETERINARY SCIENCE; HYGIENE
- A61B—DIAGNOSIS; SURGERY; IDENTIFICATION
- A61B6/00—Apparatus for radiation diagnosis, e.g. combined with radiation therapy equipment
- A61B6/48—Diagnostic techniques
- A61B6/481—Diagnostic techniques involving the use of contrast agents
-
- A—HUMAN NECESSITIES
- A61—MEDICAL OR VETERINARY SCIENCE; HYGIENE
- A61B—DIAGNOSIS; SURGERY; IDENTIFICATION
- A61B6/00—Apparatus for radiation diagnosis, e.g. combined with radiation therapy equipment
- A61B6/48—Diagnostic techniques
- A61B6/486—Diagnostic techniques involving generating temporal series of image data
- A61B6/487—Diagnostic techniques involving generating temporal series of image data involving fluoroscopy
-
- A—HUMAN NECESSITIES
- A61—MEDICAL OR VETERINARY SCIENCE; HYGIENE
- A61B—DIAGNOSIS; SURGERY; IDENTIFICATION
- A61B6/00—Apparatus for radiation diagnosis, e.g. combined with radiation therapy equipment
- A61B6/50—Clinical applications
- A61B6/504—Clinical applications involving diagnosis of blood vessels, e.g. by angiography
-
- A—HUMAN NECESSITIES
- A61—MEDICAL OR VETERINARY SCIENCE; HYGIENE
- A61B—DIAGNOSIS; SURGERY; IDENTIFICATION
- A61B6/00—Apparatus for radiation diagnosis, e.g. combined with radiation therapy equipment
- A61B6/50—Clinical applications
- A61B6/507—Clinical applications involving determination of haemodynamic parameters, e.g. perfusion CT
-
- A—HUMAN NECESSITIES
- A61—MEDICAL OR VETERINARY SCIENCE; HYGIENE
- A61B—DIAGNOSIS; SURGERY; IDENTIFICATION
- A61B6/00—Apparatus for radiation diagnosis, e.g. combined with radiation therapy equipment
- A61B6/52—Devices using data or image processing specially adapted for radiation diagnosis
- A61B6/5211—Devices using data or image processing specially adapted for radiation diagnosis involving processing of medical diagnostic data
- A61B6/5217—Devices using data or image processing specially adapted for radiation diagnosis involving processing of medical diagnostic data extracting a diagnostic or physiological parameter from medical diagnostic data
-
- A—HUMAN NECESSITIES
- A61—MEDICAL OR VETERINARY SCIENCE; HYGIENE
- A61B—DIAGNOSIS; SURGERY; IDENTIFICATION
- A61B6/00—Apparatus for radiation diagnosis, e.g. combined with radiation therapy equipment
- A61B6/54—Control of apparatus or devices for radiation diagnosis
- A61B6/541—Control of apparatus or devices for radiation diagnosis involving acquisition triggered by a physiological signal
-
- G—PHYSICS
- G06—COMPUTING; CALCULATING OR COUNTING
- G06T—IMAGE DATA PROCESSING OR GENERATION, IN GENERAL
- G06T7/00—Image analysis
- G06T7/0002—Inspection of images, e.g. flaw detection
- G06T7/0012—Biomedical image inspection
- G06T7/0014—Biomedical image inspection using an image reference approach
- G06T7/0016—Biomedical image inspection using an image reference approach involving temporal comparison
-
- G—PHYSICS
- G06—COMPUTING; CALCULATING OR COUNTING
- G06T—IMAGE DATA PROCESSING OR GENERATION, IN GENERAL
- G06T7/00—Image analysis
- G06T7/50—Depth or shape recovery
- G06T7/55—Depth or shape recovery from multiple images
- G06T7/579—Depth or shape recovery from multiple images from motion
-
- G—PHYSICS
- G16—INFORMATION AND COMMUNICATION TECHNOLOGY [ICT] SPECIALLY ADAPTED FOR SPECIFIC APPLICATION FIELDS
- G16H—HEALTHCARE INFORMATICS, i.e. INFORMATION AND COMMUNICATION TECHNOLOGY [ICT] SPECIALLY ADAPTED FOR THE HANDLING OR PROCESSING OF MEDICAL OR HEALTHCARE DATA
- G16H50/00—ICT specially adapted for medical diagnosis, medical simulation or medical data mining; ICT specially adapted for detecting, monitoring or modelling epidemics or pandemics
- G16H50/30—ICT specially adapted for medical diagnosis, medical simulation or medical data mining; ICT specially adapted for detecting, monitoring or modelling epidemics or pandemics for calculating health indices; for individual health risk assessment
-
- A—HUMAN NECESSITIES
- A61—MEDICAL OR VETERINARY SCIENCE; HYGIENE
- A61B—DIAGNOSIS; SURGERY; IDENTIFICATION
- A61B6/00—Apparatus for radiation diagnosis, e.g. combined with radiation therapy equipment
- A61B6/44—Constructional features of apparatus for radiation diagnosis
- A61B6/4429—Constructional features of apparatus for radiation diagnosis related to the mounting of source units and detector units
- A61B6/4435—Constructional features of apparatus for radiation diagnosis related to the mounting of source units and detector units the source unit and the detector unit being coupled by a rigid structure
- A61B6/4441—Constructional features of apparatus for radiation diagnosis related to the mounting of source units and detector units the source unit and the detector unit being coupled by a rigid structure the rigid structure being a C-arm or U-arm
-
- G—PHYSICS
- G06—COMPUTING; CALCULATING OR COUNTING
- G06T—IMAGE DATA PROCESSING OR GENERATION, IN GENERAL
- G06T2207/00—Indexing scheme for image analysis or image enhancement
- G06T2207/10—Image acquisition modality
- G06T2207/10016—Video; Image sequence
-
- G—PHYSICS
- G06—COMPUTING; CALCULATING OR COUNTING
- G06T—IMAGE DATA PROCESSING OR GENERATION, IN GENERAL
- G06T2207/00—Indexing scheme for image analysis or image enhancement
- G06T2207/10—Image acquisition modality
- G06T2207/10116—X-ray image
-
- G—PHYSICS
- G06—COMPUTING; CALCULATING OR COUNTING
- G06T—IMAGE DATA PROCESSING OR GENERATION, IN GENERAL
- G06T2207/00—Indexing scheme for image analysis or image enhancement
- G06T2207/30—Subject of image; Context of image processing
- G06T2207/30004—Biomedical image processing
- G06T2207/30101—Blood vessel; Artery; Vein; Vascular
- G06T2207/30104—Vascular flow; Blood flow; Perfusion
-
- G—PHYSICS
- G06—COMPUTING; CALCULATING OR COUNTING
- G06T—IMAGE DATA PROCESSING OR GENERATION, IN GENERAL
- G06T2207/00—Indexing scheme for image analysis or image enhancement
- G06T2207/30—Subject of image; Context of image processing
- G06T2207/30172—Centreline of tubular or elongated structure
Definitions
- the present disclosure relates to the technical field of medical imaging, particularly angiography imaging, although it can find application in any field where there is the need to quantify flow in a conduit such as in non-destructive testing applications.
- Coronary artery disease is one of the leading causes of death worldwide.
- CAD generally refers to conditions that involve narrowed or blocked blood vessels that can lead to reduced or absent blood supply to the sections distal to the stenosis resulting in reduced oxygen supply to the myocardium, resulting in, for instance, ischemia and myocardial infarction.
- Myocardial infarction commonly known as a heart attack, occurs when the blood flow stops to a part of the heart causing irreversible damage to the heart muscle. Approximately 1.5 million cases of MI occur annually in the United States alone.
- X-ray angiography is the imaging modality used during treatment of stenotic (narrowed) coronary arteries by means of a minimally invasive procedure also known as percutaneous coronary intervention (PCI).
- PCI percutaneous coronary intervention
- a (interventional) cardiologist feeds a deflated balloon or other device on a catheter from the inguinal femoral artery or radial artery up through blood vessels until they reach the site of blockage in the artery.
- X-ray imaging is used to guide the catheter threading.
- PCI usually involves inflating a balloon to open the artery with the aim to restore unimpeded blood flow. Stents or scaffolds may be placed at the site of the blockage to hold the artery open.
- CAD CAD-CAD
- a clinician must be able to evaluate coronary anatomy, ventricular function and coronary blood flow.
- X-ray angiography remains the standard imaging technique for obtaining information on the first two factors.
- visual assessment of percentage diameter percentage diameter coronary stenosis suffers from significant intraobserver and interobserver variability, quantitative coronary analysis (QCA) provides accurate and objective measurement of arterial geometry.
- QCA quantitative coronary analysis
- a method for assessment of coronary blood flow in the catheterization laboratory is by means of intracoronary Doppler measurements techniques. These techniques involves percutaneously inserting a Doppler-transducing wire inside the coronary artery and measuring the blood velocity inside the coronary artery as described by Bach et al, "Intracoronary Doppler flow velocity measurements for the evaluation and treatment of coronary artery disease", Current Opinion in Cardiology 1995, 10: 434-442 . Intracoronary Doppler measurements, however, has some disadvantages. The technique is associated with the additional cost of a Doppler wire which can only be used once. Furthermore, Doppler-based assessment of coronary flow velocity requires additional invasive catheterization with the associated cost and procedure time. Moreover, Doppler-based assessment of coronary flow velocity relies on average peak velocity and does not take into account changes in velocity profile or vessel area which are usually occurring in patients with CAD.
- Coronary blood flow estimation based on X-ray angiographic image data would be preferable, since this would require no additional invasive catheterization with the associated cost and procedure time.
- coronary blood flow has been simply assessed by the thrombolysis in myocardial infarction (TIMI) flow grade.
- TIMI myocardial infarction
- This simple qualitative grading of angiographic coronary flow rates to assess the efficiency of reperfusion therapy, such as PCI has been widely used to gauge the restoration of perfusion in clinical trials "The Thrombolysis in Myocardial Infarction (TIMI) trial. Phase I findings. TIMI Study Group", The New England Journal of Medicine, 1985 April 4, 312(14):932-6 .
- This method assessed the amount of frames required for the contrast to reach a standardized distal coronary landmark in the diseased vessel. This assessment is performed by visually assessing the number of frames within a two-dimensional x-ray angiographic image run, which are required for the contrast to reach a standardized distal coronary landmark of the diseased vessel. The number of frames is based upon an x-ray cine filming rate of 30 frames per second. Thus a frame count of 30 would mean that one second was required for dye to traverse the artery.
- the TIMI flow grade categorized the patient's coronary flow into one of four different categories namely grade 0 (no flow), grade 1 (penetration without perfusion), grade 2 (partial perfusion) or grade 3 (complete perfusion).
- this method is very subjective due to the high observer variability in the determination of the first and last frame used for the TIMI counting. Furthermore, this method is categorical and no continuous angiographic index of coronary flow is given.
- TIMI Frame Count A Quantitative Method of Assessing Coronary Flow
- Circulation, Volume 93, Issue 5, 879-888 (1996 ) developed a more objective and continuous variable of coronary blood flow called the corrected TIMI frame count (CTFC).
- CTFC corrected TIMI frame count
- the TIMI frame count is adjusted for the vessel length.
- a correction factor is applied to compensate for the longer length of the left anterior descending artery (LAD) compared with the circumflex and the right coronary arteries as described in Appelby et al, "Importance of the TIMI frame count: implications for future trials", Curr Control Trials Cardiovasc Med. 2000; 1 (1): 31 - 34 .
- Sprunougel et al distinguish two major classes of blood flow velocity algorithms; tracking algorithms and computational algorithms.
- the latter class, the computational algorithms make use of models, mass and volume equations. These approaches rely on assumptions of for instance mass and volume, and/or require additional information, which make these methods not suitable for fast assessment of coronary blood flow in a clinical setting such as during a coronary intervention in a catheterisation laboratory.
- the bolus transport time algorithms determine the velocity by measuring the time that it takes for the bolus to travel from one fixed location to a second fixed location within the vessel.
- This method is not robust for pulsatile flows and requires densitometric information for all frames at two locations to acquire two bolus density curves. To achieve these bolus intensity curves, accurate tracking of the measurement locations in all frames is required and this computational expensive and time consuming.
- the continuous velocity determination from two-dimensional time-distance parametric images algorithms are too complex to apply in a clinical case.
- the droplet technique is not applicable into a clinical setting because of the injection method that is required by this method does not match clinical practice.
- Ten Brinke et al A Method towards Automated Thrombolysis in Myocardial Infarction (TIMI) Frame Counting Using 3D Reconstruction", Computers in Cardiology 36, p. 653-656, 2009 .
- Ten Brinke determines the TIMI frame count (a measure of velocity) by drawing and following a centerline through multiple image frames through time, and deriving the mentioned frame count by following decreases in contrast intensity over time.
- Ten Brinke uses a 3D reconstruction of the coronary vessel to improve distance measured along the coronary vessel. This method is usually called a bolus arrival time based method, as it keeps track of a couple of fixed spatial points over time and marks the moments in time when changes in the points occur.
- a cine framerate of 7.5 frames per second results in a temporal resolution of 133 milliseconds as compared to 33 milliseconds as obtained with 30 frames per second.
- a cine framerate of 15 frames per second large offsets in measured coronary flow velocity can arise depending on the time interval chosen and the exact moment of acquisition.
- devices, computer program products and computer implemented methods are provided for quantitative flow analysis of a fluid flowing in a conduit from sequences of consecutive image frames of such a conduit, which image frames are timely separated by a certain time interval, the devices, program products and methods comprising, under control of one or more computer systems configured with specific executable instructions,
- the sequence of image frames contains information for determining the distribution over time of a contrast agent travelling in the conduit, the start frame and the end frame relating to a different distribution of contrast agent in the conduit from a proximal point to a distal point located on the centreline of the start frame and of the end frame.
- the end point in the start frame and the end point in the end frame are identified by the front of the contrast agent distal to the common start point.
- intensity versus centreline distance graphs from the start point are calculated in both start and end frame.
- the end point can thus be selected by setting a threshold and identifying the centreline distance corresponding to the point having intensity equal to such a threshold.
- the common start point in start and end frame may be advantageously selected by performing one or more operations selected from the group consisting in: automatically detecting tip of a contrast injection catheter, automatically detecting an anatomical point such as point of a vessel bifurcation, elaborating a user input.
- the sequence of image frames preferably contains digitally subtracted image frames or the method further comprise the step of digitally subtracting the image frames of the sequence from a mask frame or multiple mask frames to obtain digitally subtracted image frames to enhance the flow in the conduit and thus increase the resolution.
- a local velocity is calculated based on different frame selection to provide a map of velocities as a function of time.
- the velocity as calculated in step i) is adjusted by a correlation factor to determine an average velocity over a period of time.
- the sequence preferably comprises bi-dimensional or three-dimensional image frames covering one or more heart cycles and the average velocity is calculated over a period of time comprised in the heart cycle.
- the correlation factor can be calculated, for example, by processing an input database of known velocity profiles.
- the local velocity or the average velocity is propagated to other segments of the conduit to estimate velocity in such segments, for example for those parts that are hidden or masked and thus cannot be properly seen in the image frames.
- the local velocities may be used for further quantitative processing, for example for volumetric flow analysis, CFR, CFD or the like calculations.
- Embodiments also relate to a computer product directly loadable into the memory of a digital computer and comprising software code portions for performing the method according to embodiments herein when the product is run on a computer.
- an imaging device typically a X-ray or MRI device, more typically an X-ray device for angiography, for acquiring contrast enhanced two dimensional or three dimensional sequences of image frames
- the device comprising an acquisition module for obtaining a plurality of image frames of a vessel perfused by a contrast agent, a timing module for driving the acquisition module to obtain image frames temporally shifted of a known time interval after a trigger event, input for receiving from the user indication for the selection of a start frame and an end frame of the sequence and/or a selection module for automatically selecting a start frame and an end frame of the sequence, the device further comprising a processor programmed to:
- Embodiments herein provide that the common start point in start and end frame is selected by performing one or more operations selected from the group consisting in: automatically detecting tip of a contrast injection catheter, automatically detecting an anatomical point such as point of a vessel bifurcation, elaborating a user input.
- the end point in start and end frame may be selected by elaborating a user input and/or automatically detecting drop points in graphs representing intensity versus centreline distance from the start point in both start and end frame.
- the imaging device may advantageously comprise a digital subtraction angiography module configured to compute a mask frame and subtract such a mask frame or multiple mask frames from the image frames to obtain a sequence of flow-enhanced frames.
- a digital subtraction angiography module configured to compute a mask frame and subtract such a mask frame or multiple mask frames from the image frames to obtain a sequence of flow-enhanced frames.
- the device further comprises an ECG module to synchronize acquisition with heart cycle, the processor being configured to calculate local velocities for a plurality of couples of image frames of the sequence related to one or more heart cycles.
- an image sequence acquired by an X-ray system contains two different temporal resolutions.
- First, the amount of frames acquired during one second is defined as the cine frame rate resulting in a temporal cine frame rate resolution ( t cineframe ).
- the t acquisition is in the order of a few milliseconds.
- the inventors have recognized that the t acquisition is independent from t cineframe .
- this difference in temporal resolutions is exploited by assessment of the coronary artery contrast bolus front within an x-ray angiographic frame (having a temporal resolution of t acquisition ), and being less dependent on t cineframe .
- the contrast bolus front is the furthest distal (downstream the vessel tree) position in the vessel of interest in a given angiographic frame in which the contrast is still visible.
- some embodiments are able to determine blood velocity on an acquisition frame to frame basis, and take into account effects caused by the heart contraction cycle.
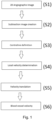
- Fig. 1 and 3 show flow charts illustrating the operations according to embodiments of the present application.
- the operations employ an imaging system capable of acquiring and processing two-dimensional images of a vessel organ (or portion thereof) or other object of interest.
- an imaging system capable of acquiring and processing two-dimensional images of a vessel organ (or portion thereof) or other object of interest.
- a single plane angiographic system can be used as those manufactured, for example, by Philips (Allura Xper FD).
- Fig. 2 is a functional block diagram of an exemplary single plane angiographic system, which includes an angiographic imaging apparatus 112 that operates under commands from user interface module 116 and will provide data to data processing module 114.
- the single plane angiographic imaging apparatus 112 captures a two-dimensional X-ray image run of the vessel organ of interest for example in the postero-anterior (PA) direction.
- the single plane angiographic imaging apparatus 112 typically includes an X-ray source and detector pair mounted on an arm of a supporting gantry.
- the gantry provides for positioning the arm of the X-ray source and detector at various angles with respect to a patient who is supported on a table between the X-ray source and detector.
- the data processing module 114 may be realized by a personal computer, workstation or other computer processing system.
- the data processing module 114 includes one or more processors and memory that stores program instructions to direct the one or more processors to perform the operations described herein.
- the data processing module 114 also includes a display to present information to a user, such as the images, indicia, data and other information described herein and illustrated in the figures.
- the data processing module 114 also includes a user interface to receive inputs from the user in connection with operations herein, such as controlling operation of the imaging apparatus 112, selecting projection perspectives to be used when obtaining complementary images and the like.
- the data processing module 114 may correspond to or include portions of one or more of the systems described within the patents and publications referenced herein.
- the data processing module 114 processes the two-dimensional image captured by the single plane angiographic imaging apparatus 112 to generate data as described herein.
- the user interface module 116 interacts with the user and communicates with the data processing module 114.
- the user interface module 116 can include different kinds of input and output devices, such as a display screen for visual output, a touch screen for touch input, a mouse pointer or other pointing device for input, a microphone for speech input, a speaker for audio output, a keyboard and/or keypad for input, etc.
- the data processing module 114 and the user interface module 116 cooperate to carry out the operations of Fig. 1 or 3 as described below. The operations of Fig.
- 1 or 3 can also be carried out by software code that is embodied in a computer product (for example, an optical disc or other form of persistent memory for instance an USB drive or a network server).
- the software code can be directly loadable into the memory of a data processing system for carrying out the operations of Fig. 1 or 3 .
- the embodiments are now disclosed in details by way of a non-limiting example.
- a two-dimensional angiographic image run of an object of interest S1, 201
- the two-dimensional angiographic image data may be obtained in real time from an angiographic imaging system.
- pre-recorded two-dimensional angiographic image data may be obtained from a local memory, a database, a network server or otherwise.
- This two-dimensional angiographic image run contains multiple frames covering multiple heart phases.
- Any image device capable of providing two-dimensional angiographic image runs can be used for this purpose.
- a single plane angiographic system can be used such as those manufactured, for example, by Philips (Allura Xper FD).
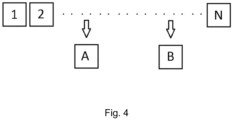
- subtraction frames are preferably calculated to enhance the flow (S2) and a start frame A and end frame B are selected (203) as it can be seen in Fig. 4 . Then a centerline along a vessel of interest is indicated in the selected two frames (205, 207) of the image run (S3). From this input, blood velocity can be determined in the vessel of interest. The velocity is determined by looking at a combination of distance covered over time between frames (S4, 219). An optional translation based on the time between frame A and frame B in relation to the cardiac heart cycle can be performed as shown in operation S5.
- the information on the cardiac heart cycle can be determined, for example, from an Electrocardiography (ECG) signal linked to the two-dimensional angiographic image run. This results in a patient specific, heart phase independent, blood vessel velocity value (S6).
- ECG Electrocardiography
- S6 blood vessel velocity value
- the embodiment uses X-ray angiographic image analysis to determine average blood velocity in a targeted blood vessel or vessel of interest. Therefore, subtraction angiographic frames and ECG signal corresponding with the X-ray angiographic image run are preferred for the optimal performance of the blood velocity determination method as shown in S2 and 202. This step contributes to enhance image flow quality, but can be obviously omitted.
- Other imaging modalities can be used, for example MRI or computed tomography or x-ray rotational angiography, to obtain similar results.
- DSA Digital subtraction angiography
- Tissues and blood vessels on the first image are digitally subtracted from the second image (mask frame, the image which contains no radiopaque iodine), leaving a clear picture of the artery which can then be studied independently and in isolation from the rest of the body.
- DSA can for instance be calculated from the two-dimensional angiographic image run and most X-ray angiographic systems include an imaging protocol to directly generate DSA.
- DSA uses a static mask frame and is therefore not able to compensate for cardiac motion which occurs during the acquisition.
- DICOM Digital Imaging and Communications in Medicine
- T c This moment of contrast injection is henceforth referred to as T c .
- this T c can be detected automatically by methods described in literature, for example by Chen et al, "Robust and fast contrast inflow detection for 2D x-ray fluoroscopy". MICCAI 2011, Part 1, pp 243-250 .
- a vesselness filter working on first order derivative responses which occur when a vessel is filled with contrast agent, detects the number of vessels.
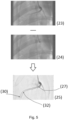
- one or more specific mask frames can be subtracted from one or more angiographic frames ( Fig. 5 , reference 23) after contrast injection. This removes any movement in the patient caused by for instance cardiac motion, and creates one or more improved subtraction frames ( Fig. 5 , reference 25).
- a single mask frame is computed by determining a maximum intensity frame from all time frames before the moment of measurement (subtraction start frame).
- maximal intensity frame mask is created by looking at every pixel through the number of input frames, and assigning the maximum pixel value to the pixel at the same position in the mask frame. Any contrast already injected also causes a drop in image intensity, and will not show up in this maximal intensity mask.
- two frames can be selected as shown in Fig. 4 .
- One frame representing the image within the image run showing the contrast bolus front proximal the vessel of interest (A), and one frame further down the target vessel representing the image within the image run showing the contrast bolus front distal to the vessel of interest (B).
- the start frame A can be selected automatically being the frame in which the contrast injections starts (T c ).
- the end frame B can be selected manually, or set at a fixed time subsequent to frame A, for example an entire heart cycle, based on heart rate or the ECG signal of the patient.
- a centerline is created along the contrast agent including the contrast bolus front ( Fig. 6 , reference 2), starting from a start point in both frames ( Fig. 6 , reference 1) as shown in operation S3 of Fig. 1 or 205, 207 of Fig. 3 .
- This starting points in frame A and B should represent an identical anatomical position ( Fig. 3 , reference 209), which can be achieved using several methods known in the art.
- an automatically detected point of a bifurcation is a second method to get an anatomically matching starting point.
- This point of bifurcation detection can for instance be detected as described in US 8,086,000 .
- a bifurcation is detected by deriving the contours and centreline of the vessel and determining the start and end of bifurcation. Then the angles between the various branches of the bifurcation are determined and the position of the centre of bifurcation is determined.
- the starting points can be indicated manually by the user.
- the created centerline ( Fig. 6 , reference 4) must continue until and through the visible contrast agent front ( Fig. 6 , reference 3), travelling through the target vessel.
- the intensity profile along this centerline can be plotted into distance/ intensity graphs, resulting in graphs as can be seen in Fig. 6 , reference 6.
- the intensity values of these graphs are calculated by averaging the intensities within a small region of interest around every point on the centerline ( Fig. 6 , reference 15).
- An end point (representing the contrast bolus front within the conduit) based on contrast intensity can, for instance, be manually indicated by the user ( Fig. 3 , reference 211, 213).
- the user can for instance indicate an end point in the angiographic frame or in the distance/intensity graphs ( Fig. 6 , reference 6).
- an end point can be automatically defined.
- small regions of interest extending slightly beyond the vessel borders are defined, as earlier described in S3, 211, 213 and Fig. 6 , reference 15. By extending these regions a little further away from the centerline through the vessel borders ( Fig. 6 , reference 15), it is possible to include both a part of the vessel and a part of the background in such region. As such, these regions of interest will cover two regions; the region within the vessel (dark) as well as the region outside of the vessel (background, light). As long as the vessel is filled with contrast, the inside of the vessel will remain dark ( Fig. 5 , reference 27). The part of the vessel in which the contrast bolus front still needs to travel ( Fig.
- the automatic detection of the above mentioned drop point can be based on a predefined threshold value within the standard deviation-distance graph.
- a combined standard deviation-intensity distance graph can be computed ( Fig. 6 , reference 17), for instance by multiplying the distance graph with the standard deviation graph. This graph will emphasize the drop location.
- the drop point can be defined as the location of the maximum absolute derivative of the combined standard deviation-intensity distance graph ( Fig. 6 , reference 18).
- v local is the velocity measured over the vessel segment between the contrast fronts in the given input frames
- s 1 the distance measured in the first frame (frame A)
- s 2 the distance measured in the second frame (frame B)
- t 1 the timestamp of the start of acquisition of the first frame
- t 2 the timestamp of the start of acquisition of the second frame.
- the distance s is the distance from the start point to the contrast bolus front (end point) along the centerline of the vessel ( Fig. 3 , reference 215 and 217). This can for instance be done by determining the Euclidian distance along the centerline between the two points.
- the distance along the centerline s can be optimized by using an automatically detected centerline using vessel detection algorithms as for instance described in Gronenschild et al, "CAAS II: A Second Generation System for Offline and On-line Quantitative Coronary Angiography", Catheterization and Cardiovascular Diagnosis 33: 61-75 (1994 ).
- CAAS II A Second Generation System for Offline and On-line Quantitative Coronary Angiography
- the previously (manually) defined centerline is used as an input.
- quantitative analysis based on pixel intensities is performed using the input centerline to determine the segmentation edges of the vessel.
- the updated centerline is then defined as the center of the detected segmentation edges.
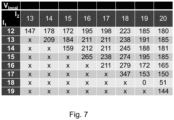
- a matrix of selected v local values for various combinations of input frames A and B is possible to create.
- Such a matrix gives an overview of v local behavior for different selections of frames, and creates insight in how the v local changes when measured over different parts of the cardiac cycle as can be seen in Fig. 7 .
- Plotting in a graph for example all v local values calculated using for instance a single frame difference between frame A and frame B subsequent for all the frames within a full cardiac cycle represents the velocity change during the cardiac cycle as contrast agent propagates through the target vessel as can be seen in Fig. 8 , further known as 'full velocity profile'.
- Figure 8 illustrates what can be achieved by this invention; the creation of a full velocity profile as a combination of multiple local velocities (v local ) within a heart cycle.
- the full velocity profile has a patient independent profile shape.
- One or more profiles were used to create a generic, averaged full velocity profile. In which each full velocity profile was normalized on the basis of the minimum and maximum values of the velocity found.
- ECG signal corresponding to the full velocity profiles are also averaged to create a generic ECG signal.
- these patient independent generic full profiles can be created by preselecting the full profiles that were used to create a generic, averaged full velocity graph based on different coronary vessel tree structures, such as right dominant, left dominant, small right dominant and balanced.
- coronary vessel tree difference in relation to the coronary dominant type are in detailed described by Dodge et al, "Lumen diameter of normal human coronary arteries: influence of age, sex, anatomic variation, and left ventricular hypertrophy or dilation", Circulation 1992; 86: 232-246 .
- v local In case the v local is computed within a part of the cardiac cycle, v local does not represent the average blood velocity for that patient. In this situation the time interval over which the v local value has been determined is dependent on a corresponding section of the heart phase. In different sections of the heart phase the v local value can therefore be an over- or under estimation as related to the average blood velocity of the patient as can be seen in Fig. 9 .
- the v local corresponding to interval (20, within Fig. 9 ) is for instance different compared to the v local corresponding to interval (21 within Fig. 9 ). Therefore the v local needs to be corrected to an average velocity value v mean over an entire heart cycle (22 within Fig. 9 ).
- the generic full velocity profile is used for this translation method ( Fig. 1 , S5).
- the full velocity profiles can be obtained from different patients for instance through a database and have corresponding ECG signals.
- f(x) represents the generic full velocity profile and start and end are the start and end frame times within the normalized heart cycle [0, 1].
- start and end are the start and end frame times converted to heart phase position of the frames A and B in which v mean needs to be calculated.
- This conversion is needed to match the input frames to a certain time moment in the generic, normalized velocity profile. This can be done for instance by detecting the R peaks of the QRS complex (see Fig. 11 ) as taught by Manikandan et al "A novel method for detecting R-peaks in electrocardiogram (ECG”) signal", Biomedical Signal Processing and Control 7 (2012) 118-128 .
- ECG electrocardiogram
- the interval spanned between the start and end frame can be linked to an interval relative to the detected R peaks.
- the interval between two R peaks is normalized to an interval between 0 and 1, and the interval between the start and end frame is normalized with the same ratio, resulting in an interval relative to the heart phase.
- v mean v local c f
- v local is the velocity measured over the vessel segment between the contrast fronts in the given input frames and cf is the correlation factor.
- the diameter of the vessel should correspond to the average diameter over the vessel segment analyzed.
- the value can be manually set for instance by drawing a line in the two-dimensional angiographic frame.
- the average diameter can also be detected automatically, for example by the detection algorithms described in US8787641 .
- the centerline used as input in S3, 205, 207 can be used as an input. This redefines the centerline, but as it also detects vessel borders, it can also be used to create a diameter graph along the centerline. Of such graph, an average diameter can be derived.
- the embodiment is not dependent on the temporal resolution (t cineframe ) as defined by the image cine frame rate (which might be limited to 7.5 frames per second), but only by the temporal resolution of the shutter of the imaging system (t acquisition ), which lies considerably higher usually around 20 milliseconds.
- a 3D model may be used for correction of two-dimensional distances.
- one or multiple 3D models mapped to the two-dimensional centerlines available in the start and the end frame needs to be available.
- 3D distances in the 3D model from and to the corresponding mapped two-dimensional points are calculated, allowing a better distance estimation.
- the 3D model is positioned such that the patient position is equal to the patient position of the image run.
- a frame of the image run is chosen wherein the heart phase of the frame is matched to that of the 3D model. If for instance, the 3D model is derived from CT data, the data is recorded during one specific moment within the heart phase, whereas the two-dimensional image run contains multiple heart phases. Aligning the heart phase ensures a better matching.
- the 3D model is then back projected onto the chosen two-dimensional frame as taught by for instance Lay, "Linear algebra and its applications", 2012, 4th edition, p. 142-143, Addison-Wesley Longman . This can be done using a 3D centreline model or a 3D lumen model.
- the lumen in the two-dimensional frame is emphasized. This can be done using a vesselness filter which takes into account the diameters of the lumen that need to be found in the image, for instance Frangi, “Multiscale vessel enhancement filtering", In Medical Image Computing and Computer-Assisted Intervention - MICCAI 1998, Lecture Notes in Computer Science, Vol 1496 pp 130-137 . These diameters can be retrieved directly from the 3D model in case of a lumen-model.
- the matching between the two-dimensional computed vesselness image and the back projected 3D model is performed by calculating the costs of the mismatch between the back projected 3D centreline model and the two-dimensional vesselness centrelines. For every back projected 3D point, a cost is determined. This cost is for instance the Euclidian distance to the nearest-neighbour point. The total cost for the match between this back projected 3D centreline model and the two-dimensional vesselness image is a summation of the cost for all points of the back projected 3D centreline model.
- the minimum cost represents the best match between the back projected 3D model and the two-dimensional frame. Using this match, the 3D centreline can be used to correct the two-dimensional distance between the two-dimensional points.
- the velocity in other parts of the same vessel tree can be calculated, granting access to velocity in vessels even if not properly visible in angiography or part of a 3D model.
- the (part of) the vessel tree can for instance be indicated in a generic vessel tree retrieved from a database, preferably corresponding to the heart type of the patient or, if available, for instance a patient-specific CT scan.
- the vessel segment belonging to v mean can be indicated manually by the user in (part of) the vessel tree or can be determined automatically.
- an annotated 3D model (containing labels for each vessel segment) is available of part or all of the vessel tree
- the vessel segment belonging to v mean can be determined by back projecting the 3D model onto the two-dimensional angiographic image as described above.
- a heart type which can be determined to be either right dominant, left dominant, small right dominant or balanced as can be seen in Fig. 10 , based on this heart type every patient has a specific coronary vessel tree with specific relative diameters in the coronary vessel tree as described by Dodge et al, "Lumen Diameter of Normal Human Coronary Arteries. Influence of age, sex, anatomic variation, and left ventricular hypertrophy or dilation", Circulation, Vol 86, No 1, 232-246 (1992 ).
- Scaling laws then combine diameters for a certain heart type before and after a bifurcation in the vessel tree with a given input velocity to calculate velocity and flow on the other two branches of the bifurcation as described in Huo et al, "Intraspecific scaling laws of vascular trees", J. R. Soc. Interface (2012) 9, 190-200 .
- r values are the radius of the two distal vessels.
- the diameters of the generic heart models it is possible to calculate any velocity value through the entire vessel tree. This creates an extra processing step after step S6 of Fig. 3 .
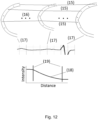
- image registration can be performed on input angiographic subtraction image frames as an extra processing step in operation S2 of Fig. 3 .
- Every frame ( Fig. 12 , reference 16) in the fully visible vessel tree is mapped to a moment in the heart cycle linked to the ECG signal ( Fig. 12 , reference 17), and the same is done during contrast propagation. Then, a fixed number of centerline points is registered along all frames ( Fig. 12 , reference 15). These centerline points correspond to the x-axis on a new intensity graph ( Fig. 6 ). The y intensity values of this graph are acquired by cumulatively adding the pixel values of the registered centerline points and a small area around them to get a value. This results in a different intensity curve following the propagation of contrast agent through the vessel of interest ( Fig. 12 , reference 18). Based on this new intensity curve, a cutoff point for contrast start and end in the cumulative time interval can be determined ( Fig. 12 , reference 19) to calculate the distance and thus the velocity in between, using the calculations as previously defined.
- this intensity curve can be used as a guidance for the user when using the calculation method of (eq. 1) to select frame A and frame B in which the contrast bolus front must be visible.
- the start point may be used to determine the moment of contrast injection in the vessel tree by identifying the frame with maximal contrast intensity at the start point in the image run. This can be used as a suggestion for frame A.
- One approach for instance covers the maximal velocity during a heart cycle by measuring the velocity when the velocity graph is at its peak ( Fig. 11 , reference 13), which makes drawing and detection of the velocity at this area easier.
- the P-wave and the T-wave ( Fig. 11 , reference 14) of the input ECG matching with the input angiographic image it is possible to identify frames in the image run corresponding to the P and T-wave.
- the identification of the T and the P-wave can be either done manually by the user, of automatically detected, for example as described by Mehta, S.S., Lingayat, N.S., "Detection of P and T-waves in Electrocardiogram", In: Proceedings of the World Congress on Engineering and Computer Science 2008 , who use slope detection to identify and filter out first a QRS complex from an ECG signal, followed by using the same technique to detect and filter out the slighter slopes of first the T-wave and finally the P-wave.
- v local is the velocity measured over the vessel segment between the contrast fronts in the given input frames
- s twave the distance measured in the frame corresponding to the T-wave
- s pwave the distance measured in the frame corresponding to the P-wave
- t twave the timestamp of acquisition of the frame corresponding to the T-wave
- t pwave the timestamp of acquisition of the frame corresponding to the P-wave
- v local is the velocity measured over the vessel segment between the contrast fronts in the given input frames and cf is the constant correlation factor.
- the embodiment can be adjusted in such a manner that it is still possible to correct the velocity and obtain the true v mean .
- This approach requires a more extensive analysis to compensate for the fact that no ECG signal is available to give initial guidance to the part of the heart phase being analyzed. For this, it is required to analyze all available image frames between the 'start' frame A and the 'end' frame B. The method requires a velocity matrix and derived from this a velocity graph to be created ( Fig. 7 and Fig. 8 ).
- a velocity graph v(x) with an interval time of a single frame per measured point gives a profile not unlike the generic profile v gen (x) as seen in Fig. 10 .
- v(x) By fitting v(x) to v gen (x), it is possible to determine which part of the heart cycle corresponds to v(x). Once this is known, it is possible to use (eq. 2) and (eq. 3) to establish the true velocity v mean , and after this the volumetric flow Q using (eq. 4).
- the average velocity v mean as computed above over a heart cycle can be the starting point of further calculations and estimations, such as for instance coronary flow reserve (CFR) or computational fluid dynamics (CFD) calculations for instance to assess wall shear stress or pressure drop within the conduit.
- CFR coronary flow reserve
- CFD computational fluid dynamics
- v mean is equal to v local for all further calculations.
- Figure 17 illustrates an example of a high-level block diagram of an x-ray cinefluorograpic system. In this block diagram the embodiment is included as an example how the embodiment could integrate in such system.
- Portions of the system may be implemented with dedicated hardware, analog and / or digital circuitry, and / or one or more processors operating program instructions stored in memory.
- the X-ray system of Fig. 13 includes an X-ray tubes 801 with a high voltage generator 802 that generates an X-ray beam 803.
- the high voltage generator 802 controls and delivers power to the X-ray tube 801.
- the high voltage generator 802 applies a high voltage across the vacuum gap between the cathode and the rotating anode of the X-ray tube 801.
- An X-ray beam 803 consists of photons with a spectrum of energies that range up to a maximum determined by among others the voltage and current submitted to the X-ray tube 801.
- the X-ray beam 803 then passes through the patient 804 that lies on an adjustable table 805.
- the X-ray photons of the X-ray beam 803 penetrate the tissue of the patient to a varying degree. Different structures in the patient 804 absorb different fractions of the radiation, modulating the beam intensity.
- the modulated X-ray beam 803' that exits from the patient 804 is detected by the image detector 806 that is located opposite of the X-ray tube.
- This image detector 806 can either be an indirect or a direct detection system.
- the image detector 806 consists of a vacuum tube (the X-ray image intensifier) that converts the X-ray exit beam 803' into an amplified visible light image.
- This amplified visible light image is then transmitted to a visible light image receptor such as a digital video camera for image display and recording. This results in a digital image signal.
- the image detector 806 consists of a flat panel detector.
- the flat panel detector directly converts the X-ray exit beam 803' into a digital image signal.
- the digital image signal resulting from the image detector 806 is passed through a digital image processing unit 807.
- the digital image processing unit 807 converts the digital image signal from 806 into a corrected X-ray image (for instance inverted and/or contrast enhanced) in a standard image file format for instance DICOM.
- the corrected X-ray image can then be stored on a hard drive 808.
- the X-ray system of Fig. 13 consists of a C-arm 809.
- the C-arm holds the X-ray tube 801 and the image detector 806 in such a manner that the patient 804 and the adjustable table 805 lie between the X-ray tube 801 and the image detector 806.
- the C-arm can be moved (rotated and angulated) to a desired position to acquire a certain projection in a controlled manner using the C-arm control 810.
- the C-arm control allows for manual or automatic input for adjustment of the C-arm in the desired position for the X-ray recording at a certain projection.
- the X-ray system of Fig. 13 can either be a single plane or a bi-plane imaging system.
- multiple C-arms 809 are present each consisting of an X-ray tube 801, an image detector 806 and a C-arm control 810.
- adjustable table 805 can be moved using the table control 811.
- the adjustable table 805 can be moved along the x, y and z axis as well as tilted around a certain point.
- a general unit 812 is also present in the X-ray system. This general unit 812 can be used to interact with the C-arm control 810, the table control 811 and the digital image processing unit 807.
- An embodiment is implemented by the X-ray system of Fig. 13 as follows.
- a clinician or other user acquires an X-ray angiographic image of a patient 804 at a certain projection by using the C-arm control 810 to move the C-arm 809 to a desired position relative to the patient 804.
- the patient 804 lies on the adjustable table 805 that has been moved by the user to a certain position using the table control 811.
- the sequence of X-ray image frames is then generated using the high voltage generator 802, the X-ray tube 801, the image detector 806 and the digital image processing unit 807 as described above. These image frames are then stored on the hard drive 808 or a server.
- the general processing unit 812 calculate local velocities or the average velocity by performing one or more of the operations disclosed above with reference to Fig. 1 and 3 and related variants and combinations. Such velocities can also be calculated by a processing system having access to the hard drive or the server.
- the system comprises memory configured to read a sequence of contrast enhanced image frames of a target conduit, typically a vessel and, one or more processors that, when executing program instructions stored in the memory, are configured to perform the method according to embodiments herein, particularly the operations as disclosed with reference to Fig. 1 and 3 and related variants and combinations.
- the embodiments described herein may include a variety of data stores and other memory and storage media as discussed above. These can reside in a variety of locations, for instance as on a storage medium local to (and/or resident in) one or more of the computers or remote from any or all of the computers across the network. In a particular set of embodiments, the information may reside in a storage-area network ("SAN") familiar to those skilled in the art. Similarly, any necessary files for performing the functions attributed to the computers, servers or other network devices may be stored locally and/or remotely, as appropriate.
- SAN storage-area network
- each device can include hardware elements that may be electrically coupled via a bus, the elements including, for example, at least one central processing unit (“CPU” or “processor”), at least one input device (e.g., a mouse, keyboard, controller, touch screen or keypad) and at least one output device (e.g., a display device, printer or speaker).
- CPU central processing unit
- input device e.g., a mouse, keyboard, controller, touch screen or keypad
- output device e.g., a display device, printer or speaker
- the system may also include one or more storage devices, for instance as disk drives, optical storage devices and solid-state storage devices such as random access memory (“RAM”) or read-only memory (“ROM”), as well as removable media devices, memory cards, flash cards, etc.
- RAM random access memory
- ROM read-only memory
- the devices also can include a computer-readable storage media reader, a communications device (e.g., a modem, a network card (wireless or wired), an infrared communication device, etc.) and working memory as described above.
- the computer-readable storage media reader can be connected with, or configured to receive, a computer-readable storage medium, representing remote, local, fixed and/or removable storage devices as well as storage media for temporarily and/or more permanently containing, storing, transmitting and retrieving computer-readable information.
- the system and various devices also typically will include a number of software applications, modules, services or other elements located within at least one working memory device, including an operating system and application programs, such as a client application or web browser. It should be appreciated that alternate embodiments may have numerous variations from that described above. For example, customized hardware might also be used and/or particular elements might be implemented in hardware, software (including portable software, such as applets) or both. Further, connection to other computing devices such as network input/output devices may be employed.
- Storage media and computer readable media for containing code, or portions of code can include any appropriate media known or used in the art, including storage media and communication media, such as, but not limited to, volatile and non-volatile, removable and non-removable media implemented in any method or technology for storage and/or transmission of information such as computer readable instructions, data structures, program modules or other data, including RAM, ROM, Electrically Erasable Programmable Read-Only Memory (“EEPROM”), flash memory or other memory technology, Compact Disc Read-Only Memory (“CD-ROM”), digital versatile disk (DVD) or other optical storage, magnetic cassettes, magnetic tape, magnetic disk storage or other magnetic storage devices or any other medium which can be used to store the desired information and which can be accessed by the system device.
- RAM random access memory
- ROM read-only memory
- EEPROM Electrically Erasable Programmable Read-Only Memory
- CD-ROM Compact Disc Read-Only Memory
- DVD digital versatile disk
- Processes described herein can be performed in any suitable order unless otherwise indicated herein or otherwise clearly contradicted by context.
- Processes described herein may be performed under the control of one or more computer systems configured with executable instructions and may be implemented as code (e.g., executable instructions, one or more computer programs or one or more applications) executing collectively on one or more processors, by hardware or combinations thereof.
- the code may be stored on a computer-readable storage medium, for example, in the form of a computer program comprising a plurality of instructions executable by one or more processors.
- the computer-readable storage medium may be non-transitory.
Description
- The present disclosure relates to the technical field of medical imaging, particularly angiography imaging, although it can find application in any field where there is the need to quantify flow in a conduit such as in non-destructive testing applications.
- Coronary artery disease (CAD) is one of the leading causes of death worldwide. CAD generally refers to conditions that involve narrowed or blocked blood vessels that can lead to reduced or absent blood supply to the sections distal to the stenosis resulting in reduced oxygen supply to the myocardium, resulting in, for instance, ischemia and myocardial infarction. Myocardial infarction (MI), commonly known as a heart attack, occurs when the blood flow stops to a part of the heart causing irreversible damage to the heart muscle. Approximately 1.5 million cases of MI occur annually in the United States alone.
- Presently, X-ray angiography is the imaging modality used during treatment of stenotic (narrowed) coronary arteries by means of a minimally invasive procedure also known as percutaneous coronary intervention (PCI). During PCI, a (interventional) cardiologist feeds a deflated balloon or other device on a catheter from the inguinal femoral artery or radial artery up through blood vessels until they reach the site of blockage in the artery. X-ray imaging is used to guide the catheter threading. PCI usually involves inflating a balloon to open the artery with the aim to restore unimpeded blood flow. Stents or scaffolds may be placed at the site of the blockage to hold the artery open.
- To have a complete understanding of CAD, a clinician must be able to evaluate coronary anatomy, ventricular function and coronary blood flow. X-ray angiography remains the standard imaging technique for obtaining information on the first two factors. Although visual assessment of percentage diameter percentage diameter coronary stenosis suffers from significant intraobserver and interobserver variability, quantitative coronary analysis (QCA) provides accurate and objective measurement of arterial geometry. The third factor, coronary blood flow, is rarely measured directly.
- A method for assessment of coronary blood flow in the catheterization laboratory is by means of intracoronary Doppler measurements techniques. These techniques involves percutaneously inserting a Doppler-transducing wire inside the coronary artery and measuring the blood velocity inside the coronary artery as described by Bach et al, "Intracoronary Doppler flow velocity measurements for the evaluation and treatment of coronary artery disease", Current Opinion in Cardiology 1995, 10: 434-442. Intracoronary Doppler measurements, however, has some disadvantages. The technique is associated with the additional cost of a Doppler wire which can only be used once. Furthermore, Doppler-based assessment of coronary flow velocity requires additional invasive catheterization with the associated cost and procedure time. Moreover, Doppler-based assessment of coronary flow velocity relies on average peak velocity and does not take into account changes in velocity profile or vessel area which are usually occurring in patients with CAD.
- Coronary blood flow estimation based on X-ray angiographic image data would be preferable, since this would require no additional invasive catheterization with the associated cost and procedure time. For many years, coronary blood flow has been simply assessed by the thrombolysis in myocardial infarction (TIMI) flow grade. This simple qualitative grading of angiographic coronary flow rates to assess the efficiency of reperfusion therapy, such as PCI, has been widely used to gauge the restoration of perfusion in clinical trials "The Thrombolysis in Myocardial Infarction (TIMI) trial. Phase I findings. TIMI Study Group", The New England Journal of Medicine, 1985 April 4, 312(14):932-6. This method assessed the amount of frames required for the contrast to reach a standardized distal coronary landmark in the diseased vessel. This assessment is performed by visually assessing the number of frames within a two-dimensional x-ray angiographic image run, which are required for the contrast to reach a standardized distal coronary landmark of the diseased vessel. The number of frames is based upon an x-ray cine filming rate of 30 frames per second. Thus a frame count of 30 would mean that one second was required for dye to traverse the artery. The TIMI flow grade categorized the patient's coronary flow into one of four different categories namely grade 0 (no flow), grade 1 (penetration without perfusion), grade 2 (partial perfusion) or grade 3 (complete perfusion).
- However, this method is very subjective due to the high observer variability in the determination of the first and last frame used for the TIMI counting. Furthermore, this method is categorical and no continuous angiographic index of coronary flow is given.
- To overcome these limitations, Gibson et al, "TIMI Frame Count: A Quantitative Method of Assessing Coronary Flow", Circulation, Volume 93, ) developed a more objective and continuous variable of coronary blood flow called the corrected TIMI frame count (CTFC).
- In this method the TIMI frame count is adjusted for the vessel length. A correction factor is applied to compensate for the longer length of the left anterior descending artery (LAD) compared with the circumflex and the right coronary arteries as described in Appelby et al, "Importance of the TIMI frame count: implications for future trials", Curr Control Trials Cardiovasc Med. 2000; 1 (1): 31 - 34.
- However, this corrected version is still based on the visual assessment of the frames by the clinician. Furthermore several variables such as injection force, sex, hemodynamics, body size and contrast agent type may impact the CTFC as for instance described in Abaci et al, "Effect of potential confounding factors on the thrombolysis in myocardial infarction (TIMI) trial frame count and its reproducibility", Circulation 100 (22): 2219-2223.
- To develop a more robust quantification of coronary blood flow various research in the field of coronary velocity determination for angiography has taken place over the years. A good overview of most early work in this field can be found in Shipilfoygel et al, "X-ray videodensitometric methods for blood flow and velocity measurement: A critical review of literature", Medical Physics . This article gives an overview of several different approaches in the determination of coronary velocity and flow.
- Sphilfougel et al distinguish two major classes of blood flow velocity algorithms; tracking algorithms and computational algorithms. The latter class, the computational algorithms, make use of models, mass and volume equations. These approaches rely on assumptions of for instance mass and volume, and/or require additional information, which make these methods not suitable for fast assessment of coronary blood flow in a clinical setting such as during a coronary intervention in a catheterisation laboratory.
- Several tracking algorithms are available, which focus on the displacement of the contrast bolus in the vessel. The bolus transport time algorithms determine the velocity by measuring the time that it takes for the bolus to travel from one fixed location to a second fixed location within the vessel. This method is not robust for pulsatile flows and requires densitometric information for all frames at two locations to acquire two bolus density curves. To achieve these bolus intensity curves, accurate tracking of the measurement locations in all frames is required and this computational expensive and time consuming. The continuous velocity determination from two-dimensional time-distance parametric images algorithms are too complex to apply in a clinical case. The droplet technique is not applicable into a clinical setting because of the injection method that is required by this method does not match clinical practice. From Sphilfougel, the drawbacks of several techniques can be learned, such as that most methods focus on bolus displacement between subsequent frames, this is not suitable for pulsatile flows. Another approach focus on the contrast concentration during a whole cardiac cycle and an empirical determined densitometric level is used to determine the traveled bolus distance. The latter method is sensitive for local densitometric deviations.
- A similar approach based on bolus arrival time is used more recently by Ten Brinke et al, "A Method towards Automated Thrombolysis in Myocardial Infarction (TIMI) Frame Counting Using 3D Reconstruction", Computers in Cardiology 36, p. 653-656, 2009. In this article, Ten Brinke determines the TIMI frame count (a measure of velocity) by drawing and following a centerline through multiple image frames through time, and deriving the mentioned frame count by following decreases in contrast intensity over time. In addition to this, Ten Brinke uses a 3D reconstruction of the coronary vessel to improve distance measured along the coronary vessel. This method is usually called a bolus arrival time based method, as it keeps track of a couple of fixed spatial points over time and marks the moments in time when changes in the points occur.
- A similar method is used by
Fieselmann et al in German Patent Application DE102011083708 . This document discloses a method for the assessment of contrast diffusion in angiography images to determine and visualize blood flow parameters such as for instance blood flow, blood flow velocity and contrast agent dispersion. This method also relies on two spatially fixed points, and measures the passage of contrast agent in those two points. In this case, the measurements combined with distance are not only used to get velocity rates, but also to get a contrast agent dispersion variable, which is used for calculating the volume in which the contrast has spread, being an indirect indication of flow and velocity. - However, the approaches described above to assess coronary blood flow by means of X-ray Angiography, suffer from several limitations.
- First, most methods focus on two or more spatially fixed points and track the intensity changes of those points through time. Making these approaches very vulnerable to the temporal resolution (cine framerate) of the x-ray angiographic acquisition system. Since the introduction of TIMI, the cine framerate gradually decreased to 7.5 - 15 frames per second, due to technical improvements with the aim to reduce X-ray exposure to the patient. This reduction in cine framerate introduced two drawbacks in the assessment of coronary flow by TIMI frame count and method similar. With respect to TIMI frame count, the standardized method to assess blood flow only applies with a cine framerate of 30 frames per second. More importantly, reduction in cine framerate directly negatively effects the temporal resolution of x-ray angiography. For instance, a cine framerate of 7.5 frames per second results in a temporal resolution of 133 milliseconds as compared to 33 milliseconds as obtained with 30 frames per second. In normal use of a cine framerate of 15 frames per second, large offsets in measured coronary flow velocity can arise depending on the time interval chosen and the exact moment of acquisition.
- Secondly, for automatic approaches such as Ten Brinke and Fieselman, robust image registration is needed, as coronary vessels are constantly in motion due to for instance the cardiac cycle, breathing cycle, and patient movements.
- To summarize, all the above methods have a dependency on temporal resolution for their accuracy, require image registration or are limited in timing scope by the positions of the reference points chosen. Furthermore some methods require biplane image acquisition.
- There is therefore a need for a more accurate, fully objective and reproducible approach to determine blood velocity in X-ray angiographic images.
- It is thus an object of embodiments herein to accurately determine the flow velocity in a conduit from sequences of two-dimensional or three-dimensional images, particularly blood velocity in a vessel from two-dimensional angiographic images, which is independent on temporal resolution and biplane image acquisition and can cope with conduit movement.
- In accordance with embodiments herein, devices, computer program products and computer implemented methods are provided for quantitative flow analysis of a fluid flowing in a conduit from sequences of consecutive image frames of such a conduit, which image frames are timely separated by a certain time interval, the devices, program products and methods comprising, under control of one or more computer systems configured with specific executable instructions,
- a) selecting a start frame and an end frame from the sequence either automatically or upon user input;
- b) determining a centreline of the conduit in the start frame;
- c) determining a centreline of the conduit in the end frame;
- d) selecting a common start point on the centreline of the start frame and on the centreline of the end frame either automatically or upon user input;
- e) selecting an end point on the centreline of the start frame;
- f) selecting an end point on the centreline of the end frame;
- g) calculating centreline distance between start point and end point of the start frame;
- h) calculating centreline distance between start point and end point of the end frame;
- i) calculating a local flow velocity as a function of centreline distances and time interval between start frame and end frame.
- The sequence of image frames contains information for determining the distribution over time of a contrast agent travelling in the conduit, the start frame and the end frame relating to a different distribution of contrast agent in the conduit from a proximal point to a distal point located on the centreline of the start frame and of the end frame. The end point in the start frame and the end point in the end frame are identified by the front of the contrast agent distal to the common start point.
- In an advantageous configuration, intensity versus centreline distance graphs from the start point are calculated in both start and end frame. The end point can thus be selected by setting a threshold and identifying the centreline distance corresponding to the point having intensity equal to such a threshold.
- The common start point in start and end frame may be advantageously selected by performing one or more operations selected from the group consisting in: automatically detecting tip of a contrast injection catheter, automatically detecting an anatomical point such as point of a vessel bifurcation, elaborating a user input.
- The sequence of image frames preferably contains digitally subtracted image frames or the method further comprise the step of digitally subtracting the image frames of the sequence from a mask frame or multiple mask frames to obtain digitally subtracted image frames to enhance the flow in the conduit and thus increase the resolution.
- According to an embodiment, a local velocity is calculated based on different frame selection to provide a map of velocities as a function of time.
- Alternatively or in combination, the velocity as calculated in step i) is adjusted by a correlation factor to determine an average velocity over a period of time. When the conduit is a blood vessel, the sequence preferably comprises bi-dimensional or three-dimensional image frames covering one or more heart cycles and the average velocity is calculated over a period of time comprised in the heart cycle.
- The correlation factor can be calculated, for example, by processing an input database of known velocity profiles.
- Advantageously, the local velocity or the average velocity is propagated to other segments of the conduit to estimate velocity in such segments, for example for those parts that are hidden or masked and thus cannot be properly seen in the image frames.
- More in general the local velocities may be used for further quantitative processing, for example for volumetric flow analysis, CFR, CFD or the like calculations.
- Embodiments also relate to a computer product directly loadable into the memory of a digital computer and comprising software code portions for performing the method according to embodiments herein when the product is run on a computer.
- According to an aspect, embodiments relate to an imaging device, typically a X-ray or MRI device, more typically an X-ray device for angiography, for acquiring contrast enhanced two dimensional or three dimensional sequences of image frames, the device comprising an acquisition module for obtaining a plurality of image frames of a vessel perfused by a contrast agent, a timing module for driving the acquisition module to obtain image frames temporally shifted of a known time interval after a trigger event, input for receiving from the user indication for the selection of a start frame and an end frame of the sequence and/or a selection module for automatically selecting a start frame and an end frame of the sequence, the device further comprising a processor programmed to:
- a) determine a centreline of the vessel in the start frame;
- b) determine a centreline of the vessel in the end frame;
- c) select a common start point on the centreline of the start frame and on the centreline of the end frame either automatically or upon user input;
- d) select an end point on the centreline of the start frame;
- e) select an end point on the centreline of the end frame;
- f) calculate centreline distance between start point and end point of the start frame;
- g) calculate centreline distance between start point and end point of the end frame;
- h) calculate a local flow velocity as a function of centreline distances and time interval between start frame and end frame.
- Embodiments herein provide that the common start point in start and end frame is selected by performing one or more operations selected from the group consisting in: automatically detecting tip of a contrast injection catheter, automatically detecting an anatomical point such as point of a vessel bifurcation, elaborating a user input.
- The end point in start and end frame may be selected by elaborating a user input and/or automatically detecting drop points in graphs representing intensity versus centreline distance from the start point in both start and end frame.
- The imaging device may advantageously comprise a digital subtraction angiography module configured to compute a mask frame and subtract such a mask frame or multiple mask frames from the image frames to obtain a sequence of flow-enhanced frames.
- According to embodiments herein, the device further comprises an ECG module to synchronize acquisition with heart cycle, the processor being configured to calculate local velocities for a plurality of couples of image frames of the sequence related to one or more heart cycles.
- The inventors have recognized that an image sequence acquired by an X-ray system contains two different temporal resolutions. First, the amount of frames acquired during one second is defined as the cine frame rate resulting in a temporal cine frame rate resolution (tcineframe ). Second, the duration required to acquire a single frame within a cine image run (tacquisition ). In current state of the art X-ray angiographic system, the tacquisition is in the order of a few milliseconds. Furthermore, the inventors have recognized that the tacquisition is independent from tcineframe. Therefore in one of the embodiments, this difference in temporal resolutions is exploited by assessment of the coronary artery contrast bolus front within an x-ray angiographic frame (having a temporal resolution of tacquisition ), and being less dependent on tcineframe. The contrast bolus front is the furthest distal (downstream the vessel tree) position in the vessel of interest in a given angiographic frame in which the contrast is still visible. Furthermore, some embodiments are able to determine blood velocity on an acquisition frame to frame basis, and take into account effects caused by the heart contraction cycle.
- The characteristics of the embodiments herein and the advantages derived therefrom will be more apparent from the following description of non-limiting embodiments, illustrated in the annexed drawings, in which:
-
Fig. 1 shows a flow chart of a method for determining flow velocity in accordance with an embodiment herein. -
Fig. 2 shows an example of x-ray cinefluorographic unit block diagram in accordance with an embodiment herein. -
Fig. 3 shows a flow chart of a method for determining flow velocity in accordance with an another embodiment herein. -
Fig. 4 shows the selection of the start and end frame from a two-dimensional angiographic image run. -
Fig. 5 shows an example of a mask frame that is subtracted from an angiographic frame to result in a subtracted frame. -
Fig. 6 shows the centreline creation along the contrast agent. -
Fig. 7 shows a matrix containing selected vlocal values for various combinations of input image frames. -
Fig. 8 shows a graph containing all vlocal values per frame and their matching with the ECG-signal. -
Fig. 9 shows an example of different intervals within one heart cycle. -
Fig. 10 shows an averaged velocity graph matched to a generic ECG profile. -
Fig. 11 shows an example of a generic blood velocity profile linked to a heart phase in the form of an ECG diagram including the P- and T- wave. -
Fig. 12 shows an example of an alternative method to determine velocity based on centreline tracking through a heart cycle. -
Fig. 13 shows a functional block diagram of an exemplary single plane angiographic system. -
Fig. 1 and3 show flow charts illustrating the operations according to embodiments of the present application. The operations employ an imaging system capable of acquiring and processing two-dimensional images of a vessel organ (or portion thereof) or other object of interest. For example a single plane angiographic system can be used as those manufactured, for example, by Philips (Allura Xper FD). -
Fig. 2 is a functional block diagram of an exemplary single plane angiographic system, which includes anangiographic imaging apparatus 112 that operates under commands fromuser interface module 116 and will provide data todata processing module 114. The single planeangiographic imaging apparatus 112 captures a two-dimensional X-ray image run of the vessel organ of interest for example in the postero-anterior (PA) direction. The single planeangiographic imaging apparatus 112 typically includes an X-ray source and detector pair mounted on an arm of a supporting gantry. The gantry provides for positioning the arm of the X-ray source and detector at various angles with respect to a patient who is supported on a table between the X-ray source and detector. Thedata processing module 114 may be realized by a personal computer, workstation or other computer processing system. Thedata processing module 114 includes one or more processors and memory that stores program instructions to direct the one or more processors to perform the operations described herein. Thedata processing module 114 also includes a display to present information to a user, such as the images, indicia, data and other information described herein and illustrated in the figures. Thedata processing module 114 also includes a user interface to receive inputs from the user in connection with operations herein, such as controlling operation of theimaging apparatus 112, selecting projection perspectives to be used when obtaining complementary images and the like. Thedata processing module 114 may correspond to or include portions of one or more of the systems described within the patents and publications referenced herein. Thedata processing module 114 processes the two-dimensional image captured by the single planeangiographic imaging apparatus 112 to generate data as described herein. Theuser interface module 116 interacts with the user and communicates with thedata processing module 114. Theuser interface module 116 can include different kinds of input and output devices, such as a display screen for visual output, a touch screen for touch input, a mouse pointer or other pointing device for input, a microphone for speech input, a speaker for audio output, a keyboard and/or keypad for input, etc. Thedata processing module 114 and theuser interface module 116 cooperate to carry out the operations ofFig. 1 or3 as described below. The operations ofFig. 1 or3 can also be carried out by software code that is embodied in a computer product (for example, an optical disc or other form of persistent memory for instance an USB drive or a network server). The software code can be directly loadable into the memory of a data processing system for carrying out the operations ofFig. 1 or3 . - The embodiments are now disclosed in details by way of a non-limiting example. In this example, it is assumed to have at disposal a two-dimensional angiographic image run of an object of interest (S1, 201). For example the two-dimensional angiographic image data may be obtained in real time from an angiographic imaging system. Optionally, pre-recorded two-dimensional angiographic image data may be obtained from a local memory, a database, a network server or otherwise. This two-dimensional angiographic image run contains multiple frames covering multiple heart phases. Any image device capable of providing two-dimensional angiographic image runs can be used for this purpose. For example a single plane angiographic system can be used such as those manufactured, for example, by Philips (Allura Xper FD).
- From the acquired two-dimensional angiographic image run (S1), subtraction frames are preferably calculated to enhance the flow (S2) and a start frame A and end frame B are selected (203) as it can be seen in
Fig. 4 . Then a centerline along a vessel of interest is indicated in the selected two frames (205, 207) of the image run (S3). From this input, blood velocity can be determined in the vessel of interest. The velocity is determined by looking at a combination of distance covered over time between frames (S4, 219). An optional translation based on the time between frame A and frame B in relation to the cardiac heart cycle can be performed as shown in operation S5. The information on the cardiac heart cycle can be determined, for example, from an Electrocardiography (ECG) signal linked to the two-dimensional angiographic image run. This results in a patient specific, heart phase independent, blood vessel velocity value (S6). These separate steps, and some variations on these basic steps of the embodiment, are described below. - The embodiment uses X-ray angiographic image analysis to determine average blood velocity in a targeted blood vessel or vessel of interest. Therefore, subtraction angiographic frames and ECG signal corresponding with the X-ray angiographic image run are preferred for the optimal performance of the blood velocity determination method as shown in S2 and 202. This step contributes to enhance image flow quality, but can be obviously omitted. Other imaging modalities can be used, for example MRI or computed tomography or x-ray rotational angiography, to obtain similar results.
- In traditional X-ray angiography, images are acquired by exposing an area of interest with time-controlled X-rays while injecting contrast medium into the blood vessels. The image obtained would also include all overlying structure besides the blood vessels in this area. This is useful for determining anatomical position and variations, but unhelpful for visualizing blood vessels accurately. Digital subtraction angiography (DSA) uses a computer technique which compares an X-ray image of a region of the body before and after radiopaque iodine based dye has been injected intravenously into the body. Tissues and blood vessels on the first image are digitally subtracted from the second image (mask frame, the image which contains no radiopaque iodine), leaving a clear picture of the artery which can then be studied independently and in isolation from the rest of the body.
- DSA can for instance be calculated from the two-dimensional angiographic image run and most X-ray angiographic systems include an imaging protocol to directly generate DSA. However, DSA uses a static mask frame and is therefore not able to compensate for cardiac motion which occurs during the acquisition.
- Another method for the creation of a subtraction image run is for instance based on Digital Imaging and Communications in Medicine (DICOM) information that is available for the image run. DICOM is a standard for handling, storing, printing and transmitting information in medical imaging. It includes a file format definition and a network communications protocol. For instance an ECG data, represented as a list of points, can be stored in the DICOM.
- If the angiographic image run has ECG information available in the DICOM, and the contrast injection starts after a full heart cycle within the X-ray angiographic image run, multiple mask frames can be created using this heart cycle before contrast injection. This moment of contrast injection is henceforth referred to as Tc. When not indicated by the user, alternatively, this Tc can be detected automatically by methods described in literature, for example by Chen et al, "Robust and fast contrast inflow detection for 2D x-ray fluoroscopy". MICCAI 2011, . In this article, a vesselness filter working on first order derivative responses which occur when a vessel is filled with contrast agent, detects the number of vessels. By monitoring the response of such a vesselness filter, which shows a large increase at the moment of contrast injection, as vessels suddenly become visible, the moment of contrast injection can be pinpointed. By matching frames after contrast injection to a moment in the ECG heart cycle, one or more specific mask frames (
Fig. 5 , reference 24) can be subtracted from one or more angiographic frames (Fig. 5 , reference 23) after contrast injection. This removes any movement in the patient caused by for instance cardiac motion, and creates one or more improved subtraction frames (Fig. 5 , reference 25). Alternatively, if no complete heart cycle or if no ECG graph is available before the moment of contrast injection Tc as determined above, a single mask frame is computed by determining a maximum intensity frame from all time frames before the moment of measurement (subtraction start frame). Such maximal intensity frame mask is created by looking at every pixel through the number of input frames, and assigning the maximum pixel value to the pixel at the same position in the mask frame. Any contrast already injected also causes a drop in image intensity, and will not show up in this maximal intensity mask. - In the subtracted image run, or in the original sequence, two frames can be selected as shown in
Fig. 4 . One frame, representing the image within the image run showing the contrast bolus front proximal the vessel of interest (A), and one frame further down the target vessel representing the image within the image run showing the contrast bolus front distal to the vessel of interest (B). - Optionally, the start frame A can be selected automatically being the frame in which the contrast injections starts (Tc). The end frame B can be selected manually, or set at a fixed time subsequent to frame A, for example an entire heart cycle, based on heart rate or the ECG signal of the patient.
- In both these frames A and B, a centerline is created along the contrast agent including the contrast bolus front (
Fig. 6 , reference 2), starting from a start point in both frames (Fig. 6 , reference 1) as shown in operation S3 ofFig. 1 or 205, 207 ofFig. 3 . This starting points in frame A and B should represent an identical anatomical position (Fig. 3 , reference 209), which can be achieved using several methods known in the art. - For instance, by automatically detecting the tip of the contrast injection catheter as anatomical position in both images as taught in Zweng, M., Fallavolita, P., Demicri, S., ea, "Automatic guide-wire detection for neurointerventions using low-rank sparse matrix decomposition and denoising", Augmented Environments for Computer-Assisted Interventions pp 114-123, December 2015 or Wang, P., Ecabert, O., Chen, T. et al, "Image-based Co-registration of Angiography and Intravascular Ultrasound Images", In: IEEE Transactions on Medical Imaging, vol. 32, no 12, December 2013, which uses subtraction images with noise filtering and a robust principal component analysis to determine regions of interest in which the guide wire might be present, resulting in a binary image of the guide wire. This method makes selecting an anatomically identical point at the start of the vessel tree very reliable.
- Alternatively, if a starting point further down the vessel tree is desired than the catheter tip, an automatically detected point of a bifurcation is a second method to get an anatomically matching starting point. This point of bifurcation detection can for instance be detected as described in
US 8,086,000 . In this patent a bifurcation is detected by deriving the contours and centreline of the vessel and determining the start and end of bifurcation. Then the angles between the various branches of the bifurcation are determined and the position of the centre of bifurcation is determined. - As another alternative method, the starting points can be indicated manually by the user.
- The created centerline (
Fig. 6 , reference 4) must continue until and through the visible contrast agent front (Fig. 6 , reference 3), travelling through the target vessel. The intensity profile along this centerline can be plotted into distance/ intensity graphs, resulting in graphs as can be seen inFig. 6 ,reference 6. The intensity values of these graphs are calculated by averaging the intensities within a small region of interest around every point on the centerline (Fig. 6 , reference 15). - An end point (representing the contrast bolus front within the conduit) based on contrast intensity can, for instance, be manually indicated by the user (
Fig. 3 ,reference 211, 213). The user can for instance indicate an end point in the angiographic frame or in the distance/intensity graphs (Fig. 6 , reference 6). - Alternatively, an end point can be automatically defined. Along the vessel centerline, small regions of interest extending slightly beyond the vessel borders are defined, as earlier described in S3, 211, 213 and
Fig. 6 ,reference 15. By extending these regions a little further away from the centerline through the vessel borders (Fig. 6 , reference 15), it is possible to include both a part of the vessel and a part of the background in such region. As such, these regions of interest will cover two regions; the region within the vessel (dark) as well as the region outside of the vessel (background, light). As long as the vessel is filled with contrast, the inside of the vessel will remain dark (Fig. 5 , reference 27). The part of the vessel in which the contrast bolus front still needs to travel (Fig. 5 , reference 30), will be the same intensity as the background (light) (Fig. 5 , reference 32). This is best captured by computing the standard deviation-distance graph (Fig. 6 reference 16). In this graph the standard deviation within each region of interest around every point on the centerline (Fig. 6 , reference 15) is calculated, which will drop once the contrast bolus front is reached. This drop point (end point) can be automatically detected, marking the contrast bolus front with greater reproducibility than by visual determination. The end point locks a distance which the contrast agent travelled with a temporal resolution of tacquisition of the given frame. As tacquisition for typical X-ray imaging systems is in the range of milliseconds, this creates a very accurate moment of imaging in time and a very accurate distance measurement of the contrast agent. The automatic detection of the above mentioned drop point can be based on a predefined threshold value within the standard deviation-distance graph. Alternatively a combined standard deviation-intensity distance graph can be computed (Fig. 6 , reference 17), for instance by multiplying the distance graph with the standard deviation graph. This graph will emphasize the drop location. The drop point can be defined as the location of the maximum absolute derivative of the combined standard deviation-intensity distance graph (Fig. 6 , reference 18). - Given the contrast agent presence in both frames, this is combined with the time interval between the frames to generate a velocity in the blood vessel between the two marked end points as described in operation S4 or 219:

- In which vlocal is the velocity measured over the vessel segment between the contrast fronts in the given input frames, s1 the distance measured in the first frame (frame A), s2 the distance measured in the second frame (frame B), t1 the timestamp of the start of acquisition of the first frame, and t2 the timestamp of the start of acquisition of the second frame. These timestamps can, for instance, be extracted from appropriate fields in the DICOM file.
- The distance s is the distance from the start point to the contrast bolus front (end point) along the centerline of the vessel (
Fig. 3 ,reference 215 and 217). This can for instance be done by determining the Euclidian distance along the centerline between the two points. - Optionally, the distance along the centerline s can be optimized by using an automatically detected centerline using vessel detection algorithms as for instance described in Gronenschild et al, "CAAS II: A Second Generation System for Offline and On-line Quantitative Coronary Angiography", Catheterization and Cardiovascular Diagnosis 33: 61-75 (1994). This creates a more reliable two-dimensional distance measurement along the given input centerline than is the case in a manually defined centerline. In this method the previously (manually) defined centerline is used as an input. Then quantitative analysis based on pixel intensities is performed using the input centerline to determine the segmentation edges of the vessel. The updated centerline is then defined as the center of the detected segmentation edges.
- Optionally, it is possible to create a matrix of selected vlocal values for various combinations of input frames A and B. Such a matrix gives an overview of vlocal behavior for different selections of frames, and creates insight in how the vlocal changes when measured over different parts of the cardiac cycle as can be seen in
Fig. 7 . Plotting in a graph for example all vlocal values calculated using for instance a single frame difference between frame A and frame B subsequent for all the frames within a full cardiac cycle, represents the velocity change during the cardiac cycle as contrast agent propagates through the target vessel as can be seen inFig. 8 , further known as 'full velocity profile'.Figure 8 illustrates what can be achieved by this invention; the creation of a full velocity profile as a combination of multiple local velocities (vlocal) within a heart cycle. - The full velocity profile has a patient independent profile shape. One or more profiles were used to create a generic, averaged full velocity profile. In which each full velocity profile was normalized on the basis of the minimum and maximum values of the velocity found.
- Furthermore, the ECG signal corresponding to the full velocity profiles are also averaged to create a generic ECG signal.
- This results in a generic full profile f(x) (
Fig. 10 , reference 8) for one heart cycle matched to the generic ECG signal (Fig. 10 , reference 9). The heart cycle is advantageously normalized: the start of the heart cycle ("0") corresponds to R peak of the ECG profile while the end of the heart cycle ("1") corresponds to next R peak of the ECG profile. - Optionally these patient independent generic full profiles can be created by preselecting the full profiles that were used to create a generic, averaged full velocity graph based on different coronary vessel tree structures, such as right dominant, left dominant, small right dominant and balanced. These coronary vessel tree difference in relation to the coronary dominant type are in detailed described by Dodge et al, "Lumen diameter of normal human coronary arteries: influence of age, sex, anatomic variation, and left ventricular hypertrophy or dilation", Circulation 1992; 86: 232-246.
- In case the vlocal is computed within a part of the cardiac cycle, vlocal does not represent the average blood velocity for that patient. In this situation the time interval over which the vlocal value has been determined is dependent on a corresponding section of the heart phase. In different sections of the heart phase the vlocal value can therefore be an over- or under estimation as related to the average blood velocity of the patient as can be seen in
Fig. 9 . The vlocal corresponding to interval (20, withinFig. 9 ) is for instance different compared to the vlocal corresponding to interval (21 withinFig. 9 ). Therefore the vlocal needs to be corrected to an average velocity value vmean over an entire heart cycle (22 withinFig. 9 ). For this translation method (Fig. 1 , S5), the generic full velocity profile is used. The full velocity profiles can be obtained from different patients for instance through a database and have corresponding ECG signals. - The generic full velocity profile (f(x)) is a powerful tool in translating the vlocal to the vmean. It is used to calculate a correlation factor cf for the vlocal to obtain vmean This correlation factor is based on a normalized integral over the part of the heart cycle covered:

- In which f(x) represents the generic full velocity profile and start and end are the start and end frame times within the normalized heart cycle [0, 1]. In other words, start and end are the start and end frame times converted to heart phase position of the frames A and B in which vmean needs to be calculated.
- This conversion is needed to match the input frames to a certain time moment in the generic, normalized velocity profile. This can be done for instance by detecting the R peaks of the QRS complex (see
Fig. 11 ) as taught by Manikandan et al "A novel method for detecting R-peaks in electrocardiogram (ECG") signal", Biomedical Signal Processing and Control 7 (2012) 118-128. - When all the R peaks in an image run are detected, their corresponding frame numbers are known. Therefore, the interval spanned between the start and end frame can be linked to an interval relative to the detected R peaks. The interval between two R peaks is normalized to an interval between 0 and 1, and the interval between the start and end frame is normalized with the same ratio, resulting in an interval relative to the heart phase.
- The average velocity vmean can then be calculated as:

- In which vlocal is the velocity measured over the vessel segment between the contrast fronts in the given input frames and cf is the correlation factor.
- An average velocity vmean can also be used to calculate a volumetric flow value Q following the standard equation:

- In which of is the diameter of the vessel in which vmean is calculated.
- The diameter of the vessel should correspond to the average diameter over the vessel segment analyzed. To achieve this, the value can be manually set for instance by drawing a line in the two-dimensional angiographic frame.
- Alternatively, the average diameter can also be detected automatically, for example by the detection algorithms described in
US8787641 . For this detection algorithm, the centerline used as input in S3, 205, 207 can be used as an input. This redefines the centerline, but as it also detects vessel borders, it can also be used to create a diameter graph along the centerline. Of such graph, an average diameter can be derived. - The embodiment is not dependent on the temporal resolution (tcineframe) as defined by the image cine frame rate (which might be limited to 7.5 frames per second), but only by the temporal resolution of the shutter of the imaging system (tacquisition), which lies considerably higher usually around 20 milliseconds.
- Several possible variations on the embodiment as described above can be defined. These variations are added to the normal flow as described above in
Fig. 1 or3 . The variations can be applied separately from each other, or together as multiples. A more detailed description of each variation is described below. - Optionally, a 3D model may be used for correction of two-dimensional distances. In this case, one or multiple 3D models mapped to the two-dimensional centerlines available in the start and the end frame needs to be available.
- Instead of measuring two-dimensional distances along the centerlines (for instance Euclidian distances), 3D distances in the 3D model from and to the corresponding mapped two-dimensional points are calculated, allowing a better distance estimation.
- To do this, a match has to be established between the 3D model and the angiographic image run. First, the 3D model is positioned such that the patient position is equal to the patient position of the image run. Preferably, a frame of the image run is chosen wherein the heart phase of the frame is matched to that of the 3D model. If for instance, the 3D model is derived from CT data, the data is recorded during one specific moment within the heart phase, whereas the two-dimensional image run contains multiple heart phases. Aligning the heart phase ensures a better matching.
- The 3D model is then back projected onto the chosen two-dimensional frame as taught by for instance Lay, "Linear algebra and its applications", 2012, 4th edition, p. 142-143, Addison-Wesley Longman. This can be done using a 3D centreline model or a 3D lumen model.
- To simplify the matching of the back projected 3D model to the two-dimensional frame, the lumen in the two-dimensional frame is emphasized. This can be done using a vesselness filter which takes into account the diameters of the lumen that need to be found in the image, for instance Frangi, "Multiscale vessel enhancement filtering", In Medical Image Computing and Computer-Assisted Intervention - MICCAI 1998, Lecture Notes in Computer Science, Vol 1496 pp 130-137. These diameters can be retrieved directly from the 3D model in case of a lumen-model. When only the centreline is extracted an educated guess of the corresponding diameters can be made using literature about the diameters Dodge et al, "Lumen diameter of normal human coronary arteries: influence of age, sex, anatomic variation, and left ventricular hypertrophy or dilation", Circulation, 1992: 82: 232-246. This results in a two-dimensional vesselness image.
- The matching between the two-dimensional computed vesselness image and the back projected 3D model is performed by calculating the costs of the mismatch between the back projected 3D centreline model and the two-dimensional vesselness centrelines. For every back projected 3D point, a cost is determined. This cost is for instance the Euclidian distance to the nearest-neighbour point. The total cost for the match between this back projected 3D centreline model and the two-dimensional vesselness image is a summation of the cost for all points of the back projected 3D centreline model.
- The minimum cost represents the best match between the back projected 3D model and the two-dimensional frame. Using this match, the 3D centreline can be used to correct the two-dimensional distance between the two-dimensional points.
- In addition to calculating an average velocity vmean in a vessel of interest, the velocity in other parts of the same vessel tree can be calculated, granting access to velocity in vessels even if not properly visible in angiography or part of a 3D model.
- This is done by indicating one or more vessel segments of interest (SOI) in (part of) the vessel tree of the patient as well as indicating the segment of the vessel tree that corresponds to vmean. The (part of) the vessel tree can for instance be indicated in a generic vessel tree retrieved from a database, preferably corresponding to the heart type of the patient or, if available, for instance a patient-specific CT scan.
- The vessel segment belonging to vmean can be indicated manually by the user in (part of) the vessel tree or can be determined automatically. When an annotated 3D model (containing labels for each vessel segment) is available of part or all of the vessel tree, the vessel segment belonging to vmean can be determined by back projecting the 3D model onto the two-dimensional angiographic image as described above.
- Once the vessel segment belonging to vmean is known, propagation of the velocities can be done. As every patient has a heart type which can be determined to be either right dominant, left dominant, small right dominant or balanced as can be seen in
Fig. 10 , based on this heart type every patient has a specific coronary vessel tree with specific relative diameters in the coronary vessel tree as described by Dodge et al, "Lumen Diameter of Normal Human Coronary Arteries. Influence of age, sex, anatomic variation, and left ventricular hypertrophy or dilation", Circulation, Vol 86, ). - Scaling laws then combine diameters for a certain heart type before and after a bifurcation in the vessel tree with a given input velocity to calculate velocity and flow on the other two branches of the bifurcation as described in Huo et al, "Intraspecific scaling laws of vascular trees", J. R. Soc. Interface (2012) 9, 190-200.
- Combining Murray's scaling Law and the preservation of flow Qp = Qd1 + ... + QdN, that is proximal flow is equal to the sum of the distal flows. For a bifurcation this equals:

- Where the r values are the radius of the two distal vessels. Using the diameters of the generic heart models, it is possible to calculate any velocity value through the entire vessel tree. This creates an extra processing step after step S6 of
Fig. 3 . - Optionally image registration can be performed on input angiographic subtraction image frames as an extra processing step in operation S2 of
Fig. 3 . This makes centerline extraction and distance calculation more easy, in particular when the goal is to create a velocity matrix as described inFig. 7 . - Instead of determining multiple intensity profiles (one for each frame as shown in
Fig. 6 , reference 6), an alternative approach is possible in which a single cumulative intensity profile along the vessel is created. For this approach image registration for every frame of the image run is required. Image registration during contrast injection is complex, therefore an alternative approach is used. In this approach as for instance taught by Fischer, B., Bommersheim, S., "Non-rigid image registration", In: http://www.mic.uni-luebeck.de/uploads/ tx_wapublications/ 2006-KOREA-BF.pdf, 2006 non-rigid image registration is performed in a heart cycle after contrast injection. Heart motion is linked directly to the heart cycle. If a blood vessel has been registered for an entire heart cycle after total perfusion of the vessel, the found registration can be mapped back to one or more heart cycles that lie before contrast has entirely perfused the vessel of interest and in which direct registration was impossible. - Every frame (
Fig. 12 , reference 16) in the fully visible vessel tree is mapped to a moment in the heart cycle linked to the ECG signal (Fig. 12 , reference 17), and the same is done during contrast propagation. Then, a fixed number of centerline points is registered along all frames (Fig. 12 , reference 15). These centerline points correspond to the x-axis on a new intensity graph (Fig. 6 ). The y intensity values of this graph are acquired by cumulatively adding the pixel values of the registered centerline points and a small area around them to get a value. This results in a different intensity curve following the propagation of contrast agent through the vessel of interest (Fig. 12 , reference 18). Based on this new intensity curve, a cutoff point for contrast start and end in the cumulative time interval can be determined (Fig. 12 , reference 19) to calculate the distance and thus the velocity in between, using the calculations as previously defined. - Alternatively, this intensity curve can be used as a guidance for the user when using the calculation method of (eq. 1) to select frame A and frame B in which the contrast bolus front must be visible.
- Furthermore, in case of image registration, the start point, registered over time in all possible frames of the image run, may be used to determine the moment of contrast injection in the vessel tree by identifying the frame with maximal contrast intensity at the start point in the image run. This can be used as a suggestion for frame A.
- When image registration is used as described above, this can also be used as a further alternative method to determine identical start points in frame A and frame B by matching the first centerline point in frame A to a registered point in frame B (or vice versa).
- Instead of using a velocity correlation method to calculate the vmean, there are alternative methods to get to a vmean. The main objective of such alternative method is identify the part of the heart phase in which the velocity is measured. The aim is to measure along a set part of the heart cycle, so the vlocal obtained has a fixed correlation factor to get to the vmean.
- One approach for instance covers the maximal velocity during a heart cycle by measuring the velocity when the velocity graph is at its peak (
Fig. 11 , reference 13), which makes drawing and detection of the velocity at this area easier. For instance for the right coronary artery this means measuring the velocity from the P-wave of a heart cycle to the T-wave of the heart cycle as can be seen inFig. 11 . By detecting the P-wave and the T-wave (Fig. 11 , reference 14) of the input ECG matching with the input angiographic image, it is possible to identify frames in the image run corresponding to the P and T-wave. The identification of the T and the P-wave can be either done manually by the user, of automatically detected, for example as described by Mehta, S.S., Lingayat, N.S., "Detection of P and T-waves in Electrocardiogram", In: Proceedings of the World Congress on Engineering and Computer Science 2008, who use slope detection to identify and filter out first a QRS complex from an ECG signal, followed by using the same technique to detect and filter out the slighter slopes of first the T-wave and finally the P-wave. The frames corresponding to the T-wave and P-wave peaks must be used as start and end frames A and B for velocity calculations. This changes (eq. 1) to the following equation for vlocal.
- In which vlocal is the velocity measured over the vessel segment between the contrast fronts in the given input frames, stwave the distance measured in the frame corresponding to the T-wave, spwave the distance measured in the frame corresponding to the P-wave, ttwave the timestamp of acquisition of the frame corresponding to the T-wave, and tpwave the timestamp of acquisition of the frame corresponding to the P-wave.
- Furthermore, as the interval is constant, (eq. 2) is not needed anymore. Instead of this equation, cf is equal to a constant value Cf. which can be used to calculate average vmean as described in (eq. 3):

- In which vlocal is the velocity measured over the vessel segment between the contrast fronts in the given input frames and cf is the constant correlation factor.
- Alternatively, another method to calculate vmean is based on measuring the velocity along one cardiac heart cycle. By mapping the heart cycles to an ECG graph as described above, it is possible to determine the length of the heart cycle measured in number of frames. Once the number of frames between the start frame and the end frame is equal to one heart cycle, the correlation factor cf becomes equal to one, and hence it is possible to state that:

- In case two-dimensional angiographic image runs do not have an ECG graph available, or have a highly irregular or noisy ECG signal, the embodiment can be adjusted in such a manner that it is still possible to correct the velocity and obtain the true vmean. This approach requires a more extensive analysis to compensate for the fact that no ECG signal is available to give initial guidance to the part of the heart phase being analyzed. For this, it is required to analyze all available image frames between the 'start' frame A and the 'end' frame B. The method requires a velocity matrix and derived from this a velocity graph to be created (
Fig. 7 andFig. 8 ). A velocity graph v(x) with an interval time of a single frame per measured point gives a profile not unlike the generic profile vgen(x) as seen inFig. 10 . By fitting v(x) to vgen(x), it is possible to determine which part of the heart cycle corresponds to v(x). Once this is known, it is possible to use (eq. 2) and (eq. 3) to establish the true velocity vmean, and after this the volumetric flow Q using (eq. 4). - The average velocity vmean as computed above over a heart cycle can be the starting point of further calculations and estimations, such as for instance coronary flow reserve (CFR) or computational fluid dynamics (CFD) calculations for instance to assess wall shear stress or pressure drop within the conduit.
- Optionally, the translation of the vlocal to vmean (operation S5 of
Fig. 1 ) can be omitted. In this case, vmean is equal to vlocal for all further calculations. - The embodiment described herein can be used on a standalone system or included directly in, for instance, an x-ray fluorographic system or any other image system to acquire two dimensional angiographic images. Figure 17 illustrates an example of a high-level block diagram of an x-ray cinefluorograpic system. In this block diagram the embodiment is included as an example how the embodiment could integrate in such system.
- Portions of the system (as defined by various functional blocks) may be implemented with dedicated hardware, analog and / or digital circuitry, and / or one or more processors operating program instructions stored in memory.
- The X-ray system of
Fig. 13 includes anX-ray tubes 801 with ahigh voltage generator 802 that generates anX-ray beam 803. - The
high voltage generator 802 controls and delivers power to theX-ray tube 801. Thehigh voltage generator 802 applies a high voltage across the vacuum gap between the cathode and the rotating anode of theX-ray tube 801. - Due to the voltage applied to the
X-ray tube 801, electron transfer occurs from the cathode to the anode of theX-ray tube 801 resulting in X-ray photon-generating effect also called Bremsstrahlung. The generated photons form anX-ray beam 803 directed to theimage detector 806. - An
X-ray beam 803 consists of photons with a spectrum of energies that range up to a maximum determined by among others the voltage and current submitted to theX-ray tube 801. - The
X-ray beam 803 then passes through thepatient 804 that lies on an adjustable table 805. The X-ray photons of theX-ray beam 803 penetrate the tissue of the patient to a varying degree. Different structures in thepatient 804 absorb different fractions of the radiation, modulating the beam intensity. - The modulated X-ray beam 803' that exits from the
patient 804 is detected by theimage detector 806 that is located opposite of the X-ray tube. Thisimage detector 806 can either be an indirect or a direct detection system. - In case of an indirect detection system, the
image detector 806 consists of a vacuum tube (the X-ray image intensifier) that converts the X-ray exit beam 803' into an amplified visible light image. This amplified visible light image is then transmitted to a visible light image receptor such as a digital video camera for image display and recording. This results in a digital image signal. - In case of a direct detection system, the
image detector 806 consists of a flat panel detector. The flat panel detector directly converts the X-ray exit beam 803' into a digital image signal. - The digital image signal resulting from the
image detector 806 is passed through a digitalimage processing unit 807. The digitalimage processing unit 807 converts the digital image signal from 806 into a corrected X-ray image (for instance inverted and/or contrast enhanced) in a standard image file format for instance DICOM. The corrected X-ray image can then be stored on ahard drive 808. - Furthermore the X-ray system of
Fig. 13 consists of a C-arm 809. The C-arm holds theX-ray tube 801 and theimage detector 806 in such a manner that thepatient 804 and the adjustable table 805 lie between theX-ray tube 801 and theimage detector 806. The C-arm can be moved (rotated and angulated) to a desired position to acquire a certain projection in a controlled manner using the C-arm control 810. The C-arm control allows for manual or automatic input for adjustment of the C-arm in the desired position for the X-ray recording at a certain projection. - The X-ray system of
Fig. 13 can either be a single plane or a bi-plane imaging system. In case of a bi-plane imaging system, multiple C-arms 809 are present each consisting of anX-ray tube 801, animage detector 806 and a C-arm control 810. - Additionally, the adjustable table 805 can be moved using the
table control 811. The adjustable table 805 can be moved along the x, y and z axis as well as tilted around a certain point. - A
general unit 812 is also present in the X-ray system. Thisgeneral unit 812 can be used to interact with the C-arm control 810, thetable control 811 and the digitalimage processing unit 807. - An embodiment is implemented by the X-ray system of
Fig. 13 as follows. A clinician or other user acquires an X-ray angiographic image of apatient 804 at a certain projection by using the C-arm control 810 to move the C-arm 809 to a desired position relative to thepatient 804. Thepatient 804 lies on the adjustable table 805 that has been moved by the user to a certain position using thetable control 811. - The sequence of X-ray image frames is then generated using the
high voltage generator 802, theX-ray tube 801, theimage detector 806 and the digitalimage processing unit 807 as described above. These image frames are then stored on thehard drive 808 or a server. Using this X-ray image frames, thegeneral processing unit 812 calculate local velocities or the average velocity by performing one or more of the operations disclosed above with reference toFig. 1 and3 and related variants and combinations. Such velocities can also be calculated by a processing system having access to the hard drive or the server. The system comprises memory configured to read a sequence of contrast enhanced image frames of a target conduit, typically a vessel and, one or more processors that, when executing program instructions stored in the memory, are configured to perform the method according to embodiments herein, particularly the operations as disclosed with reference toFig. 1 and3 and related variants and combinations. - There have been described and illustrated herein several embodiments of a method and apparatus for determining optimal image viewing direction in terms of reduced foreshortening and relevancy of information. While particular embodiments have been described, it is not intended that the invention be limited thereto, as it is intended that the invention be as broad in scope as the art will allow and that the specification be read likewise. For example, the data processing operations can be performed offline on images stored in digital storage, such as a picture archiving and communication system (PACS) commonly used in the medical imaging arts. It will therefore be appreciated by those skilled in the art that yet other modifications could be made to the provided embodiments without deviating from its scope as claimed.
- The embodiments described herein may include a variety of data stores and other memory and storage media as discussed above. These can reside in a variety of locations, for instance as on a storage medium local to (and/or resident in) one or more of the computers or remote from any or all of the computers across the network. In a particular set of embodiments, the information may reside in a storage-area network ("SAN") familiar to those skilled in the art. Similarly, any necessary files for performing the functions attributed to the computers, servers or other network devices may be stored locally and/or remotely, as appropriate. Where a system includes computerized devices, each device can include hardware elements that may be electrically coupled via a bus, the elements including, for example, at least one central processing unit ("CPU" or "processor"), at least one input device (e.g., a mouse, keyboard, controller, touch screen or keypad) and at least one output device (e.g., a display device, printer or speaker). The system may also include one or more storage devices, for instance as disk drives, optical storage devices and solid-state storage devices such as random access memory ("RAM") or read-only memory ("ROM"), as well as removable media devices, memory cards, flash cards, etc.
- The devices also can include a computer-readable storage media reader, a communications device (e.g., a modem, a network card (wireless or wired), an infrared communication device, etc.) and working memory as described above. The computer-readable storage media reader can be connected with, or configured to receive, a computer-readable storage medium, representing remote, local, fixed and/or removable storage devices as well as storage media for temporarily and/or more permanently containing, storing, transmitting and retrieving computer-readable information. The system and various devices also typically will include a number of software applications, modules, services or other elements located within at least one working memory device, including an operating system and application programs, such as a client application or web browser. It should be appreciated that alternate embodiments may have numerous variations from that described above. For example, customized hardware might also be used and/or particular elements might be implemented in hardware, software (including portable software, such as applets) or both. Further, connection to other computing devices such as network input/output devices may be employed.
- Various embodiments may further include receiving, sending, or storing instructions and/or data implemented in accordance with the foregoing description upon a computer-readable medium. Storage media and computer readable media for containing code, or portions of code, can include any appropriate media known or used in the art, including storage media and communication media, such as, but not limited to, volatile and non-volatile, removable and non-removable media implemented in any method or technology for storage and/or transmission of information such as computer readable instructions, data structures, program modules or other data, including RAM, ROM, Electrically Erasable Programmable Read-Only Memory ("EEPROM"), flash memory or other memory technology, Compact Disc Read-Only Memory ("CD-ROM"), digital versatile disk (DVD) or other optical storage, magnetic cassettes, magnetic tape, magnetic disk storage or other magnetic storage devices or any other medium which can be used to store the desired information and which can be accessed by the system device. Based on the disclosure and teachings provided herein, a person of ordinary skill in the art will appreciate other ways and/or methods to implement the various embodiments.
- The specification and drawings are, accordingly, to be regarded in an illustrative rather than a restrictive sense. It will, however, be evident that various modifications and changes may be made thereunto without departing from the scope of the invention as set forth in the claims.
- The use of the terms "a" and "an" and "the" and similar referents in the context of describing the disclosed embodiments (especially in the context of the following claims) are to be construed to cover both the singular and the plural, unless otherwise indicated herein or clearly contradicted by context. The terms "comprising," "having," "including" and "containing" are to be construed as openended terms (i.e., meaning "including, but not limited to,") unless otherwise noted. The term "connected," when unmodified and referring to physical connections, is to be construed as partly or wholly contained within, attached to or joined together, even if there is something intervening. Recitation of ranges of values herein are merely intended to serve as a shorthand method of referring individually to each separate value falling within the range, unless otherwise indicated herein and each separate value is incorporated into the specification as if it were individually recited herein. The use of the term "set" (e.g., "a set of items") or "subset" unless otherwise noted or contradicted by context, is to be construed as a nonempty collection comprising one or more members. Further, unless otherwise noted or contradicted by context, the term "subset" of a corresponding set does not necessarily denote a proper subset of the corresponding set, but the subset and the corresponding set may be equal.
- Operations of processes described herein can be performed in any suitable order unless otherwise indicated herein or otherwise clearly contradicted by context. Processes described herein (or variations and/or combinations thereof) may be performed under the control of one or more computer systems configured with executable instructions and may be implemented as code (e.g., executable instructions, one or more computer programs or one or more applications) executing collectively on one or more processors, by hardware or combinations thereof. The code may be stored on a computer-readable storage medium, for example, in the form of a computer program comprising a plurality of instructions executable by one or more processors. The computer-readable storage medium may be non-transitory.
- Preferred embodiments of this disclosure are described herein, including the best mode known to the inventors for carrying out the invention. Variations of those preferred embodiments may become apparent to those of ordinary skill in the art upon reading the foregoing description. The inventors expect skilled artisans to employ the variations as appropriate and the inventors intend for embodiments of the present disclosure to be practiced otherwise than as specifically described herein. Accordingly, the scope of the present disclosure includes all modifications of the subject matter recited in the claims appended hereto as permitted by applicable law. Moreover, any combination of the above-described elements in all possible variations thereof is encompassed by the scope of the present disclosure unless otherwise indicated herein or otherwise clearly contradicted by context.
Claims (15)
- Computer-implemented method for quantitative flow analysis of a fluid flowing in a conduit from sequences (201) of consecutive image frames of such a conduit, which image frames are timely separated by a certain time interval, the method comprising:a) selecting a start frame (A) and an end frame (B) from the sequence (203);b) determining a centreline (4) of the conduit in the start frame (205);c) determining a centreline (4) of the conduit in the end frame (207);d) selecting a common start point (1) on the centreline of the start frame and on the centreline of the end frame (209);e) selecting an end point on the centreline of the start frame (211);f) selecting an end point on the centreline of the end frame (213);g) calculating centreline distance between start point and end point of the start frame (215);h) calculating centreline distance between start point and end point of the end frame (217);i) calculating a local flow velocity as a function of centreline distances and time interval between start frame and end frame (219),wherein the sequence of image frames (201) contains information for determining the distribution over time of a contrast agent (2) travelling in the conduit, the start frame (A) and the end frame (B) relating to a different distribution of contrast agent in the conduit from a proximal point to a distal point located on the centreline (4) of the start frame (A) and of the end frame (B),
wherein the end point in the start frame and the end point in the end frame are identified by the front (3) of the contrast agent (2) distal to the common start point (1). - Method according to claim 1, wherein intensity versus centreline distance graphs (6) from the start point (1) are calculated in both start and end frame, the end point (7) being selected by setting a threshold and identifying the centreline distance corresponding to the point having intensity equal to such a threshold.
- Method according to any preceding claim, wherein the sequence of image frames contains digitally subtracted image frames or the method further comprise the step of digitally subtracting the image frames of the sequence from a mask frame or multiple mask frames to obtain digitally subtracted image frames to enhance the flow in the conduit (202).
- Method according to any preceding claim, wherein a local velocity is calculated based on different frame selection to provide a map of velocities as a function of time.
- Method according to any preceding claim, wherein the velocity as calculated in step i) is adjusted by a correlation factor to determine an average velocity over a period of time.
- Method according to claim 5, wherein the conduit is a blood vessel, the sequence comprising bi-dimensional or three-dimensional image frames covering one or more heart cycles, the average velocity being calculated over a period of time comprised in the heart cycle.
- Method according to claim 5 or 6, wherein the correlation factor is calculated by processing an input database of known velocity profiles.
- Method according to any claim 5 to 7, wherein the correlation factor is based on a normalized integral over the part of the heart cycle covered according to the following formula

- Method according to any preceding claim, wherein the local velocity or the average velocity is propagated to other segments of the conduit to estimate velocity in such segments.
- A computer product directly loadable into the memory of a digital computer and comprising software code portions for performing the method according to any of the preceding claims when the product is run on a computer.
- Imaging device for acquiring contrast enhanced two dimensional or three dimensional sequences of image frames, the device comprising an acquisition module (112) for obtaining a plurality of image frames of a vessel perfused by a contrast agent, a timing module for driving the acquisition module (112) to obtain image frames after a trigger event, input (116) for receiving from the user indication for the selection of a start frame and an end frame of the sequence and/or a selection module for automatically selecting a start frame (A) and an end frame (B) of the sequence, the device further comprising a processor (114) programmed to:a) determine a centreline (4) of the vessel in the start frame (A);b) determine a centreline (4) of the vessel in the end frame (B);c) select a common start point (1) on the centreline (4) of the start frame (A) and on the centreline (4) of the end frame (B) either automatically or upon user input;d) select an end point on the centreline (4) of the start frame (A);e) select an end point on the centreline (4) of the end frame (B);f) calculate centreline distance between start point and end point of the start frame;g) calculate centreline distance between start point and end point of the end frame;h) calculate a local flow velocity as a function of centreline distances and time interval between start frame and end frame,wherein the end point in start and end frame is selected by elaborating a user input representing the front of the contrast agent and/or automatically detecting drop points in graphs (6) representing intensity versus centreline distance from the start point in both start and end frame.
- Device according to claim 11, wherein the common start point in start and end frame is selected by performing one or more operations selected from the group consisting in: automatically detecting tip of a contrast injection catheter, automatically detecting an anatomical point such as point of a vessel bifurcation, elaborating a user input.
- Device according to any claim 11 to 12, further comprising a digital subtraction angiography module configured to compute a mask frame and subtract such a mask frame or multiple mask frames from the image frames to obtain a sequence of flow-enhanced frames.
- Device according to any claim 11 to 13, further comprising an ECG module to synchronize acquisition with heart cycle, the processor being configured to calculate local velocities for a plurality of couples of image frames of the sequence related to one or more heart cycles.
- Device according to claim 14, wherein the local velocities are used for further quantitative processing, for example for volumetric flow analysis, CFR, CFD or the like calculations.
Priority Applications (3)
| Application Number | Priority Date | Filing Date | Title |
|---|---|---|---|
| EP17171126.0A EP3403582B1 (en) | 2017-05-15 | 2017-05-15 | Method and apparatus for determining blood velocity in x-ray angiography images |
| US15/971,275 US11694339B2 (en) | 2017-05-15 | 2018-05-04 | Method and apparatus for determining blood velocity in X-ray angiography images |
| JP2018089649A JP7133346B2 (en) | 2017-05-15 | 2018-05-08 | Method of operation and imaging device for quantitative flow analysis of fluid flowing through a conduit from a sequence of successive image frames of said conduit |
Applications Claiming Priority (1)
| Application Number | Priority Date | Filing Date | Title |
|---|---|---|---|
| EP17171126.0A EP3403582B1 (en) | 2017-05-15 | 2017-05-15 | Method and apparatus for determining blood velocity in x-ray angiography images |
Publications (2)
| Publication Number | Publication Date |
|---|---|
| EP3403582A1 EP3403582A1 (en) | 2018-11-21 |
| EP3403582B1 true EP3403582B1 (en) | 2023-06-07 |
Family
ID=58709393
Family Applications (1)
| Application Number | Title | Priority Date | Filing Date |
|---|---|---|---|
| EP17171126.0A Active EP3403582B1 (en) | 2017-05-15 | 2017-05-15 | Method and apparatus for determining blood velocity in x-ray angiography images |
Country Status (3)
| Country | Link |
|---|---|
| US (1) | US11694339B2 (en) |
| EP (1) | EP3403582B1 (en) |
| JP (1) | JP7133346B2 (en) |
Families Citing this family (16)
| Publication number | Priority date | Publication date | Assignee | Title |
|---|---|---|---|---|
| WO2017199246A1 (en) | 2016-05-16 | 2017-11-23 | Cathworks Ltd. | Vascular selection from images |
| EP3404614B1 (en) * | 2017-05-15 | 2020-02-26 | Siemens Healthcare GmbH | Method for reconstructing a reconstruction data set of a vessel segment, imaging device, computer program, and storage medium |
| US10580526B2 (en) * | 2018-01-12 | 2020-03-03 | Shenzhen Keya Medical Technology Corporation | System and method for calculating vessel flow parameters based on angiography |
| JP7314183B2 (en) | 2018-06-15 | 2023-07-25 | パイ メディカル イメージング ビー ヴイ | Method and apparatus for quantitative hemodynamic flow analysis |
| CN109770888A (en) * | 2019-03-19 | 2019-05-21 | 苏州润迈德医疗科技有限公司 | The method instantaneously without waveform ratio is calculated based on pressure sensor and contrastographic picture |
| CN109805949B (en) | 2019-03-19 | 2020-05-22 | 苏州润迈德医疗科技有限公司 | Method for calculating fractional flow reserve based on pressure sensor and contrast image |
| US10861157B2 (en) | 2019-04-04 | 2020-12-08 | Medtronic Vascular, Inc. | System and methods for determining modified fractional flow reserve values |
| CN112155580B (en) * | 2019-11-20 | 2021-07-13 | 苏州润迈德医疗科技有限公司 | Method and device for correcting blood flow velocity and microcirculation parameters based on radiography images |
| JP2022549208A (en) * | 2019-09-19 | 2022-11-24 | ライトラボ・イメージング・インコーポレーテッド | Combinatorial imaging system and method |
| CN110786842B (en) * | 2019-11-04 | 2022-10-04 | 苏州润迈德医疗科技有限公司 | Method, device, system and storage medium for measuring diastolic blood flow velocity |
| US11950893B2 (en) | 2020-01-17 | 2024-04-09 | The Research Foundation For The State University Of New York | Apparatus and method of determining dynamic vascular parameters of blood flow |
| US11741599B2 (en) * | 2020-08-10 | 2023-08-29 | Mackay Memorial Hospital | Method for treating arterial stenosis |
| US20220215534A1 (en) * | 2021-01-04 | 2022-07-07 | Shenzhen Keya Medical Technology Corporation | Methods and systems for computer-assisted medical image analysis using sequential model |
| EP4162879A1 (en) * | 2021-10-05 | 2023-04-12 | Koninklijke Philips N.V. | Determining vessel parameters |
| WO2023130197A1 (en) * | 2022-01-04 | 2023-07-13 | Shenzhen Xpectvision Technology Co., Ltd. | Flow speed measurements using imaging systems |
| CN116664564B (en) * | 2023-07-28 | 2023-10-31 | 杭州脉流科技有限公司 | Method and device for acquiring blood flow based on intracranial medical image |
Family Cites Families (11)
| Publication number | Priority date | Publication date | Assignee | Title |
|---|---|---|---|---|
| JPS60190968A (en) * | 1984-01-30 | 1985-09-28 | マリンクロツド・インコ−ポレイテツド | Catheter for contrast photographing of coronary arteries |
| US5150292A (en) * | 1989-10-27 | 1992-09-22 | Arch Development Corporation | Method and system for determination of instantaneous and average blood flow rates from digital angiograms |
| US7072515B2 (en) * | 2001-01-26 | 2006-07-04 | Rensselaer Polytechnic Institute | Method and apparatus for automatically tracing line-structure images |
| US8172763B2 (en) * | 2005-05-06 | 2012-05-08 | Yeda Research And Development Co., Ltd. | Imaging and analysis of movement of erythrocytes in blood vessels in relation to the cardiac cycle |
| US8340744B2 (en) * | 2005-12-15 | 2012-12-25 | Koninklijke Philips Electronics N.V. | System, apparatus, and method for reproducible and comparable flow acquisitions |
| US11064964B2 (en) * | 2007-03-08 | 2021-07-20 | Sync-Rx, Ltd | Determining a characteristic of a lumen by measuring velocity of a contrast agent |
| US8086000B2 (en) | 2007-08-27 | 2011-12-27 | Pie Medical Imaging B.V. | Method, apparatus and computer program for quantitative bifurcation analysis on angiographic images |
| JP5148315B2 (en) | 2008-02-25 | 2013-02-20 | 株式会社東芝 | Medical image processing apparatus and medical image processing program |
| EP2559001B1 (en) | 2010-09-02 | 2018-07-11 | Pie Medical Imaging BV | Method and apparatus for quantitative analysis of a tree of recursively splitting tubular organs |
| DE102011083708A1 (en) | 2011-09-29 | 2013-04-04 | Siemens Aktiengesellschaft | Angiographic image evaluation method for determination of blood flow parameter of patient, involves computing blood flow parameters based on transit time between measuring points in blood vessel portion |
| JP6134789B2 (en) | 2012-06-26 | 2017-05-24 | シンク−アールエックス,リミティド | Image processing related to flow in luminal organs |
-
2017
- 2017-05-15 EP EP17171126.0A patent/EP3403582B1/en active Active
-
2018
- 2018-05-04 US US15/971,275 patent/US11694339B2/en active Active
- 2018-05-08 JP JP2018089649A patent/JP7133346B2/en active Active
Also Published As
| Publication number | Publication date |
|---|---|
| US11694339B2 (en) | 2023-07-04 |
| EP3403582A1 (en) | 2018-11-21 |
| JP2019022647A (en) | 2019-02-14 |
| US20180330507A1 (en) | 2018-11-15 |
| JP7133346B2 (en) | 2022-09-08 |
Similar Documents
| Publication | Publication Date | Title |
|---|---|---|
| EP3403582B1 (en) | Method and apparatus for determining blood velocity in x-ray angiography images | |
| US10687777B2 (en) | Vascular data processing and image registration systems, methods, and apparatuses | |
| US20230309943A1 (en) | Methods and systems for dynamic coronary roadmapping | |
| EP3806742B1 (en) | Method and apparatus for quantitative hemodynamic flow analysis | |
| EP2967480B1 (en) | Vascular data processing and image registration methods | |
| EP2633815B1 (en) | Fractional flow reserve estimation | |
| JP5394930B2 (en) | Combined with X-ray transvascularly collected data | |
| US11911203B2 (en) | Method and system for registering intra-object data with extra-object data | |
| US20160066795A1 (en) | Stenosis therapy planning | |
| JP7436548B2 (en) | How the processor device works | |
| JP6726714B2 (en) | Method of operating system for detecting intravascular probe marker, and method of operating system for superimposing and registering angiographic data and intravascular data acquired for a blood vessel |
Legal Events
| Date | Code | Title | Description |
|---|---|---|---|
| PUAI | Public reference made under article 153(3) epc to a published international application that has entered the european phase |
Free format text: ORIGINAL CODE: 0009012 |
|
| STAA | Information on the status of an ep patent application or granted ep patent |
Free format text: STATUS: THE APPLICATION HAS BEEN PUBLISHED |
|
| AK | Designated contracting states |
Kind code of ref document: A1 Designated state(s): AL AT BE BG CH CY CZ DE DK EE ES FI FR GB GR HR HU IE IS IT LI LT LU LV MC MK MT NL NO PL PT RO RS SE SI SK SM TR |
|
| AX | Request for extension of the european patent |
Extension state: BA ME |
|
| STAA | Information on the status of an ep patent application or granted ep patent |
Free format text: STATUS: REQUEST FOR EXAMINATION WAS MADE |
|
| 17P | Request for examination filed |
Effective date: 20190514 |
|
| RBV | Designated contracting states (corrected) |
Designated state(s): AL AT BE BG CH CY CZ DE DK EE ES FI FR GB GR HR HU IE IS IT LI LT LU LV MC MK MT NL NO PL PT RO RS SE SI SK SM TR |
|
| STAA | Information on the status of an ep patent application or granted ep patent |
Free format text: STATUS: EXAMINATION IS IN PROGRESS |
|
| 17Q | First examination report despatched |
Effective date: 20200518 |
|
| STAA | Information on the status of an ep patent application or granted ep patent |
Free format text: STATUS: EXAMINATION IS IN PROGRESS |
|
| GRAP | Despatch of communication of intention to grant a patent |
Free format text: ORIGINAL CODE: EPIDOSNIGR1 |
|
| STAA | Information on the status of an ep patent application or granted ep patent |
Free format text: STATUS: GRANT OF PATENT IS INTENDED |
|
| INTG | Intention to grant announced |
Effective date: 20221114 |
|
| GRAS | Grant fee paid |
Free format text: ORIGINAL CODE: EPIDOSNIGR3 |
|
| GRAA | (expected) grant |
Free format text: ORIGINAL CODE: 0009210 |
|
| STAA | Information on the status of an ep patent application or granted ep patent |
Free format text: STATUS: THE PATENT HAS BEEN GRANTED |
|
| AK | Designated contracting states |
Kind code of ref document: B1 Designated state(s): AL AT BE BG CH CY CZ DE DK EE ES FI FR GB GR HR HU IE IS IT LI LT LU LV MC MK MT NL NO PL PT RO RS SE SI SK SM TR |
|
| REG | Reference to a national code |
Ref country code: GB Ref legal event code: FG4D |
|
| P01 | Opt-out of the competence of the unified patent court (upc) registered |
Effective date: 20230309 |
|
| REG | Reference to a national code |
Ref country code: CH Ref legal event code: EP Ref country code: AT Ref legal event code: REF Ref document number: 1572376 Country of ref document: AT Kind code of ref document: T Effective date: 20230615 |
|
| REG | Reference to a national code |
Ref country code: DE Ref legal event code: R096 Ref document number: 602017069354 Country of ref document: DE |
|
| REG | Reference to a national code |
Ref country code: NL Ref legal event code: FP |
|
| REG | Reference to a national code |
Ref country code: LT Ref legal event code: MG9D |
|
| PG25 | Lapsed in a contracting state [announced via postgrant information from national office to epo] |
Ref country code: SE Free format text: LAPSE BECAUSE OF FAILURE TO SUBMIT A TRANSLATION OF THE DESCRIPTION OR TO PAY THE FEE WITHIN THE PRESCRIBED TIME-LIMIT Effective date: 20230607 Ref country code: NO Free format text: LAPSE BECAUSE OF FAILURE TO SUBMIT A TRANSLATION OF THE DESCRIPTION OR TO PAY THE FEE WITHIN THE PRESCRIBED TIME-LIMIT Effective date: 20230907 Ref country code: ES Free format text: LAPSE BECAUSE OF FAILURE TO SUBMIT A TRANSLATION OF THE DESCRIPTION OR TO PAY THE FEE WITHIN THE PRESCRIBED TIME-LIMIT Effective date: 20230607 |
|
| REG | Reference to a national code |
Ref country code: AT Ref legal event code: MK05 Ref document number: 1572376 Country of ref document: AT Kind code of ref document: T Effective date: 20230607 |
|
| PG25 | Lapsed in a contracting state [announced via postgrant information from national office to epo] |
Ref country code: RS Free format text: LAPSE BECAUSE OF FAILURE TO SUBMIT A TRANSLATION OF THE DESCRIPTION OR TO PAY THE FEE WITHIN THE PRESCRIBED TIME-LIMIT Effective date: 20230607 Ref country code: LV Free format text: LAPSE BECAUSE OF FAILURE TO SUBMIT A TRANSLATION OF THE DESCRIPTION OR TO PAY THE FEE WITHIN THE PRESCRIBED TIME-LIMIT Effective date: 20230607 Ref country code: LT Free format text: LAPSE BECAUSE OF FAILURE TO SUBMIT A TRANSLATION OF THE DESCRIPTION OR TO PAY THE FEE WITHIN THE PRESCRIBED TIME-LIMIT Effective date: 20230607 Ref country code: HR Free format text: LAPSE BECAUSE OF FAILURE TO SUBMIT A TRANSLATION OF THE DESCRIPTION OR TO PAY THE FEE WITHIN THE PRESCRIBED TIME-LIMIT Effective date: 20230607 Ref country code: GR Free format text: LAPSE BECAUSE OF FAILURE TO SUBMIT A TRANSLATION OF THE DESCRIPTION OR TO PAY THE FEE WITHIN THE PRESCRIBED TIME-LIMIT Effective date: 20230908 |
|
| PG25 | Lapsed in a contracting state [announced via postgrant information from national office to epo] |
Ref country code: FI Free format text: LAPSE BECAUSE OF FAILURE TO SUBMIT A TRANSLATION OF THE DESCRIPTION OR TO PAY THE FEE WITHIN THE PRESCRIBED TIME-LIMIT Effective date: 20230607 |
|
| PG25 | Lapsed in a contracting state [announced via postgrant information from national office to epo] |
Ref country code: SK Free format text: LAPSE BECAUSE OF FAILURE TO SUBMIT A TRANSLATION OF THE DESCRIPTION OR TO PAY THE FEE WITHIN THE PRESCRIBED TIME-LIMIT Effective date: 20230607 |
|
| PG25 | Lapsed in a contracting state [announced via postgrant information from national office to epo] |
Ref country code: IS Free format text: LAPSE BECAUSE OF FAILURE TO SUBMIT A TRANSLATION OF THE DESCRIPTION OR TO PAY THE FEE WITHIN THE PRESCRIBED TIME-LIMIT Effective date: 20231007 |
|
| PG25 | Lapsed in a contracting state [announced via postgrant information from national office to epo] |
Ref country code: SM Free format text: LAPSE BECAUSE OF FAILURE TO SUBMIT A TRANSLATION OF THE DESCRIPTION OR TO PAY THE FEE WITHIN THE PRESCRIBED TIME-LIMIT Effective date: 20230607 Ref country code: SK Free format text: LAPSE BECAUSE OF FAILURE TO SUBMIT A TRANSLATION OF THE DESCRIPTION OR TO PAY THE FEE WITHIN THE PRESCRIBED TIME-LIMIT Effective date: 20230607 Ref country code: RO Free format text: LAPSE BECAUSE OF FAILURE TO SUBMIT A TRANSLATION OF THE DESCRIPTION OR TO PAY THE FEE WITHIN THE PRESCRIBED TIME-LIMIT Effective date: 20230607 Ref country code: PT Free format text: LAPSE BECAUSE OF FAILURE TO SUBMIT A TRANSLATION OF THE DESCRIPTION OR TO PAY THE FEE WITHIN THE PRESCRIBED TIME-LIMIT Effective date: 20231009 Ref country code: IS Free format text: LAPSE BECAUSE OF FAILURE TO SUBMIT A TRANSLATION OF THE DESCRIPTION OR TO PAY THE FEE WITHIN THE PRESCRIBED TIME-LIMIT Effective date: 20231007 Ref country code: EE Free format text: LAPSE BECAUSE OF FAILURE TO SUBMIT A TRANSLATION OF THE DESCRIPTION OR TO PAY THE FEE WITHIN THE PRESCRIBED TIME-LIMIT Effective date: 20230607 Ref country code: CZ Free format text: LAPSE BECAUSE OF FAILURE TO SUBMIT A TRANSLATION OF THE DESCRIPTION OR TO PAY THE FEE WITHIN THE PRESCRIBED TIME-LIMIT Effective date: 20230607 Ref country code: AT Free format text: LAPSE BECAUSE OF FAILURE TO SUBMIT A TRANSLATION OF THE DESCRIPTION OR TO PAY THE FEE WITHIN THE PRESCRIBED TIME-LIMIT Effective date: 20230607 |
|
| PG25 | Lapsed in a contracting state [announced via postgrant information from national office to epo] |
Ref country code: PL Free format text: LAPSE BECAUSE OF FAILURE TO SUBMIT A TRANSLATION OF THE DESCRIPTION OR TO PAY THE FEE WITHIN THE PRESCRIBED TIME-LIMIT Effective date: 20230607 |