EP1995680A2 - Medizinisches Diagnosecomputersystem, Computerprogramm und Servercomputer - Google Patents
Medizinisches Diagnosecomputersystem, Computerprogramm und Servercomputer Download PDFInfo
- Publication number
- EP1995680A2 EP1995680A2 EP08009364A EP08009364A EP1995680A2 EP 1995680 A2 EP1995680 A2 EP 1995680A2 EP 08009364 A EP08009364 A EP 08009364A EP 08009364 A EP08009364 A EP 08009364A EP 1995680 A2 EP1995680 A2 EP 1995680A2
- Authority
- EP
- European Patent Office
- Prior art keywords
- screen
- patient
- doctor
- display
- pathological condition
- Prior art date
- Legal status (The legal status is an assumption and is not a legal conclusion. Google has not performed a legal analysis and makes no representation as to the accuracy of the status listed.)
- Withdrawn
Links
- 238000003745 diagnosis Methods 0.000 title claims abstract description 37
- 238000004590 computer program Methods 0.000 title claims description 21
- 230000001575 pathological effect Effects 0.000 claims abstract description 133
- 230000008827 biological function Effects 0.000 claims abstract description 17
- 238000004891 communication Methods 0.000 claims abstract description 11
- 238000012360 testing method Methods 0.000 claims description 130
- 238000004458 analytical method Methods 0.000 claims description 33
- 238000004088 simulation Methods 0.000 claims description 16
- 206010012601 diabetes mellitus Diseases 0.000 claims description 8
- 238000010339 medical test Methods 0.000 claims description 8
- 229940079593 drug Drugs 0.000 claims description 2
- 239000003814 drug Substances 0.000 claims description 2
- NOESYZHRGYRDHS-UHFFFAOYSA-N insulin Chemical compound N1C(=O)C(NC(=O)C(CCC(N)=O)NC(=O)C(CCC(O)=O)NC(=O)C(C(C)C)NC(=O)C(NC(=O)CN)C(C)CC)CSSCC(C(NC(CO)C(=O)NC(CC(C)C)C(=O)NC(CC=2C=CC(O)=CC=2)C(=O)NC(CCC(N)=O)C(=O)NC(CC(C)C)C(=O)NC(CCC(O)=O)C(=O)NC(CC(N)=O)C(=O)NC(CC=2C=CC(O)=CC=2)C(=O)NC(CSSCC(NC(=O)C(C(C)C)NC(=O)C(CC(C)C)NC(=O)C(CC=2C=CC(O)=CC=2)NC(=O)C(CC(C)C)NC(=O)C(C)NC(=O)C(CCC(O)=O)NC(=O)C(C(C)C)NC(=O)C(CC(C)C)NC(=O)C(CC=2NC=NC=2)NC(=O)C(CO)NC(=O)CNC2=O)C(=O)NCC(=O)NC(CCC(O)=O)C(=O)NC(CCCNC(N)=N)C(=O)NCC(=O)NC(CC=3C=CC=CC=3)C(=O)NC(CC=3C=CC=CC=3)C(=O)NC(CC=3C=CC(O)=CC=3)C(=O)NC(C(C)O)C(=O)N3C(CCC3)C(=O)NC(CCCCN)C(=O)NC(C)C(O)=O)C(=O)NC(CC(N)=O)C(O)=O)=O)NC(=O)C(C(C)CC)NC(=O)C(CO)NC(=O)C(C(C)O)NC(=O)C1CSSCC2NC(=O)C(CC(C)C)NC(=O)C(NC(=O)C(CCC(N)=O)NC(=O)C(CC(N)=O)NC(=O)C(NC(=O)C(N)CC=1C=CC=CC=1)C(C)C)CC1=CN=CN1 NOESYZHRGYRDHS-UHFFFAOYSA-N 0.000 description 200
- WQZGKKKJIJFFOK-GASJEMHNSA-N Glucose Natural products OC[C@H]1OC(O)[C@H](O)[C@@H](O)[C@@H]1O WQZGKKKJIJFFOK-GASJEMHNSA-N 0.000 description 109
- 239000008103 glucose Substances 0.000 description 109
- 102000004877 Insulin Human genes 0.000 description 100
- 108090001061 Insulin Proteins 0.000 description 100
- 229940125396 insulin Drugs 0.000 description 100
- 238000007410 oral glucose tolerance test Methods 0.000 description 86
- 239000008280 blood Substances 0.000 description 56
- 210000004369 blood Anatomy 0.000 description 56
- 238000013142 basic testing Methods 0.000 description 52
- 230000006870 function Effects 0.000 description 36
- 230000002440 hepatic effect Effects 0.000 description 30
- 230000002093 peripheral effect Effects 0.000 description 30
- 230000008859 change Effects 0.000 description 22
- 210000004185 liver Anatomy 0.000 description 20
- 238000010586 diagram Methods 0.000 description 17
- 238000000034 method Methods 0.000 description 14
- 210000000496 pancreas Anatomy 0.000 description 13
- 230000000638 stimulation Effects 0.000 description 13
- 238000011282 treatment Methods 0.000 description 13
- 230000007704 transition Effects 0.000 description 12
- 230000008512 biological response Effects 0.000 description 11
- 230000004190 glucose uptake Effects 0.000 description 10
- 230000004044 response Effects 0.000 description 10
- 238000012552 review Methods 0.000 description 10
- 230000003914 insulin secretion Effects 0.000 description 9
- 230000028327 secretion Effects 0.000 description 9
- 230000035945 sensitivity Effects 0.000 description 8
- 238000010521 absorption reaction Methods 0.000 description 7
- 201000010099 disease Diseases 0.000 description 7
- 208000037265 diseases, disorders, signs and symptoms Diseases 0.000 description 7
- 210000001035 gastrointestinal tract Anatomy 0.000 description 7
- 230000004060 metabolic process Effects 0.000 description 7
- 210000000056 organ Anatomy 0.000 description 6
- 230000008569 process Effects 0.000 description 6
- 230000001629 suppression Effects 0.000 description 6
- 230000002123 temporal effect Effects 0.000 description 6
- 230000001419 dependent effect Effects 0.000 description 5
- 238000004364 calculation method Methods 0.000 description 4
- 230000008034 disappearance Effects 0.000 description 4
- 238000004422 calculation algorithm Methods 0.000 description 3
- 238000012937 correction Methods 0.000 description 3
- 230000000694 effects Effects 0.000 description 3
- 230000002068 genetic effect Effects 0.000 description 3
- 238000012545 processing Methods 0.000 description 3
- 206010022489 Insulin Resistance Diseases 0.000 description 2
- 230000001174 ascending effect Effects 0.000 description 2
- 230000002708 enhancing effect Effects 0.000 description 2
- 239000000284 extract Substances 0.000 description 2
- 238000013178 mathematical model Methods 0.000 description 2
- 238000010606 normalization Methods 0.000 description 2
- 230000008929 regeneration Effects 0.000 description 2
- 238000011069 regeneration method Methods 0.000 description 2
- 230000004936 stimulating effect Effects 0.000 description 2
- 238000012549 training Methods 0.000 description 2
- 101100533757 Caenorhabditis elegans snf-3 gene Proteins 0.000 description 1
- 101150054854 POU1F1 gene Proteins 0.000 description 1
- 235000016496 Panda oleosa Nutrition 0.000 description 1
- 240000000220 Panda oleosa Species 0.000 description 1
- 102000001999 Transcription Factor Pit-1 Human genes 0.000 description 1
- 108010040742 Transcription Factor Pit-1 Proteins 0.000 description 1
- 230000036772 blood pressure Effects 0.000 description 1
- 238000009534 blood test Methods 0.000 description 1
- 238000006243 chemical reaction Methods 0.000 description 1
- 230000007812 deficiency Effects 0.000 description 1
- 230000004153 glucose metabolism Effects 0.000 description 1
- 208000019622 heart disease Diseases 0.000 description 1
- 238000009532 heart rate measurement Methods 0.000 description 1
- 238000012986 modification Methods 0.000 description 1
- 230000004048 modification Effects 0.000 description 1
- 230000035772 mutation Effects 0.000 description 1
- 208000024891 symptom Diseases 0.000 description 1
- 238000013334 tissue model Methods 0.000 description 1
- 208000001072 type 2 diabetes mellitus Diseases 0.000 description 1
Images


Classifications
-
- G—PHYSICS
- G16—INFORMATION AND COMMUNICATION TECHNOLOGY [ICT] SPECIALLY ADAPTED FOR SPECIFIC APPLICATION FIELDS
- G16H—HEALTHCARE INFORMATICS, i.e. INFORMATION AND COMMUNICATION TECHNOLOGY [ICT] SPECIALLY ADAPTED FOR THE HANDLING OR PROCESSING OF MEDICAL OR HEALTHCARE DATA
- G16H50/00—ICT specially adapted for medical diagnosis, medical simulation or medical data mining; ICT specially adapted for detecting, monitoring or modelling epidemics or pandemics
- G16H50/50—ICT specially adapted for medical diagnosis, medical simulation or medical data mining; ICT specially adapted for detecting, monitoring or modelling epidemics or pandemics for simulation or modelling of medical disorders
Definitions
- the present invention relates to a medical diagnosis support computer system used to support diagnosis of diabetes or the like, a computer program, and a server computer.
- the doctors are currently selecting the treatment methods relying on his/her experience and intuition based on information for making a decision such as test results and clinical findings of the patient.
- a system for supporting medical examination includes a system for predicting blood glucose level as disclosed in Japanese Laid-Open Patent Publication No. 10-332704 and Japanese Laid-Open Patent Publication No. 11-296598 .
- Such systems support the medical examination by predicting change in the blood glucose level of a patient and providing the predicted blood glucose level to the doctor.
- the disease is hoped such that the doctor can understand the factor with only the test values, but in some diseases, it is significantly difficult to appropriately understand the factor with only the test values.
- blood glucose level is used as an index for indicating the extent of the disease.
- blood glucose level is merely a result, and it is not easy to accurately understand the pathological conditions such as insulin deficiency, peripheral insulin resistance, lowering in uptake of hepatic glucose, and increase in release of hepatic glucose from the clinical findings and the like.
- the specialist determines the pathological condition of the patient by using oral glucose tolerance test, electrocardiogram, and test results such as blood pressure, pulse measurement, blood test, and the like, but abundant experience is required in order to accurately determine the pathological condition from the test results, and this accurate determination is difficult for non-specialists.
- the information may be too complex for the patient, thereby impairing easy understanding of the patient.
- a first aspect of the present invention is a medical diagnosis support computer system for supporting diagnosis of a patient by a doctor, the system comprising: a display device; and a controller in communication with the display device, the controller comprising a processor configured to build a biological model representing biological functions of the patient on a computer, generate pathological condition information of the patient based on the biological model, display a doctor screen for the doctor and a patient screen for the patient in a switchable manner on the display device, and accept an input for switching the display between the doctor screen and the patient screen; wherein the doctor screen is configured to simultaneously display a screen region for displaying the pathological condition information of the patient and a screen region for displaying one or more related information related to the patient; and the patient screen is configured to selectively display a display content between the pathological condition information of the patient and one or more related information related to the patient.
- a second aspect of the present invention is a computer program product, comprising: a computer readable medium; and instructions, on the computer readable medium, adapted to enable a general purpose computer to perform operations, comprising: building a biological model representing biological functions of the patient on a computer; generating pathological condition information of the patient based on the biological model; displaying a doctor screen for the doctor and a patient screen for the patient in a switchable manner on the display device; and receiving an input for switching the display between the doctor screen and the patient screen; wherein the doctor screen is configured to simultaneously display a screen region for displaying the pathological condition information of the patient and a screen region for displaying one or more related information related to the patient; and the patient screen is configured to selectively display a display content between the pathological condition information of the patient and one or more related information related to the patient.
- a third aspect of the present invention is A medical diagnosis support computer system for supporting diagnosis of a patient by a doctor, the system comprising: a display device; and a controller in communication with the display device, the controller comprising a processor configured to build a biological model representing biological functions of the patient on a computer, generate pathological condition information of the patient based on the biological model, display a doctor screen for the doctor and a patient screen for the patient in a switchable manner on the display device, and receive an input for switching the display between the doctor screen and the patient screen; wherein the doctor screen is configured to simultaneously display a screen region for displaying the pathological condition information of the patient and a screen region for displaying one or more related information related to the patient; and the patient screen comprises a test result screen for displaying result information of a medical test of the patient without display of the pathological condition information.
- a fourth aspect of the present invention is a computer program product, comprising: a computer readable medium; and instructions, on the computer readable medium, adapted to enable a general purpose computer to perform operations, comprising: building a biological model representing biological functions of the patient on a computer; generating pathological condition information of the patient based on the biological model; displaying a doctor screen for the doctor and a patient screen for the patient in a switchable manner on the display device; and receiving an input for switching the display between the doctor screen and the patient screen; wherein the doctor screen is configured to simultaneously display a screen region for displaying the pathological condition information of the patient and a screen region for displaying one or more related information related to the patient; and the patient screen comprises a test result screen for displaying result information of a medical test of the patient without display of the pathological condition information.
- a fifth aspect of the present invention is a server computer for displaying a screen for supporting a diagnosis of a patient by a doctor on a display device of a terminal device connected by way of a network
- the server computer comprising: a controller in communication with the terminal device, the controller comprising a processor configured to display a doctor screen for the doctor and a patient screen for the patient in a switchable manner on the display device of the terminal device, and switch the display between the doctor screen and the patient screen when an input for switching between the doctor screen and the patient screen is made at the terminal device; wherein the doctor screen is configured to simultaneously display a screen region for displaying pathological condition information of the patient generated based on a biological model built on a computer to represent biological functions of the patient and a screen region for displaying one or more related information related to the patient; and the patient screen is configured to selectively display a display content between the pathological condition information of the patient and one or more related information related to the patient.
- a sixth aspect of the present invention is a server computer for displaying a screen for supporting a diagnosis of a patient by a doctor on a display device of a terminal device connected by way of a network
- the server computer comprising: a controller in communication with the terminal device, the controller comprising a processor configured to display a doctor screen for the doctor and a patient screen for the patient in a switchable manner on the display device of the terminal device, and switch the display between the doctor screen and the patient screen when an input for switching between the doctor screen and the patient screen is made at the terminal device; wherein the doctor screen is configured to simultaneously display a screen region for displaying pathological condition information of the patient generated based on a biological model built on a computer to represent biological functions of the patient and a screen region for displaying one or more related information related to the patient; and the patient screen includes a test result screen for displaying result information of a medical test of the patient without display of the pathological condition information.
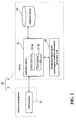
- Fig. 1 shows a system configuration view of the case when a medical diagnosis support computer system SS is configured as a server client system.
- the system SS is built as a system for supporting diagnosis of diabetes.
- the system SS is configured as a network system including a server computer (hereinafter also simply referred to as “server”) S, and a client terminal device (hereinafter also simply referred to as “client”) connected to the server S by way of Internet or network such as LAN.
- server server computer
- client client terminal device
- the system SS may be configured by one computer.
- the client C is used by a user such as doctor, laboratory technician, and the like.
- the client C is configured by a computer including a display device (display) and an input device (keyboard or mouse etc.).
- a printer (not shown) is connected to the client C, so that display screen etc. of the client can be printed.
- the client C includes a Web browser C1.
- the Web browser C1 serves as a user interface of the system SS. That is, the screen generated in the server S and transmitted to the client C is output on the Web browser C1. The user can input and perform necessary operations on the Web browser C1.
- the server S has a function serving as an application server S1, a function serving as a simulator/analysis server S2, and a function serving as a database server S3.
- Each function S1 to S3 may be realized with one computer, or may be realized by a plurality of computers connected network.
- the application server S1 has a central function to have the network system SS function as the medical diagnosis support system, and has a function of generating a screen to be displayed on the Web browser C1 and transmitting the same to the client terminal C, and of accepting the information input in the Web browser C1 from the client terminal C.
- a computer program for realizing a function of generating a user interface screen to be displayed on the Web browser C1, a function of accepting information from the client terminal C, and a function of performing other necessary processes is loaded on the application server S1 so as to be executed by a computer.
- the client terminal C may download a program such as java (registered trademark) applet for realizing some or all of the functions of the screen displayed on the Web browser C1 from the server S, and display the screen on the Web browser C1.
- java registered trademark
- the simulator/analysis server (pathological condition information analysis server) S2 builds a biological model representing the biological functions of a patient on a computer (server S), and generates pathological condition information (pathological condition information of diabetes) of the patient based on the biological model.
- the biological model is built as a mathematical model on the computer including a plurality of parameters related to the biological functions to represent the entire human body or biological functions of a certain disease.
- the simulator/analysis server S2 performs simulation on the disease (diabetes) of a specific patient based on the biological model, and acquires the pathological condition information of the relevant patient by simulation.
- a pathological condition simulator/analysis program (pathological information analysis computer program) is loaded on the simulator/analysis server (pathological condition information generation server; pathological condition information generation unit) S2 to be executed by a computer, and the simulation and the analysis function are realized by the relevant program.
- a database having various data DB1 to DB7 of test result etc. of the patient is built in the database server S3.
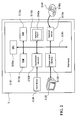
- Fig. 2 is a block diagram showing hardware configuration of the server S.
- the server S is composed of a computer mainly including a main body S110, a display S120, and an input device S130.
- the main body S110 is mainly configured by a CPU 110a, a ROM S110b, a RAM S110c, a hard disk S110d, a readout device S110e, an input/output interface S110f, and an image output interface S110h, wherein the CPU S110a, the ROM S110b, the RAM S110c, the hard disk S110d, the readout device S110e, the input/output interface S110f, and the image output interface S110h are data-communicably connected by a bus S110i.
- the CPU S110a is capable of executing a computer program recorded in the ROM S110b and a computer program loaded in the RAM S110c.
- the CPU S110a executes an application program 140a for realizing the application server S1 function, a program for realizing the simulator/analysis server S2 function, and a program for realizing the database server function, to realize each function block as described below, whereby the computer functions as the server S of the present embodiment.
- the ROM S110b includes mask ROM, PROM, EPROM, EEPROM, etc. and is recoded with computer programs executed by the CPU 110a and data used for the programs.
- the RAM S110c comprises SRAM, DRAM, etc.
- the RAM S110c is used to read out computer programs recorded in the ROM S110b and the hard disk S110d.
- the RAM 110c is used as a work area of the CPU S110a when these computer programs are executed.
- the hard disk S110d is installed with an operating system and an application program, etc., as well as various computer programs to be executed by the CPU 110a, and data used for executing the computer programs.
- the readout device S110e which comprises a flexible disk drive, a CD-ROM drive or DVD-ROM drive is capable of reading out a computer program or data recorded in a portable recording media S140.
- the portable recording media S140 stores the computer program for the computer to function as the system of the present invention, wherein the computer reads out the necessary application program S140a etc. from the portable recording media S140 and installs the relevant application program S140a etc. in the hard disk S110d.
- the computer program such as the application program S140a is not only provided by the portable recording media S140, and may be provided through an electric communication line (wired or wireless) from external devices which are communicably connected to the computer via the electric communication line.
- the application program S140a etc. may be stored in a hard disk in an application program providing server computer on the Internet, so that the computer program can be downloaded by accessing the server computer and installed in the hard disc S110d.
- the hard disk 110d is installed with an operating system which provides a graphical user interface environment, e.g. Windows (registered trademark) manufactured by US Microsoft Corp.
- Windows registered trademark
- the computer program described in the present embodiment is assumed as operating on the operating system.
- the input/output interface S110f includes a serial interface such as USB, IEEE1394, and RS-232C; a parallel interface such as SCSI, IDE, and IEEE1284; and an analog interface such as D/A converter and A/D converter.
- the input/output interface S110f is connected to the input device S130 including a keyboard and a mouse, and users can use the input device S130 to input data into the computer.
- the image output interface S110h is connected to the display S120 configured by LCD, CRT or the like so that picture signals corresponding to image data provided from the CPU S110a are output to the display S120.
- the display S120 displays an image (screen) based on the input picture signals.
- the hardware configuration of the client terminal C is the same as the hardware configuration of the server S.
- the simulator/analysis server (pathological condition information generation server; pathological condition information generation unit) S2 will now be described.
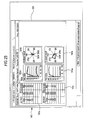
- Fig. 3 is a block diagram showing an overall configuration of one example of a biological model used in the pathological condition simulation according to the present embodiment.
- the biological model particularly simulates biological organs associated with diabetes, and comprises a pancreas block 1, a hepatic block 2, an insulin kinetics block 3, and a peripheral tissue block 4.
- Each block 1, 2, 3, 4 has input and output. That is, as to the pancreas block 1, a blood glucose level 6 is set as input and an insulin secretion rate 7 is set as output.
- glucose absorption 5 from digestive tract, the blood glucose level 6 and then insulin secretion rate 7 are set as input, and net glucose release 8 and post liver insulin 9 are set as output.
- post liver insulin 9 is set as input and insulin concentration 10 at the peripheral tissues is set as output.
- the net glucose release 8, and the insulin concentration 10 at the peripheral tissues are set as input, and the blood glucose level 6 is set as output.
- Glucose absorption 5 is data provided from outside of the biological model (database server S3).
- data related to glucose absorption is registered in the database S3 as actual test data
- function blocks 1 to 4 are respectively realized when the computer program is executed by the CPU of the server S2.
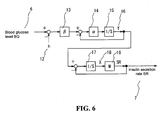
- Relationship between input and output of the pancreas block 1 may be expressed using the following differential equation (1).
- the relationship can also be represented using a block diagram as in Fig. 6 equivalent to the differential equation (1).
- the blood glucose level 6 which is the input to the pancreas block 1 in Fig. 3 corresponds to BG(t), and the insulin secretion rate 7 which is the output corresponds to SR(t).
- numeral 6 indicates blood glucose level BG (t); 7 indicates insulin secretion rate SR (t) from pancreas; 12 indicates glucose concentration threshold h capable of stimulating insulin supply; 13 indicates sensitivity to glucose stimulation ⁇ ; 14 indicates following performance to glucose stimulation ⁇ ; 15 indicates integral element; 16 indicates supply rate Y(t) of newly supplied insulin with respect to glucose stimulation; 17 indicates integral element; 18 indicates total amount of insulin X(t) capable of being secreted from pancreas; and 19 indicates secretion rate M per unit concentration.
- the glucose absorption 5 from digestive tract which is input to the hepatic block in Fig. 3 corresponds to RG(t)
- the blood glucose level 6 corresponds to BG(t)
- the insulin secretion rate 7 corresponds to SR(t)
- the net glucose release 8 which is the output corresponds to SGO(t)
- the post liver insulin 9 corresponds to SRpost(t).
- numeral 5 indicates glucose absorption RG(t) from digestive tract; 6 indicates blood glucose level BG(t); 7 indicates insulin secretion rate SR(t) from pancreas; 8 indicates net glucose SGO(t) from liver; 9 indicates post liver insulin SRpost(t); 24 indicates insulin passage rate (1-A 7 ) of liver; 25 indicates following performance to insulin stimulation ⁇ 2; 26 indicates post liver insulin distribution rate A 3 ; 27 indicates integral element; 28 indicates hepatic insulin concentration I 4 (t); 9 indicates insulin-dependant hepatic glucose uptake distribution rate (1-r); 30 indicates insulin-dependent glucose uptake rate Kh in liver per unit glucose; 31 indicates insulin-independent hepatic glucose uptake distribution rate r; 32 indicates hepatic glucose uptake rate to glucose stimulation from digestive tract Func1(FGB); 33 indicates adjustment item for hepatic uptake rate b1 (I 4 (t)); 34 indicates hepatic glucose uptake HGU(t); 35 indicates insulin concentration threshold at which hepati
- the post liver insulin 9 which is the input to the insulin kinetics block in Fig. 3 corresponds to SRpost(t)
- the insulin concentration 10, which is the output, at the peripheral tissue corresponds to I 3 (t).
- numeral 9 indicates post liver insulin SRpost (t); 10 indicates insulin concentration I 3 (t) in peripheral tissue; 50 indicates integral element; 51 indicates post liver insulin distribution rate A 3 ; 52 indicates blood insulin concentration I 1 (t); 53 indicates insulin distribution rate A 2 to peripheral tissues; 54 indicates integral element; 55 indicates insulin disappearance rate A 1 in peripheral tissue; 56 indicates post peripheral tissue insulin flow out rate A 4 ; 57 indicates insulin distribution rate A 6 to insulin independent tissue; 58 indicates integral element; 59 indicates insulin concentration in insulin independent tissue I 2 (t); 60 indicates insulin disappearance rate A 5 in insulin independent tissue.
- the insulin concentration 10, which is the input to the peripheral tissue block in Fig. 3 , in peripheral tissue corresponds to I 3 (t)
- the net glucose 8 from liver corresponds to SGO(t)
- the blood glucose level 6 which is the output corresponds to BG(t).
- numeral 6 indicates blood glucose level BG(t); 8 indicates net glucose SGO(t) from liver; 10 indicates insulin concentration I 3 (t) in peripheral tissues; 70 indicates insulin independent glucose consumption rate to basal metabolism u*Goff(FGB); 71 indicates integral element; 72 indicates insulin independent glucose consumption rate Kb in peripheral tissues; 73 indicates insulin dependent glucose consumption rate Kp in peripheral tissues per unit insulin and per unit glucose; and 74 indicates unit conversion constant Ws/DVg.
- E-Cell software disclosed by Keio University
- MatLab manufactured by The MathWorks, Inc.
- a biological model having characteristics suited for individual patient. More specifically, it is required to determine parameters and initial values of variables of the biological model according to the individual patient, and apply the determined parameters and initial values to the biological model, thereby generating a biological model suited for the individual patient. (Unless otherwise specified, an initial value of variable is also included in parameters to be generated.)
- the server 2 (simulator/analysis server S2) of the present system SS thus has a function of obtaining an internal parameter set or a set of internal parameters of the biological model (hereinafter simply referred to also as "parameter set”), and generating the biological model applied with the obtained parameter set to realize the function as the biological model generating section. This function is also realized through the pathological condition simulator/analysis program.
- the parameter set generated by the biological model generating section is applied to the biological model, and a biological model calculating section simulates the function of the biological organs and outputs the pseudo-response simulating the actual biological response (test result).
- a parameter set generating section for generating the parameter set for forming a biological model that simulates the biological organ of the patient based on the actual test result (biological response) of the patient (biological body).
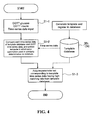
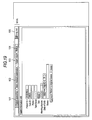
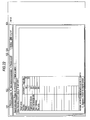
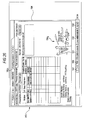
- Fig. 4 is a flowchart showing procedures in which the parameter set generating section of the system SS obtains a parameter set of the biological model.
- an input step of OGTT (oral glucose tolerance test) time-series data serving as an actual test result (biological response) is executed as shown in the figure (Step S1-1).
- the OGTT time-series data are a result of OGTT (given amount of glucose solution is orally loaded to measure the temporal change of blood glucose level and blood insulin concentration) or the test actually performed on the patient to be simulated by a biological model, wherein the present system accepts the input as the actual biological response (actual test value) from the client terminal 3.
- two data of OGTT glucose data blood glucose change data
- OGTT insulin blood insulin concentration change data
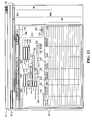
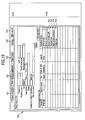
- the input OGTT time-series data are registered as "test data" in the OGTT data table DB4 (see Fig. 17(c) ) of the databases of the database server S3.
- Fig. 5 shows an example of the blood glucose level change data ( Fig. 5(a) ) and the blood insulin concentration change data ( Fig. 5(b) ) as the OGTT time-series data to be input.
- the blood glucose level change data of Fig. 5(a) is measured data corresponding to temporal change of the blood glucose level BG (t), or one of output items in the biological model shown in Figs. 3 to 9 .
- the blood insulin concentration change data of Fig. 5(b) is measured data corresponding to temporal change of blood insulin concentration I 1 (t), or one of output items in the biological model shown in Figs. 3 to 9 .
- the present system SS matches the input OGTT time-series data to the template of template database DB1.
- the template database DB1 is one database contained in the databases 24 of the database server S3.
- the template database DB1 is stored in advance with a plurality sets of data in which biological model reference output values T1, T2, ... that become template is corresponded to parameter sets PS#01, PS#02 ... for generating the reference output value.
- an appropriate parameter set may be assigned to an arbitrary reference output value, or on the contrary, the output of the biological model in the case when an arbitrary parameter set is selected may be obtained by the biological simulation system.
- Fig. 11 shows an example of a template (reference output value) T1.
- Fig. 11(a) is the blood glucose level change data serving as a template, which is reference time-series data corresponding to temporal change of the blood glucose level BG(t) or one of the output items in the biological model shown in Figs. 3 to 9 .
- Fig. 11(b) is the blood insulin concentration change data serving as a template, which is reference time-series data corresponding to temporal change of the blood insulin concentration I 1 (t) or one of the output items in the biological model shown in Figs. 3 to 9 .
- the system SS computes similarity between each reference time-series data of the above-mentioned template database DB and OGTT time-series data.
- the similarity is obtained by obtaining error summation.
- the average of the formula shows average value with respect to all templates stored in the template database DB1.
- Fig. 12 shows error summation (no normalization) of the OGTT time-series with respect to the template T1, and more specifically, Fig. 12(a) shows an error between the blood glucose level of Fig. 5(a) and the blood glucose level of Fig. 11(a) , and Fig. 12(b) shows an error between the insulin of Fig. 5(b) and the insulin of Fig. 11(b) .
- the CPU 100a obtains an error summation for each template in the template database DB1, and determines a template having minimum error summation (similarity), that is, the CPU 100a determines the template which is the most approximate to the OGTT time-series data (Step S1-2).
- step S1-3 the system SS acquires a parameter set corresponding to the template determined in step S1-2 from the template database DB1. That is, a parameter set PS#01 corresponding to the template T1 is obtained (see Fig. 10 ).
- the following table 1 shows specific numeral values of the parameter values included in the parameter set PS#01 obtained as above.
- Parameter set PS #01 with respect to template TI Parameter Value Unit Pancreas h 92.43 [mg/dl] ⁇ 0. 228 [1/min] ⁇ 0. 357 [( ⁇ U/ml) ⁇ (dl/mg) ⁇ (1/min)] M 1 [1/min] X(0) 336.4 [ ⁇ U/ml] Y (0) 4.4 [( ⁇ U/ml) ⁇ (1/min)] Insulin kinetics A1 0.025 [1/min] A2 0.042 [1/min] A3 0.435 [1/min] A4 0.02 [1/min] A5 0.
- the method for generating the parameter set is not limited to template matching as described above.
- the parameter set may be generated through genetic algorithm. That is, genetic algorithm may be applied of randomly producing an initial group of parameter set, and performing selection/chiasm/mutation process on the parameter set (individual) contained in the initial group to generate a new child group.
- genetic algorithm may be applied of randomly producing an initial group of parameter set, and performing selection/chiasm/mutation process on the parameter set (individual) contained in the initial group to generate a new child group.
- the parameter set that outputs the pseudo-response close to the input biological response (test result) can be adopted.
- the specific generating method of the biological model generating section is not particularly limited as long as the biological model that outputs pseudo-response simulating the input biological response can be generated.
- the system SS has a function of, when the parameter set PS#01 is provided to the biological model, performing a calculation based on the relevant biological model, and outputting pseudo-response information (time-series change in blood glucose level and insulin concentration) simulating the input OGTT time-series data (function as pseudo-response acquiring unit (biological model calculating section) of the system SS)
- pseudo-response information time-series change in blood glucose level and insulin concentration
- the biological organs of the patient can be simulated based on the generated biological model in the system SS. This function is also realized by the pathological condition simulator/analysis program.
- the generated parameter set is also used to acquire the pathological condition information (pathological condition feature information), which aspect will be hereinafter described.
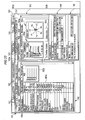
- Fig. 13 shows a screen of the present system SS generated by a screen control unit S1-A of the application server S1 of the server S and displayed on the display device of the client C.
- the screen of Fig. 13 shows a starting screen immediately after the user such as doctor logs into the present system from the client C.
- the screen of the present system SS is displayed on the Web browser C1 of the client C.
- a title bar C1-1, a tool bar C1-2, and a display region C1-3 of the Web browser C1 are shown.
- a screen to be displayed in the display region C1-3 of the browser C1 is generated in the server S.
- the display region C1-3 is shown in the figure showing the screen, and the illustrations of various bar C1-1, C1-2 displays of the Web browser will be omitted.
- a patient search/list screen (hereinafter also referred to as "basic screen") W1 for searching the patient information and displaying the search result is displayed in the browser display region C1-3 of Fig. 13 .
- the basic screen W1 is also a screen (route screen) that acts as a basis for transitioning to other screens W2, W3.
- a medical examination main screen W2 (see Fig. 15 ) or a doctor screen for the doctors to browse through, and a patient screen W3 (see Fig. 16 ) for the patients to browse through can be transitioned from the basic screen W1.
- the user can transition to other two screens W1, W2, W3 from any one of the screens W1, W2, W3.
- Each screen W1, W2, W3 includes operation screen regions W1A, W2A, W3A arranged with button displays for system operation such as screen transition operation etc., and main body screen regions W1B, W2B, W3B for displaying the content for each screen W1, W2, W3 and performing operation in each screen W1, W2, W3.
- the operation screen regions W1A, W2A, W3A are the display content of the main body screen regions W1B, W2B, W3B, but are always displayed for each screen W1, W2, W3.
- the operation screen regions W1A, W2A of the basic screen W1 and the doctor screen W2 are common, and include "patient search list” button 101, "main medical examination” button 102, and "patient view” button 103.
- buttons 101, 102, 103 are selected by the mouse operation etc., to be able to transition from currently displayed screens W1, W2, W3 onto other screens W1, W2, W3.
- the operation screen regions W1A, W2A of the basic screen W1 and the doctor screen W2 include a "notice” button 104 for displaying “notice” screen” from the system to the user, and "log out” button 105 for logging out from the system S.
- the operation screen region W3A of the patient screen W3 includes "print" button 16 for executing a print process of printing the content of the screen displayed on the main body screen region B of the patient screen W3 by means of a printer, in addition to the transition buttons 101, 102 to other screens W1, W2.
- the "print” button 106 is selected, the content of the current main body screen region B is printed.
- the screen content printed on the paper is handed to the patient, and this paper resource becomes the resource when the doctor gives an explanation to the patient, and the auxiliary resource for the patient to understand his/her condition.
- the operation screen region W3A of the patient screen W3 also includes "log out” button 105.
- the operation screen region W3A of the patient screen W3 does not include the "notice” button 104, and the screen is simplified.
- Fig. 14 shows an entire state transition of the system by the operation of the button displayed on the operation screen region of each screen W1, W2, W3 other than the screen transition.
- the reference numerals denoted on the arrow in Fig. 14 indicate the operation by the button (button of the operation screen region of the screens W1, W2, W3) having the corresponding reference numeral.
- the operation screen regions W1A, W2A are arranged at the upper part of the screens W1, W2 to which one tends to pay attention in order to ensure operability by the system user such as doctors or laboratory technicians.
- the patient does not directly operate the system but simply looks at the screen, and thus the screen is simplified in the patient screen W3, and the operation screen region W3A is arranged at the lower part of the screen W3 to be easier for the patient.
- the button size is made smaller etc. so that buttons do not stand out more than the operation screen regions W1A, W2A of the basic screen W1 and the doctor screen W2.
- the details of the patient search/list screen W1 or the basic screen will be described below.
- the basic screen W1 has a function of searching the patient by inputting search conditions such as patient's name, and a function of displaying the patient list as a search result. Both functions may be configured by separate screens.
- the (main body screen region W1B) of the basic screen W1 includes a search operation part 110 for inputting the search condition etc., and a search result display part 130 for displaying the search result.
- the basic screen W1 includes a new registration part 140 for newly registering the information of the patient. If the new registration part 140 is selected to perform the new registration process, the information on a new patient is registered in the database, and the relevant patient can be searched for.
- the search operation part 110 includes input parts of various search conditions such as patient ID input part 111, carte ID input part 112, patient's name input part 113, patient name kana input part 114, sex input part 115, attending physician input part 116, date of birth input part 117, memo input part 118, elapsed number of days from last interview input part 119, test item name input part 120, and the like as search conditions.
- various search conditions such as patient ID input part 111, carte ID input part 112, patient's name input part 113, patient name kana input part 114, sex input part 115, attending physician input part 116, date of birth input part 117, memo input part 118, elapsed number of days from last interview input part 119, test item name input part 120, and the like as search conditions.
- one or more input conditions are input to the input part, and the search button 121 is selected so that the relevant search conditions are transmitted to the server S.
- the application server S1 of the server S searches the patient data table DB2 contained in the database of the database server S3.
- the content of the patient data table is as shown in Fig. 17(a) .
- the patient information corresponding to the search conditions is registered by patients.
- the server S When extracting the information of the patient that matches the search condition, the server S generates a basic screen in which the extracted information is displayed in a list in the search result display part 130 and transmits the same to the client C.
- the basic screen W1 transmitted from the server S is displayed.
- the patient search result list is displayed, as shown in Fig. 13 .
- the information on the patient extracted by the search condition (patient ID 131, patient name 132, sex 133, date of birth 134, attending physician 135, carte ID 136) are displayed.
- the patient list is normally organized in ascending order of the patient ID, but the ascending order or the descending order of the selected patient information (e.g., date of birth) can be reorganized by clicking each item 131 to 136 of the patient information.
- the operation menu part 137 in which the operation can be selected is displayed for each patient in the search result display part 130. As shown in Fig. 18 , if the operation menu part 137 for a certain patient is selected, "patient information edit” selecting part 151, "test data input” selecting part 152, "main medical examination” selecting part 153, and "patient view” selecting part 154 are displayed as selectable operation menus.
- the operation menu part 137 Since the operation menu part 137 is displayed for every patient, the selection of the operation menu and selection of the patient can be performed at the same time.
- the server S When the user such as the doctor selects the "patient information edit" selecting part 151, the server S references the patient data table DB2 (see Fig. 17(a) ) of the database with the patient ID of the selected patient as the key information, and the patient information to be edited is extracted. The server S then generates a "patient information edit” screen on which the information of the patient (content of patient data table) is edited, and displays the same to the client C (see Fig. 19 ). After the editing of the patient information is terminated, the server S updates the content of the patient data table DB2 for the relevant patient. The screen then returns to the original basic screen W1.
- the server S When the user such as the doctor selects the "test data input” selecting part 152, the server S generates a "test data input screen" on which the test data is input, and displays the same to the client C (see Figs. 21 and 22 ). After the input of the test data is terminated, the screen returns to the original basic screen W1.
- the test data input screen is configured such that the basic test data screen ( Fig. 20 ) for inputting the basic test values such as weight, the OGTT data screen ( Fig. 21 ) for inputting the OGTT data, the target value screen ( Fig. 22 ) for inputting the target value of the basic test item can be switch displayed by tab form.
- the test result of each test item can be input for every test date.
- the data input in the basic test data screen is registered in the basic test result data table DB3 of the database as test result for every test date along with the patient ID.
- the OGTT glucose data blood glucose level change data
- the OGTT insulin data blood insulin concentration change data
- the data input in the OGTT data screen are registered in the OGTT data table DB4 of the database as test data for every test date along with the patient ID (see Fig. 17(c) ).
- the target value for the basic test items such as weight can be input.
- the data input in the target value screen are registered in the target value data table DB5 along with the patient ID (see Fig. 17(d) ).
- the simulator/analysis server S2 When new registration or correction of the OGTT data is performed in the OGTT data screen of FIG. 21 , the simulator/analysis server S2 performs simulation and pathological condition analysis by using the OGTT data, and acquires the pathological condition information (pathological condition feature information) showing the features of the pathological condition.
- the acquired pathological condition feature information is registered in the OGTT data table DB4 of the database in association with the OGTT data. The details of the pathological condition analysis will be hereinafter described.
- the weight information (one of the basic test items) of the patient is also necessary in simulation and pathological condition analysis, the weight of the patient at the test date of the most recent basic test is acquired from the basic test result data table DB.
- the basic test data are also used in simulation and pathological condition analysis, re-execution of the simulation and re-analysis of the pathological condition are performed in the system SS not limited to when new registration and correction of the OGTT data are performed in the OGTT data screen of Fig. 21 , but also when registration and correction of the basic test data are performed in the basic test data input screen of Fig. 20 .
- the re-acquired pathological condition feature information is registered in the OGTT data table DB4 of the database in association with the OGTT data used in the simulation.
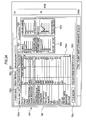
- the server S when the user such as the doctor selects the "main medical examination” selecting part 153 in basic screen W1, the server S generates "main medical examination” screen (doctor screen) W2 displaying information on the selected patient, and displays the same to the client C (see Fig. 15 ).
- the doctor screen W2 displays information on the "patient" selected in the basic screen W1, wherein the server S references the data tables DB2 to DB7 in the database with the patient ID of the selected patient as the key, extracts the information on the relevant patient, and generates the doctor screen W2 for displaying the information on the patient to support the diagnosis made by the doctor.
- the server S When the user such as the doctor selects "patient view” selecting part 154 in the basic screen W1, the server S generates "patient view” screen (doctor screen) W3) displaying information on the selected patient, and displays the same to the client C (see Fig. 16 ).
- the patient screen W3 displays information on the "patient" selected in the basic screen W1, and the server S references the data tables DB2 to DB7 in the database with the patient ID of the selected patient as the key, extracts the information on the relevant patient, and generates the patient screen W2 for displaying the information that can be browsed by the patient.
- Both screen transitions are the same in that the screen is switched to the main medical examination screen W2 or the doctor screen, or the patient view W3 screen or the patient screen. That is, in either case, the screen switching unit S1-B of the server S accepts the input for performing display switching from the client C and switches the screen.
- the former is used when displaying the main medical examination screen or the patient view of the selected patient while selecting the patient. That is, in order to switch to the display of "different patient", the user needs to return to the basic screen W1, and perform the former screen transition.
- the latter is used to switch the main medical examination screen or the patient view for "the same patient".
- the user does not need to return to the basic screen W1 to switch the screens, and the switch can be rapidly carried out with the operations of the operation screen regions W2A, W3A of each screen W2, W3.
- the doctor makes a diagnosis while browsing the doctor screen W2, and at that moment, directly (without passing through the basic screen W1) transition to the patient screen W3 from the doctor screen W2 when indicating the necessary information to the patient.
- directly without passing through the basic screen W1
- the main body screen region W2B of the doctor screen W2 includes a fixed display part 161 position fixedly displayed at the upper part of the main body screen region W2B.
- a multi-screen region (multi-window region) in which a plurality of position movably displayed screen regions (windows) are simultaneously displayed is formed at the region on the lower side of the fixed display part 161 of the main body screen region W2B.
- the fixed display part 161 displays patient information (information of patient data table DB2) such as name of patient, date of birth, patient ID, and the like, and furthermore, is arranged with "edit patient information” button 161a for displaying the patient information edit screen for editing the information of the patient and "reset arrangement” button 161b for returning the arrangement (position, size) of a plurality of screen regions to an initial state.
- patient information information of patient data table DB2
- “edit patient information” button 161a for displaying the patient information edit screen for editing the information of the patient
- "reset arrangement” button 161b for returning the arrangement (position, size) of a plurality of screen regions to an initial state.
- the multi-screen region of the present embodiment four screen regions (windows) of the basic test data screen region (basic test data window) 162, the OGTT data screen region (OGTT data window) 163, the prescription screen region (prescription window) 164, and the finding screen region (finding window) 165 are simultaneously displayed.
- Each screen region 162 to 165 is position adjustable within the multi-screen region of the doctor screen W2 by the operation of the mouse etc., and the size thereof is also adjustable.
- the basic test data screen region (screen region for displaying the related information on the patient) 162 and the OGTT data screen region (screen region for displaying the pathological condition information of the patient) 163 are particularly important to support the diagnosis by the doctor.
- the basic test data screen region 162 shows the test result obtained by the actual test (basic test), and the OGTT data screen region 163 shows the actual OGTT result and the pathological condition information or the result of the simulation analysis.
- the basic test screen region 162 is generated by the server S based on the information (test result) stored in the basic test result data table DB3 shown in Fig. 17(b) .
- the server S searches the basic test result data table with the patient ID of the selected patient as the key, and generates the test result information on the most recent test date in the basic test screen region 162 as the test result display part 162a.
- each test item name in the basic test result display part 162 can be selected by mouse operation (double click etc.), and the time-series graph 162b on the selected item is displayed at the position in the basic test screen region 162 (right side of test result display part 162a). If the target value is set for the selected test item, not only the test value Tst but also the target value Tr is displayed in the time-series graph 162b.
- the time-series graph 162b can be selected up to a maximum of four in the basic test screen region 162 of the doctor screen W2.
- Four time-series graphs 162b are shown in Fig. 15
- one time-series graph 162b is shown in Fig. 23 .
- the test result displayed in the test result display part 162a can be changed to a test result of a different test date.
- the basic test screen region 162 includes "another test date” button 162c for selecting an arbitrary test date and displaying the test result of the relevant test date, "previous test date” button 162d for displaying the test result of the previous test date, and "next test date” button 162e for displaying the test result of the next test date.
- the OGTT data screen region (screen region for displaying pathological condition information of the patient) 163 shown in Fig. 15 is generated by the server S based on the information (test data and analysis result) stored in the OGTT data table DB4 shown in Fig. 17(c) .
- the server S searches the OGTT data table DB4 with the patient ID of the selected patient as the key, acquires the test data (OGTT time-series data) and the analysis result (pathological condition information) on the most recent test date, and generates the time-series graph 163a of the OGTT test data and the radar chart 163b of the analysis result in the OGTT screen region 163.
- a time-series change 163a-1 of the blood glucose level in the actual OGTT test result and a time-series change 163a-2 of the insulin concentration in the actual OGTT test result are displayed in the time-series graph 163a.
- the radar chart 163b shows the result of performing the pathological condition analysis.
- the details of the process of performing pathological condition analysis from simulation based on the biological model and acquiring the pathological condition information (pathological condition feature information) will be described below.
- the parameter set configuring the biological model capable of outputting the reproduction value (pseudo-response information) simulating the actual OGTT test result (biological response information) is obtained through calculation.
- the system SS obtains the reproduction value (pseudo-response information) of the OGTT test result as the output value of the biological model applied with such parameter set (pseudo-response acquiring function of the system SS).
- the simulator/analysis server S2 obtains the pathological condition information (pathological condition feature information) indicating the feature of the pathological condition of the patient based on the generated biological model (parameter set thereof) (pathological condition feature information acquiring function of the system SS).
- pathological condition feature information indicating the feature of the pathological condition of the patient based on the generated biological model (parameter set thereof) (pathological condition feature information acquiring function of the system SS).
- P1 fasting blood glucose
- P2 basic secretion
- P3 additional secretion
- P4 secretion sensitivity
- P5 glucose regeneration suppression
- P6 glucose disposal ability
- P7 processing sensitivity
- Such indices are adopted as satisfactorily representing the features of the pathological condition, and in particular, biological functions that can be improved by treatment are adopted.
- the indices of the pathological condition feature are not limited to the above.
- P4 secretion sensitivity is calculated from the sensitivity ⁇ with respect to glucose stimulation or the parameter of the biological model.
- P5 glucose regeneration suppression is calculated from the glucose release HGTP(t) which is a variable of the biological model.
- P6 glucose disposal ability is calculated from the net glucose SGO(t) and the blood glucose level BG(t) from the liver, which are variables of the biological model.
- P7 processing sensitivity is calculated from the insulin dependent glucose consumption rate Kp in the peripheral tissue per unit insulin or unit glucose, which is a parameter of the biological model.
- the biological model is configured by a mathematical model having parameters (include variables) indicating the characteristics of the biological organs
- the parameter values of the biological model indicate values related to the pathological condition. Therefore, the pathological condition information (pathological condition feature information) indicating the features of the pathological condition can be calculated based on such parameters.
- the calculated pathological condition information is registered in the OGTT data table DB4 of the database as analysis result, and used to create a radar chart 163b.
- the values for every index of the pathological condition feature information are scored and displayed, so that good and bad of the value of each index having different units and numeral widths can be compared.
- the doctor looks at the radar chart 163b to diagnose the pathological condition of the patient. For instance, if the radar chart 163b shows that the glucose disposal ability and the processing sensitivity related to the glucose disposal ability at the peripherals are low, the doctor looking at the radar chart can easily determine that the treatment method that improves the glucose disposal ability at the peripherals is effective.
- the doctors can compare both displays and learn about the relation of the graph shape of the OGTT test result and the pathological condition. Therefore, an effective learning effect for understanding the pathological condition from the OGTT test result can be expected by building up experiences by actually using the system SS.
- the doctor can also build up experience of understanding the pathological condition even in relation to the basic test result.
- the screen region 163 for displaying the pathological condition information of the patient and the screen region 162 for displaying the related information (in particular, basic test information) related to the patient are simultaneously displayed, thereby supporting the doctor to make an accurate diagnosis based on great amount of information.
- the doctor can further build up experience since great amount of information are displayed.
- test result reproduction value prseudo-response information
- pathological condition feature information e.g., a test result value obtained in the relevant case.
- the system can be used for training purpose by inputting an appropriate test result even if the actual data of the patient are not provided, and checking what kind of output is obtained.
- the present system SS can be used for training purpose for non-specialists or doctors with little experience to learn.
- a "pathological condition review/recommended treatment/term explanation" column (pathological condition review display part) 163c is arranged in the OGTT data screen region 163, wherein text explanation (pathological condition review) such as review of the pathological condition, recommended treatment, term explanation etc. is displayed. Since the "pathological condition review/recommended treatment/term explanation" column 163c is arranged, the pathological condition feature information displayed on the radar chart 132 can be easily understood, and the doctor can more accurately understand the pathological condition. Information useful for determining the treatment method etc. is also obtained.
- the pathological condition review text displayed on the pathological condition review display part 163c is registered in the database in advance, the pathological condition review text corresponding to the generated biological model (parameter thereof) is selected by the system, and the selected text is displayed on the pathological condition review display part 163c.
- a special instruction display part 163d is also arranged, so that when there is a special instruction on the pathological condition information obtained by analysis, such special instruction is displayed on the special instruction display part 163.
- the data displayed on the time-series graph 163a and the radar chart 163b of the OGTT data screen region 163 can be changed to those of a different test date.
- the basic test screen region 162 includes "another test date” button 163e for selecting an arbitrary test date and displaying the test result of the relevant test date and the pathological condition information based on the relevant test result, "previous test date” button 163f for displaying the test result etc. of the previous test date, and "next test date” button 163g for displaying the test result etc. of the next test date.
- An overlay display for displaying the data of different test dates in an overlapping manner is possible in the time-series graph 163a and the radar chart 163b of the OGTT data screen region 163.
- the check box 163h of the overlay display of the OGTT data screen region 163 is checked, the "select date" or the date selecting button is selected, and the test date of the data desired to be displayed in an overlapping manner on the current time-series graph 163a and the radar chart 163b is selected, so that the time-series graph 163a and the radar chart 163b of both test dates are displayed in an overlapping manner.
- the doctor can simultaneously compare the OGTT data and the pathological condition information of different dates, and make a diagnosis based on temporal changes of the OGTT data and the pathological condition information.
- the OGTT test data and the analysis result may be displayed as it is as numerical information instead of being illustrated as the time-series graph 163a and the radar 163b.
- the prescription screen region (prescription window) 164 and the finding screen region (finding window) 165 are also displayed.
- the prescription content can be registered for every medical examination date in the prescription screen region 164.
- the prescription content is registered for every medical examination date in the prescription data table DB6 shown in Fig. 17(e) .
- the pathological condition understood by the doctor can be registered in the finding screen region 165 as finding of the doctor.
- the finding content is registered for every medical examination date in the finding data table DB7 shown in Fig. 17(f) .
- the present system SS also has a function serving as an electronic carte, thereby enhancing convenience.
- the prescription screen region 164 and the finding screen region 165 are both registered in the data tables DB6, DB7, similar to the basic test data screen region 162 and the OGTT data screen region.
- the prescription content or the finding content on another medical examination date can also be displayed.
- Figs. 24 to 27 show the patient screen W3 in addition to Fig. 16 .
- the main body screen region W3B of the patient screen W3 includes the fixed display part 181 position fixedly displayed at the upper part of the main body screen region W3B.
- the region on the lower side of the fixed display part 181 of the main body screen region W3B is formed as a tab switching screen region 182 capable of switching a plurality of screen regions by tab switching.
- the fixed display part 181 displays patient information (information of patient data table DB2) such as name of patient, date of birth, attending physician, and the like.
- patient information information of patient data table DB2
- information not necessarily required for the patient are omitted, for example, patient ID is not displayed, whereby information amount is reduced, and a simple and viewable display is obtained.
- the fixed display part 181 of the patient screen W3 has larger characters, and thus is an easily viewable display.
- the fixed display part 181 of the patient screen W3 is not arranged with the buttons 161a, 161b in the fixed display part 161 of the doctor screen W, and thus is a simple and easily viewable display.
- the tab switching screen region 182 includes four screen switching tabs 182a, 182b, 182c, and 182d.
- the "basic test data” tab 182a displays the basic test data screen region 192
- the "OGTT data” tab 182b displays the OGTT data screen region 193
- the "prescription/finding” tab 182c displays the prescription/finding screen region 194
- "past prescription list” tab 182d displays the past prescription list screen region 195.
- Figs. 16 and 24 show the basic test data screen region 192 of the patient screen W3.
- the basic test data screen region 192 is generated from the basic test result data table DB3 with the patient ID as the key.
- the basic test data screen region 192 cannot change position and size, but is formed over substantially the entire tab switching screen region 182, and is formed larger than the basic test data screen region 162 (size of initial state: see Figs. 2 and 3 ) of the doctor screen W2.
- test result information on the most recent test date is displayed as test result display part 192a on the basic test data screen region 192 of the patient screen W3.
- the test result display part 192a is formed larger than the test result display part 162a of the doctor screen W2, and displays greater amount of information.
- target values set for each test item are contained in the test result display part 192a of the patient screen W3.
- the target value is obtained by referencing the target value data table DB5 (see Fig. 17(d) ) with the patient ID as the key.
- each test item name in the basic test result display part 192 can be selected by mouse operation (double click etc.), and the time-series graph 192b for the selected item is displayed at the position in the basic test data screen region 192 (right side of test result display part 192a).
- Up to four time-series graphs 192b can be selected in the basic test data screen region 192 of the patient screen W3.
- the test result displayed in the test result display part 192a can be changed to a test result of a different test date.
- the basic test screen region 192 includes "another test date” button 192c for selecting an arbitrary test date and displaying the test result of the relevant test date.
- the test result display part 192a is arranged with "display/not display comparison column” switching button 192d for displaying the basic test data of another test date as a comparison column or not displaying the relevant display.
- the patient screen W3 in which the basic test data screen region 192 of the patient screen W3 is selectively displayed is a test result screen for displaying the result information of a medical test of the patient without involving display of the pathological condition information.
- Fig. 24 shows the OGTT data screen region 193 of the patient screen w3.
- the OGTT data screen region 193 is generated based on the OGTT data table DB4 with the patient ID as the key.
- the OGTT data screen region 193 also can not change the position or the size, but is formed over substantially the entire tab switching screen region 182, and is formed larger than the OGTT data screen region 162 of the doctor screen W2.
- the time-series graph 193a of the OGTT test data and the radar chart 193b of the analysis result (pathological condition information) can be displayed.
- the numerical data 193c of the OGTT test data that could not be displayed unless switched with the tab is simultaneously displayed. The numerical data could not be displayed unless switched with the tab in the doctor screen W2, but is displayed with the graph in the patient screen W2.
- information 193a to 193c on a plurality of test dates can be simultaneously displayed, and the patient can simultaneously compare information on a plurality of test dates.
- the information of the basic test data screen region 192 and the OGTT data screen region 193 are information of different tests for the user, and the necessity to simultaneously view them is low, and thus the convenience of the patient does not lower even if the screen regions 192, 193 are selectively displayed.
- Fig. 26 shows the prescription/finding screen region 194 of the patient screen W3.
- the prescription/finding screen region 194 is generated from the prescription data table DB6 and the finding data table DB7 with the patient ID as the key, and the collection of the display content of the prescription screen region 164 and the display content of the finding screen region 165 of the doctor screen W2 is displayed.
- "G" selecting part 107 is displayed as the image selecting part on the operation screen region W3A.
- the image selecting part 107 is provided for the user such as the doctor to switch and select the image 194g displayed on the prescription/finding screen region 194.
- Fig. 27 shows the "past prescription list” screen region 195 of the patient screen W3.
- the "past prescription list” screen region 195 is generated from the prescription data table DB6 with the patient ID as the key, and a list of medicines prescribed in a predetermined period in the past is displayed.
- Each screen region 192 and 193 of the patient screen W3 described above is printed by selecting the "print" button 106.
- all the necessary information can be printed even if the content of the screen is printed as it is, and a printout easily viewable for the patient can be obtained.
- the display format of the pathological condition information is not limited to a radar chart and may be in other display formats.
- the type and number of pathological condition information to be displayed are not particularly limited, and three indices of hepatic glucose metabolism ability, insulin secretion ability, and peripheral insulin sensitivity may be displayed as pathological condition information.
- the data table is shown in plurals in Fig. 17 , but such data tables may be integrated into one table.
- the data of the most recent test date of the patient is displayed when the screen is switched between the doctor screen W2 and the patient screen W3, but in the doctor screen W2 or the patient screen W3, when switched to another screen W2, W3 after selecting another test date as the test date, the data of another test date may still be continuously displayed in the switched screen W2, W3.
Landscapes
- Medical Informatics (AREA)
- Engineering & Computer Science (AREA)
- Public Health (AREA)
- Health & Medical Sciences (AREA)
- Pathology (AREA)
- Databases & Information Systems (AREA)
- Data Mining & Analysis (AREA)
- Biomedical Technology (AREA)
- Epidemiology (AREA)
- General Health & Medical Sciences (AREA)
- Primary Health Care (AREA)
- Measuring And Recording Apparatus For Diagnosis (AREA)
- Medical Treatment And Welfare Office Work (AREA)
Applications Claiming Priority (1)
| Application Number | Priority Date | Filing Date | Title |
|---|---|---|---|
| JP2007136412A JP2008293171A (ja) | 2007-05-23 | 2007-05-23 | 医療診断支援コンピュータシステム、コンピュータプログラム、及びサーバコンピュータ |
Publications (2)
| Publication Number | Publication Date |
|---|---|
| EP1995680A2 true EP1995680A2 (de) | 2008-11-26 |
| EP1995680A3 EP1995680A3 (de) | 2011-01-19 |
Family
ID=39745682
Family Applications (1)
| Application Number | Title | Priority Date | Filing Date |
|---|---|---|---|
| EP08009364A Withdrawn EP1995680A3 (de) | 2007-05-23 | 2008-05-21 | Medizinisches Diagnosecomputersystem, Computerprogramm und Servercomputer |
Country Status (4)
| Country | Link |
|---|---|
| US (1) | US20090177453A1 (de) |
| EP (1) | EP1995680A3 (de) |
| JP (1) | JP2008293171A (de) |
| CN (1) | CN101310686A (de) |
Cited By (3)
| Publication number | Priority date | Publication date | Assignee | Title |
|---|---|---|---|---|
| WO2013053275A1 (zh) * | 2011-10-10 | 2013-04-18 | 腾讯科技(深圳)有限公司 | 一种显示闪屏内容的方法、终端、内容服务器及系统 |
| EP2880175A4 (de) * | 2012-08-03 | 2016-04-06 | Univ Virginia Patent Found | Computersimulation zum prüfen und überwachen von behandlungsstrategien für stressbedingte hyperglykämie |
| CN106963125A (zh) * | 2017-03-29 | 2017-07-21 | 韩跃 | 一种医疗用便于医生就诊使用的工作桌 |
Families Citing this family (31)
| Publication number | Priority date | Publication date | Assignee | Title |
|---|---|---|---|---|
| CN101464928B (zh) * | 2008-12-30 | 2010-06-02 | 深圳市蓝韵实业有限公司 | 一种超声诊断报告辅助提示方法 |
| WO2011028731A1 (en) * | 2009-09-01 | 2011-03-10 | University Of Virginia Patent Foundation | System, method and computer program product for adjustment of insulin delivery (aid) in diabetes using nominal open-loop profiles |
| JP5394881B2 (ja) * | 2009-10-09 | 2014-01-22 | 徳子 佐藤 | 診療情報処理方法 |
| WO2012093363A2 (en) * | 2011-01-07 | 2012-07-12 | Koninklijke Philips Electronics N.V. | Integrated access to and interation with multiplicity of clinica data analytic modules |
| US20130282397A1 (en) | 2012-04-20 | 2013-10-24 | Cerner Innovation, Inc. | Provider management of referral orders |
| US20130282391A1 (en) * | 2012-04-20 | 2013-10-24 | Cerner Innovation, Inc. | Patient management of referral orders |
| USD727342S1 (en) | 2012-06-05 | 2015-04-21 | P&W Solutions Co., Ltd. | Display screen with graphical user interface |
| WO2015002409A1 (en) | 2013-07-01 | 2015-01-08 | Samsung Electronics Co., Ltd. | Method of sharing information in ultrasound imaging |
| NZ766323A (en) * | 2014-08-01 | 2022-05-27 | Resmed Inc | Patient management system |
| CN104473745B (zh) * | 2014-12-28 | 2016-07-06 | 戚敬虎 | 肝病患者专用检查桌 |
| CN104958077A (zh) * | 2015-07-24 | 2015-10-07 | 珠海福尼亚医疗设备有限公司 | 一种智能控制的闭环式人工胰腺系统 |
| CN105342555A (zh) * | 2015-09-09 | 2016-02-24 | 曹宏 | 糖尿病患者综合评估方法 |
| JP6603576B2 (ja) * | 2015-12-25 | 2019-11-06 | 富士フイルム株式会社 | 診療支援装置とその作動方法および作動プログラム、並びに診療支援システム |
| JP2017162122A (ja) * | 2016-03-08 | 2017-09-14 | 富士通株式会社 | カルテ表示プログラム、装置、及び方法 |
| CN106778039A (zh) * | 2017-01-20 | 2017-05-31 | 深圳第医学健康管理有限公司 | 诊疗辅助系统及方法 |
| US10904211B2 (en) | 2017-01-21 | 2021-01-26 | Verisign, Inc. | Systems, devices, and methods for generating a domain name using a user interface |
| CN106951724B (zh) * | 2017-05-09 | 2019-03-19 | 山东省千佛山医院 | 适用于肝癌及消化道癌的病理诊断报告生成系统及方法 |
| USD844649S1 (en) | 2017-07-28 | 2019-04-02 | Verisign, Inc. | Display screen or portion thereof with a sequential graphical user interface |
| USD882602S1 (en) | 2017-07-28 | 2020-04-28 | Verisign, Inc. | Display screen or portion thereof with a sequential graphical user interface of a mobile device |
| US20200027530A1 (en) * | 2018-07-18 | 2020-01-23 | International Business Machines Corporation | Simulating Patients for Developing Artificial Intelligence Based Medical Solutions |
| JP7333811B2 (ja) | 2018-10-05 | 2023-08-25 | メドトロニック,インコーポレイテッド | 心臓頻脈性不整脈の多層予測 |
| CN109637610A (zh) * | 2018-11-19 | 2019-04-16 | 深圳市理邦精密仪器股份有限公司 | 心电报告的配置方法、终端设备及介质 |
| CN109935336B (zh) * | 2019-01-15 | 2023-10-31 | 北京思普科软件股份有限公司 | 一种儿童呼吸科疾病的智能辅助诊断系统 |
| US20200352466A1 (en) | 2019-05-06 | 2020-11-12 | Medtronic, Inc. | Arrythmia detection with feature delineation and machine learning |
| US11694804B2 (en) | 2019-05-06 | 2023-07-04 | Medtronic, Inc. | Reduced power machine learning system for arrhythmia detection |
| US11723577B2 (en) * | 2019-05-06 | 2023-08-15 | Medtronic, Inc. | Visualization of arrhythmia detection by machine learning |
| US11776691B2 (en) | 2019-05-06 | 2023-10-03 | Medtronic, Inc. | Machine learning based depolarization identification and arrhythmia localization visualization |
| EP4080519A4 (de) | 2019-12-19 | 2023-02-08 | Xenlon Corporation | Simulationssystem und programm |
| JP2022042897A (ja) * | 2020-09-03 | 2022-03-15 | 国立大学法人千葉大学 | 予測処理システム |
| JP7615794B2 (ja) * | 2021-03-18 | 2025-01-17 | コニカミノルタ株式会社 | 動態情報処理装置、プログラム、動態情報処理方法及び動態情報処理システム |
| CN118614913A (zh) * | 2024-07-15 | 2024-09-10 | 江苏省人民医院(南京医科大学第一附属医院) | 一种扩展式胰岛功能辅助分析设备及其数据处理方法 |
Citations (2)
| Publication number | Priority date | Publication date | Assignee | Title |
|---|---|---|---|---|
| JPH10332704A (ja) | 1997-05-30 | 1998-12-18 | Nokia Mobile Phones Ltd | 糖尿病管理 |
| JPH11296598A (ja) | 1998-04-07 | 1999-10-29 | Seizaburo Arita | 血糖値の予測システム及び予測方法並びにこの方法を記録した記録媒体 |
Family Cites Families (9)
| Publication number | Priority date | Publication date | Assignee | Title |
|---|---|---|---|---|
| US138922A (en) * | 1873-05-13 | Improvement in type-setting machines | ||
| JP3567520B2 (ja) * | 1995-03-30 | 2004-09-22 | 株式会社日立製作所 | 診療情報システム |
| JP2706645B2 (ja) * | 1995-12-27 | 1998-01-28 | 株式会社亀田医療情報研究所 | 医療計画支援システム並びに医療計画支援装置及び方法 |
| JP4109084B2 (ja) * | 2002-11-05 | 2008-06-25 | オリンパス株式会社 | 医療情報システム及び医療情報管理方法 |
| JP4547173B2 (ja) * | 2004-03-17 | 2010-09-22 | シスメックス株式会社 | 糖尿病診療支援システム |
| CN100533429C (zh) * | 2004-05-11 | 2009-08-26 | 希森美康株式会社 | 葡萄糖和胰岛素浓度模拟系统及记录介质 |
| US20060026035A1 (en) * | 2004-07-28 | 2006-02-02 | William Younkes | Computer aided interactive medical management information and control system and method |
| JP4781710B2 (ja) * | 2005-05-12 | 2011-09-28 | シスメックス株式会社 | 治療効果予測システム及びそのプログラム |
| CA2625744A1 (en) * | 2005-10-11 | 2007-04-19 | Tethys Bioscience, Inc. | Diabetes-associated markers and methods of use thereof |
-
2007
- 2007-05-23 JP JP2007136412A patent/JP2008293171A/ja not_active Ceased
-
2008
- 2008-05-15 US US12/152,593 patent/US20090177453A1/en not_active Abandoned
- 2008-05-19 CN CNA2008100981454A patent/CN101310686A/zh active Pending
- 2008-05-21 EP EP08009364A patent/EP1995680A3/de not_active Withdrawn
Patent Citations (2)
| Publication number | Priority date | Publication date | Assignee | Title |
|---|---|---|---|---|
| JPH10332704A (ja) | 1997-05-30 | 1998-12-18 | Nokia Mobile Phones Ltd | 糖尿病管理 |
| JPH11296598A (ja) | 1998-04-07 | 1999-10-29 | Seizaburo Arita | 血糖値の予測システム及び予測方法並びにこの方法を記録した記録媒体 |
Cited By (5)
| Publication number | Priority date | Publication date | Assignee | Title |
|---|---|---|---|---|
| WO2013053275A1 (zh) * | 2011-10-10 | 2013-04-18 | 腾讯科技(深圳)有限公司 | 一种显示闪屏内容的方法、终端、内容服务器及系统 |
| US9912762B2 (en) | 2011-10-10 | 2018-03-06 | Tencent Technology (Shenzhen) Company Limited | Method for displaying splash screen content, terminal, content server, and system therefor |
| EP2880175A4 (de) * | 2012-08-03 | 2016-04-06 | Univ Virginia Patent Found | Computersimulation zum prüfen und überwachen von behandlungsstrategien für stressbedingte hyperglykämie |
| US10438700B2 (en) | 2012-08-03 | 2019-10-08 | University Of Virginia Patent Foundation | Computer simulation for testing and monitoring of treatment strategies for stress hyperglycemia |
| CN106963125A (zh) * | 2017-03-29 | 2017-07-21 | 韩跃 | 一种医疗用便于医生就诊使用的工作桌 |
Also Published As
| Publication number | Publication date |
|---|---|
| US20090177453A1 (en) | 2009-07-09 |
| CN101310686A (zh) | 2008-11-26 |
| EP1995680A3 (de) | 2011-01-19 |
| JP2008293171A (ja) | 2008-12-04 |
Similar Documents
| Publication | Publication Date | Title |
|---|---|---|
| EP1995680A2 (de) | Medizinisches Diagnosecomputersystem, Computerprogramm und Servercomputer | |
| US10290070B2 (en) | System and method for integrating data with guidelines to generate displays containing the guidelines and data | |
| US9081879B2 (en) | Matrix interface for medical diagnostic and treatment advice system and method | |
| SALSA Collaborative Study Group et al. | The development of a short questionnaire for screening of activity limitation and safety awareness (SALSA) in clients affected by leprosy or diabetes | |
| JP4781710B2 (ja) | 治療効果予測システム及びそのプログラム | |
| Masotta et al. | Telehealth care and remote monitoring strategies in heart failure patients: A systematic review and meta-analysis | |
| Smith et al. | Impact of a diabetes electronic management system on the care of patients seen in a subspecialty diabetes clinic | |
| Plougmann et al. | DiasNet—a diabetes advisory system for communication and education via the internet | |
| JP2004534975A5 (de) | ||
| JP4861687B2 (ja) | 医療用シミュレーションシステム及びそのコンピュータプログラム | |
| JP7238705B2 (ja) | 診療支援方法、診療支援システム、学習モデルの生成方法、および、診療支援プログラム | |
| US20050060199A1 (en) | System and method for managing diseases according to standard protocols and linking patients to medication samples and related benefits | |
| JP4932204B2 (ja) | 診療支援システム、診療支援装置及び診療支援プログラム | |
| Lipscomb et al. | Outcomes research at the National Cancer Institute: measuring, understanding, and improving the outcomes of cancer care | |
| Pynsent et al. | Computer interview system for patients with back pain | |
| Latham et al. | A health protection model for Hispanic adults with Type 2 diabetes | |
| Moorhead et al. | Nursing outcomes classification implementation projects across the care continuum | |
| JP4298255B2 (ja) | シート・タイプの検査結果表示方法および装置 | |
| JP3076336B1 (ja) | 電子式医療管理システム | |
| Nahm | Neurology, technology, and the diagnostic imperative | |
| Ashoka et al. | Modeling glucose–insulin dynamics to evaluate healthy and diseased population characteristics in type 2 diabetes mellitus | |
| Hu et al. | Factors influencing rural primary care physicians' intention to provide breast cancer screening services based on the theory of planned behavior: a cross-sectional study | |
| Bungay | Methods to assess the humanistic outcomes of clinical pharmacy services | |
| Kristianto et al. | Developing Application Software for Detecting and Documenting Diabetic Foot Complications for Use by Nurses | |
| TWM663833U (zh) | 應用於慢性疾病看診之臨床決策支援系統 |
Legal Events
| Date | Code | Title | Description |
|---|---|---|---|
| PUAI | Public reference made under article 153(3) epc to a published international application that has entered the european phase |
Free format text: ORIGINAL CODE: 0009012 |
|
| AK | Designated contracting states |
Kind code of ref document: A2 Designated state(s): AT BE BG CH CY CZ DE DK EE ES FI FR GB GR HR HU IE IS IT LI LT LU LV MC MT NL NO PL PT RO SE SI SK TR |
|
| AX | Request for extension of the european patent |
Extension state: AL BA MK RS |
|
| PUAL | Search report despatched |
Free format text: ORIGINAL CODE: 0009013 |
|
| AK | Designated contracting states |
Kind code of ref document: A3 Designated state(s): AT BE BG CH CY CZ DE DK EE ES FI FR GB GR HR HU IE IS IT LI LT LU LV MC MT NL NO PL PT RO SE SI SK TR |
|
| AX | Request for extension of the european patent |
Extension state: AL BA MK RS |
|
| 17P | Request for examination filed |
Effective date: 20110712 |
|
| AKX | Designation fees paid |
Designated state(s): AT BE BG CH CY CZ DE DK EE ES FI FR GB GR HR HU IE IS IT LI LT LU LV MC MT NL NO PL PT RO SE SI SK TR |
|
| STAA | Information on the status of an ep patent application or granted ep patent |
Free format text: STATUS: THE APPLICATION HAS BEEN WITHDRAWN |
|
| 18W | Application withdrawn |
Effective date: 20120726 |