US20090177453A1 - Medical diagnosis support computer system, computer program, and server computer - Google Patents
Medical diagnosis support computer system, computer program, and server computer Download PDFInfo
- Publication number
- US20090177453A1 US20090177453A1 US12/152,593 US15259308A US2009177453A1 US 20090177453 A1 US20090177453 A1 US 20090177453A1 US 15259308 A US15259308 A US 15259308A US 2009177453 A1 US2009177453 A1 US 2009177453A1
- Authority
- US
- United States
- Prior art keywords
- patient
- screen
- doctor
- display
- pathological condition
- Prior art date
- Legal status (The legal status is an assumption and is not a legal conclusion. Google has not performed a legal analysis and makes no representation as to the accuracy of the status listed.)
- Abandoned
Links
Images


Classifications
-
- G—PHYSICS
- G16—INFORMATION AND COMMUNICATION TECHNOLOGY [ICT] SPECIALLY ADAPTED FOR SPECIFIC APPLICATION FIELDS
- G16H—HEALTHCARE INFORMATICS, i.e. INFORMATION AND COMMUNICATION TECHNOLOGY [ICT] SPECIALLY ADAPTED FOR THE HANDLING OR PROCESSING OF MEDICAL OR HEALTHCARE DATA
- G16H50/00—ICT specially adapted for medical diagnosis, medical simulation or medical data mining; ICT specially adapted for detecting, monitoring or modelling epidemics or pandemics
- G16H50/50—ICT specially adapted for medical diagnosis, medical simulation or medical data mining; ICT specially adapted for detecting, monitoring or modelling epidemics or pandemics for simulation or modelling of medical disorders
Definitions
- the present invention relates to a medical diagnosis support computer system used to support diagnosis of diabetes or the like, a computer program, and a server computer.
- the doctors are currently selecting the treatment methods relying on his/her experience and intuition based on information for making a decision such as test results and clinical findings of the patient.
- a system for supporting medical examination includes a system for predicting blood glucose level as disclosed in Japanese Laid-Open Patent Publication No. 10-332704 and Japanese Laid-Open Patent Publication No. 11-296598.
- Such systems support the medical examination by predicting change in the blood glucose level of a patient and providing the predicted blood glucose level to the doctor.
- the disease is hoped such that the doctor can understand the factor with only the test values, but in some diseases, it is significantly difficult to appropriately understand the factor with only the test values.
- blood glucose level is used as an index for indicating the extent of the disease.
- blood glucose level is merely a result, and it is not easy to accurately understand the pathological conditions such as insulin deficiency, peripheral insulin resistance, lowering in uptake of hepatic glucose, and increase in release of hepatic glucose from the clinical findings and the like.
- the specialist determines the pathological condition of the patient by using oral glucose tolerance test, electrocardiogram, and test results such as blood pressure, pulse measurement, blood test, and the like, but abundant experience is required in order to accurately determine the pathological condition from the test results, and this accurate determination is difficult for non-specialists.
- the information may be too complex for the patient, thereby impairing easy understanding of the patient.
- a first aspect of the present invention is a medical diagnosis support computer system for supporting diagnosis of a patient by a doctor, the system comprising: a display device; and a controller in communication with the display device, the controller comprising a processor configured to build a biological model representing biological functions of the patient on a computer, generate pathological condition information of the patient based on the biological model, display a doctor screen for the doctor and a patient screen for the patient in a switchable manner on the display device, and accept an input for switching the display between the doctor screen and the patient screen; wherein the doctor screen is configured to simultaneously display a screen region for displaying the pathological condition information of the patient and a screen region for displaying one or more related information related to the patient; and the patient screen is configured to selectively display a display content between the pathological condition information of the patient and one or more related information related to the patient.
- a second aspect of the present invention is a computer program product, comprising: a computer readable medium; and instructions, on the computer readable medium, adapted to enable a general purpose computer to perform operations, comprising: building a biological model representing biological functions of the patient on a computer; generating pathological condition information of the patient based on the biological model; displaying a doctor screen for the doctor and a patient screen for the patient in a switchable manner on the display device; and receiving an input for switching the display between the doctor screen and the patient screen; wherein the doctor screen is configured to simultaneously display a screen region for displaying the pathological condition information of the patient and a screen region for displaying one or more related information related to the patient; and the patient screen is configured to selectively display a display content between the pathological condition information of the patient and one or more related information related to the patient.
- a third aspect of the present invention is A medical diagnosis support computer system for supporting diagnosis of a patient by a doctor, the system comprising: a display device; and a controller in communication with the display device, the controller comprising a processor configured to build a biological model representing biological functions of the patient on a computer, generate pathological condition information of the patient based on the biological model, display a doctor screen for the doctor and a patient screen for the patient in a switchable manner on the display device, and receive an input for switching the display between the doctor screen and the patient screen; wherein the doctor screen is configured to simultaneously display a screen region for displaying the pathological condition information of the patient and a screen region for displaying one or more related information related to the patient; and the patient screen comprises a test result screen for displaying result information of a medical test of the patient without display of the pathological condition information.
- a fourth aspect of the present invention is a computer program product, comprising: a computer readable medium; and instructions, on the computer readable medium, adapted to enable a general purpose computer to perform operations, comprising: building a biological model representing biological functions of the patient on a computer; generating pathological condition information of the patient based on the biological model; displaying a doctor screen for the doctor and a patient screen for the patient in a switchable manner on the display device; and receiving an input for switching the display between the doctor screen and the patient screen; wherein the doctor screen is configured to simultaneously display a screen region for displaying the pathological condition information of the patient and a screen region for displaying one or more related information related to the patient; and the patient screen comprises a test result screen for displaying result information of a medical test of the patient without display of the pathological condition information.
- a fifth aspect of the present invention is a server computer for displaying a screen for supporting a diagnosis of a patient by a doctor on a display device of a terminal device connected by way of a network
- the server computer comprising: a controller in communication with the terminal device, the controller comprising a processor configured to display a doctor screen for the doctor and a patient screen for the patient in a switchable manner on the display device of the terminal device, and switch the display between the doctor screen and the patient screen when an input for switching between the doctor screen and the patient screen is made at the terminal device; wherein the doctor screen is configured to simultaneously display a screen region for displaying pathological condition information of the patient generated based on a biological model built on a computer to represent biological functions of the patient and a screen region for displaying one or more related information related to the patient; and the patient screen is configured to selectively display a display content between the pathological condition information of the patient and one or more related information related to the patient.
- a sixth aspect of the present invention is a server computer for displaying a screen for supporting a diagnosis of a patient by a doctor on a display device of a terminal device connected by way of a network
- the server computer comprising: a controller in communication with the terminal device, the controller comprising a processor configured to display a doctor screen for the doctor and a patient screen for the patient in a switchable manner on the display device of the terminal device, and switch the display between the doctor screen and the patient screen when an input for switching between the doctor screen and the patient screen is made at the terminal device; wherein the doctor screen is configured to simultaneously display a screen region for displaying pathological condition information of the patient generated based on a biological model built on a computer to represent biological functions of the patient and a screen region for displaying one or more related information related to the patient; and the patient screen includes a test result screen for displaying result information of a medical test of the patient without display of the pathological condition information.
- FIG. 1 is a system configuration view of a medical diagnosis support computer system
- FIG. 2 is a block diagram showing a hardware configuration of a server
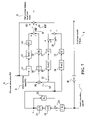
- FIG. 3 is a block diagram showing an overall configuration of a biological model
- FIG. 4 is a block diagram showing a configuration of a pancreas model of the biological model
- FIG. 5 is a block diagram showing a configuration of a hepatic model of the biological model
- FIG. 6 is a block diagram showing a configuration of an insulin kinetics model of the biological model
- FIG. 7 is a block diagram showing a configuration of a peripheral tissue model of the biological model
- FIG. 8 is a flowchart showing a parameter set generating process procedure
- FIG. 9 shows actual measured OGTT time-series data, wherein (a) is blood glucose level, and (b) is blood insulin concentration;
- FIG. 10 is a configuration of a template database DB 1 ;
- FIG. 11 is a template data, wherein (a) is blood glucose level and (b) is insulin concentration;
- FIG. 12 is a view showing error summation of the OGTT time-series data with respect to the template T 1 , wherein (a) is blood glucose level and (b) is insulin concentration;
- FIG. 13 is a basic screen of the system
- FIG. 14 is a screen transition view of the system
- FIG. 15 is a doctor screen
- FIG. 16 is a patient screen
- FIG. 17 is a view showing a data structure of a database
- FIG. 18 is a view showing an operation menu of the basic screen
- FIG. 19 is a patient information edit screen
- FIG. 20 is a basic test data input screen
- FIG. 21 is an OGTT data input screen
- FIG. 22 is a target value input screen
- FIG. 23 is a doctor screen
- FIG. 24 is a patient screen in which the basic test data screen region is selected.
- FIG. 25 is a patient screen in which the OGTT data screen region is selected.
- FIG. 26 is a patient screen in which the prescription/finding screen region is selected.
- FIG. 27 is a patient screen in which the past prescription list screen region is selected.
- FIG. 1 shows a system configuration view of the case when a medical diagnosis support computer system SS is configured as a server client system.
- the system SS is built as a system for supporting diagnosis of diabetes.
- the system SS is configured as a network system including a server computer (hereinafter also simply referred to as “server”) S, and a client terminal device (hereinafter also simply referred to as “client”) connected to the server S by way of Internet or network such as LAN.
- server server computer
- client client terminal device
- the system SS may be configured by one computer.
- the client C is used by a user such as doctor, laboratory technician, and the like.
- the client C is configured by a computer including a display device (display) and an input device (keyboard or mouse etc.).
- a printer (not shown) is connected to the client C, so that display screen etc. of the client can be printed.
- the client C includes a Web browser C 1 .
- the Web browser C 1 serves as a user interface of the system SS. That is, the screen generated in the server S and transmitted to the client C is output on the Web browser C 1 .
- the user can input and perform necessary operations on the Web browser C 1 .
- the server S has a function serving as an application server S 1 , a function serving as a simulator/analysis server S 2 , and a function serving as a database server S 3 .
- Each function S 1 to S 3 may be realized with one computer, or may be realized by a plurality of computers connected network.
- the application server S 1 has a central function to have the network system SS function as the medical diagnosis support system, and has a function of generating a screen to be displayed on the Web browser C 1 and transmitting the same to the client terminal C, and of accepting the information input in the Web browser C 1 from the client terminal C.
- a computer program for realizing a function of generating a user interface screen to be displayed on the Web browser C 1 , a function of accepting information from the client terminal C, and a function of performing other necessary processes is loaded on the application server S 1 so as to be executed by a computer.
- the client terminal C may download a program such as java (registered trademark) applet for realizing some or all of the functions of the screen displayed on the Web browser C 1 from the server S, and display the screen on the Web browser C 1 .
- java registered trademark
- the simulator/analysis server (pathological condition information analysis server) S 2 builds a biological model representing the biological functions of a patient on a computer (server S), and generates pathological condition information (pathological condition information of diabetes) of the patient based on the biological model.
- the biological model is built as a mathematical model on the computer including a plurality of parameters related to the biological functions to represent the entire human body or biological functions of a certain disease.
- the simulator/analysis server S 2 performs simulation on the disease (diabetes) of a specific patient based on the biological model, and acquires the pathological condition information of the relevant patient by simulation.
- a pathological condition simulator/analysis program (pathological information analysis computer program) is loaded on the simulator/analysis server (pathological condition information generation server; pathological condition information generation unit) S 2 to be executed by a computer, and the simulation and the analysis function are realized by the relevant program.
- a database having various data DB 1 to DB 7 of test result etc. of the patient is built in the database server S 3 .
- FIG. 2 is a block diagram showing hardware configuration of the server S.
- the server S is composed of a computer mainly including a main body S 110 , a display S 120 , and an input device S 130 .
- the main body S 110 is mainly configured by a CPU 110 a , a ROM S 110 b , a RAM S 110 c , a hard disk S 110 d , a readout device S 110 e , an input/output interface S 110 f , and an image output interface S 110 h , wherein the CPU S 110 a , the ROM S 110 b , the RAM S 110 c , the hard disk S 110 d , the readout device S 110 e , the input/output interface S 110 f , and the image output interface S 110 h are data-communicably connected by a bus S 110 i.
- the CPU S 100 a is capable of executing a computer program recorded in the ROM S 110 b and a computer program loaded in the RAM S 110 c.
- the CPU S 110 a executes an application program 140 a for realizing the application server S 1 function, a program for realizing the simulator/analysis server S 2 function, and a program for realizing the database server function, to realize each function block as described below, whereby the computer functions as the server S of the present embodiment.
- the ROM S 110 b includes mask ROM, PROM, EPROM, EEPROM, etc. and is recoded with computer programs executed by the CPU 110 a and data used for the programs.
- the RAM S 110 c comprises SRAM, DRAM, etc.
- the RAM S 110 c is used to read out computer programs recorded in the ROM S 110 b and the hard disk S 110 d .
- the RAM 110 c is used as a work area of the CPU S 110 a when these computer programs are executed.
- the hard disk S 110 d is installed with an operating system and an application program, etc., as well as various computer programs to be executed by the CPU 110 a , and data used for executing the computer programs.
- the readout device S 110 e which comprises a flexible disk drive, a CD-ROM drive or DVD-ROM drive is capable of reading out a computer program or data recorded in a portable recording media S 140 .
- the portable recording media S 140 stores the computer program for the computer to function as the system of the present invention, wherein the computer reads out the necessary application program S 140 a etc. from the portable recording media S 140 and installs the relevant application program S 140 a etc. in the hard disk S 110 d.
- the computer program such as the application program S 140 a is not only provided by the portable recording media S 140 , and may be provided through an electric communication line (wired or wireless) from external devices which are communicably connected to the computer via the electric communication line.
- the application program S 140 a etc. may be stored in a hard disk in an application program providing server computer on the Internet, so that the computer program can be downloaded by accessing the server computer and installed in the hard disc S 110 d.
- the hard disk 110 d is installed with an operating system which provides a graphical user interface environment, e.g. Windows (registered trademark) manufactured by US Microsoft Corp.
- Windows registered trademark
- the computer program described in the present embodiment is assumed as operating on the operating system.
- the input/output interface S 110 f includes a serial interface such as USB, IEEE1394, and RS-232C; a parallel interface such as SCSI, IDE, and IEEE1284; and an analog interface such as D/A converter and A/D converter.
- the input/output interface S 110 f is connected to the input device S 130 including a keyboard and a mouse, and users can use the input device S 130 to input data into the computer.
- the image output interface S 110 h is connected to the display S 120 configured by LCD, CRT or the like so that picture signals corresponding to image data provided from the CPU S 110 a are output to the display S 120 .
- the display S 120 displays an image (screen) based on the input picture signals.
- the hardware configuration of the client terminal C is the same as the hardware configuration of the server S.
- the simulator/analysis server (pathological condition information generation server; pathological condition information generation unit) S 2 will now be described.
- FIG. 3 is a block diagram showing an overall configuration of one example of a biological model used in the pathological condition simulation according to the present embodiment.
- the biological model particularly simulates biological organs associated with diabetes, and comprises a pancreas block 1 , a hepatic block 2 , an insulin kinetics block 3 , and a peripheral tissue block 4 .
- Each block 1 , 2 , 3 , 4 has input and output. That is, as to the pancreas block 1 , a blood glucose level 6 is set as input and an insulin secretion rate 7 is set as output.
- glucose absorption 5 from digestive tract, the blood glucose level 6 and then insulin secretion rate 7 are set as input, and net glucose release 8 and post liver insulin 9 are set as output.
- post liver insulin 9 is set as input and insulin concentration 10 at the peripheral tissues is set as output.
- the peripheral tissue block 4 As to the peripheral tissue block 4 , the net glucose release 8 , and the insulin concentration 10 at the peripheral tissues are set as input, and the blood glucose level 6 is set as output.
- Glucose absorption 5 is data provided from outside of the biological model (database server S 3 ).
- data related to glucose absorption is registered in the database S 3 as actual test data (biological response).
- function blocks 1 to 4 are respectively realized when the computer program is executed by the CPU of the server S 2 .
- Relationship between input and output of the pancreas block 1 may be expressed using the following differential equation (1).
- the relationship can also be represented using a block diagram as in FIG. 6 equivalent to the differential equation (1).
- BG(t) blood glucose level
- X(t) total amount of insulin capable of being secreted from pancreas
- Y(t) supply rate of insulin newly supplied to X(t) with respect to glucose stimulation
- the blood glucose level 6 which is the input to the pancreas block 1 in FIG. 3 corresponds to BG(t), and the insulin secretion rate 7 which is the output corresponds to SR(t).
- numeral 6 indicates blood glucose level BG(t); 7 indicates insulin secretion rate SR(t) from pancreas; 12 indicates glucose concentration threshold h capable of stimulating insulin supply; 13 indicates sensitivity to glucose stimulation ⁇ ; 14 indicates following performance to glucose stimulation a; 15 indicates integral element; 16 indicates supply rate Y(t) of newly supplied insulin with respect to glucose stimulation; 17 indicates integral element; 18 indicates total amount of insulin X(t) capable of being secreted from pancreas; and 19 indicates secretion rate M per unit concentration.
- Relationship between input and output of the hepatic block 2 may be described using the following differential equation (2).
- the relationship can also be represented using a block diagram as in FIG. 7 equivalent to the differential equation (2).
- HGU ( t ) r ⁇ Func1( FGB ) ⁇ b 1( I 4 ( t )) ⁇ RG ( t )+(1 ⁇ r ) ⁇ Kh ⁇ BG ( t ) ⁇ I 4 ( t )
- HGP ( t ) I 4off ⁇ Func2( FGB ) ⁇ b 2 +G off ( FGB ) ⁇ I 4 ( t ) ⁇ Func2( FGB ) ⁇ b 2
- the glucose absorption 5 from digestive tract which is input to the hepatic block in FIG. 3 corresponds to RG(t)
- the blood glucose level 6 corresponds to BG(t)
- the insulin secretion rate 7 corresponds to SR(t)
- the net glucose release 8 which is the output corresponds to SGO(t)
- the post liver insulin 9 corresponds to SRpost(t).
- numeral 5 indicates glucose absorption RG(t) from digestive tract; 6 indicates blood glucose level BG(t); 7 indicates insulin secretion rate SR(t) from pancreas; 8 indicates net glucose SGO(t) from liver; 9 indicates post liver insulin SRpost(t); 24 indicates insulin passage rate (1 ⁇ A 7 ) of liver; 25 indicates following performance to insulin stimulation ⁇ 2 ; 26 indicates post liver insulin distribution rate A 3 ; 27 indicates integral element; 28 indicates hepatic insulin concentration I 4 (t); 9 indicates insulin-dependant hepatic glucose uptake distribution rate (1 ⁇ r); 30 indicates insulin-dependent glucose uptake rate Kh in liver per unit glucose; 31 indicates insulin-independent hepatic glucose uptake distribution rate r; 32 indicates hepatic glucose uptake rate to glucose stimulation from digestive tract Func 1 (FGB); 33 indicates adjustment item for hepatic uptake rate b 1 (I 4 (t)); 34 indicates hepatic glucose uptake HGU(t); 35 indicates insulin concentration threshold at which hepati
- Relationship between input and output of the insulin kinetics secretion may be described using the following differential equation (3).
- the relationship can also be represented using a block diagram as in FIG. 8 equivalent to the differential equation (3).
- the post liver insulin 9 which is the input to the insulin kinetics block in FIG. 3 corresponds to SRpost(t)
- the insulin concentration 10 which is the output, at the peripheral tissue corresponds to I 3 (t).
- numeral 9 indicates post liver insulin SRpost (t); 10 indicates insulin concentration I 3 (t) in peripheral tissue; 50 indicates integral element; 51 indicates post liver insulin distribution rate A 3 ; 52 indicates blood insulin concentration I 1 (t); 53 indicates insulin distribution rate A 2 to peripheral tissues; 54 indicates integral element; 55 indicates insulin disappearance rate A 1 in peripheral tissue; 56 indicates post peripheral tissue insulin flow out rate A 4 ; 57 indicates insulin distribution rate A 6 to insulin independent tissue; 58 indicates integral element; 59 indicates insulin concentration in insulin independent tissue I 2 (t); 60 indicates insulin disappearance rate A 5 in insulin independent tissue.
- Relationship between input and output of the peripheral tissue block 4 may be described using the following differential equation (4).
- the relationship can also be represented using a block diagram as in FIG. 9 equivalent to the differential equation (4).
- the insulin concentration 10 which is the input to the peripheral tissue block in FIG. 3 , in peripheral tissue corresponds to I 3 (t)
- the net glucose 8 from liver corresponds to SGO(t)
- the blood glucose level 6 which is the output corresponds to BG(t).
- numeral 6 indicates blood glucose level BG(t); 8 indicates net glucose SGO(t) from liver; 10 indicates insulin concentration I 3 (t) in peripheral tissues; 70 indicates insulin independent glucose consumption rate to basal metabolism u*Goff(FGB); 71 indicates integral element; 72 indicates insulin independent glucose consumption rate Kb in peripheral tissues; 73 indicates insulin dependent glucose consumption rate Kp in peripheral tissues per unit insulin and per unit glucose; and 74 indicates unit conversion constant Ws/DVg.
- E-Cell software disclosed by Keio University
- MatLab manufactured by The MathWorks, Inc.
- the server 2 (simulator/analysis server S 2 ) of the present system SS thus has a function of obtaining an internal parameter set or a set of internal parameters of the biological model (hereinafter simply referred to also as “parameter set”), and generating the biological model applied with the obtained parameter set to realize the function as the biological model generating section. This function is also realized through the pathological condition simulator/analysis program.
- the parameter set generated by the biological model generating section is applied to the biological model, and a biological model calculating section simulates the function of the biological organs and outputs the pseudo-response simulating the actual biological response (test result).
- a parameter set generating section for generating the parameter set for forming a biological model that simulates the biological organ of the patient based on the actual test result (biological response) of the patient (biological body).
- FIG. 4 is a flowchart showing procedures in which the parameter set generating section of the system SS obtains a parameter set of the biological model.
- an input step of OGTT (oral glucose tolerance test) time-series data serving as an actual test result (biological response) is executed as shown in the figure (Step S 1 - 1 ).
- the OGTT time-series data are a result of OGTT (given amount of glucose solution is orally loaded to measure the temporal change of blood glucose level and blood insulin concentration) or the test actually performed on the patient to be simulated by a biological model, wherein the present system accepts the input as the actual biological response (actual test value) from the client terminal 3 .
- two data of OGTT glucose data blood glucose change data
- OGTT insulin blood insulin concentration change data
- the input OGTT time-series data are registered as “test data” in the OGTT data table DB 4 (see FIG. 17( c )) of the databases of the database server S 3 .
- FIG. 5 shows an example of the blood glucose level change data ( FIG. 5( a )) and the blood insulin concentration change data ( FIG. 5( b )) as the OGTT time-series data to be input.
- the blood glucose level change data of FIG. 5( a ) is measured data corresponding to temporal change of the blood glucose level BG(t), or one of output items in the biological model shown in FIGS. 3 to 9 .
- the blood insulin concentration change data of FIG. 5( b ) is measured data corresponding to temporal change of blood insulin concentration I 1 ( t ), or one of output items in the biological model shown in FIGS. 3 to 9 .
- the present system SS matches the input OGTT time-series data to the template of template database DB 1 .
- the template database DB 1 is one database contained in the databases 24 of the database server S 3 .
- the template database DB 1 is stored in advance with a plurality sets of data in which biological model reference output values T 1 , T 2 , . . . that become template is corresponded to parameter sets PS# 01 , PS# 02 . . . for generating the reference output value.
- an appropriate parameter set may be assigned to an arbitrary reference output value, or on the contrary, the output of the biological model in the case when an arbitrary parameter set is selected may be obtained by the biological simulation system.
- FIG. 11 shows an example of a template (reference output value) T 1 .
- FIG. 11( a ) is the blood glucose level change data serving as a template, which is reference time-series data corresponding to temporal change of the blood glucose level BG(t) or one of the output items in the biological model shown in FIGS. 3 to 9 .
- FIG. 11( b ) is the blood insulin concentration change data serving as a template, which is reference time-series data corresponding to temporal change of the blood insulin concentration I 1 ( t ) or one of the output items in the biological model shown in FIGS. 3 to 9 .
- the system SS computes similarity between each reference time-series data of the above-mentioned template database DB and OGTT time-series data.
- the similarity is obtained by obtaining error summation.
- the error summation is obtained by the following formula.
- ⁇ and ⁇ are coefficient used for normalization
- the average of the formula shows average value with respect to all templates stored in the template database DB 1 .
- FIG. 12 shows error summation (no normalization) of the OGTT time-series with respect to the template T 1 , and more specifically, FIG. 12( a ) shows an error between the blood glucose level of FIG. 5( a ) and the blood glucose level of FIG. 11( a ), and FIG. 12( b ) shows an error between the insulin of FIG. 5( b ) and the insulin of FIG. 11( b ).
- the CPU 100 a obtains an error summation for each template in the template database DB 1 , and determines a template having minimum error summation (similarity), that is, the CPU 100 a determines the template which is the most approximate to the OGTT time-series data (Step S 1 - 2 ).
- step S 1 - 3 the system SS acquires a parameter set corresponding to the template determined in step S 1 - 2 from the template database DB 1 . That is, a parameter set PS# 01 corresponding to the template T 1 is obtained (see FIG. 10 ).
- the following table 1 shows specific numeral values of the parameter values included in the parameter set PS# 01 obtained as above.
- the method for generating the parameter set is not limited to template matching as described above.
- the parameter set may be generated through genetic algorithm. That is, genetic algorithm may be applied of randomly producing an initial group of parameter set, and performing selection/chiasm/mutation process on the parameter set (individual) contained in the initial group to generate a new child group.
- genetic algorithm may be applied of randomly producing an initial group of parameter set, and performing selection/chiasm/mutation process on the parameter set (individual) contained in the initial group to generate a new child group.
- the parameter set that outputs the pseudo-response close to the input biological response (test result) can be adopted.
- the specific generating method of the biological model generating section is not particularly limited as long as the biological model that outputs pseudo-response simulating the input biological response can be generated.
- the system SS has a function of, when the parameter set PS# 01 is provided to the biological model, performing a calculation based on the relevant biological model, and outputting pseudo-response information (time-series change in blood glucose level and insulin concentration) simulating the input OGTT time-series data (function as pseudo-response acquiring unit (biological model calculating section) of the system SS)
- pseudo-response information time-series change in blood glucose level and insulin concentration
- the biological organs of the patient can be simulated based on the generated biological model in the system SS. This function is also realized by the pathological condition simulator/analysis program.
- the generated parameter set is also used to acquire the pathological condition information (pathological condition feature information), which aspect will be hereinafter described.
- FIG. 13 shows a screen of the present system SS generated by a screen control unit S 1 -A of the application server S 1 of the server S and displayed on the display device of the client C.
- the screen of FIG. 13 shows a starting screen immediately after the user such as doctor logs into the present system from the client C.
- the screen of the present system SS is displayed on the Web browser C 1 of the client C.
- a title bar C 1 - 1 a tool bar C 1 - 2 , and a display region C 1 - 3 of the Web browser C 1 are shown.
- a screen to be displayed in the display region C 1 - 3 of the browser C 1 is generated in the server S.
- the display region C 1 - 3 is shown in the figure showing the screen, and the illustrations of various bar C 1 - 1 , C 1 - 2 displays of the Web browser will be omitted.
- a patient search/list screen (hereinafter also referred to as “basic screen”) W 1 for searching the patient information and displaying the search result is displayed in the browser display region C 1 - 3 of FIG. 13 .
- the basic screen W 1 is also a screen (route screen) that acts as a basis for transitioning to other screens W 2 , W 3 .
- a medical examination main screen W 2 (see FIG. 15 ) or a doctor screen for the doctors to browse through, and a patient screen W 3 (see FIG. 16 ) for the patients to browse through can be transitioned from the basic screen W 1 .
- the user can transition to other two screens W 1 , W 2 , W 3 from any one of the screens W 1 , W 2 , W 3 .
- Each screen W 1 , W 2 , W 3 includes operation screen regions W 1 A, W 2 A, W 3 A arranged with button displays for system operation such as screen transition operation etc., and main body screen regions W 1 B, W 2 B, W 3 B for displaying the content for each screen W 1 , W 2 , W 3 and performing operation in each screen W 1 , W 2 , W 3 .
- the operation screen regions W 1 A, W 2 A, W 3 A are the display content of the main body screen regions W 1 B, W 2 B, W 3 B, but are always displayed for each screen W 1 , W 2 , W 3 .
- the operation screen regions W 1 A, W 2 A of the basic screen W 1 and the doctor screen W 2 are common, and include “patient search list” button 101 , “main medical examination” button 102 , and “patient view” button 103 .
- buttons 101 , 102 , 103 are selected by the mouse operation etc., to be able to transition from currently displayed screens W 1 , W 2 , W 3 onto other screens W 1 , W 2 , W 3 .
- the operation screen regions W 1 A, W 2 A of the basic screen W 1 and the doctor screen W 2 include a “notice” button 104 for displaying “notice” screen” from the system to the user, and “log out” button 105 for logging out from the system S.
- the operation screen region W 3 A of the patient screen W 3 includes “print” button 16 for executing a print process of printing the content of the screen displayed on the main body screen region B of the patient screen W 3 by means of a printer, in addition to the transition buttons 101 , 102 to other screens W 1 , W 2 .
- the “print” button 106 is selected, the content of the current main body screen region B is printed.
- the screen content printed on the paper is handed to the patient, and this paper resource becomes the resource when the doctor gives an explanation to the patient, and the auxiliary resource for the patient to understand his/her condition.
- the operation screen region W 3 A of the patient screen W 3 also includes “log out” button 105 .
- the operation screen region W 3 A of the patient screen W 3 does not include the “notice” button 104 , and the screen is simplified.
- FIG. 14 shows an entire state transition of the system by the operation of the button displayed on the operation screen region of each screen W 1 , W 2 , W 3 other than the screen transition.
- the reference numerals denoted on the arrow in FIG. 14 indicate the operation by the button (button of the operation screen region of the screens W 1 , W 2 , W 3 ) having the corresponding reference numeral.
- the operation screen regions W 1 A, W 2 A are arranged at the upper part of the screens W 1 , W 2 to which one tends to pay attention in order to ensure operability by the system user such as doctors or laboratory technicians.
- the patient does not directly operate the system but simply looks at the screen, and thus the screen is simplified in the patient screen W 3 , and the operation screen region W 3 A is arranged at the lower part of the screen W 3 to be easier for the patient.
- the button size is made smaller etc. so that buttons do not stand out more than the operation screen regions W 1 A, W 2 A of the basic screen W 1 and the doctor screen W 2 .
- the details of the patient search/list screen W 1 or the basic screen will be described below.
- the basic screen W 1 has a function of searching the patient by inputting search conditions such as patient's name, and a function of displaying the patient list as a search result. Both functions may be configured by separate screens.
- the (main body screen region W 1 B) of the basic screen W 1 includes a search operation part 110 for inputting the search condition etc., and a search result display part 130 for displaying the search result.
- the basic screen W 1 includes a new registration part 140 for newly registering the information of the patient. If the new registration part 140 is selected to perform the new registration process, the information on a new patient is registered in the database, and the relevant patient can be searched for.
- the search operation part 110 includes input parts of various search conditions such as patient ID input part 111 , carte ID input part 112 , patient's name input part 113 , patient name kana input part 114 , sex input part 115 , attending physician input part 116 , date of birth input part 117 , memo input part 118 , elapsed number of days from last interview input part 119 , test item name input part 120 , and the like as search conditions.
- various search conditions such as patient ID input part 111 , carte ID input part 112 , patient's name input part 113 , patient name kana input part 114 , sex input part 115 , attending physician input part 116 , date of birth input part 117 , memo input part 118 , elapsed number of days from last interview input part 119 , test item name input part 120 , and the like as search conditions.
- one or more input conditions are input to the input part, and the search button 121 is selected so that the relevant search conditions are transmitted to the server S.
- the application server S 1 of the server S searches the patient data table DB 2 contained in the database of the database server S 3 .
- the content of the patient data table is as shown in FIG. 17( a ).
- the patient information corresponding to the search conditions is registered by patients.
- the server S When extracting the information of the patient that matches the search condition, the server S generates a basic screen in which the extracted information is displayed in a list in the search result display part 130 and transmits the same to the client C.
- the basic screen W 1 transmitted from the server S is displayed.
- the patient search result list is displayed, as shown in FIG. 13 .
- the information on the patient extracted by the search condition (patient ID 131 , patient name 132 , sex 133 , date of birth 134 , attending physician 135 , carte ID 136 ) are displayed.
- the patient list is normally organized in ascending order of the patient ID, but the ascending order or the descending order of the selected patient information (e.g., date of birth) can be reorganized by clicking each item 131 to 136 of the patient information.
- the operation menu part 137 in which the operation can be selected is displayed for each patient in the search result display part 130 . As shown in FIG. 18 , if the operation menu part 137 for a certain patient is selected, “patient information edit” selecting part 151 , “test data input” selecting part 152 , “main medical examination” selecting part 153 , and “patient view” selecting part 154 are displayed as selectable operation menus.
- the operation menu part 137 Since the operation menu part 137 is displayed for every patient, the selection of the operation menu and selection of the patient can be performed at the same time.
- the server S When the user such as the doctor selects the “patient information edit” selecting part 151 , the server S references the patient data table DB 2 (see FIG. 17( a )) of the database with the patient ID of the selected patient as the key information, and the patient information to be edited is extracted. The server S then generates a “patient information edit” screen on which the information of the patient (content of patient data table) is edited, and displays the same to the client C (see FIG. 19) . After the editing of the patient information is terminated, the server S updates the content of the patient data table DB 2 for the relevant patient. The screen then returns to the original basic screen W 1 .
- the server S When the user such as the doctor selects the “test data input” selecting part 152 , the server S generates a “test data input screen” on which the test data is input, and displays the same to the client C (see FIGS. 21 and 22 ). After the input of the test data is terminated, the screen returns to the original basic screen W 1 .
- the test data input screen is configured such that the basic test data screen ( FIG. 20 ) for inputting the basic test values such as weight, the OGTT data screen ( FIG. 21 ) for inputting the OGTT data, the target value screen ( FIG. 22 ) for inputting the target value of the basic test item can be switch displayed by tab form.
- the test result of each test item can be input for every test date.
- the data input in the basic test data screen is registered in the basic test result data table DB 3 of the database as test result for every test date along with the patient ID.
- the OGTT glucose data blood glucose level change data
- the OGTT insulin data blood insulin concentration change data
- the data input in the OGTT data screen are registered in the OGTT data table DB 4 of the database as test data for every test date along with the patient ID (see FIG. 17( c )).
- the target value for the basic test items such as weight can be input.
- the data input in the target value screen are registered in the target value data table DB 5 along with the patient ID (see FIG. 17( d )).
- the simulator/analysis server S 2 When new registration or correction of the OGTT data is performed in the OGTT data screen of FIG. 21 , the simulator/analysis server S 2 performs simulation and pathological condition analysis by using the OGTT data, and acquires the pathological condition information (pathological condition feature information) showing the features of the pathological condition.
- the acquired pathological condition feature information is registered in the OGTT data table DB 4 of the database in association with the OGTT data. The details of the pathological condition analysis will be hereinafter described.
- the weight information (one of the basic test items) of the patient is also necessary in simulation and pathological condition analysis, the weight of the patient at the test date of the most recent basic test is acquired from the basic test result data table DB.
- the basic test data are also used in simulation and pathological condition analysis, re-execution of the simulation and re-analysis of the pathological condition are performed in the system SS not limited to when new registration and correction of the OGTT data are performed in the OGTT data screen of FIG. 21 , but also when registration and correction of the basic test data are performed in the basic test data input screen of FIG. 20 .
- the re-acquired pathological condition feature information is registered in the OGTT data table DB 4 of the database in association with the OGTT data used in the simulation.
- the server S when the user such as the doctor selects the “main medical examination” selecting part 153 in basic screen W 1 , the server S generates “main medical examination” screen (doctor screen) W 2 displaying information on the selected patient, and displays the same to the client C (see FIG. 15 ).
- the doctor screen W 2 displays information on the “patient” selected in the basic screen W 1 , wherein the server S references the data tables DB 2 to DB 7 in the database with the patient ID of the selected patient as the key, extracts the information on the relevant patient, and generates the doctor screen W 2 for displaying the information on the patient to support the diagnosis made by the doctor.
- the server S When the user such as the doctor selects “patient view” selecting part 154 in the basic screen W 1 , the server S generates “patient view” screen (doctor screen) W 3 ) displaying information on the selected patient, and displays the same to the client C (see FIG. 16 ).
- the patient screen W 3 displays information on the “patient” selected in the basic screen W 1 , and the server S references the data tables DB 2 to DB 7 in the database with the patient ID of the selected patient as the key, extracts the information on the relevant patient, and generates the patient screen W 2 for displaying the information that can be browsed by the patient.
- Both screen transitions are the same in that the screen is switched to the main medical examination screen W 2 or the doctor screen, or the patient view W 3 screen or the patient screen. That is, in either case, the screen switching unit S 1 -B of the server S accepts the input for performing display switching from the client C and switches the screen.
- the former is used when displaying the main medical examination screen or the patient view of the selected patient while selecting the patient. That is, in order to switch to the display of “different patient”, the user needs to return to the basic screen W 1 , and perform the former screen transition.
- the latter is used to switch the main medical examination screen or the patient view for “the same patient”.
- the user does not need to return to the basic screen W 1 to switch the screens, and the switch can be rapidly carried out with the operations of the operation screen regions W 2 A, W 3 A of each screen W 2 , W 3 .
- the doctor makes a diagnosis while browsing the doctor screen W 2 , and at that moment, directly (without passing through the basic screen W 1 ) transition to the patient screen W 3 from the doctor screen W 2 when indicating the necessary information to the patient.
- the reverse is also possible.
- the main body screen region W 2 B of the doctor screen W 2 includes a fixed display part 161 position fixedly displayed at the upper part of the main body screen region W 2 B.
- a multi-screen region (multi-window region) in which a plurality of position movably displayed screen regions (windows) are simultaneously displayed is formed at the region on the lower side of the fixed display part 161 of the main body screen region W 2 B.
- the fixed display part 161 displays patient information (information of patient data table DB 2 ) such as name of patient, date of birth, patient ID, and the like, and furthermore, is arranged with “edit patient information” button 161 a for displaying the patient information edit screen for editing the information of the patient and “reset arrangement” button 161 b for returning the arrangement (position, size) of a plurality of screen regions to an initial state.
- patient information information of patient data table DB 2
- “edit patient information” button 161 a for displaying the patient information edit screen for editing the information of the patient
- “reset arrangement” button 161 b for returning the arrangement (position, size) of a plurality of screen regions to an initial state.
- four screen regions (windows) of the basic test data screen region (basic test data window) 162 , the OGTT data screen region (OGTT data window) 163 , the prescription screen region (prescription window) 164 , and the finding screen region (finding window) 165 are simultaneously displayed.
- Each screen region 162 to 165 is position adjustable within the multi-screen region of the doctor screen W 2 by the operation of the mouse etc., and the size thereof is also adjustable.
- the basic test data screen region (screen region for displaying the related information on the patient) 162 and the OGTT data screen region (screen region for displaying the pathological condition information of the patient) 163 are particularly important to support the diagnosis by the doctor.
- the basic test data screen region 162 shows the test result obtained by the actual test (basic test), and the OGTT data screen region 163 shows the actual OGTT result and the pathological condition information or the result of the simulation analysis.
- the basic test screen region 162 is generated by the server S based on the information (test result) stored in the basic test result data table DB 3 shown in FIG. 17( b ).
- the server S searches the basic test result data table with the patient ID of the selected patient as the key, and generates the test result information on the most recent test date in the basic test screen region 162 as the test result display part 162 a.
- each test item name in the basic test result display part 162 can be selected by mouse operation (double click etc.), and the time-series graph 162 b on the selected item is displayed at the position in the basic test screen region 162 (right side of test result display part 162 a ). If the target value is set for the selected test item, not only the test value Tst but also the target value Tr is displayed in the time-series graph 162 b.
- the time-series graph 162 b can be selected up to a maximum of four in the basic test screen region 162 of the doctor screen W 2 .
- Four time-series graphs 162 b are shown in FIG. 15
- one time-series graph 162 b is shown in FIG. 23 .
- the test result displayed in the test result display part 162 a can be changed to a test result of a different test date.
- the basic test screen region 162 includes “another test date” button 162 c for selecting an arbitrary test date and displaying the test result of the relevant test date, “previous test date” button 162 d for displaying the test result of the previous test date, and “next test date” button 162 e for displaying the test result of the next test date.
- the OGTT data screen region (screen region for displaying pathological condition information of the patient) 163 shown in FIG. 15 is generated by the server S based on the information (test data and analysis result) stored in the OGTT data table DB 4 shown in FIG. 17( c ).
- the server S searches the OGTT data table DB 4 with the patient ID of the selected patient as the key, acquires the test data (OGTT time-series data) and the analysis result (pathological condition information) on the most recent test date, and generates the time-series graph 163 a of the OGTT test data and the radar chart 163 b of the analysis result in the OGTT screen region 163 .
- a time-series change 163 a - 1 of the blood glucose level in the actual OGTT test result and a time-series change 163 a - 2 of the insulin concentration in the actual OGTT test result are displayed in the time-series graph 163 a.
- the radar chart 163 b shows the result of performing the pathological condition analysis.
- the details of the process of performing pathological condition analysis from simulation based on the biological model and acquiring the pathological condition information (pathological condition feature information) will be described below.
- the parameter set configuring the biological model capable of outputting the reproduction value (pseudo-response information) simulating the actual OGTT test result (biological response information) is obtained through calculation.
- the system SS obtains the reproduction value (pseudo-response information) of the OGTT test result as the output value of the biological model applied with such parameter set (pseudo-response acquiring function of the system SS).
- the simulator/analysis server S 2 obtains the pathological condition information (pathological condition feature information) indicating the feature of the pathological condition of the patient based on the generated biological model (parameter set thereof) (pathological condition feature information acquiring function of the system SS).
- pathological condition feature information indicating the feature of the pathological condition of the patient based on the generated biological model (parameter set thereof) (pathological condition feature information acquiring function of the system SS).
- P 1 fasting blood glucose
- P 2 basic secretion
- P 3 additional secretion
- P 4 secretion sensitivity
- P 5 glucose regeneration suppression
- P 6 glucose disposal ability
- P 7 processing sensitivity
- Such indices are adopted as satisfactorily representing the features of the pathological condition, and in particular, biological functions that can be improved by treatment are adopted.
- the indices of the pathological condition feature are not limited to the above.
- P 4 secretion sensitivity is calculated from the sensitivity ⁇ with respect to glucose stimulation or the parameter of the biological model.
- P 5 glucose regeneration suppression is calculated from the glucose release HGTP(t) which is a variable of the biological model.
- P 6 glucose disposal ability is calculated from the net glucose SGO(t) and the blood glucose level BG(t) from the liver, which are variables of the biological model.
- P 7 processing sensitivity is calculated from the insulin dependent glucose consumption rate Kp in the peripheral tissue per unit insulin or unit glucose, which is a parameter of the biological model.
- the biological model is configured by a mathematical model having parameters (include variables) indicating the characteristics of the biological organs
- the parameter values of the biological model indicate values related to the pathological condition. Therefore, the pathological condition information (pathological condition feature information) indicating the features of the pathological condition can be calculated based on such parameters.
- the calculated pathological condition information is registered in the OGTT data table DB 4 of the database as analysis result, and used to create a radar chart 163 b.
- the values for every index of the pathological condition feature information are scored and displayed, so that good and bad of the value of each index having different units and numeral widths can be compared.
- the doctor looks at the radar chart 163 b to diagnose the pathological condition of the patient. For instance, if the radar chart 163 b shows that the glucose disposal ability and the processing sensitivity related to the glucose disposal ability at the peripherals are low, the doctor looking at the radar chart can easily determine that the treatment method that improves the glucose disposal ability at the peripherals is effective.
- the doctors can compare both displays and learn about the relation of the graph shape of the OGTT test result and the pathological condition. Therefore, an effective learning effect for understanding the pathological condition from the OGTT test result can be expected by building up experiences by actually using the system SS.
- the doctor can also build up experience of understanding the pathological condition even in relation to the basic test result.
- the screen region 163 for displaying the pathological condition information of the patient and the screen region 162 for displaying the related information (in particular, basic test information) related to the patient are simultaneously displayed, thereby supporting the doctor to make an accurate diagnosis based on great amount of information.
- the doctor can further build up experience since great amount of information are displayed.
- test result reproduction value prseudo-response information
- pathological condition feature information e.g., a test result value obtained in the relevant case.
- the system can be used for training purpose by inputting an appropriate test result even if the actual data of the patient are not provided, and checking what kind of output is obtained.
- the present system SS can be used for training purpose for non-specialists or doctors with little experience to learn.
- a “pathological condition review/recommended treatment/term explanation” column (pathological condition review display part) 163 c is arranged in the OGTT data screen region 163 , wherein text explanation (pathological condition review) such as review of the pathological condition, recommended treatment, term explanation etc. is displayed. Since the “pathological condition review/recommended treatment/term explanation” column 163 c is arranged, the pathological condition feature information displayed on the radar chart 132 can be easily understood, and the doctor can more accurately understand the pathological condition. Information useful for determining the treatment method etc. is also obtained.
- the pathological condition review text displayed on the pathological condition review display part 163 c is registered in the database in advance, the pathological condition review text corresponding to the generated biological model (parameter thereof) is selected by the system, and the selected text is displayed on the pathological condition review display part 163 c.
- a special instruction display part 163 d is also arranged, so that when there is a special instruction on the pathological condition information obtained by analysis, such special instruction is displayed on the special instruction display part 163 .
- the data displayed on the time-series graph 163 a and the radar chart 163 b of the OGTT data screen region 163 can be changed to those of a different test date.
- the basic test screen region 162 includes “another test date” button 163 e for selecting an arbitrary test date and displaying the test result of the relevant test date and the pathological condition information based on the relevant test result, “previous test date” button 163 f for displaying the test result etc. of the previous test date, and “next test date” button 163 g for displaying the test result etc. of the next test date.
- An overlay display for displaying the data of different test dates in an overlapping manner is possible in the time-series graph 163 a and the radar chart 163 b of the OGTT data screen region 163 .
- the check box 163 h of the overlay display of the OGTT data screen region 163 is checked, the “select date” or the date selecting button is selected, and the test date of the data desired to be displayed in an overlapping manner on the current time-series graph 163 a and the radar chart 163 b is selected, so that the time-series graph 163 a and the radar chart 163 b of both test dates are displayed in an overlapping manner.
- the doctor can simultaneously compare the OGTT data and the pathological condition information of different dates, and make a diagnosis based on temporal changes of the OGTT data and the pathological condition information.
- the OGTT test data and the analysis result may be displayed as it is as numerical information instead of being illustrated as the time-series graph 163 a and the radar 163 b .
- the prescription screen region (prescription window) 164 and the finding screen region (finding window) 165 are also displayed.
- the prescription content can be registered for every medical examination date in the prescription screen region 164 .
- the prescription content is registered for every medical examination date in the prescription data table DB 6 shown in FIG. 17( e ).
- the pathological condition understood by the doctor can be registered in the finding screen region 165 as finding of the doctor.
- the finding content is registered for every medical examination date in the finding data table DB 7 shown in FIG. 17( f ).
- the present system SS also has a function serving as an electronic carte, thereby enhancing convenience.
- the prescription screen region 164 and the finding screen region 165 are both registered in the data tables DB 6 , DB 7 , similar to the basic test data screen region 162 and the OGTT data screen region.
- the prescription content or the finding content on another medical examination date can also be displayed.
- FIGS. 24 to 27 show the patient screen W 3 in addition to FIG. 16 .
- the main body screen region W 3 B of the patient screen W 3 includes the fixed display part 181 position fixedly displayed at the upper part of the main body screen region W 3 B.
- the region on the lower side of the fixed display part 181 of the main body screen region W 3 B is formed as a tab switching screen region 182 capable of switching a plurality of screen regions by tab switching.
- the fixed display part 181 displays patient information (information of patient data table DB 2 ) such as name of patient, date of birth, attending physician, and the like.
- patient information information of patient data table DB 2
- information not necessarily required for the patient are omitted, for example, patient ID is not displayed, whereby information amount is reduced, and a simple and viewable display is obtained.
- the fixed display part 181 of the patient screen W 3 has larger characters, and thus is an easily viewable display.
- the fixed display part 181 of the patient screen W 3 is not arranged with the buttons 161 a , 161 b in the fixed display part 161 of the doctor screen W, and thus is a simple and easily viewable display.
- the tab switching screen region 182 includes four screen switching tabs 182 a , 182 b , 182 c , and 182 d .
- the “basic test data” tab 182 a displays the basic test data screen region 192
- the “OGTT data” tab 182 b displays the OGTT data screen region 193
- the “prescription/finding” tab 182 c displays the prescription/finding screen region 194
- “past prescription list” tab 182 d displays the past prescription list screen region 195 .
- FIGS. 16 and 24 show the basic test data screen region 192 of the patient screen W 3 .
- the basic test data screen region 192 is generated from the basic test result data table DB 3 with the patient ID as the key.
- the basic test data screen region 192 cannot change position and size, but is formed over substantially the entire tab switching screen region 182 , and is formed larger than the basic test data screen region 162 (size of initial state: see FIGS. 2 and 3 ) of the doctor screen W 2 .
- test result display part 192 a is displayed on the basic test data screen region 192 of the patient screen W 3 .
- the test result display part 192 a is formed larger than the test result display part 162 a of the doctor screen W 2 , and displays greater amount of information.
- target values set for each test item are contained in the test result display part 192 a of the patient screen W 3 .
- the target value is obtained by referencing the target value data table DB 5 (see FIG. 17( d )) with the patient ID as the key.
- each test item name in the basic test result display part 192 can be selected by mouse operation (double click etc.), and the time-series graph 192 b for the selected item is displayed at the position in the basic test data screen region 192 (right side of test result display part 192 a ).
- Up to four time-series graphs 192 b can be selected in the basic test data screen region 192 of the patient screen W 3 .
- the test result displayed in the test result display part 192 a can be changed to a test result of a different test date.
- the basic test screen region 192 includes “another test date” button 192 c for selecting an arbitrary test date and displaying the test result of the relevant test date.
- the test result display part 192 a is arranged with “display/not display comparison column” switching button 192 d for displaying the basic test data of another test date as a comparison column or not displaying the relevant display.
- the patient screen W 3 in which the basic test data screen region 192 of the patient screen W 3 is selectively displayed is a test result screen for displaying the result information of a medical test of the patient without involving display of the pathological condition information.
- FIG. 24 shows the OGTT data screen region 193 of the patient screen w 3 .
- the OGTT data screen region 193 is generated based on the OGTT data table DB 4 with the patient ID as the key.
- the OGTT data screen region 193 also can not change the position or the size, but is formed over substantially the entire tab switching screen region 182 , and is formed larger than the OGTT data screen region 162 of the doctor screen W 2 .
- the time-series graph 193 a of the OGTT test data and the radar chart 193 b of the analysis result (pathological condition information) can be displayed.
- the numerical data 193 c of the OGTT test data that could not be displayed unless switched with the tab is simultaneously displayed. The numerical data could not be displayed unless switched with the tab in the doctor screen W 2 , but is displayed with the graph in the patient screen W 2 .
- information 193 a to 193 c on a plurality of test dates can be simultaneously displayed, and the patient can simultaneously compare information on a plurality of test dates.
- the information of the basic test data screen region 192 and the OGTT data screen region 193 are information of different tests for the user, and the necessity to simultaneously view them is low, and thus the convenience of the patient does not lower even if the screen regions 192 , 193 are selectively displayed.
- FIG. 26 shows the prescription/finding screen region 194 of the patient screen W 3 .
- the prescription/finding screen region 194 is generated from the prescription data table DB 6 and the finding data table DB 7 with the patient ID as the key, and the collection of the display content of the prescription screen region 164 and the display content of the finding screen region 165 of the doctor screen W 2 is displayed.
- “G” selecting part 107 is displayed as the image selecting part on the operation screen region W 3 A.
- the image selecting part 107 is provided for the user such as the doctor to switch and select the image 194 g displayed on the prescription/finding screen region 194 .
- FIG. 27 shows the “past prescription list” screen region 195 of the patient screen W 3 .
- the “past prescription list” screen region 195 is generated from the prescription data table DB 6 with the patient ID as the key, and a list of medicines prescribed in a predetermined period in the past is displayed.
- Each screen region 192 and 193 of the patient screen W 3 described above is printed by selecting the “print” button 106 .
- all the necessary information can be printed even if the content of the screen is printed as it is, and a printout easily viewable for the patient can be obtained.
- the display format of the pathological condition information is not limited to a radar chart and may be in other display formats.
- the type and number of pathological condition information to be displayed are not particularly limited, and three indices of hepatic glucose metabolism ability, insulin secretion ability, and peripheral insulin sensitivity may be displayed as pathological condition information.
- the data table is shown in plurals in FIG. 17 , but such data tables may be integrated into one table.
- the data of the most recent test date of the patient is displayed when the screen is switched between the doctor screen W 2 and the patient screen W 3 , but in the doctor screen W 2 or the patient screen W 3 , when switched to another screen W 2 , W 3 after selecting another test date as the test date, the data of another test date may still be continuously displayed in the switched screen W 2 , W 3 .
Abstract
A medical diagnosis support computer system for supporting diagnosis of a patient by a doctor, the system comprising: a display device; and a controller in communication with the display device, the controller comprising a processor configured to build a biological model representing biological functions of the patient on a computer, generate pathological condition information of the patient based on the biological model, display a doctor screen and a patient screen in a switchable manner on the display device; wherein the doctor screen is configured to simultaneously display a screen region for displaying the pathological condition information of the patient and a screen region for displaying one or more related information related to the patient; and the patient screen is configured to selectively display a display content between the pathological condition information of the patient and one or more related information related to the patient is disclosed.
Description
- This application claims priority under 35 U.S.C. § 119 to Japanese Patent Application No. JP2007-136412 filed May 23, 2007, the entire content of which is hereby incorporated by reference.
- The present invention relates to a medical diagnosis support computer system used to support diagnosis of diabetes or the like, a computer program, and a server computer.
- In treating diseases, various tests are usually performed on patients in addition to inquiry by doctors.
- The doctors are currently selecting the treatment methods relying on his/her experience and intuition based on information for making a decision such as test results and clinical findings of the patient.
- Therefore, it is presumed that medical examinations by doctors will be more accurately carried out if information useful for medical examination is provided by a computer.
- A system for supporting medical examination includes a system for predicting blood glucose level as disclosed in Japanese Laid-Open Patent Publication No. 10-332704 and Japanese Laid-Open Patent Publication No. 11-296598.
- Such systems support the medical examination by predicting change in the blood glucose level of a patient and providing the predicted blood glucose level to the doctor.
- When choosing an appropriate treatment method, it is desired that the doctor appropriately understands the factors constituting the cause of various symptoms of the diseases. If the factors are appropriately understood, a more appropriate treatment can be expected by carrying out treatments to improve such factor.
- However, the data that the doctor can use to understand the factor is only the test values obtained by giving tests to the patient.
- The disease is hoped such that the doctor can understand the factor with only the test values, but in some diseases, it is significantly difficult to appropriately understand the factor with only the test values.
- For example, in the case of diabetes, “blood glucose level” is used as an index for indicating the extent of the disease. However, the “blood glucose level” is merely a result, and it is not easy to accurately understand the pathological conditions such as insulin deficiency, peripheral insulin resistance, lowering in uptake of hepatic glucose, and increase in release of hepatic glucose from the clinical findings and the like.
- Therefore, it is still difficult to accurately determine the pathological conditions of the patient if the predicted value of the blood glucose level is merely provided to the doctor as described in Japanese Laid-Open Patent Publication No. 10-332704 and Japanese Laid-Open Patent Publication No. 11-296598.
- In diabetes, heart disease and the like, the specialist determines the pathological condition of the patient by using oral glucose tolerance test, electrocardiogram, and test results such as blood pressure, pulse measurement, blood test, and the like, but abundant experience is required in order to accurately determine the pathological condition from the test results, and this accurate determination is difficult for non-specialists.
- There is demanded a system having an effect of teaching inexperienced doctors and non-specialists so as to be able accurately determine the pathological conditions from the test results.
- Although there is demanded a support system for the doctor to accurately determine the pathological condition of the patient, such system is suitable if it can also be used to provide necessary information to the patients.
- In other words, it is important for the patients to understand his/her condition in terms of enhancing the treatment effect, and the information provided from the system by screen display etc. are desirably viewable by doctors as well as patients.
- However, if information is provided to the patient in the same manner as the manner that the information is provided to the doctor to make accurate determination on the pathological condition, the information may be too complex for the patient, thereby impairing easy understanding of the patient.
- If information is provided to the patient so as to be understandable, the amount of information to be screen displayed etc. becomes small, and it makes difficult for the doctors to accurately determine the pathological condition of the patient thereby impairing easy diagnosis of the doctor.
- The scope of the present invention is defined solely by the appended claims, and is not affected to any degree by the statements within this summary.
- A first aspect of the present invention is a medical diagnosis support computer system for supporting diagnosis of a patient by a doctor, the system comprising: a display device; and a controller in communication with the display device, the controller comprising a processor configured to build a biological model representing biological functions of the patient on a computer, generate pathological condition information of the patient based on the biological model, display a doctor screen for the doctor and a patient screen for the patient in a switchable manner on the display device, and accept an input for switching the display between the doctor screen and the patient screen; wherein the doctor screen is configured to simultaneously display a screen region for displaying the pathological condition information of the patient and a screen region for displaying one or more related information related to the patient; and the patient screen is configured to selectively display a display content between the pathological condition information of the patient and one or more related information related to the patient.
- A second aspect of the present invention is a computer program product, comprising: a computer readable medium; and instructions, on the computer readable medium, adapted to enable a general purpose computer to perform operations, comprising: building a biological model representing biological functions of the patient on a computer; generating pathological condition information of the patient based on the biological model; displaying a doctor screen for the doctor and a patient screen for the patient in a switchable manner on the display device; and receiving an input for switching the display between the doctor screen and the patient screen; wherein the doctor screen is configured to simultaneously display a screen region for displaying the pathological condition information of the patient and a screen region for displaying one or more related information related to the patient; and the patient screen is configured to selectively display a display content between the pathological condition information of the patient and one or more related information related to the patient.
- A third aspect of the present invention is A medical diagnosis support computer system for supporting diagnosis of a patient by a doctor, the system comprising: a display device; and a controller in communication with the display device, the controller comprising a processor configured to build a biological model representing biological functions of the patient on a computer, generate pathological condition information of the patient based on the biological model, display a doctor screen for the doctor and a patient screen for the patient in a switchable manner on the display device, and receive an input for switching the display between the doctor screen and the patient screen; wherein the doctor screen is configured to simultaneously display a screen region for displaying the pathological condition information of the patient and a screen region for displaying one or more related information related to the patient; and the patient screen comprises a test result screen for displaying result information of a medical test of the patient without display of the pathological condition information.
- A fourth aspect of the present invention is a computer program product, comprising: a computer readable medium; and instructions, on the computer readable medium, adapted to enable a general purpose computer to perform operations, comprising: building a biological model representing biological functions of the patient on a computer; generating pathological condition information of the patient based on the biological model; displaying a doctor screen for the doctor and a patient screen for the patient in a switchable manner on the display device; and receiving an input for switching the display between the doctor screen and the patient screen; wherein the doctor screen is configured to simultaneously display a screen region for displaying the pathological condition information of the patient and a screen region for displaying one or more related information related to the patient; and the patient screen comprises a test result screen for displaying result information of a medical test of the patient without display of the pathological condition information.
- A fifth aspect of the present invention is a server computer for displaying a screen for supporting a diagnosis of a patient by a doctor on a display device of a terminal device connected by way of a network, the server computer comprising: a controller in communication with the terminal device, the controller comprising a processor configured to display a doctor screen for the doctor and a patient screen for the patient in a switchable manner on the display device of the terminal device, and switch the display between the doctor screen and the patient screen when an input for switching between the doctor screen and the patient screen is made at the terminal device; wherein the doctor screen is configured to simultaneously display a screen region for displaying pathological condition information of the patient generated based on a biological model built on a computer to represent biological functions of the patient and a screen region for displaying one or more related information related to the patient; and the patient screen is configured to selectively display a display content between the pathological condition information of the patient and one or more related information related to the patient.
- A sixth aspect of the present invention is a server computer for displaying a screen for supporting a diagnosis of a patient by a doctor on a display device of a terminal device connected by way of a network, the server computer comprising: a controller in communication with the terminal device, the controller comprising a processor configured to display a doctor screen for the doctor and a patient screen for the patient in a switchable manner on the display device of the terminal device, and switch the display between the doctor screen and the patient screen when an input for switching between the doctor screen and the patient screen is made at the terminal device; wherein the doctor screen is configured to simultaneously display a screen region for displaying pathological condition information of the patient generated based on a biological model built on a computer to represent biological functions of the patient and a screen region for displaying one or more related information related to the patient; and the patient screen includes a test result screen for displaying result information of a medical test of the patient without display of the pathological condition information.
-
FIG. 1 is a system configuration view of a medical diagnosis support computer system; -
FIG. 2 is a block diagram showing a hardware configuration of a server; -
FIG. 3 is a block diagram showing an overall configuration of a biological model; -
FIG. 4 is a block diagram showing a configuration of a pancreas model of the biological model; -
FIG. 5 is a block diagram showing a configuration of a hepatic model of the biological model; -
FIG. 6 is a block diagram showing a configuration of an insulin kinetics model of the biological model; -
FIG. 7 is a block diagram showing a configuration of a peripheral tissue model of the biological model; -
FIG. 8 is a flowchart showing a parameter set generating process procedure; -
FIG. 9 shows actual measured OGTT time-series data, wherein (a) is blood glucose level, and (b) is blood insulin concentration; -
FIG. 10 is a configuration of a template database DB1; -
FIG. 11 is a template data, wherein (a) is blood glucose level and (b) is insulin concentration; -
FIG. 12 is a view showing error summation of the OGTT time-series data with respect to the template T1, wherein (a) is blood glucose level and (b) is insulin concentration; -
FIG. 13 is a basic screen of the system; -
FIG. 14 is a screen transition view of the system; -
FIG. 15 is a doctor screen; -
FIG. 16 is a patient screen; -
FIG. 17 is a view showing a data structure of a database; -
FIG. 18 is a view showing an operation menu of the basic screen; -
FIG. 19 is a patient information edit screen; -
FIG. 20 is a basic test data input screen; -
FIG. 21 is an OGTT data input screen; -
FIG. 22 is a target value input screen; -
FIG. 23 is a doctor screen; -
FIG. 24 is a patient screen in which the basic test data screen region is selected; -
FIG. 25 is a patient screen in which the OGTT data screen region is selected; -
FIG. 26 is a patient screen in which the prescription/finding screen region is selected; and -
FIG. 27 is a patient screen in which the past prescription list screen region is selected. - The preferred embodiments of the present invention will be described hereinafter with reference to the drawings.
- Embodiments of a medical diagnosis support computer system (hereinafter also simply referred to as “system”) according to the present invention will now be described in detail with reference to the accompanied drawings.
-
FIG. 1 shows a system configuration view of the case when a medical diagnosis support computer system SS is configured as a server client system. In the present embodiment, the system SS is built as a system for supporting diagnosis of diabetes. - The system SS is configured as a network system including a server computer (hereinafter also simply referred to as “server”) S, and a client terminal device (hereinafter also simply referred to as “client”) connected to the server S by way of Internet or network such as LAN.
- The system SS may be configured by one computer.
- The client C is used by a user such as doctor, laboratory technician, and the like. The client C is configured by a computer including a display device (display) and an input device (keyboard or mouse etc.). A printer (not shown) is connected to the client C, so that display screen etc. of the client can be printed.
- The client C includes a Web browser C1. The Web browser C1 serves as a user interface of the system SS. That is, the screen generated in the server S and transmitted to the client C is output on the Web browser C1. The user can input and perform necessary operations on the Web browser C1.
- The server S has a function serving as an application server S1, a function serving as a simulator/analysis server S2, and a function serving as a database server S3. Each function S1 to S3 may be realized with one computer, or may be realized by a plurality of computers connected network.
- In the present embodiment, the application server S1 has a central function to have the network system SS function as the medical diagnosis support system, and has a function of generating a screen to be displayed on the Web browser C1 and transmitting the same to the client terminal C, and of accepting the information input in the Web browser C1 from the client terminal C.
- Thus, a computer program (application program) for realizing a function of generating a user interface screen to be displayed on the Web browser C1, a function of accepting information from the client terminal C, and a function of performing other necessary processes is loaded on the application server S1 so as to be executed by a computer.
- The client terminal C may download a program such as java (registered trademark) applet for realizing some or all of the functions of the screen displayed on the Web browser C1 from the server S, and display the screen on the Web browser C1.
- The simulator/analysis server (pathological condition information analysis server) S2 builds a biological model representing the biological functions of a patient on a computer (server S), and generates pathological condition information (pathological condition information of diabetes) of the patient based on the biological model.
- In the present embodiment, the biological model is built as a mathematical model on the computer including a plurality of parameters related to the biological functions to represent the entire human body or biological functions of a certain disease. The simulator/analysis server S2 performs simulation on the disease (diabetes) of a specific patient based on the biological model, and acquires the pathological condition information of the relevant patient by simulation.
- A pathological condition simulator/analysis program (pathological information analysis computer program) is loaded on the simulator/analysis server (pathological condition information generation server; pathological condition information generation unit) S2 to be executed by a computer, and the simulation and the analysis function are realized by the relevant program.
- A database having various data DB1 to DB7 of test result etc. of the patient is built in the database server S3.
-
FIG. 2 is a block diagram showing hardware configuration of the server S. The server S is composed of a computer mainly including a main body S110, a display S120, and an input device S130. The main body S110 is mainly configured by aCPU 110 a, a ROM S110 b, a RAM S110 c, a hard disk S110 d, a readout device S110 e, an input/output interface S110 f, and an image output interface S110 h, wherein the CPU S110 a, the ROM S110 b, the RAM S110 c, the hard disk S110 d, the readout device S110 e, the input/output interface S110 f, and the image output interface S110 h are data-communicably connected by a bus S110 i. - The CPU S100 a is capable of executing a computer program recorded in the ROM S110 b and a computer program loaded in the RAM S110 c.
- The CPU S110 a executes an
application program 140 a for realizing the application server S1 function, a program for realizing the simulator/analysis server S2 function, and a program for realizing the database server function, to realize each function block as described below, whereby the computer functions as the server S of the present embodiment. - The ROM S110 b includes mask ROM, PROM, EPROM, EEPROM, etc. and is recoded with computer programs executed by the
CPU 110 a and data used for the programs. - The
RAM S 110 c comprises SRAM, DRAM, etc. TheRAM S 110 c is used to read out computer programs recorded in the ROM S110 b and the hard disk S110 d. TheRAM 110 c is used as a work area of the CPU S110 a when these computer programs are executed. - The hard disk S110 d is installed with an operating system and an application program, etc., as well as various computer programs to be executed by the
CPU 110 a, and data used for executing the computer programs. - The readout device S110 e which comprises a flexible disk drive, a CD-ROM drive or DVD-ROM drive is capable of reading out a computer program or data recorded in a portable recording media S140. The portable recording media S140 stores the computer program for the computer to function as the system of the present invention, wherein the computer reads out the necessary application program S140 a etc. from the portable recording media S140 and installs the relevant application program S140 a etc. in the hard disk S110 d.
- The computer program such as the application program S140 a is not only provided by the portable recording media S140, and may be provided through an electric communication line (wired or wireless) from external devices which are communicably connected to the computer via the electric communication line. For example, the application program S140 a etc. may be stored in a hard disk in an application program providing server computer on the Internet, so that the computer program can be downloaded by accessing the server computer and installed in the hard disc S110 d.
- The
hard disk 110 d is installed with an operating system which provides a graphical user interface environment, e.g. Windows (registered trademark) manufactured by US Microsoft Corp. In the following description, the computer program described in the present embodiment is assumed as operating on the operating system. - The input/output interface S110 f includes a serial interface such as USB, IEEE1394, and RS-232C; a parallel interface such as SCSI, IDE, and IEEE1284; and an analog interface such as D/A converter and A/D converter. The input/output interface S110 f is connected to the input device S130 including a keyboard and a mouse, and users can use the input device S130 to input data into the computer.
- The image output interface S110 h is connected to the display S120 configured by LCD, CRT or the like so that picture signals corresponding to image data provided from the CPU S110 a are output to the display S120. The display S120 displays an image (screen) based on the input picture signals.
- The hardware configuration of the client terminal C is the same as the hardware configuration of the server S.
- The simulator/analysis server (pathological condition information generation server; pathological condition information generation unit) S2 will now be described.
-
FIG. 3 is a block diagram showing an overall configuration of one example of a biological model used in the pathological condition simulation according to the present embodiment. The biological model particularly simulates biological organs associated with diabetes, and comprises apancreas block 1, ahepatic block 2, aninsulin kinetics block 3, and aperipheral tissue block 4. - Each
block pancreas block 1, ablood glucose level 6 is set as input and aninsulin secretion rate 7 is set as output. - As to the
hepatic block 2,glucose absorption 5 from digestive tract, theblood glucose level 6 and theninsulin secretion rate 7 are set as input, andnet glucose release 8 and postliver insulin 9 are set as output. - As to the
insulin kinetics block 3, postliver insulin 9 is set as input andinsulin concentration 10 at the peripheral tissues is set as output. - As to the
peripheral tissue block 4, thenet glucose release 8, and theinsulin concentration 10 at the peripheral tissues are set as input, and theblood glucose level 6 is set as output. -
Glucose absorption 5 is data provided from outside of the biological model (database server S3). In the present embodiment, data related to glucose absorption is registered in the database S3 as actual test data (biological response). - Furthermore, the function blocks 1 to 4 are respectively realized when the computer program is executed by the CPU of the server S2.
- Next, each of above-mentioned blocks will be described in detail. FGB and Ws indicate a fasting blood glucose level (FGB=BG(0)) and the patient's weight, respectively, and DVg and DVi indicate a distribution capacity volume with respect to glucose and a distribution capacity volume with respect to insulin, respectively.
- Relationship between input and output of the
pancreas block 1 may be expressed using the following differential equation (1). The relationship can also be represented using a block diagram as inFIG. 6 equivalent to the differential equation (1). - Differential equation (1):
-
- Variables:
- BG(t): blood glucose level
- X(t): total amount of insulin capable of being secreted from pancreas
- Y(t): supply rate of insulin newly supplied to X(t) with respect to glucose stimulation
- SR(t): insulin secretion rate from pancreas
- Parameters:
- h: threshold of glucose concentration capable of stimulating insulin supply
- α: following performance to glucose stimulation
- β: sensitivity to glucose stimulation
- M: secretion rate per unit concentration
- The
blood glucose level 6 which is the input to thepancreas block 1 inFIG. 3 corresponds to BG(t), and theinsulin secretion rate 7 which is the output corresponds to SR(t). - In the block diagram in
FIG. 6 ,numeral 6 indicates blood glucose level BG(t); 7 indicates insulin secretion rate SR(t) from pancreas; 12 indicates glucose concentration threshold h capable of stimulating insulin supply; 13 indicates sensitivity to glucose stimulation β; 14 indicates following performance to glucose stimulation a; 15 indicates integral element; 16 indicates supply rate Y(t) of newly supplied insulin with respect to glucose stimulation; 17 indicates integral element; 18 indicates total amount of insulin X(t) capable of being secreted from pancreas; and 19 indicates secretion rate M per unit concentration. - Relationship between input and output of the
hepatic block 2 may be described using the following differential equation (2). The relationship can also be represented using a block diagram as inFIG. 7 equivalent to the differential equation (2). -
dI 4(t)/dt=α2{−A 3 I 4(t)+(1−A 7)·SR(t)} -
Goff(FGB)=f1(FGB<f3) -
=f1+f2·(FGB<f3) -
(FGB>=f3) -
Func1(FGB)=f4−f5−(FGB−f6) -
Func2(FGB)=f7/FGB -
b1(I 4(t))=f8{1+f9·I4(t)} -
HGU(t)=r·Func1(FGB)·b1(I 4(t))·RG(t)+(1−r)·Kh·BG(t)·I 4(t) -
(HGU(t)>=0) -
HGP(t)=I 4off·Func2(FGB)·b2+G off(FGB)−I 4(t)·Func2(FGB)·b2 -
(HGP(t)>=0) -
SGO(t)=RG(t)+HGP(t)−HGU(t) -
SRpost(t)=A 7 SR(t) Differential equation (2) - Variables:
-
- BG(t): blood glucose level (glucose concentration per unit volume of blood)
- SR(t): insulin secretion rate from pancreas
- SRpost(t): post hepatic insulin
- RG(t): glucose absorption from digestive tract
- HGP(t): hapatic glucose release
- HGU(t): hepatic glucose uptake
- SGO(t): net glucose from liver
- I4(t): hepatic insulin concentration
- Parameter:
-
- Kh: insulin dependent glucose uptake rate in liver per unit glucose
- A7: insulin uptake rate in liver
- Goff: glucose release rate to basal metabolism
- b2: adjustment term for hepatic glucose release suppression rate
- r: insulin independent hepatic glucose uptake distribution rate
- α2: following performance with respect to insulin stimulation
- I4off: insulin concentration threshold at which hepatic glucose release is suppressed
- Function:
-
- Goff (FBG): glucose release rate to basal metabolism
- Func1 (FBG): hepatic glucose uptake rate to glucose stimulation from digestive tract
- Func2 (FBG): hepatic glucose release suppression rate to insulin stimulation
- f1 to f9: constants used to express the above-mentioned three elements
- b1(I4(t)): adjustment item for hepatic glucose uptake rate
- Here, the
glucose absorption 5 from digestive tract which is input to the hepatic block inFIG. 3 corresponds to RG(t), theblood glucose level 6 corresponds to BG(t) and theinsulin secretion rate 7 corresponds to SR(t), and furthermore, thenet glucose release 8 which is the output corresponds to SGO(t) and thepost liver insulin 9 corresponds to SRpost(t). - In a block diagram in
FIG. 7 , numeral 5 indicates glucose absorption RG(t) from digestive tract; 6 indicates blood glucose level BG(t); 7 indicates insulin secretion rate SR(t) from pancreas; 8 indicates net glucose SGO(t) from liver; 9 indicates post liver insulin SRpost(t); 24 indicates insulin passage rate (1−A7) of liver; 25 indicates following performance to insulin stimulation α2; 26 indicates post liver insulin distribution rate A3; 27 indicates integral element; 28 indicates hepatic insulin concentration I4(t); 9 indicates insulin-dependant hepatic glucose uptake distribution rate (1−r); 30 indicates insulin-dependent glucose uptake rate Kh in liver per unit glucose; 31 indicates insulin-independent hepatic glucose uptake distribution rate r; 32 indicates hepatic glucose uptake rate to glucose stimulation from digestive tract Func1(FGB); 33 indicates adjustment item for hepatic uptake rate b1(I4(t)); 34 indicates hepatic glucose uptake HGU(t); 35 indicates insulin concentration threshold at which hepatic glucose release is suppressed I4off; 36 indicates hepatic release suppression rate (FGB) to insulin stimulation Func2; 37 indicates adjustment items hepatic glucose release suppression rate b2; 38 indicates glucose release rate HGP(t) to basal metabolism; 39 indicates hepatic glucose release HGP(t), and 40 indicates insulin uptake rate A7 in liver. - Relationship between input and output of the insulin kinetics secretion may be described using the following differential equation (3). The relationship can also be represented using a block diagram as in
FIG. 8 equivalent to the differential equation (3). -
dI 1(t)/dt=−A 3 I 1(t)+A 5 I 2(t)+A 4 I 3(t)+SRpost(t) -
dI 2(t)/dt=A 6 I 1(t)−A 5 I 2(t) -
dI 3(t)/dt=A 2 I 1(t)−A 1 I 3(t) Differential equation (3) - Variables:
-
- SRpost(t): post hepatic insulin
- I1(t): blood insulin concentration
- I2(t): insulin concentration in insulin independent tissues
- I3(t): insulin concentration in peripheral tissues
- Parameters:
-
- A1: insulin disappearance rate in peripheral tissues
- A2: insulin distribution rate to peripheral tissues
- A3: post hepatic insulin distribution rate
- A4: post peripheral tissue insulin flow out rate
- A5: insulin disappearance rate in insulin independent tissues
- A6: insulin distribution rate to insulin independent tissues
- Here, the
post liver insulin 9 which is the input to the insulin kinetics block inFIG. 3 corresponds to SRpost(t), and theinsulin concentration 10, which is the output, at the peripheral tissue corresponds to I3(t). - In a block diagram in
FIG. 8 ,numeral 9 indicates post liver insulin SRpost (t); 10 indicates insulin concentration I3(t) in peripheral tissue; 50 indicates integral element; 51 indicates post liver insulin distribution rate A3; 52 indicates blood insulin concentration I1(t); 53 indicates insulin distribution rate A2 to peripheral tissues; 54 indicates integral element; 55 indicates insulin disappearance rate A1 in peripheral tissue; 56 indicates post peripheral tissue insulin flow out rate A4; 57 indicates insulin distribution rate A6 to insulin independent tissue; 58 indicates integral element; 59 indicates insulin concentration in insulin independent tissue I2(t); 60 indicates insulin disappearance rate A5 in insulin independent tissue. - Relationship between input and output of the
peripheral tissue block 4 may be described using the following differential equation (4). The relationship can also be represented using a block diagram as inFIG. 9 equivalent to the differential equation (4). -
dBG′/dt=SGO(t)−u*Goff(FGB)−Kb(BG′(t)−FBG′)−Kp·I 3(t)·BG′(t) Differential equation (4) - Variables:
-
- BG′(t): blood glucose level (glucose concentration per unit weight) (BG[mg/dl], BG′[mg/kg])
- SGO(t): net glucose from liver
- I3(t): insulin concentration in peripheral tissues
- FBG′: fasting blood glucose (provided that FBG′=BG(0))
- Parameters:
-
- Kb: insulin independent glucose consumption rate in peripheral tissues
- Kp: insulin dependent glucose consumption rate in peripheral tissues per unit insulin and per unit glucose
- u: ratio of insulin independent glucose consumption to basal metabolism in glucose release rate to basal metabolism
- Functions:
-
- Goff(FGB): glucose release rate to basal metabolism
- f1 to f3: constant used to express Goff
- Here, the
insulin concentration 10, which is the input to the peripheral tissue block inFIG. 3 , in peripheral tissue corresponds to I3(t), thenet glucose 8 from liver corresponds to SGO(t), and theblood glucose level 6 which is the output corresponds to BG(t). - In a block diagram in
FIG. 9 ,numeral 6 indicates blood glucose level BG(t); 8 indicates net glucose SGO(t) from liver; 10 indicates insulin concentration I3(t) in peripheral tissues; 70 indicates insulin independent glucose consumption rate to basal metabolism u*Goff(FGB); 71 indicates integral element; 72 indicates insulin independent glucose consumption rate Kb in peripheral tissues; 73 indicates insulin dependent glucose consumption rate Kp in peripheral tissues per unit insulin and per unit glucose; and 74 indicates unit conversion constant Ws/DVg. - As shown in
FIG. 3 , since inputs and outputs are mutually connected between the blocks constituting the present system, it is possible to calculate and simulate time-series change of blood glucose level and insulin concentration based on the mathematical formula by providingglucose absorption 5 from digestive tract. - With regard to calculation of the differential equations of the present system, e.g. E-Cell (software disclosed by Keio University) and MatLab (manufactured by The MathWorks, Inc.) may be employed, or other calculation systems may be employed.
- To simulate the biological organs of individual patient by using the above-mentioned biological models as shown in
FIGS. 3 to 9 , it is required to generate a biological model having characteristics suited for individual patient. More specifically, it is required to determine parameters and initial values of variables of the biological model according to the individual patient, and apply the determined parameters and initial values to the biological model, thereby generating a biological model suited for the individual patient. (Unless otherwise specified, an initial value of variable is also included in parameters to be generated.) - The server 2 (simulator/analysis server S2) of the present system SS thus has a function of obtaining an internal parameter set or a set of internal parameters of the biological model (hereinafter simply referred to also as “parameter set”), and generating the biological model applied with the obtained parameter set to realize the function as the biological model generating section. This function is also realized through the pathological condition simulator/analysis program.
- The parameter set generated by the biological model generating section is applied to the biological model, and a biological model calculating section simulates the function of the biological organs and outputs the pseudo-response simulating the actual biological response (test result).
- In the following, description will be made for a parameter set generating section for generating the parameter set for forming a biological model that simulates the biological organ of the patient based on the actual test result (biological response) of the patient (biological body).
-
FIG. 4 is a flowchart showing procedures in which the parameter set generating section of the system SS obtains a parameter set of the biological model. In order to obtain parameters, first, an input step of OGTT (oral glucose tolerance test) time-series data serving as an actual test result (biological response) is executed as shown in the figure (Step S1-1). - The OGTT time-series data are a result of OGTT (given amount of glucose solution is orally loaded to measure the temporal change of blood glucose level and blood insulin concentration) or the test actually performed on the patient to be simulated by a biological model, wherein the present system accepts the input as the actual biological response (actual test value) from the
client terminal 3. Here, two data of OGTT glucose data (blood glucose change data) and OGTT insulin (blood insulin concentration change data) are input as OGTT time-series data. - The input OGTT time-series data are registered as “test data” in the OGTT data table DB4 (see
FIG. 17( c)) of the databases of the database server S3. -
FIG. 5 shows an example of the blood glucose level change data (FIG. 5( a)) and the blood insulin concentration change data (FIG. 5( b)) as the OGTT time-series data to be input. - The blood glucose level change data of
FIG. 5( a) is measured data corresponding to temporal change of the blood glucose level BG(t), or one of output items in the biological model shown inFIGS. 3 to 9 . - The blood insulin concentration change data of
FIG. 5( b) is measured data corresponding to temporal change of blood insulin concentration I1(t), or one of output items in the biological model shown inFIGS. 3 to 9 . - Next, the present system SS matches the input OGTT time-series data to the template of template database DB1. The template database DB1 is one database contained in the
databases 24 of the database server S3. - As shown in
FIG. 10 , the template database DB1 is stored in advance with a plurality sets of data in which biological model reference output values T1, T2, . . . that become template is corresponded to parameter setsPS# 01,PS# 02 . . . for generating the reference output value. To form a pair including the reference output value and the parameter set, an appropriate parameter set may be assigned to an arbitrary reference output value, or on the contrary, the output of the biological model in the case when an arbitrary parameter set is selected may be obtained by the biological simulation system. -
FIG. 11 shows an example of a template (reference output value) T1.FIG. 11( a) is the blood glucose level change data serving as a template, which is reference time-series data corresponding to temporal change of the blood glucose level BG(t) or one of the output items in the biological model shown inFIGS. 3 to 9 .FIG. 11( b) is the blood insulin concentration change data serving as a template, which is reference time-series data corresponding to temporal change of the blood insulin concentration I1(t) or one of the output items in the biological model shown inFIGS. 3 to 9 . - The system SS computes similarity between each reference time-series data of the above-mentioned template database DB and OGTT time-series data. The similarity is obtained by obtaining error summation. The error summation is obtained by the following formula.
-
- wherein
-
- BG: input data blood glucose level [mg/dl]
- PI: input data blood insulin concentration [μU/ml]
- BGt: template blood glucose level[mg/dl]
- PIt: template blood insulin concentration [μU/ml]
- t: time[minute]
- Here, α and β are coefficient used for normalization
-
α=1/Average{ΣBG(t)} -
β=1/Average{ΣPI(t)} - The average of the formula shows average value with respect to all templates stored in the template database DB1.
-
FIG. 12 shows error summation (no normalization) of the OGTT time-series with respect to the template T1, and more specifically,FIG. 12( a) shows an error between the blood glucose level ofFIG. 5( a) and the blood glucose level ofFIG. 11( a), andFIG. 12( b) shows an error between the insulin ofFIG. 5( b) and the insulin ofFIG. 11( b). - Referring to the input data (data from 0 to 180 minutes every 10 minutes) of
FIG. 9 and the template T1 ofFIG. 11 , -
- Thus, the CPU 100 a obtains an error summation for each template in the template database DB1, and determines a template having minimum error summation (similarity), that is, the CPU 100 a determines the template which is the most approximate to the OGTT time-series data (Step S1-2).
- Further, in step S1-3, the system SS acquires a parameter set corresponding to the template determined in step S1-2 from the template database DB1. That is, a parameter
set PS# 01 corresponding to the template T1 is obtained (seeFIG. 10 ). - The following table 1 shows specific numeral values of the parameter values included in the parameter
set PS# 01 obtained as above. -
TABLE 1 Parameter set PS # 01 with respect to template TlParameter Value Unit Pancreas h 92.43 [mg/dl] α 0.228 [1/min] β 0.357 [(μU/ml) · (dl/mg) · (1/min)] M 1 [1/min] X (0) 336.4 [μU/ml] Y (0) 4.4 [(μU/ml) · (1/min)] Insulin A1 0.025 [1/min] kinetics A2 0.042 [1/min] A3 0.435 [1/min] A4 0.02 [1/min] A5 0.394 [1/min] A6 0.142 [1/min] Peripheral Kb 0.009 [1/min] tissues Kp 5.28E−05 [(ml/μU) · (1/min)] u 0.6 Liver A7 0.47 Kh 0.0000462 [(ml/μU) · (1/min) · (dl/kg)] b2 1.1 r 0.98 α2 0.228 I4off 5 [μU/ml] - The method for generating the parameter set (biological model) is not limited to template matching as described above. For instance, the parameter set may be generated through genetic algorithm. That is, genetic algorithm may be applied of randomly producing an initial group of parameter set, and performing selection/chiasm/mutation process on the parameter set (individual) contained in the initial group to generate a new child group. Among the parameter sets generated through this genetic algorithm, the parameter set that outputs the pseudo-response close to the input biological response (test result) can be adopted.
- Thus, the specific generating method of the biological model generating section is not particularly limited as long as the biological model that outputs pseudo-response simulating the input biological response can be generated.
- The system SS has a function of, when the parameter
set PS# 01 is provided to the biological model, performing a calculation based on the relevant biological model, and outputting pseudo-response information (time-series change in blood glucose level and insulin concentration) simulating the input OGTT time-series data (function as pseudo-response acquiring unit (biological model calculating section) of the system SS) - That is, the biological organs of the patient can be simulated based on the generated biological model in the system SS. This function is also realized by the pathological condition simulator/analysis program.
- The generated parameter set is also used to acquire the pathological condition information (pathological condition feature information), which aspect will be hereinafter described.
-
FIG. 13 shows a screen of the present system SS generated by a screen control unit S1-A of the application server S1 of the server S and displayed on the display device of the client C. - The screen of
FIG. 13 shows a starting screen immediately after the user such as doctor logs into the present system from the client C. - The screen of the present system SS is displayed on the Web browser C1 of the client C. In
FIG. 13 , a title bar C1-1, a tool bar C1-2, and a display region C1-3 of the Web browser C1 are shown. A screen to be displayed in the display region C1-3 of the browser C1 is generated in the server S. For the sake of simplification, only the display region C1-3 is shown in the figure showing the screen, and the illustrations of various bar C1-1, C1-2 displays of the Web browser will be omitted. - A patient search/list screen (hereinafter also referred to as “basic screen”) W1 for searching the patient information and displaying the search result is displayed in the browser display region C1-3 of
FIG. 13 . The basic screen W1 is also a screen (route screen) that acts as a basis for transitioning to other screens W2, W3. - As also shown in
FIG. 14 , a medical examination main screen W2 (seeFIG. 15 ) or a doctor screen for the doctors to browse through, and a patient screen W3 (seeFIG. 16 ) for the patients to browse through can be transitioned from the basic screen W1. The user can transition to other two screens W1, W2, W3 from any one of the screens W1, W2, W3. - Each screen W1, W2, W3 includes operation screen regions W1A, W2A, W3A arranged with button displays for system operation such as screen transition operation etc., and main body screen regions W1B, W2B, W3B for displaying the content for each screen W1, W2, W3 and performing operation in each screen W1, W2, W3.
- The operation screen regions W1A, W2A, W3A are the display content of the main body screen regions W1B, W2B, W3B, but are always displayed for each screen W1, W2, W3.
- The operation screen regions W1A, W2A of the basic screen W1 and the doctor screen W2 are common, and include “patient search list”
button 101, “main medical examination”button 102, and “patient view”button 103. -
Such buttons - The operation screen regions W1A, W2A of the basic screen W1 and the doctor screen W2 include a “notice”
button 104 for displaying “notice” screen” from the system to the user, and “log out”button 105 for logging out from the system S. - The operation screen region W3A of the patient screen W3 includes “print”
button 16 for executing a print process of printing the content of the screen displayed on the main body screen region B of the patient screen W3 by means of a printer, in addition to thetransition buttons button 106 is selected, the content of the current main body screen region B is printed. The screen content printed on the paper is handed to the patient, and this paper resource becomes the resource when the doctor gives an explanation to the patient, and the auxiliary resource for the patient to understand his/her condition. - The operation screen region W3A of the patient screen W3 also includes “log out”
button 105. The operation screen region W3A of the patient screen W3 does not include the “notice”button 104, and the screen is simplified. -
FIG. 14 shows an entire state transition of the system by the operation of the button displayed on the operation screen region of each screen W1, W2, W3 other than the screen transition. The reference numerals denoted on the arrow inFIG. 14 indicate the operation by the button (button of the operation screen region of the screens W1, W2, W3) having the corresponding reference numeral. - In the basic screen W1 and the doctor screen W2, the operation screen regions W1A, W2A are arranged at the upper part of the screens W1, W2 to which one tends to pay attention in order to ensure operability by the system user such as doctors or laboratory technicians.
- The patient does not directly operate the system but simply looks at the screen, and thus the screen is simplified in the patient screen W3, and the operation screen region W3A is arranged at the lower part of the screen W3 to be easier for the patient.
- Furthermore, in the operation screen region W3A of the patient screen W3, the button size is made smaller etc. so that buttons do not stand out more than the operation screen regions W1A, W2A of the basic screen W1 and the doctor screen W2.
- The details of the patient search/list screen W1 or the basic screen will be described below. The basic screen W1 has a function of searching the patient by inputting search conditions such as patient's name, and a function of displaying the patient list as a search result. Both functions may be configured by separate screens.
- As shown in
FIG. 13 , the (main body screen region W1B) of the basic screen W1 includes asearch operation part 110 for inputting the search condition etc., and a searchresult display part 130 for displaying the search result. - The basic screen W1 includes a
new registration part 140 for newly registering the information of the patient. If thenew registration part 140 is selected to perform the new registration process, the information on a new patient is registered in the database, and the relevant patient can be searched for. - The
search operation part 110 includes input parts of various search conditions such as patientID input part 111, carteID input part 112, patient'sname input part 113, patient name kanainput part 114,sex input part 115, attendingphysician input part 116, date ofbirth input part 117,memo input part 118, elapsed number of days from lastinterview input part 119, test itemname input part 120, and the like as search conditions. - In the present embodiment, one or more input conditions are input to the input part, and the
search button 121 is selected so that the relevant search conditions are transmitted to the server S. When receiving the search conditions, the application server S1 of the server S searches the patient data table DB2 contained in the database of the database server S3. The content of the patient data table is as shown inFIG. 17( a). In the patient data table, the patient information corresponding to the search conditions is registered by patients. - When extracting the information of the patient that matches the search condition, the server S generates a basic screen in which the extracted information is displayed in a list in the search
result display part 130 and transmits the same to the client C. - In the client C, the basic screen W1 transmitted from the server S is displayed. In the search
result display part 130 of the basic screen W1 after the search, the patient search result list is displayed, as shown inFIG. 13 . In the testresult display part 130, the information on the patient extracted by the search condition (patient ID 131,patient name 132,sex 133, date ofbirth 134, attendingphysician 135, carte ID 136) are displayed. The patient list is normally organized in ascending order of the patient ID, but the ascending order or the descending order of the selected patient information (e.g., date of birth) can be reorganized by clicking eachitem 131 to 136 of the patient information. - The
operation menu part 137 in which the operation can be selected is displayed for each patient in the searchresult display part 130. As shown inFIG. 18 , if theoperation menu part 137 for a certain patient is selected, “patient information edit” selectingpart 151, “test data input” selectingpart 152, “main medical examination” selectingpart 153, and “patient view” selectingpart 154 are displayed as selectable operation menus. - Since the
operation menu part 137 is displayed for every patient, the selection of the operation menu and selection of the patient can be performed at the same time. - When the user such as the doctor selects the “patient information edit” selecting
part 151, the server S references the patient data table DB2 (seeFIG. 17( a)) of the database with the patient ID of the selected patient as the key information, and the patient information to be edited is extracted. The server S then generates a “patient information edit” screen on which the information of the patient (content of patient data table) is edited, and displays the same to the client C (seeFIG. 19) . After the editing of the patient information is terminated, the server S updates the content of the patient data table DB2 for the relevant patient. The screen then returns to the original basic screen W1. - When the user such as the doctor selects the “test data input” selecting
part 152, the server S generates a “test data input screen” on which the test data is input, and displays the same to the client C (seeFIGS. 21 and 22 ). After the input of the test data is terminated, the screen returns to the original basic screen W1. - The test data input screen is configured such that the basic test data screen (
FIG. 20 ) for inputting the basic test values such as weight, the OGTT data screen (FIG. 21 ) for inputting the OGTT data, the target value screen (FIG. 22 ) for inputting the target value of the basic test item can be switch displayed by tab form. - In the basic test data screen of
FIG. 20 , the test result of each test item can be input for every test date. The data input in the basic test data screen is registered in the basic test result data table DB3 of the database as test result for every test date along with the patient ID. - In the OGTT data screen of
FIG. 21 , the OGTT glucose data (blood glucose level change data) and the OGTT insulin data (blood insulin concentration change data) are input as the OGTT time series data for every test date. The data input in the OGTT data screen are registered in the OGTT data table DB4 of the database as test data for every test date along with the patient ID (seeFIG. 17( c)). - In the target value screen of
FIG. 22 , the target value for the basic test items such as weight can be input. The data input in the target value screen are registered in the target value data table DB5 along with the patient ID (seeFIG. 17( d)). - When new registration or correction of the OGTT data is performed in the OGTT data screen of
FIG. 21 , the simulator/analysis server S2 performs simulation and pathological condition analysis by using the OGTT data, and acquires the pathological condition information (pathological condition feature information) showing the features of the pathological condition. The acquired pathological condition feature information is registered in the OGTT data table DB4 of the database in association with the OGTT data. The details of the pathological condition analysis will be hereinafter described. - Since the weight information (one of the basic test items) of the patient is also necessary in simulation and pathological condition analysis, the weight of the patient at the test date of the most recent basic test is acquired from the basic test result data table DB.
- Thus, since the basic test data are also used in simulation and pathological condition analysis, re-execution of the simulation and re-analysis of the pathological condition are performed in the system SS not limited to when new registration and correction of the OGTT data are performed in the OGTT data screen of
FIG. 21 , but also when registration and correction of the basic test data are performed in the basic test data input screen ofFIG. 20 . The re-acquired pathological condition feature information is registered in the OGTT data table DB4 of the database in association with the OGTT data used in the simulation. - Returning to
FIG. 18 , when the user such as the doctor selects the “main medical examination” selectingpart 153 in basic screen W1, the server S generates “main medical examination” screen (doctor screen) W2 displaying information on the selected patient, and displays the same to the client C (seeFIG. 15 ). - The doctor screen W2 displays information on the “patient” selected in the basic screen W1, wherein the server S references the data tables DB2 to DB7 in the database with the patient ID of the selected patient as the key, extracts the information on the relevant patient, and generates the doctor screen W2 for displaying the information on the patient to support the diagnosis made by the doctor.
- When the user such as the doctor selects “patient view” selecting
part 154 in the basic screen W1, the server S generates “patient view” screen (doctor screen) W3) displaying information on the selected patient, and displays the same to the client C (seeFIG. 16 ). - The patient screen W3 displays information on the “patient” selected in the basic screen W1, and the server S references the data tables DB2 to DB7 in the database with the patient ID of the selected patient as the key, extracts the information on the relevant patient, and generates the patient screen W2 for displaying the information that can be browsed by the patient.
- Here, the difference between the screen transition by the operation of the “main medical examination” selecting
part 153 and the “patient view” selectingpart 154 ofFIG. 18 , and the screen transition by the operations of the “main medical examination”button 102 and the “patient view”button 103 of the operation screen regions W1A, W2A, W3A ofFIGS. 13 , 15, and 16 will be described. - Both screen transitions are the same in that the screen is switched to the main medical examination screen W2 or the doctor screen, or the patient view W3 screen or the patient screen. That is, in either case, the screen switching unit S1-B of the server S accepts the input for performing display switching from the client C and switches the screen.
- The former is used when displaying the main medical examination screen or the patient view of the selected patient while selecting the patient. That is, in order to switch to the display of “different patient”, the user needs to return to the basic screen W1, and perform the former screen transition.
- The latter is used to switch the main medical examination screen or the patient view for “the same patient”. In the latter case, the user does not need to return to the basic screen W1 to switch the screens, and the switch can be rapidly carried out with the operations of the operation screen regions W2A, W3A of each screen W2, W3.
- Therefore, the doctor makes a diagnosis while browsing the doctor screen W2, and at that moment, directly (without passing through the basic screen W1) transition to the patient screen W3 from the doctor screen W2 when indicating the necessary information to the patient. The reverse is also possible.
- As apparent from the doctor screen W2 shown in
FIG. 15 and the doctor screen W2 shown inFIG. 23 , the main body screen region W2B of the doctor screen W2 includes a fixeddisplay part 161 position fixedly displayed at the upper part of the main body screen region W2B. A multi-screen region (multi-window region) in which a plurality of position movably displayed screen regions (windows) are simultaneously displayed is formed at the region on the lower side of the fixeddisplay part 161 of the main body screen region W2B. - The fixed
display part 161 displays patient information (information of patient data table DB2) such as name of patient, date of birth, patient ID, and the like, and furthermore, is arranged with “edit patient information”button 161 a for displaying the patient information edit screen for editing the information of the patient and “reset arrangement”button 161 b for returning the arrangement (position, size) of a plurality of screen regions to an initial state. In the multi-screen region of the present embodiment, four screen regions (windows) of the basic test data screen region (basic test data window) 162, the OGTT data screen region (OGTT data window) 163, the prescription screen region (prescription window) 164, and the finding screen region (finding window) 165 are simultaneously displayed. - Each
screen region 162 to 165 is position adjustable within the multi-screen region of the doctor screen W2 by the operation of the mouse etc., and the size thereof is also adjustable. - Among the
screen regions 162 to 165, the basic test data screen region (screen region for displaying the related information on the patient) 162 and the OGTT data screen region (screen region for displaying the pathological condition information of the patient) 163 are particularly important to support the diagnosis by the doctor. The basic test data screenregion 162 shows the test result obtained by the actual test (basic test), and the OGTTdata screen region 163 shows the actual OGTT result and the pathological condition information or the result of the simulation analysis. - The basic
test screen region 162 is generated by the server S based on the information (test result) stored in the basic test result data table DB3 shown inFIG. 17( b). The server S searches the basic test result data table with the patient ID of the selected patient as the key, and generates the test result information on the most recent test date in the basictest screen region 162 as the testresult display part 162 a. - In the basic
test screen region 162, each test item name in the basic testresult display part 162 can be selected by mouse operation (double click etc.), and the time-series graph 162 b on the selected item is displayed at the position in the basic test screen region 162 (right side of testresult display part 162 a). If the target value is set for the selected test item, not only the test value Tst but also the target value Tr is displayed in the time-series graph 162 b. - The time-
series graph 162 b can be selected up to a maximum of four in the basictest screen region 162 of the doctor screen W2. Four time-series graphs 162 b are shown inFIG. 15 , and one time-series graph 162 b is shown inFIG. 23 . - The test result displayed in the test
result display part 162 a can be changed to a test result of a different test date. Thus, the basictest screen region 162 includes “another test date”button 162 c for selecting an arbitrary test date and displaying the test result of the relevant test date, “previous test date”button 162 d for displaying the test result of the previous test date, and “next test date”button 162 e for displaying the test result of the next test date. - The OGTT data screen region (screen region for displaying pathological condition information of the patient) 163 shown in
FIG. 15 is generated by the server S based on the information (test data and analysis result) stored in the OGTT data table DB4 shown inFIG. 17( c). The server S searches the OGTT data table DB4 with the patient ID of the selected patient as the key, acquires the test data (OGTT time-series data) and the analysis result (pathological condition information) on the most recent test date, and generates the time-series graph 163 a of the OGTT test data and theradar chart 163 b of the analysis result in theOGTT screen region 163. - A time-
series change 163 a-1 of the blood glucose level in the actual OGTT test result and a time-series change 163 a-2 of the insulin concentration in the actual OGTT test result are displayed in the time-series graph 163 a. - The
radar chart 163 b shows the result of performing the pathological condition analysis. The details of the process of performing pathological condition analysis from simulation based on the biological model and acquiring the pathological condition information (pathological condition feature information) will be described below. - In the above described simulation using the biological model, the parameter set configuring the biological model capable of outputting the reproduction value (pseudo-response information) simulating the actual OGTT test result (biological response information) is obtained through calculation. The system SS obtains the reproduction value (pseudo-response information) of the OGTT test result as the output value of the biological model applied with such parameter set (pseudo-response acquiring function of the system SS).
- The simulator/analysis server S2 obtains the pathological condition information (pathological condition feature information) indicating the feature of the pathological condition of the patient based on the generated biological model (parameter set thereof) (pathological condition feature information acquiring function of the system SS).
- In the present embodiment, P1: fasting blood glucose, P2: basic secretion, P3: additional secretion, P4: secretion sensitivity, P5: glucose regeneration suppression, P6: glucose disposal ability, and P7: processing sensitivity are adopted as indices of the pathological condition feature.
- Such indices are adopted as satisfactorily representing the features of the pathological condition, and in particular, biological functions that can be improved by treatment are adopted. The indices of the pathological condition feature are not limited to the above.
- Here, P1: fasting blood glucose is calculated from the blood glucose level BG(t=0) which is a variable of the biological model. P2: basic secretion is calculated from the fasting insulin I1(t=0) which is a variable of the biological model. P3: additional secretion is calculated from an integrated value of I1(t=). P4: secretion sensitivity is calculated from the sensitivity β with respect to glucose stimulation or the parameter of the biological model. P5: glucose regeneration suppression is calculated from the glucose release HGTP(t) which is a variable of the biological model. P6: glucose disposal ability is calculated from the net glucose SGO(t) and the blood glucose level BG(t) from the liver, which are variables of the biological model. P7: processing sensitivity is calculated from the insulin dependent glucose consumption rate Kp in the peripheral tissue per unit insulin or unit glucose, which is a parameter of the biological model.
- Therefore, since the biological model is configured by a mathematical model having parameters (include variables) indicating the characteristics of the biological organs, the parameter values of the biological model indicate values related to the pathological condition. Therefore, the pathological condition information (pathological condition feature information) indicating the features of the pathological condition can be calculated based on such parameters.
- The calculated pathological condition information is registered in the OGTT data table DB4 of the database as analysis result, and used to create a
radar chart 163 b. - In the
radar chart 163 b ofFIG. 15 , the values for every index of the pathological condition feature information are scored and displayed, so that good and bad of the value of each index having different units and numeral widths can be compared. - The doctor looks at the
radar chart 163 b to diagnose the pathological condition of the patient. For instance, if theradar chart 163 b shows that the glucose disposal ability and the processing sensitivity related to the glucose disposal ability at the peripherals are low, the doctor looking at the radar chart can easily determine that the treatment method that improves the glucose disposal ability at the peripherals is effective. - Furthermore, since the actual OGTT test result 163 a and the
pathological condition information 163 b are simultaneously displayed, the doctors can compare both displays and learn about the relation of the graph shape of the OGTT test result and the pathological condition. Therefore, an effective learning effect for understanding the pathological condition from the OGTT test result can be expected by building up experiences by actually using the system SS. - Furthermore, since the basic test data screen
region 162 and thepathological condition information 163 b are simultaneously displayed in the present embodiment, the doctor can also build up experience of understanding the pathological condition even in relation to the basic test result. - Thus, in the doctor screen W2, the
screen region 163 for displaying the pathological condition information of the patient and thescreen region 162 for displaying the related information (in particular, basic test information) related to the patient are simultaneously displayed, thereby supporting the doctor to make an accurate diagnosis based on great amount of information. The doctor can further build up experience since great amount of information are displayed. - Moreover, arbitrary values can be input instead of the actual test result (biological response information) in the input screen of the OGTT test result (biological response). The output of the test result reproduction value (pseudo-response information) on the arbitrary value and the pathological condition feature information can be obtained. Therefore, the doctor can input an arbitrary test result value (biological response information) and see what pathological condition is obtained in the relevant case. Thus, the system can be used for training purpose by inputting an appropriate test result even if the actual data of the patient are not provided, and checking what kind of output is obtained.
- That is, the present system SS can be used for training purpose for non-specialists or doctors with little experience to learn.
- A “pathological condition review/recommended treatment/term explanation” column (pathological condition review display part) 163 c is arranged in the OGTT
data screen region 163, wherein text explanation (pathological condition review) such as review of the pathological condition, recommended treatment, term explanation etc. is displayed. Since the “pathological condition review/recommended treatment/term explanation”column 163 c is arranged, the pathological condition feature information displayed on theradar chart 132 can be easily understood, and the doctor can more accurately understand the pathological condition. Information useful for determining the treatment method etc. is also obtained. - The pathological condition review text displayed on the pathological condition
review display part 163 c is registered in the database in advance, the pathological condition review text corresponding to the generated biological model (parameter thereof) is selected by the system, and the selected text is displayed on the pathological conditionreview display part 163 c. - In the OGTT
data screen region 163, a specialinstruction display part 163 d is also arranged, so that when there is a special instruction on the pathological condition information obtained by analysis, such special instruction is displayed on the specialinstruction display part 163. - The data displayed on the time-
series graph 163 a and theradar chart 163 b of the OGTTdata screen region 163 can be changed to those of a different test date. Thus, the basictest screen region 162 includes “another test date”button 163 e for selecting an arbitrary test date and displaying the test result of the relevant test date and the pathological condition information based on the relevant test result, “previous test date”button 163 f for displaying the test result etc. of the previous test date, and “next test date”button 163 g for displaying the test result etc. of the next test date. - An overlay display for displaying the data of different test dates in an overlapping manner is possible in the time-
series graph 163 a and theradar chart 163 b of the OGTTdata screen region 163. Thecheck box 163 h of the overlay display of the OGTTdata screen region 163 is checked, the “select date” or the date selecting button is selected, and the test date of the data desired to be displayed in an overlapping manner on the current time-series graph 163 a and theradar chart 163 b is selected, so that the time-series graph 163 a and theradar chart 163 b of both test dates are displayed in an overlapping manner. - Therefore, the doctor can simultaneously compare the OGTT data and the pathological condition information of different dates, and make a diagnosis based on temporal changes of the OGTT data and the pathological condition information.
- In the OGTT
data screen region 163, the OGTT test data and the analysis result (pathological condition information) may be displayed as it is as numerical information instead of being illustrated as the time-series graph 163 a and theradar 163 b. In the screens shown inFIGS. 15 and 23 , a display in which the OGTT test data and the analysis result (pathological condition information) are shown in a form of a diagram, and a display in numerical data can be switched by a tab form, wherein the numerical data of the OGTT test data and the analysis result (pathological condition information) can be displayed in the OGTTdata screen region 163 by selecting the “numerical data”tab 163 j. - As shown in
FIG. 23 , in the doctor screen W2, the prescription screen region (prescription window) 164 and the finding screen region (finding window) 165 are also displayed. - When the doctor understands the pathological condition, determines the treatment, and decides on the prescription content, the prescription content can be registered for every medical examination date in the
prescription screen region 164. The prescription content is registered for every medical examination date in the prescription data table DB6 shown inFIG. 17( e). - The pathological condition understood by the doctor can be registered in the
finding screen region 165 as finding of the doctor. The finding content is registered for every medical examination date in the finding data table DB7 shown inFIG. 17( f). - Since the findings and the prescription content of the doctor can be registered, the present system SS also has a function serving as an electronic carte, thereby enhancing convenience.
- Furthermore, since registration task of prescription, finding, or the like is possible in the prescription screen region (prescription window) 164 or the finding screen region (finding window) 165 simultaneously displayed with the
pathological condition information 163 b and the like on the doctor screen W2, high convenience is achieved also in this point. - The
prescription screen region 164 and thefinding screen region 165 are both registered in the data tables DB6, DB7, similar to the basic test data screenregion 162 and the OGTT data screen region. The prescription content or the finding content on another medical examination date can also be displayed. -
FIGS. 24 to 27 show the patient screen W3 in addition toFIG. 16 . - The main body screen region W3B of the patient screen W3 includes the fixed
display part 181 position fixedly displayed at the upper part of the main body screen region W3B. - The region on the lower side of the fixed
display part 181 of the main body screen region W3B is formed as a tabswitching screen region 182 capable of switching a plurality of screen regions by tab switching. - The fixed
display part 181 displays patient information (information of patient data table DB2) such as name of patient, date of birth, attending physician, and the like. In the fixeddisplay part 181 of the patient screen W3, as compared with the fixeddisplay part 161 of the doctor screen W2, information not necessarily required for the patient are omitted, for example, patient ID is not displayed, whereby information amount is reduced, and a simple and viewable display is obtained. The fixeddisplay part 181 of the patient screen W3 has larger characters, and thus is an easily viewable display. The fixeddisplay part 181 of the patient screen W3 is not arranged with thebuttons display part 161 of the doctor screen W, and thus is a simple and easily viewable display. - The tab
switching screen region 182 includes fourscreen switching tabs tab 182 a displays the basic test data screenregion 192, the “OGTT data”tab 182 b displays the OGTTdata screen region 193, the “prescription/finding”tab 182 c displays the prescription/finding screen region 194, and “past prescription list”tab 182 d displays the past prescriptionlist screen region 195. -
FIGS. 16 and 24 show the basic test data screenregion 192 of the patient screen W3. The basic test data screenregion 192 is generated from the basic test result data table DB3 with the patient ID as the key. - The basic test data screen
region 192 cannot change position and size, but is formed over substantially the entire tabswitching screen region 182, and is formed larger than the basic test data screen region 162 (size of initial state: seeFIGS. 2 and 3 ) of the doctor screen W2. - Similar to the basic test data screen
region 162 of the doctor screen W2, the test result information on the most recent test date is displayed as testresult display part 192 a on the basic test data screenregion 192 of the patient screen W3. The testresult display part 192 a is formed larger than the testresult display part 162 a of the doctor screen W2, and displays greater amount of information. Specifically, target values set for each test item are contained in the testresult display part 192 a of the patient screen W3. The target value is obtained by referencing the target value data table DB5 (seeFIG. 17( d)) with the patient ID as the key. - In the basic
test screen region 192, each test item name in the basic testresult display part 192 can be selected by mouse operation (double click etc.), and the time-series graph 192 b for the selected item is displayed at the position in the basic test data screen region 192 (right side of testresult display part 192 a). - Up to four time-
series graphs 192 b can be selected in the basic test data screenregion 192 of the patient screen W3. - The test result displayed in the test
result display part 192 a can be changed to a test result of a different test date. Thus, the basictest screen region 192 includes “another test date”button 192 c for selecting an arbitrary test date and displaying the test result of the relevant test date. The testresult display part 192 a is arranged with “display/not display comparison column”switching button 192 d for displaying the basic test data of another test date as a comparison column or not displaying the relevant display. - As described above,
other screen regions 193 to 195 are displayed when the basic test data screen region (test result screen) 192 is displayed in the patient screen W3. Therefore, the patient screen W3 in which the basic test data screenregion 192 of the patient screen W3 is selectively displayed is a test result screen for displaying the result information of a medical test of the patient without involving display of the pathological condition information. -
FIG. 24 shows the OGTTdata screen region 193 of the patient screen w3. The OGTTdata screen region 193 is generated based on the OGTT data table DB4 with the patient ID as the key. - The OGTT
data screen region 193 also can not change the position or the size, but is formed over substantially the entire tabswitching screen region 182, and is formed larger than the OGTTdata screen region 162 of the doctor screen W2. - In the OGTT
data screen region 193 of the patient screen W3 as well, the time-series graph 193 a of the OGTT test data and theradar chart 193 b of the analysis result (pathological condition information) can be displayed. Furthermore, in the OGTTdata screen region 193 of the patient screen W3, thenumerical data 193 c of the OGTT test data that could not be displayed unless switched with the tab is simultaneously displayed. The numerical data could not be displayed unless switched with the tab in the doctor screen W2, but is displayed with the graph in the patient screen W2. - Furthermore, in the OGTT
data screen region 193 of the patient screen W3, information that are not directly necessary for the patient such as “pathological condition review/recommended treatment/term explanation”column 163 c and thespecial instruction 163 d in the OGTTdata screen region 162 of the doctor screen W2 are not displayed. - In the OGTT
data screen region 193 of the patient screen W3,information 193 a to 193 c on a plurality of test dates can be simultaneously displayed, and the patient can simultaneously compare information on a plurality of test dates. - Therefore, in the patient screen W3, information not necessary for the patient out of the information displayed in the doctor screen W2 are omitted, and information useful for the patient are displayed in detail in a large space.
- The information of the basic test data screen
region 192 and the OGTTdata screen region 193 are information of different tests for the user, and the necessity to simultaneously view them is low, and thus the convenience of the patient does not lower even if thescreen regions -
FIG. 26 shows the prescription/finding screen region 194 of the patient screen W3. The prescription/finding screen region 194 is generated from the prescription data table DB6 and the finding data table DB7 with the patient ID as the key, and the collection of the display content of theprescription screen region 164 and the display content of thefinding screen region 165 of the doctor screen W2 is displayed. - Furthermore, if the prescription/
finding screen region 194 is selectively displayed, “G” selectingpart 107 is displayed as the image selecting part on the operation screen region W3A. Theimage selecting part 107 is provided for the user such as the doctor to switch and select theimage 194 g displayed on the prescription/finding screen region 194. -
FIG. 27 shows the “past prescription list”screen region 195 of the patient screen W3. The “past prescription list”screen region 195 is generated from the prescription data table DB6 with the patient ID as the key, and a list of medicines prescribed in a predetermined period in the past is displayed. - Each
screen region button 106. As opposed to eachscreen region 162 to 165 of the doctor screen W2, since switching of the display content is barely performed in eachscreen region - The present invention is not limited to the above embodiment, and various modifications may be made. For instance, the display format of the pathological condition information is not limited to a radar chart and may be in other display formats. The type and number of pathological condition information to be displayed are not particularly limited, and three indices of hepatic glucose metabolism ability, insulin secretion ability, and peripheral insulin sensitivity may be displayed as pathological condition information.
- The data table is shown in plurals in
FIG. 17 , but such data tables may be integrated into one table. - In the above embodiment, the data of the most recent test date of the patient is displayed when the screen is switched between the doctor screen W2 and the patient screen W3, but in the doctor screen W2 or the patient screen W3, when switched to another screen W2, W3 after selecting another test date as the test date, the data of another test date may still be continuously displayed in the switched screen W2, W3.
Claims (20)
1. A medical diagnosis support computer system for supporting diagnosis of a patient by a doctor, the system comprising:
a display device; and
a controller in communication with the display device, the controller comprising a processor configured to build a biological model representing biological functions of the patient on a computer, generate pathological condition information of the patient based on the biological model, display a doctor screen for the doctor and a patient screen for the patient in a switchable manner on the display device, and accept an input for switching the display between the doctor screen and the patient screen; wherein
the doctor screen is configured to simultaneously display a screen region for displaying the pathological condition information of the patient and a screen region for displaying one or more related information related to the patient; and
the patient screen is configured to selectively display a display content between the pathological condition information of the patient and one or more related information related to the patient.
2. The medical diagnosis support computer system according to claim 1 , wherein the related information comprises result information of a medical test of the patient.
3. The medical diagnosis support computer system according to claim 1 , wherein the related information comprises finding information which is a result of a medical examination by the doctor.
4. The medical diagnosis support computer system according to claim 1 , wherein the related information comprises prescription information indicating administration state of medicines to the patient.
5. The medical diagnosis support computer system according to claim 1 , wherein the screen region for selectively displaying the pathological condition information or the related information in the patient screen is larger than the screen region for displaying the pathological condition information and the screen region for displaying the related information in the doctor screen.
6. The medical diagnosis support computer system according to claim 1 , wherein the pathological condition information comprises pathological condition information of diabetes obtained through simulation analysis using the biological model.
7. The medical diagnosis support computer system according to claim 1 , wherein display of the pathological condition information comprises a radar chart showing pathological condition information obtained through simulation analysis using the biological model.
8. The medical diagnosis support computer system according to claim 1 , wherein
the doctor screen displays a doctor/patient switch receiving unit for receiving display switching to the patient screen;
the patient screen displays a patient/doctor switch receiving unit for receiving display switching to the doctor screen; and
the processor switches the screen on the same patient when receiving an input for switching the display.
9. The medical diagnosis support computer system according to claim 1 , wherein the processor further displays a basic screen on the display device for displaying a basic/doctor switch receiving unit for receiving display switching to the doctor screen and a basic/patient switch receiving unit for receiving display switching to the patient screen.
10. A computer program product, comprising:
a computer readable medium; and
instructions, on the computer readable medium, adapted to enable a general purpose computer to perform operations, comprising:
building a biological model representing biological functions of the patient on a computer;
generating pathological condition information of the patient based on the biological model;
displaying a doctor screen for the doctor and a patient screen for the patient in a switchable manner on the display device; and
receiving an input for switching the display between the doctor screen and the patient screen; wherein
the doctor screen is configured to simultaneously display a screen region for displaying the pathological condition information of the patient and a screen region for displaying one or more related information related to the patient; and
the patient screen is configured to selectively display a display content between the pathological condition information of the patient and one or more related information related to the patient.
11. A medical diagnosis support computer system for supporting diagnosis of a patient by a doctor, the system comprising:
a display device; and
a controller in communication with the display device, the controller comprising a processor configured to build a biological model representing biological functions of the patient on a computer, generate pathological condition information of the patient based on the biological model, display a doctor screen for the doctor and a patient screen for the patient in a switchable manner on the display device, and receive an input for switching the display between the doctor screen and the patient screen; wherein
the doctor screen is configured to simultaneously display a screen region for displaying the pathological condition information of the patient and a screen region for displaying one or more related information related to the patient; and
the patient screen comprises a test result screen for displaying result information of a medical test of the patient without display of the pathological condition information.
12. The medical diagnosis support computer system according to claim 11 , wherein the related information comprises result information of a medical test of the patient.
13. The medical diagnosis support computer system according to claim 11 , wherein the related information comprises finding information which is a result of a medical examination by the doctor.
14. The medical diagnosis support computer system according to claim 11 , wherein the related information comprises prescription information indicating administration state of medicines to the patient.
15. The medical diagnosis support computer system according to claim 11 , wherein the screen region of the test result screen in the patient screen is larger than the screen region for displaying the related information in the doctor screen.
16. The medical diagnosis support computer system according to claim 11 , wherein the pathological condition information comprises pathological condition information of diabetes obtained through simulation analysis using the biological model.
17. The medical diagnosis support computer system according to claim 11 , wherein display of the pathological condition information comprises a radar chart showing pathological condition information obtained through simulation analysis using the biological model.
18. A computer program product, comprising:
a computer readable medium; and
instructions, on the computer readable medium, adapted to enable a general purpose computer to perform operations, comprising:
building a biological model representing biological functions of the patient on a computer;
generating pathological condition information of the patient based on the biological model;
displaying a doctor screen for the doctor and a patient screen for the patient in a switchable manner on the display device; and
receiving an input for switching the display between the doctor screen and the patient screen; wherein
the doctor screen is configured to simultaneously display a screen region for displaying the pathological condition information of the patient and a screen region for displaying one or more related information related to the patient; and
the patient screen comprises a test result screen for displaying result information of a medical test of the patient without display of the pathological condition information.
19. A server computer for displaying a screen for supporting a diagnosis of a patient by a doctor on a display device of a terminal device connected by way of a network, the server computer comprising:
a controller in communication with the terminal device, the controller comprising a processor configured to display a doctor screen for the doctor and a patient screen for the patient in a switchable manner on the display device of the terminal device, and switch the display between the doctor screen and the patient screen when an input for switching between the doctor screen and the patient screen is made at the terminal device; wherein
the doctor screen is configured to simultaneously display a screen region for displaying pathological condition information of the patient generated based on a biological model built on a computer to represent biological functions of the patient and a screen region for displaying one or more related information related to the patient; and
the patient screen is configured to selectively display a display content between the pathological condition information of the patient and one or more related information related to the patient.
20. A server computer for displaying a screen for supporting a diagnosis of a patient by a doctor on a display device of a terminal device connected by way of a network, the server computer comprising:
a controller in communication with the terminal device, the controller comprising a processor configured to display a doctor screen for the doctor and a patient screen for the patient in a switchable manner on the display device of the terminal device, and switch the display between the doctor screen and the patient screen when an input for switching between the doctor screen and the patient screen is made at the terminal device; wherein
the doctor screen is configured to simultaneously display a screen region for displaying pathological condition information of the patient generated based on a biological model built on a computer to represent biological functions of the patient and a screen region for displaying one or more related information related to the patient; and
the patient screen includes a test result screen for displaying result information of a medical test of the patient without display of the pathological condition information.
Applications Claiming Priority (2)
| Application Number | Priority Date | Filing Date | Title |
|---|---|---|---|
| JP2007136412A JP2008293171A (en) | 2007-05-23 | 2007-05-23 | Medical diagnosis support computer system, computer program, and server computer |
| JP2007-136412 | 2007-05-23 |
Publications (1)
| Publication Number | Publication Date |
|---|---|
| US20090177453A1 true US20090177453A1 (en) | 2009-07-09 |
Family
ID=39745682
Family Applications (1)
| Application Number | Title | Priority Date | Filing Date |
|---|---|---|---|
| US12/152,593 Abandoned US20090177453A1 (en) | 2007-05-23 | 2008-05-15 | Medical diagnosis support computer system, computer program, and server computer |
Country Status (4)
| Country | Link |
|---|---|
| US (1) | US20090177453A1 (en) |
| EP (1) | EP1995680A3 (en) |
| JP (1) | JP2008293171A (en) |
| CN (1) | CN101310686A (en) |
Cited By (12)
| Publication number | Priority date | Publication date | Assignee | Title |
|---|---|---|---|---|
| US20130282391A1 (en) * | 2012-04-20 | 2013-10-24 | Cerner Innovation, Inc. | Patient management of referral orders |
| USD732565S1 (en) | 2012-06-05 | 2015-06-23 | P&W Solutions Co., Ltd. | Display screen with graphical user interface |
| CN105342555A (en) * | 2015-09-09 | 2016-02-24 | 曹宏 | Comprehensive diabetic patient assessment method |
| CN106778039A (en) * | 2017-01-20 | 2017-05-31 | 深圳第医学健康管理有限公司 | Diagnosis and treatment accessory system and method |
| US20170185744A1 (en) * | 2015-12-25 | 2017-06-29 | Fujifilm Corporation | Medical support apparatus and system, and non-transitory computer readable medium |
| US9912762B2 (en) | 2011-10-10 | 2018-03-06 | Tencent Technology (Shenzhen) Company Limited | Method for displaying splash screen content, terminal, content server, and system therefor |
| CN109637610A (en) * | 2018-11-19 | 2019-04-16 | 深圳市理邦精密仪器股份有限公司 | Configuration method, terminal device and the medium of electrocardio report |
| CN109935336A (en) * | 2019-01-15 | 2019-06-25 | 北京思普科软件股份有限公司 | A kind of the intelligent auxiliary diagnosis method and diagnostic system of children's division of respiratory disease disease |
| USD917552S1 (en) * | 2017-07-28 | 2021-04-27 | Verisign, Inc. | Display screen or portion thereof with a sequential graphical user interface |
| USD948534S1 (en) | 2017-07-28 | 2022-04-12 | Verisign, Inc. | Display screen or portion thereof with a sequential graphical user interface of a mobile device |
| US11482321B2 (en) | 2012-04-20 | 2022-10-25 | Cerner Innovation, Inc. | Patient portal management of referral orders |
| US11621940B2 (en) | 2017-01-21 | 2023-04-04 | Verisign, Inc. | Systems, devices, and methods for generating a domain name using a user in interface |
Families Citing this family (13)
| Publication number | Priority date | Publication date | Assignee | Title |
|---|---|---|---|---|
| CN101464928B (en) * | 2008-12-30 | 2010-06-02 | 深圳市蓝韵实业有限公司 | Auxiliary reminding method for ultrasonic diagnosis report |
| JP2013503874A (en) * | 2009-09-01 | 2013-02-04 | ユニバーシティ オブ ヴァージニア パテント ファウンデーション | System, method and computer program product for regulation of insulin release (AID) in diabetes using a nominal open loop profile |
| JP5394881B2 (en) * | 2009-10-09 | 2014-01-22 | 徳子 佐藤 | Medical information processing method |
| RU2628058C2 (en) * | 2011-01-07 | 2017-08-14 | Конинклейке Филипс Н.В. | Integrated access to multiple clinical data analysis modules and integration with these modules |
| US10438700B2 (en) | 2012-08-03 | 2019-10-08 | University Of Virginia Patent Foundation | Computer simulation for testing and monitoring of treatment strategies for stress hyperglycemia |
| NZ728740A (en) * | 2014-08-01 | 2022-05-27 | Resmed Inc | Patient management system |
| CN104473745B (en) * | 2014-12-28 | 2016-07-06 | 戚敬虎 | The special inspection table of hepatopath |
| CN104958077A (en) * | 2015-07-24 | 2015-10-07 | 珠海福尼亚医疗设备有限公司 | Intelligent control close-loop artificial pancreas system |
| JP2017162122A (en) * | 2016-03-08 | 2017-09-14 | 富士通株式会社 | Program, device, and method for displaying medical records |
| CN106963125B (en) * | 2017-03-29 | 2019-06-11 | 杨红梅 | A kind of medical Working table used convenient for physician visits |
| CN106951724B (en) * | 2017-05-09 | 2019-03-19 | 山东省千佛山医院 | Suitable for liver cancer and the pathological diagnosis report preparing system and method for digestive system cancer |
| US20200027530A1 (en) * | 2018-07-18 | 2020-01-23 | International Business Machines Corporation | Simulating Patients for Developing Artificial Intelligence Based Medical Solutions |
| CN114846559A (en) | 2019-12-19 | 2022-08-02 | 株式会社神龙 | Simulation system and program |
Citations (7)
| Publication number | Priority date | Publication date | Assignee | Title |
|---|---|---|---|---|
| US138922A (en) * | 1873-05-13 | Improvement in type-setting machines | ||
| US5913197A (en) * | 1995-12-27 | 1999-06-15 | Kameda Medical Information Laboratory | Medical care schedule and record aiding system and method |
| US20050234311A1 (en) * | 2004-03-17 | 2005-10-20 | Yasuhiro Kouchi | Diagnostic support system for diabetes and storage medium |
| US20050256690A1 (en) * | 2004-05-11 | 2005-11-17 | Sysmex Corporation | Simulation system for simulating material concentration in a living body and storage medium |
| US20060026035A1 (en) * | 2004-07-28 | 2006-02-02 | William Younkes | Computer aided interactive medical management information and control system and method |
| US20060265136A1 (en) * | 2005-05-12 | 2006-11-23 | Sysmex Corporation | Treatment effect prediction system, a treatment effect prediction method, and a computer program product thereof |
| US20070218519A1 (en) * | 2005-10-11 | 2007-09-20 | Tethys Bioscience, Inc. | Diabetes-associated markers and methods of use thereof |
Family Cites Families (4)
| Publication number | Priority date | Publication date | Assignee | Title |
|---|---|---|---|---|
| JP3567520B2 (en) * | 1995-03-30 | 2004-09-22 | 株式会社日立製作所 | Medical information system |
| FI112545B (en) | 1997-05-30 | 2003-12-15 | Nokia Corp | Method and system for predicting the level of a glycosylated hemoglobin component in a patient's blood |
| JPH11296598A (en) | 1998-04-07 | 1999-10-29 | Seizaburo Arita | System and method for predicting blood-sugar level and record medium where same method is recorded |
| JP4109084B2 (en) * | 2002-11-05 | 2008-06-25 | オリンパス株式会社 | Medical information system and medical information management method |
-
2007
- 2007-05-23 JP JP2007136412A patent/JP2008293171A/en not_active Ceased
-
2008
- 2008-05-15 US US12/152,593 patent/US20090177453A1/en not_active Abandoned
- 2008-05-19 CN CNA2008100981454A patent/CN101310686A/en active Pending
- 2008-05-21 EP EP08009364A patent/EP1995680A3/en not_active Withdrawn
Patent Citations (7)
| Publication number | Priority date | Publication date | Assignee | Title |
|---|---|---|---|---|
| US138922A (en) * | 1873-05-13 | Improvement in type-setting machines | ||
| US5913197A (en) * | 1995-12-27 | 1999-06-15 | Kameda Medical Information Laboratory | Medical care schedule and record aiding system and method |
| US20050234311A1 (en) * | 2004-03-17 | 2005-10-20 | Yasuhiro Kouchi | Diagnostic support system for diabetes and storage medium |
| US20050256690A1 (en) * | 2004-05-11 | 2005-11-17 | Sysmex Corporation | Simulation system for simulating material concentration in a living body and storage medium |
| US20060026035A1 (en) * | 2004-07-28 | 2006-02-02 | William Younkes | Computer aided interactive medical management information and control system and method |
| US20060265136A1 (en) * | 2005-05-12 | 2006-11-23 | Sysmex Corporation | Treatment effect prediction system, a treatment effect prediction method, and a computer program product thereof |
| US20070218519A1 (en) * | 2005-10-11 | 2007-09-20 | Tethys Bioscience, Inc. | Diabetes-associated markers and methods of use thereof |
Cited By (21)
| Publication number | Priority date | Publication date | Assignee | Title |
|---|---|---|---|---|
| US9912762B2 (en) | 2011-10-10 | 2018-03-06 | Tencent Technology (Shenzhen) Company Limited | Method for displaying splash screen content, terminal, content server, and system therefor |
| US20130282391A1 (en) * | 2012-04-20 | 2013-10-24 | Cerner Innovation, Inc. | Patient management of referral orders |
| US11482321B2 (en) | 2012-04-20 | 2022-10-25 | Cerner Innovation, Inc. | Patient portal management of referral orders |
| USD769281S1 (en) | 2012-06-05 | 2016-10-18 | P&W Solutions Co., Ltd. | Display screen with graphical user interface |
| USD733178S1 (en) | 2012-06-05 | 2015-06-30 | P&W Solutions Co., Ltd. | Display screen with graphical user interface |
| USD733736S1 (en) | 2012-06-05 | 2015-07-07 | P&W Solutions Co., Ltd. | Display screen with graphical user interface |
| USD733737S1 (en) | 2012-06-05 | 2015-07-07 | P&W Solutions Co., Ltd. | Display screen with graphical user interface |
| USD735231S1 (en) | 2012-06-05 | 2015-07-28 | P&W Solutions Co., Ltd. | Display screen with graphical user interface |
| USD737840S1 (en) | 2012-06-05 | 2015-09-01 | P & W Solutions Co., Ltd. | Display screen with graphical user interface |
| USD733177S1 (en) | 2012-06-05 | 2015-06-30 | P&W Solutions Co., Ltd. | Display screen with graphical user interface |
| USD732565S1 (en) | 2012-06-05 | 2015-06-23 | P&W Solutions Co., Ltd. | Display screen with graphical user interface |
| USD733738S1 (en) | 2012-06-05 | 2015-07-07 | P&W Solutions Co., Ltd. | Display screen with graphical user interface |
| CN105342555A (en) * | 2015-09-09 | 2016-02-24 | 曹宏 | Comprehensive diabetic patient assessment method |
| US20170185744A1 (en) * | 2015-12-25 | 2017-06-29 | Fujifilm Corporation | Medical support apparatus and system, and non-transitory computer readable medium |
| CN106778039A (en) * | 2017-01-20 | 2017-05-31 | 深圳第医学健康管理有限公司 | Diagnosis and treatment accessory system and method |
| US11621940B2 (en) | 2017-01-21 | 2023-04-04 | Verisign, Inc. | Systems, devices, and methods for generating a domain name using a user in interface |
| USD917552S1 (en) * | 2017-07-28 | 2021-04-27 | Verisign, Inc. | Display screen or portion thereof with a sequential graphical user interface |
| USD948534S1 (en) | 2017-07-28 | 2022-04-12 | Verisign, Inc. | Display screen or portion thereof with a sequential graphical user interface of a mobile device |
| USD956072S1 (en) | 2017-07-28 | 2022-06-28 | Verisign, Inc. | Display screen or portion thereof with a sequential graphical user interface |
| CN109637610A (en) * | 2018-11-19 | 2019-04-16 | 深圳市理邦精密仪器股份有限公司 | Configuration method, terminal device and the medium of electrocardio report |
| CN109935336A (en) * | 2019-01-15 | 2019-06-25 | 北京思普科软件股份有限公司 | A kind of the intelligent auxiliary diagnosis method and diagnostic system of children's division of respiratory disease disease |
Also Published As
| Publication number | Publication date |
|---|---|
| JP2008293171A (en) | 2008-12-04 |
| EP1995680A3 (en) | 2011-01-19 |
| CN101310686A (en) | 2008-11-26 |
| EP1995680A2 (en) | 2008-11-26 |
Similar Documents
| Publication | Publication Date | Title |
|---|---|---|
| US20090177453A1 (en) | Medical diagnosis support computer system, computer program, and server computer | |
| US10290070B2 (en) | System and method for integrating data with guidelines to generate displays containing the guidelines and data | |
| US9081879B2 (en) | Matrix interface for medical diagnostic and treatment advice system and method | |
| US8793144B2 (en) | Treatment effect prediction system, a treatment effect prediction method, and a computer program product thereof | |
| US10067627B2 (en) | Health forecaster | |
| US20070118347A1 (en) | Medical simulation system and computer program product | |
| JP6901146B2 (en) | Health prediction device, health prediction method, and program | |
| Hidalgo et al. | glUCModel: A monitoring and modeling system for chronic diseases applied to diabetes | |
| Plougmann et al. | DiasNet—a diabetes advisory system for communication and education via the internet | |
| US20110270123A1 (en) | Visually directed human-computer interaction for medical applications | |
| US20020035486A1 (en) | Computerized clinical questionnaire with dynamically presented questions | |
| JP2007317196A (en) | System and method for providing individualized disease management | |
| US8694300B2 (en) | Individualized ranking of risk of health outcomes | |
| JP2004534975A5 (en) | ||
| JP4287212B2 (en) | Health guidance support system and media recording its software | |
| US20050060199A1 (en) | System and method for managing diseases according to standard protocols and linking patients to medication samples and related benefits | |
| JP7238705B2 (en) | Medical care support method, medical care support system, learning model generation method, and medical care support program | |
| Quaglini et al. | A computerised guideline for pressure ulcer prevention | |
| US9202009B2 (en) | Diagnostic support apparatus for diabetes and computer program product | |
| JP4298255B2 (en) | Sheet type inspection result display method and apparatus | |
| Lehmann | Computers in diabetes' 96 | |
| Engle et al. | Glucometrics: Where Are We Now? | |
| BOLBOACĂ et al. | SQL by Example. 2. PHP and MySQL Web Application based on Tanner-Whitehouse Standard | |
| US20230012051A1 (en) | Patient information presentation method and electronic device | |
| Carr et al. | Design & Implementation of an Automated Questionnaire |
Legal Events
| Date | Code | Title | Description |
|---|---|---|---|
| AS | Assignment |
Owner name: HEWLETT-PACKARD DEVELOPMENT COMPANY, L.P., TEXAS Free format text: ASSIGNMENT OF ASSIGNORS INTEREST;ASSIGNOR:IYENGAR, RANGANATH G.;REEL/FRAME:021007/0446 Effective date: 20080421 |
|
| AS | Assignment |
Owner name: SYSMEX CORPORATION, JAPAN Free format text: ASSIGNMENT OF ASSIGNORS INTEREST;ASSIGNORS:KOUCHI, YASUHIRO;SAITOU, TAKEO;SEIKE, MASAYOSHI;REEL/FRAME:021003/0202 Effective date: 20080508 |
|
| STCB | Information on status: application discontinuation |
Free format text: ABANDONED -- FAILURE TO RESPOND TO AN OFFICE ACTION |