EP0660211A2 - Methode zur steuerung eines Herstellungsprozesses - Google Patents
Methode zur steuerung eines Herstellungsprozesses Download PDFInfo
- Publication number
- EP0660211A2 EP0660211A2 EP94420336A EP94420336A EP0660211A2 EP 0660211 A2 EP0660211 A2 EP 0660211A2 EP 94420336 A EP94420336 A EP 94420336A EP 94420336 A EP94420336 A EP 94420336A EP 0660211 A2 EP0660211 A2 EP 0660211A2
- Authority
- EP
- European Patent Office
- Prior art keywords
- variable
- variables
- surrogate
- value
- intermediate variable
- Prior art date
- Legal status (The legal status is an assumption and is not a legal conclusion. Google has not performed a legal analysis and makes no representation as to the accuracy of the status listed.)
- Withdrawn
Links
Images


Classifications
-
- G—PHYSICS
- G05—CONTROLLING; REGULATING
- G05B—CONTROL OR REGULATING SYSTEMS IN GENERAL; FUNCTIONAL ELEMENTS OF SUCH SYSTEMS; MONITORING OR TESTING ARRANGEMENTS FOR SUCH SYSTEMS OR ELEMENTS
- G05B21/00—Systems involving sampling of the variable controlled
- G05B21/02—Systems involving sampling of the variable controlled electric
Definitions
- the invention relates to manufacturing process control, and more particularly to methods of manufacturing process control employing multivariate quality control techniques.
- SPC statistical process control
- single variable (univariate) control charts that record the values of process and/or product variables and indicate when a given process or product variable is outside some predetermined limit. This approach however is not practical when the number of process variables becomes very large (e.g. greater than 20), or when the process variable interact, such as in a chemical manufacturing process.
- Techniques for monitoring a process having a large number of process variables or where the process variables interact are known as multivariate quality control techniques.
- Applications of multivariate quality control are generally aimed at detecting two major sources of process and/or product variability. They are: (1) sensor inaccuracies or failures; and (2) raw material and/or manufacturing process changes that result in shifts in the dynamics that are driving the process.
- PCA Principal Component Analysis
- Partial Least Squares Another multivariate technique called Partial Least Squares (PLS) is employed when both process and product data are used to control the process. See Stone, M. and Brooks, R. J. (1990). "Continuum Regression: Cross-validated Sequentially Constructed Prediction Embracing Ordinary Least Squares, Partial Least Squares and Principal Components Regression", Journal of the Royal Statistical Society B , 52 , 237-269.
- a manufacturing process is controlled by the steps of: collecting data representative of a plurality of process and /or product variables during the operation of the process; using multivariate analysis, generating a surrogate variable having a value representative of whether or not the process is in control, the surrogate variable being a function of a plurality of intermediate variables, each of the intermediate variables being a weighted function of the process or product variables; when the value of the surrogate variable indicates that the process is out of a predetermined limit, determining which of the intermediate variables primarily contributed to the value of the surrogate variable; for the intermediate variable determined in the previous step, identifying which of the process variables primarily contributed to the value of the determined intermediate variable; and modifying the process to change the process variable identified in the previous step to bring the process into the predetermined limit.
- n observations that are representative of the behavior of the process and that will be used as the basis (a training set or historical reference distribution) for an SPC model.
- This model is used to monitor future observations, as well as to detect special causes in the original n observations.
- process variables such as temperature, pressures, flows, etc.
- product characteristics such as grain size, photographic properties, hardness, etc.
- product variables such as grain size, photographic properties, hardness, etc.
- product variables such as grain size, photographic properties, hardness, etc.
- product characteristics such as grain size, photographic properties, hardness, etc.
- q product variables denoted by the (row) q -vector y i for the same observation.
- the entire collection of n observations is denoted by the n x p matrix X and the n x q matrix Y .
- PCA Principal Components Analysis
- T ' T L , where L is a diagonal matrix of the ordered eigenvalues of X ' X .
- D is much smaller than rank( X ), in which case T can be used as a lower-dimensional approximation to X , and then considerable time savings are achieved by working with T rather than with X .
- T is actually an orthogonal projection of X onto P ).
- the values of the intermediate variables indicate where in each dimension (or direction through the data X ) each point lies.
- T 2 i is a surrogate for observation i as: where t id is the d th intermediate variable for the i th observation and ⁇ d is the standard deviation of the d th intermediate variable across all the observations.
- T 2 are the individual terms (t id )2/( ⁇ d )2
- T 2 is a single number which can be used to determine if the process is out-of-control for a given observation.
- PCA can be performed by many different statistical software packages and by many linear algebra packages as well. With the speed of today's computers, even relatively large data sets can be handled in a short amount of time.
- PCA-derived intermediate variables are the best D -dimensional representation of X in a least-squares sense. However, the relationship(s) between X and Y are not captured by PCA.
- the intermediate variables may focus, to some extent, on information that isn't important to the control of the process. In these instances, it is desirable to de-emphasize process variables that don't impact Y .
- PLS uses a stepwise optimality criterion.
- the residual matrices E and F are used in place of X and Y in the determination of the second (and subsequent) intermediate variables of P . Therefore, PLS determines linear combinations of X (and Y ) that have maximal squared covariance in sequentially orthogonal subspaces of X .
- D For PLS, the most common way to choose D is cross-validation. The general idea is to set aside a subset of the data, fit the model using the remaining data, and then predict the subset of data omitted. This is continued with other subsets being omitted, until each observation has been excluded exactly once. The number of intermediate variables at which the sum of the squared prediction errors is smallest is the value chosen for D .
- the contributions are the product of the loading times the data value and so the contributions may be large because either the loading p jd is large or the data value x ij is large (in terms of deviations from the mean), or a combination of both. Techniques based upon interpretation of the largest loadings, would miss the case where the loading was small or moderate and the data value was a huge deviation from the center.
- T 2 analogously to PCA.
- Formula (3) can be used where the t id are the PLS scores for the X-block and ⁇ d is the standard deviation of the PLS scores for the X-block.
- a strategy for PCA or PLS is as follows - examine the T 2 value. If it is greater than the control limit, then conclude that there was something unusual about the observation; otherwise conclude that the observation was not unusual. If T 2 was greater than the control limit, then continue by computing the contribution plot for T 2. The contribution plot for T2 will indicate which of the intermediate variables contributed to the out of limit value of T2. Next, compute the contribution to the largest intermediate variables for the intermediate variables indicated by T 2 and this will indicate which of the process variables was unusual for this observation. Finally, the process is adjusted to change the values of the indicated process or product variables to bring the process under control. In a batch process, this may mean that the batch must be aborted, and the process started over again.
- This discussion of contribution applies to a single observation in the data, but we can also apply the ideas to a set S of observations.
- This set may consist of a cluster of observations seen on a scatter plot of intermediate variable values, or it may be a sequence of observations that seem unusual in a time-sequence plot of the intermediate variable values. For example, we may see the values in time sequence drift up or down, or we may see a step-function change in the values. We would want to investigate the reasons for the clustering on a scatter plot or the reasons for the drift or step-function change in time-sequence.
- the new vector x S can be used to compute a new intermediate variable or determine the contributions to the intermediate variable.
- weights chosen should estimate a slope in the original data.
- a set of weights that can be used to estimate a slope are the orthogonal polynomial coefficients for a linear polynomial (which are simply equally spaced values centered around zero). For example, if we had 10 points drifting up, the weights w i would be (in sequence) k [-1 -7/9 -5/9 -3/9 -1/9 1/9 3/9 5/9 7/9 1], where k is any constant and quite simply can be set to 1. Similarly if one detected a quadratic trend, the second order orthogonal polynomial coefficients could be used. Clearly, the selection of w i can be quite problem specific. The ones presented above have been found to be very useful in our applications.
- An alternative investigation strategy to the one mentioned earlier is to look for clusters in scatter plots of scores and trends or level shifts in time sequence plots of the scores. Often, clusters, trends or level shifts don't show up clearly in T 2 but can appear more prominently in sequence ordered plots of the scores.
- the two strategies are complimentary, and both should be followed when doing an investigation of the data.
- the residuals can be thought of as a second surrogate variable, or the unexplained variability in the original data after the PCA or PLS model has explained D intermediate variables.
- a large residual is a flag that something has happened in this batch that our model hasn't captured.
- a large residual may occur due to any of a number of reasons: data collection error, process disturbance that affected only a small percentage of the batches (and so did not show up in the D intermediate variables chosen for the model), or if the large residual occurs in a new batch (after the model has been fixed) it may represent a new process disturbance not seen in the data used to build the model.
- the algorithm actually provides residual matrices (one for the X-block and one for the Y-block) after the last dimension is computed.
- a single statistic for either the X-block or the Y-block could be computed as simply the sum of squares of the residual vector for observation i .
- An observation could have a large residual statistic in either X-block or the Y-block or both, and the contribution plots will indicate which of the variables is not modeled well. If there is more than one variable in the Y-block, then the contribution plot indicates which of the several responses was not well-predicted.
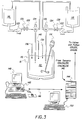
- the data used in the examples throughout this section is taken from an emulsion manufacturing process.
- the process is shown schematically in Figure 3, where a photographic emulsion is prepared in a kettle 110.
- the kettle 110 is provided with a heating jacket 111, and the contents of the kettle are stirred by a stirring device 114.
- Silver nitrate solution from a source 116 and a salt solution from a source 118 are delivered through a silver pump 120 and a salt pump 122 through computer controlled valves 124 and 126 respectively.
- the flow rate and pressure of the silver solution are monitored by flow rate and pressure sensor 128 and flow sensor 130 respectively.
- the flow rate and pressure of th salt solution is monitored by flow rate and pressure sensors 132 and 134 respectively.
- the temperature, sliver concentration (vAg) and pH of the contents 112 of the kettle 110 are monitored by temperature, vAg, and PH sensors 136, 138, and 140 respectively.
- the output from all of the sensors 128-140 are supplied to a diagnostic computer 142 and a process control computer 122. Diagnostic Computer 142 and Process Control Computer 144 communicate via a data link 146.
- An operator control station including a display monitor 148 and an operator control panel 150 is connected to the Diagnostic Computer 142.
- a similar control station is provided for Process Control Computer 144.
- a batch of photographic emulsion is manufactured in the following steps. First the kettle 110 is prepared by adding a measured amount of gelatin and water and other chemical additives. Next, the process control computer 144 commands the heater 111 to heat the contents of the kettle 110 to a desired operating temperature while operating the stirring device 114. When the desired temperature is achieved, the process control computer starts the silver and salt pumps 120 and 122 and sets the valves 124 and 126 into a recycle position so that the silver and salt solutions recycle from their respective sources through valves 124 and 126 and back to their respective sources.
- the process control computer commands the diagnostic computer to begin recording data from the sensors 128-140. After a predetermined interval of time, the process control computer switches valves 124 and 126 to deliver the silver and salt solutions from the respective sources to the kettle 110. As the silver and salt solutions are added to the kettle 110, the diagnostic computer 142, at certain predetermined time intervals, e.g. 1 minute, 10 minutes, 20 minutes, and end of batch calculates the values of the surrogate variables and sends the values to the process control computer 144. The process control computer 144 monitors the values of the surrogate variables and detects when the surrogate variables are out of limits.
- the diagnostic computer 142 at certain predetermined time intervals, e.g. 1 minute, 10 minutes, 20 minutes, and end of batch calculates the values of the surrogate variables and sends the values to the process control computer 144.
- the process control computer 144 monitors the values of the surrogate variables and detects when the surrogate variables are out of limits.
- the diagnostic computer is commanded by the process control computer to calculate the contributions by the intermediate variables to the out of limit surrogate variable.
- the intermediate variables with the largest contributions are identified and the contributions to the largest intermediate variables by the process variables are calculated.
- the process variables having the largest contributions to the identified intermediate variables are identified.
- Certain patterns of identified process variables are symptomatic of a particular process failure for the particular product being manufactured. As experience is obtained with the process, a library of recurring patterns related to particular failures for particular products is built up, thereby facilitating the failure analysis. Some patterns representing particular failures for a given product are known to cause unusable product.
- the process control computer is programmed to automatically abort the emulsion making process when these patterns are present. Other patterns not resulting in failed batches are stored and subsequently analyzed by the operator.
- the results of the calculations of the surrogate variables and the contributions to the surrogate variables are displayed on the operator console 148 so that the operator can diagnose the failure and correct the problem.
- process variables In some instances, such as instantaneous temperature readings, the process variables are determined directly from the sensor readings, in other instances, such as average values, the process variables are calculated from a number of sensor readings.
- a total of 230 batches were used to build the model of the process as represented by the loading P.
- a PCA model having 10 intermediate variables was constructed.
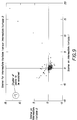
- a T 2 control chart for the set of data used to build the model is shown in Figure 4.
- Several of the batches were outside the T2 control limit and would have been aborted by the process control computer 144.
- We selected for further investigation the batch with the largest T 2 value, the 60th batch along the x -axis.
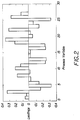
- Figure 5 shows the contributions to T 2 for this batch, we see that intermediate variables 1 and 2 were the primary contributors to this batch being flagged as unusual by the T 2 statistic.
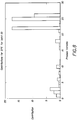
- Figure 6 shows the contributions to the first intermediate variable value for batch 60.
- process variables 3 5, 19, 22, 25 and 26.
- These variables are: silver concentration difference from setpoint during the first phase of the batch (3), difference in silver concentration measured at two different times during the first phase of the batch (5), standard deviation of silver concentration during the second phase of the batch (19), standard deviation of the salt flow during the second phase of the batch (22), total amount of salt delivered (25) and final silver concentration (26).
- An engineering interpretation is that the silver concentration was measured to be unusual during the first phase (according to several different variables) and during the second phase, additional salt was added to the batch to compensate, but since the final silver concentration was unusual, the compensation was not sufficient.
- the process variables that changed at this point in time are process variables 11, 20 and 21 and the product variable 28.
- Control charts of the individual process variables and also of the product variable confirm that there indeed was a change at this point in time.
- the interpretation for this process change is that the deviation of the silver flow from the desired value (11) was unusual, as was a "ramp" up in both silver pressure (20) and silver flow (21) during a later part of the batch.
- Both the process and product changed at this point in time and so any process improvements based upon this information would be expected to produce a reduction in variability of the product. Note that it is clear from the data that the salt delivery system did not undergo changes at this point in time. Therefore, the problem with the process clearly lies elsewhere.
Landscapes
- Physics & Mathematics (AREA)
- General Physics & Mathematics (AREA)
- Engineering & Computer Science (AREA)
- Automation & Control Theory (AREA)
- Feedback Control In General (AREA)
- Testing And Monitoring For Control Systems (AREA)
- Control By Computers (AREA)
Applications Claiming Priority (2)
| Application Number | Priority Date | Filing Date | Title |
|---|---|---|---|
| US165155 | 1993-12-10 | ||
| US08/165,155 US5442562A (en) | 1993-12-10 | 1993-12-10 | Method of controlling a manufacturing process using multivariate analysis |
Publications (2)
| Publication Number | Publication Date |
|---|---|
| EP0660211A2 true EP0660211A2 (de) | 1995-06-28 |
| EP0660211A3 EP0660211A3 (de) | 1996-01-10 |
Family
ID=22597659
Family Applications (1)
| Application Number | Title | Priority Date | Filing Date |
|---|---|---|---|
| EP94420336A Withdrawn EP0660211A3 (de) | 1993-12-10 | 1994-12-01 | Methode zur steuerung eines Herstellungsprozesses. |
Country Status (4)
| Country | Link |
|---|---|
| US (1) | US5442562A (de) |
| EP (1) | EP0660211A3 (de) |
| JP (1) | JPH07200040A (de) |
| AU (1) | AU680314B2 (de) |
Cited By (8)
| Publication number | Priority date | Publication date | Assignee | Title |
|---|---|---|---|---|
| FR2783620A1 (fr) * | 1998-09-22 | 2000-03-24 | De Micheaux Daniel Lafaye | Procede et systeme multidimensionnel de maitrise statistique des processus |
| WO2000040194A1 (en) * | 1998-12-31 | 2000-07-13 | Kimberly-Clark Worldwide, Inc. | Control model |
| WO2002003441A1 (en) * | 2000-07-04 | 2002-01-10 | Tokyo Electron Limited | Operation monitoring method for treatment apparatus |
| GB2378527A (en) * | 2001-05-08 | 2003-02-12 | Curvaceous Software Ltd | Control of multi variable processes |
| GB2405706A (en) * | 2003-09-04 | 2005-03-09 | Curvaceous Software Ltd | Display for control of multi-variable processes |
| EP1571571A1 (de) * | 2004-03-02 | 2005-09-07 | Henner Lüttich | Automatisierte multivariate Priorisierungs- und Selektierungslogik |
| EP1665076A4 (de) * | 2003-09-12 | 2007-06-20 | Tokyo Electron Ltd | Verfahren und system zur diagnostizierung eines verarbeitungssystems unter verwendung einer adaptiven mehrvariablen-analyse |
| EP1242961A4 (de) * | 1999-09-09 | 2010-10-27 | Aegis Analytical Corp | System zur analyse und verbesserung von pharmazeutischen und anderen kapitalintensiven herstellungsprozessen |
Families Citing this family (113)
| Publication number | Priority date | Publication date | Assignee | Title |
|---|---|---|---|---|
| AU643328B2 (en) * | 1991-10-15 | 1993-11-11 | Summit Technology, Inc. | Laser reprofiling system employing photodecomposable mask |
| JPH07175535A (ja) * | 1993-12-16 | 1995-07-14 | Nec Corp | Fet増幅器用電源回路 |
| JP3161921B2 (ja) * | 1994-10-27 | 2001-04-25 | ファナック株式会社 | 製品品質影響要因解析方法と装置及び成形条件調整方法、製品良否判別項目選択方法 |
| DE4446966A1 (de) * | 1994-12-28 | 1996-07-04 | Itt Ind Gmbh Deutsche | Informationssystem zur Produktionskontrolle |
| GB2303720B (en) * | 1995-07-25 | 2000-03-08 | Kodak Ltd | Reject Analysis |
| FR2739928B1 (fr) * | 1995-10-16 | 1997-11-21 | Elf Antar France | Procede de suivi et de controle du fonctionnement d'un analyseur et d'une unite de fabrication a laquelle il est raccorde |
| US5658423A (en) * | 1995-11-27 | 1997-08-19 | International Business Machines Corporation | Monitoring and controlling plasma processes via optical emission using principal component analysis |
| US5864483A (en) * | 1996-08-01 | 1999-01-26 | Electronic Data Systems Corporation | Monitoring of service delivery or product manufacturing |
| JP3579553B2 (ja) * | 1996-10-23 | 2004-10-20 | 新日本製鐵株式会社 | 設備及び製品プロセス異常状態の診断方法及び診断装置 |
| JP3576335B2 (ja) * | 1996-10-31 | 2004-10-13 | 松下電器産業株式会社 | プロセス加工工程の異常抽出方法及び装置 |
| US5850339A (en) * | 1996-10-31 | 1998-12-15 | Giles; Philip M. | Analysis of data in cause and effect relationships |
| US5841676A (en) * | 1996-11-04 | 1998-11-24 | General Electric Company | System and method for estimating a change point time in a manufacturing process |
| US6473703B1 (en) | 1996-11-20 | 2002-10-29 | International Business Machines Corporation | Method for controlling a manufacturing process utilizing control charts with specified confidence intervals |
| US5905989A (en) * | 1996-11-27 | 1999-05-18 | Bently Nevada Corporation | Knowledge manager relying on a hierarchical default expert system: apparatus and method |
| US6662061B1 (en) | 1997-02-07 | 2003-12-09 | Peter G. Brown | System and method for simulation and modeling of batch process manufacturing facilities using process time lines |
| EP0976079A1 (de) | 1997-02-07 | 2000-02-02 | Peter G. Brown | System und verfahren zur simulation und modellierung von biopharmazeutischen stapelprozess-herstellungsanlagen |
| US6311093B1 (en) | 1997-06-20 | 2001-10-30 | Peter G. Brown | System and method for simulation, modeling and scheduling of equipment maintenance and calibration in biopharmaceutical batch process manufacturing facilities |
| US6983229B2 (en) * | 1997-06-20 | 2006-01-03 | Brown Peter G | Method for scheduling solution preparation in biopharmaceutical batch process manufacturing |
| US7043414B2 (en) * | 1997-06-20 | 2006-05-09 | Brown Peter G | System and method for simulating, modeling and scheduling of solution preparation in batch process manufacturing facilities |
| JPH1170445A (ja) * | 1997-08-29 | 1999-03-16 | Nec Kyushu Ltd | 製造プロセス変更管理装置及び製造プロセス変更管理方法 |
| US6115643A (en) * | 1998-02-03 | 2000-09-05 | Mcms | Real-time manufacturing process control monitoring method |
| US5987398A (en) * | 1998-04-30 | 1999-11-16 | Sony Corporation | Method and apparatus for statistical process control of machines and processes having non-constant mean of a response variable |
| SE512540C2 (sv) * | 1998-06-22 | 2000-04-03 | Umetri Ab | Metod och anordning för kalibrering av indata |
| US6594620B1 (en) | 1998-08-17 | 2003-07-15 | Aspen Technology, Inc. | Sensor validation apparatus and method |
| CA2340977C (en) | 1998-08-17 | 2006-09-12 | Aspen Technology, Inc. | Sensor validation apparatus and method |
| US6442445B1 (en) | 1999-03-19 | 2002-08-27 | International Business Machines Corporation, | User configurable multivariate time series reduction tool control method |
| US6609041B1 (en) | 1999-05-05 | 2003-08-19 | Johnson & Johnson Vision Care, Inc. | Method and system for SKU tracking and changeover |
| US6408220B1 (en) * | 1999-06-01 | 2002-06-18 | Applied Materials, Inc. | Semiconductor processing techniques |
| US6453207B1 (en) * | 1999-07-01 | 2002-09-17 | Donald S. Holmes | Method, system and article of manufacture for operating a process |
| US6556959B1 (en) * | 1999-07-12 | 2003-04-29 | Advanced Micro Devices, Inc. | Method and apparatus for updating a manufacturing model based upon fault data relating to processing of semiconductor wafers |
| US6741983B1 (en) * | 1999-09-28 | 2004-05-25 | John D. Birdwell | Method of indexed storage and retrieval of multidimensional information |
| EP1111550B1 (de) * | 1999-12-23 | 2003-08-27 | Abb Ab | Verfahren und Vorrichtung zur Überwachung des Betriebszustandes einer einzelnen Maschine |
| ATE303618T1 (de) * | 2000-03-10 | 2005-09-15 | Smiths Detection Inc | Steuerung für einen industriellen prozes mit einer oder mehreren multidimensionalen variablen |
| JP4570736B2 (ja) * | 2000-07-04 | 2010-10-27 | 東京エレクトロン株式会社 | 運転状態の監視方法 |
| US6934696B1 (en) | 2000-09-15 | 2005-08-23 | Bently Nevada, Llc | Custom rule system and method for expert systems |
| JP3634734B2 (ja) | 2000-09-22 | 2005-03-30 | 株式会社日立製作所 | プラズマ処理装置および処理方法 |
| US6647354B1 (en) * | 2000-09-22 | 2003-11-11 | Honeywell Inc. | Iterative learning update for batch mode processing |
| US20020045952A1 (en) * | 2000-10-12 | 2002-04-18 | Blemel Kenneth G. | High performance hybrid micro-computer |
| GB0026465D0 (en) * | 2000-10-30 | 2000-12-13 | Rolls Royce Plc | Quantifying the effectiveness of an inspection procedure |
| US6650947B2 (en) * | 2001-03-23 | 2003-11-18 | Metso Automation Oy | Multi-variable control loop assessment |
| JP4071449B2 (ja) * | 2001-03-27 | 2008-04-02 | 株式会社東芝 | センサ異常検出方法及びセンサ異常検出装置 |
| TWI306269B (de) * | 2001-06-27 | 2009-02-11 | Tokyo Electron Ltd | |
| US7194369B2 (en) * | 2001-07-23 | 2007-03-20 | Cognis Corporation | On-site analysis system with central processor and method of analyzing |
| US6549864B1 (en) * | 2001-08-13 | 2003-04-15 | General Electric Company | Multivariate statistical process analysis systems and methods for the production of melt polycarbonate |
| GB0120009D0 (en) * | 2001-08-15 | 2001-10-10 | Uws Ventures Ltd | Cause and effect diagnosis |
| JP2003197609A (ja) * | 2001-12-27 | 2003-07-11 | Tokyo Electron Ltd | プラズマ処理装置の監視方法及びプラズマ処理装置 |
| WO2003058687A1 (en) * | 2001-12-31 | 2003-07-17 | Tokyo Electron Limited | Method of detecting, identifying and correcting process performance |
| US6718221B1 (en) * | 2002-05-21 | 2004-04-06 | University Of Kentucky Research Foundation | Nonparametric control chart for the range |
| AU2003247538A1 (en) * | 2002-07-03 | 2004-01-23 | Tokyo Electron Limited | Method and apparatus for non-invasive measurement and analys of semiconductor plasma parameters |
| AU2003263746A1 (en) * | 2002-07-03 | 2004-01-23 | Tokyo Electron Limited | Method and apparatus for non-invasive measurement and analysis of semiconductor process parameters |
| US7302349B2 (en) * | 2002-08-16 | 2007-11-27 | Lattec I/S | System and a method for observing and predicting a physiological state of an animal |
| JP4245928B2 (ja) * | 2003-01-17 | 2009-04-02 | 富士通株式会社 | 設計支援装置、設計支援方法、及び設計支援プログラム |
| US20050027656A1 (en) * | 2003-02-11 | 2005-02-03 | Tyson Foods, Inc. | A system and method for monitoring facility data |
| JP2004335841A (ja) * | 2003-05-09 | 2004-11-25 | Tokyo Electron Ltd | プラズマ処理装置の予測装置及び予測方法 |
| JP2004342806A (ja) * | 2003-05-15 | 2004-12-02 | Fujitsu Ltd | 半導体装置の製造方法 |
| KR100976648B1 (ko) * | 2003-05-16 | 2010-08-18 | 도쿄엘렉트론가부시키가이샤 | 헬스 인덱스 처리 시스템 및 이를 이용한 방법 |
| US7242989B2 (en) * | 2003-05-30 | 2007-07-10 | Fisher-Rosemount Systems, Inc. | Apparatus and method for batch property estimation |
| US6947801B2 (en) * | 2003-08-13 | 2005-09-20 | Taiwan Semiconductor Manufacturing Co., Ltd. | Method and system for synchronizing control limit and equipment performance |
| US7096153B2 (en) * | 2003-12-31 | 2006-08-22 | Honeywell International Inc. | Principal component analysis based fault classification |
| US7447609B2 (en) * | 2003-12-31 | 2008-11-04 | Honeywell International Inc. | Principal component analysis based fault classification |
| US7451003B2 (en) * | 2004-03-04 | 2008-11-11 | Falconeer Technologies Llc | Method and system of monitoring, sensor validation and predictive fault analysis |
| US20070093234A1 (en) * | 2004-08-20 | 2007-04-26 | Willis John A | Identify theft protection and notification system |
| WO2006034179A2 (en) * | 2004-09-17 | 2006-03-30 | Mks Instruments, Inc. | Method and apparatus for multivariate control of semiconductor manufacturing processes |
| US8799206B2 (en) * | 2005-02-07 | 2014-08-05 | Mimosa Systems, Inc. | Dynamic bulk-to-brick transformation of data |
| US8812433B2 (en) * | 2005-02-07 | 2014-08-19 | Mimosa Systems, Inc. | Dynamic bulk-to-brick transformation of data |
| WO2006093746A2 (en) * | 2005-02-25 | 2006-09-08 | Biogen Idec Ma Inc. | Process equipment monitoring |
| WO2007008538A2 (en) * | 2005-07-07 | 2007-01-18 | Mks Instruments, Inc. | Self-correcting multivariate analysis for use in monitoring dynamic parameters in process environments |
| EP1929412A4 (de) * | 2005-08-23 | 2009-10-28 | Mimosa Systems Inc | Unternehmensserver-versionsmigration durch identitäterhaltung |
| US7313454B2 (en) * | 2005-12-02 | 2007-12-25 | Mks Instruments, Inc. | Method and apparatus for classifying manufacturing outputs |
| JP5130634B2 (ja) * | 2006-03-08 | 2013-01-30 | ソニー株式会社 | 自発光表示装置、電子機器、焼き付き補正装置及びプログラム |
| US7596718B2 (en) * | 2006-05-07 | 2009-09-29 | Applied Materials, Inc. | Ranged fault signatures for fault diagnosis |
| US7587296B2 (en) * | 2006-05-07 | 2009-09-08 | Applied Materials, Inc. | Adaptive multivariate fault detection |
| DE102007019636A1 (de) * | 2006-08-30 | 2008-03-13 | Bayer Technology Services Gmbh | Vorrichtung zum Auswählen eines auszuführenden Prozesses |
| US8489360B2 (en) | 2006-09-29 | 2013-07-16 | Fisher-Rosemount Systems, Inc. | Multivariate monitoring and diagnostics of process variable data |
| US7664719B2 (en) * | 2006-11-16 | 2010-02-16 | University Of Tennessee Research Foundation | Interaction method with an expert system that utilizes stutter peak rule |
| US7640223B2 (en) * | 2006-11-16 | 2009-12-29 | University Of Tennessee Research Foundation | Method of organizing and presenting data in a table using stutter peak rule |
| US7624087B2 (en) * | 2006-11-16 | 2009-11-24 | University Of Tennessee Research Foundation | Method of expert system analysis of DNA electrophoresis data |
| US7630786B2 (en) * | 2007-03-07 | 2009-12-08 | Mks Instruments, Inc. | Manufacturing process end point detection |
| WO2008137544A1 (en) | 2007-05-02 | 2008-11-13 | Mks Instruments, Inc. | Automated model building and model updating |
| US7765020B2 (en) * | 2007-05-04 | 2010-07-27 | Applied Materials, Inc. | Graphical user interface for presenting multivariate fault contributions |
| US8010321B2 (en) * | 2007-05-04 | 2011-08-30 | Applied Materials, Inc. | Metrics independent and recipe independent fault classes |
| US8042073B1 (en) * | 2007-11-28 | 2011-10-18 | Marvell International Ltd. | Sorted data outlier identification |
| US8095588B2 (en) | 2007-12-31 | 2012-01-10 | General Electric Company | Method and system for data decomposition via graphical multivariate analysis |
| US7840297B1 (en) * | 2008-03-14 | 2010-11-23 | Tuszynski Steve W | Dynamic control system for manufacturing processes including indirect process variable profiles |
| US20090282296A1 (en) * | 2008-05-08 | 2009-11-12 | Applied Materials, Inc. | Multivariate fault detection improvement for electronic device manufacturing |
| US8335582B2 (en) * | 2008-05-19 | 2012-12-18 | Applied Materials, Inc. | Software application to analyze event log and chart tool fail rate as function of chamber and recipe |
| JP5635509B2 (ja) * | 2008-08-15 | 2014-12-03 | バイオジェン・アイデック・エムエイ・インコーポレイテッド | クロマトグラフィーカラムの性能を評価するための方法 |
| US8494798B2 (en) * | 2008-09-02 | 2013-07-23 | Mks Instruments, Inc. | Automated model building and batch model building for a manufacturing process, process monitoring, and fault detection |
| US8527080B2 (en) * | 2008-10-02 | 2013-09-03 | Applied Materials, Inc. | Method and system for managing process jobs in a semiconductor fabrication facility |
| US8306778B2 (en) * | 2008-12-23 | 2012-11-06 | Embraer S.A. | Prognostics and health monitoring for electro-mechanical systems and components |
| US9069345B2 (en) * | 2009-01-23 | 2015-06-30 | Mks Instruments, Inc. | Controlling a manufacturing process with a multivariate model |
| US8989887B2 (en) | 2009-02-11 | 2015-03-24 | Applied Materials, Inc. | Use of prediction data in monitoring actual production targets |
| US8285414B2 (en) | 2009-03-31 | 2012-10-09 | International Business Machines Corporation | Method and system for evaluating a machine tool operating characteristics |
| US9323234B2 (en) | 2009-06-10 | 2016-04-26 | Fisher-Rosemount Systems, Inc. | Predicted fault analysis |
| US8571696B2 (en) * | 2009-06-10 | 2013-10-29 | Fisher-Rosemount Systems, Inc. | Methods and apparatus to predict process quality in a process control system |
| US8992446B2 (en) * | 2009-06-21 | 2015-03-31 | Holland Bloorview Kids Rehabilitation Hospital | Procedure for denoising dual-axis swallowing accelerometry signals |
| US20110049741A1 (en) * | 2009-08-31 | 2011-03-03 | Brown Dennis M | Method of making ceramic bodies having reduced shape variability |
| US20110288808A1 (en) | 2010-05-20 | 2011-11-24 | International Business Machines Corporation | Optimal test flow scheduling within automated test equipment for minimized mean time to detect failure |
| US8855959B2 (en) | 2010-08-30 | 2014-10-07 | International Business Machines Corporation | Integrated cross-tester analysis and real-time adaptive test |
| US8855804B2 (en) * | 2010-11-16 | 2014-10-07 | Mks Instruments, Inc. | Controlling a discrete-type manufacturing process with a multivariate model |
| US9541471B2 (en) | 2012-04-06 | 2017-01-10 | Mks Instruments, Inc. | Multivariate prediction of a batch manufacturing process |
| US9429939B2 (en) | 2012-04-06 | 2016-08-30 | Mks Instruments, Inc. | Multivariate monitoring of a batch manufacturing process |
| KR101370550B1 (ko) * | 2012-09-13 | 2014-03-06 | 노태영 | 액체혼합장치 |
| JP5956094B1 (ja) | 2015-03-10 | 2016-07-20 | 三菱化学エンジニアリング株式会社 | 製造プロセスの解析方法 |
| US10656102B2 (en) | 2015-10-22 | 2020-05-19 | Battelle Memorial Institute | Evaluating system performance with sparse principal component analysis and a test statistic |
| US11940318B2 (en) | 2016-09-27 | 2024-03-26 | Baker Hughes Energy Technology UK Limited | Method for detection and isolation of faulty sensors |
| US11629708B2 (en) | 2017-11-29 | 2023-04-18 | Halliburton Energy Services, Inc. | Automated pressure control system |
| US11688487B2 (en) * | 2019-07-31 | 2023-06-27 | X Development Llc | Scalable experimental workflow for parameter estimation |
| CN111913444B (zh) * | 2019-09-07 | 2022-03-18 | 宁波大学 | 一种基于时序多块建模策略的化工过程监测方法 |
| CN110794814B (zh) * | 2019-11-27 | 2022-06-28 | 中国人民解放军火箭军工程大学 | 一种基于广义主成分的故障确定方法及系统 |
| US11542564B2 (en) * | 2020-02-20 | 2023-01-03 | Sartorius Stedim Data Analytics Ab | Computer-implemented method, computer program product and hybrid system for cell metabolism state observer |
| JP7509741B2 (ja) * | 2021-12-14 | 2024-07-02 | 花王株式会社 | 連続シート状製品の製造方法 |
| JP7812242B2 (ja) * | 2022-02-18 | 2026-02-09 | 株式会社 資生堂 | 化粧料の製造方法 |
Family Cites Families (8)
| Publication number | Priority date | Publication date | Assignee | Title |
|---|---|---|---|---|
| JPH07104715B2 (ja) * | 1984-01-18 | 1995-11-13 | 株式会社日立製作所 | パラメ−タの同定方法 |
| JPS61243505A (ja) * | 1985-04-19 | 1986-10-29 | Omron Tateisi Electronics Co | 離散時間制御装置 |
| US4882526A (en) * | 1986-08-12 | 1989-11-21 | Kabushiki Kaisha Toshiba | Adaptive process control system |
| GB8727602D0 (en) * | 1987-11-25 | 1987-12-31 | Nat Res Dev | Industrial control systems |
| US5060132A (en) * | 1989-06-13 | 1991-10-22 | Elsag International B.V. | Method of modeling and control for delignification of pulping |
| US5091844A (en) * | 1989-11-06 | 1992-02-25 | Waltz Albert J | Preemptive constraint control |
| US5339257A (en) * | 1991-05-15 | 1994-08-16 | Automated Technology Associates Inc. | Real-time statistical process monitoring system |
| WO1993021592A1 (en) * | 1992-04-16 | 1993-10-28 | The Dow Chemical Company | Improved method for interpreting complex data and detecting abnormal instrument or process behavior |
-
1993
- 1993-12-10 US US08/165,155 patent/US5442562A/en not_active Expired - Fee Related
-
1994
- 1994-12-01 EP EP94420336A patent/EP0660211A3/de not_active Withdrawn
- 1994-12-07 JP JP6303317A patent/JPH07200040A/ja active Pending
- 1994-12-09 AU AU80319/94A patent/AU680314B2/en not_active Ceased
Cited By (17)
| Publication number | Priority date | Publication date | Assignee | Title |
|---|---|---|---|---|
| WO2000017790A1 (fr) * | 1998-09-22 | 2000-03-30 | Daniel Lafaye De Micheaux | Procede et systeme multidimensionnel de maitrise statistique des processus |
| US6804563B1 (en) | 1998-09-22 | 2004-10-12 | Lafaye De Micheaux Daniel | Multidimensional method and system for statistical process control |
| FR2783620A1 (fr) * | 1998-09-22 | 2000-03-24 | De Micheaux Daniel Lafaye | Procede et systeme multidimensionnel de maitrise statistique des processus |
| WO2000040194A1 (en) * | 1998-12-31 | 2000-07-13 | Kimberly-Clark Worldwide, Inc. | Control model |
| EP1242961A4 (de) * | 1999-09-09 | 2010-10-27 | Aegis Analytical Corp | System zur analyse und verbesserung von pharmazeutischen und anderen kapitalintensiven herstellungsprozessen |
| US7054786B2 (en) | 2000-07-04 | 2006-05-30 | Tokyo Electron Limited | Operation monitoring method for treatment apparatus |
| WO2002003441A1 (en) * | 2000-07-04 | 2002-01-10 | Tokyo Electron Limited | Operation monitoring method for treatment apparatus |
| GB2378527A (en) * | 2001-05-08 | 2003-02-12 | Curvaceous Software Ltd | Control of multi variable processes |
| GB2378527B (en) * | 2001-05-08 | 2005-04-06 | Curvaceous Software Ltd | Control of multi-variable processes |
| US7336278B2 (en) | 2001-05-08 | 2008-02-26 | Curvaceous Software Limited | Control of multi-variable processes |
| WO2005024350A3 (en) * | 2003-09-04 | 2005-06-30 | Curvaceous Software Ltd | Multi-variable operations |
| GB2405706B (en) * | 2003-09-04 | 2007-12-19 | Curvaceous Software Ltd | Multi-variable operations |
| US7443395B2 (en) | 2003-09-04 | 2008-10-28 | Curvaceous Software Limited | Multi-variable operations |
| GB2405706A (en) * | 2003-09-04 | 2005-03-09 | Curvaceous Software Ltd | Display for control of multi-variable processes |
| EP1665076A4 (de) * | 2003-09-12 | 2007-06-20 | Tokyo Electron Ltd | Verfahren und system zur diagnostizierung eines verarbeitungssystems unter verwendung einer adaptiven mehrvariablen-analyse |
| US7328126B2 (en) | 2003-09-12 | 2008-02-05 | Tokyo Electron Limited | Method and system of diagnosing a processing system using adaptive multivariate analysis |
| EP1571571A1 (de) * | 2004-03-02 | 2005-09-07 | Henner Lüttich | Automatisierte multivariate Priorisierungs- und Selektierungslogik |
Also Published As
| Publication number | Publication date |
|---|---|
| US5442562A (en) | 1995-08-15 |
| EP0660211A3 (de) | 1996-01-10 |
| AU8031994A (en) | 1995-06-15 |
| JPH07200040A (ja) | 1995-08-04 |
| AU680314B2 (en) | 1997-07-24 |
Similar Documents
| Publication | Publication Date | Title |
|---|---|---|
| US5442562A (en) | Method of controlling a manufacturing process using multivariate analysis | |
| US4937763A (en) | Method of system state analysis | |
| Kourti | Application of latent variable methods to process control and multivariate statistical process control in industry | |
| US7917240B2 (en) | Univariate method for monitoring and analysis of multivariate data | |
| JP5284503B2 (ja) | 予測的状態監視のための診断システムおよび方法 | |
| CN100489870C (zh) | 用于过程统计控制的方法和多维系统 | |
| US6694286B2 (en) | Method and system for monitoring the condition of an individual machine | |
| US20140365179A1 (en) | Method and Apparatus for Detecting and Identifying Faults in a Process | |
| CN108062565A (zh) | 基于化工te过程的双主元-动态核主元分析故障诊断方法 | |
| JP2000505221A (ja) | 工業プロセス監視システム | |
| DE102011102034A1 (de) | Online-Abbgleich eines prozessanalytischen Modells mit effektivem Prozessbetrieb | |
| CN115599037B (zh) | 一种基因检测实验室设备自动化监控方法 | |
| CN119322965B (zh) | 一种基于赋权散度的微小故障智能化检测方法及系统 | |
| WO2008042758A2 (en) | Multivariate monitoring and diagnostics of process variable data | |
| Villalba et al. | A graphical user interface for PCA-based MSPC: a benchmark software for multivariate statistical process control in MATLAB | |
| Neogi et al. | Application of multivariate statistical techniques for monitoring emulsion batch processes | |
| Liu et al. | On-line process monitoring and fault isolation using pca | |
| US20090018788A1 (en) | Normalization of process variables in a manufacturing process | |
| Seo et al. | GLRT based fault detection in sensor drift monitoring system | |
| Salenieks et al. | Machine/Process Parameter Monitoring Using Sample Function Analysis | |
| Seo et al. | Multi-response variable optimization in sensor drift monitoring system using support vector regression |
Legal Events
| Date | Code | Title | Description |
|---|---|---|---|
| PUAI | Public reference made under article 153(3) epc to a published international application that has entered the european phase |
Free format text: ORIGINAL CODE: 0009012 |
|
| AK | Designated contracting states |
Kind code of ref document: A2 Designated state(s): DE FR GB |
|
| PUAL | Search report despatched |
Free format text: ORIGINAL CODE: 0009013 |
|
| AK | Designated contracting states |
Kind code of ref document: A3 Designated state(s): DE FR GB |
|
| 17P | Request for examination filed |
Effective date: 19960612 |
|
| 17Q | First examination report despatched |
Effective date: 19980526 |
|
| STAA | Information on the status of an ep patent application or granted ep patent |
Free format text: STATUS: THE APPLICATION HAS BEEN WITHDRAWN |
|
| 18W | Application withdrawn |
Withdrawal date: 19980817 |