EP0443593B1 - Verfahren und Vorrichtung zum Bestimmen des Ausflockens von Bestandteilen einer Flüssigkeit - Google Patents
Verfahren und Vorrichtung zum Bestimmen des Ausflockens von Bestandteilen einer Flüssigkeit Download PDFInfo
- Publication number
- EP0443593B1 EP0443593B1 EP91102587A EP91102587A EP0443593B1 EP 0443593 B1 EP0443593 B1 EP 0443593B1 EP 91102587 A EP91102587 A EP 91102587A EP 91102587 A EP91102587 A EP 91102587A EP 0443593 B1 EP0443593 B1 EP 0443593B1
- Authority
- EP
- European Patent Office
- Prior art keywords
- components
- component
- wavelength
- sample liquid
- absorbance
- Prior art date
- Legal status (The legal status is an assumption and is not a legal conclusion. Google has not performed a legal analysis and makes no representation as to the accuracy of the status listed.)
- Expired - Lifetime
Links
Images


Classifications
-
- G—PHYSICS
- G01—MEASURING; TESTING
- G01N—INVESTIGATING OR ANALYSING MATERIALS BY DETERMINING THEIR CHEMICAL OR PHYSICAL PROPERTIES
- G01N15/00—Investigating characteristics of particles; Investigating permeability, pore-volume or surface-area of porous materials
- G01N15/02—Investigating particle size or size distribution
- G01N15/0205—Investigating particle size or size distribution by optical means
-
- G—PHYSICS
- G01—MEASURING; TESTING
- G01N—INVESTIGATING OR ANALYSING MATERIALS BY DETERMINING THEIR CHEMICAL OR PHYSICAL PROPERTIES
- G01N15/00—Investigating characteristics of particles; Investigating permeability, pore-volume or surface-area of porous materials
- G01N2015/0092—Monitoring flocculation or agglomeration
Definitions
- the present invention relates to a method and apparatus for detecting, in water purification process or the like, a flocculation process of flocculant components in a liquid after a flocculant is added into raw water including a plurality of components such as suspended particles or dissolved organic materials.
- raw water such as water of rivers, lakes and marshes takes a form of suspension including a plurality of flocculated components.
- the flocculated components refer to suspended components and dissolved components.
- the suspension refers to a liquid in which solid particles having such diameters that cause light scattering are suspended.
- the suspended components refer to components existing in the raw water in the form of solid particles such as clay.
- the dissolved components refer to components uniformly mixed into the raw water, such as acid like humic acid, alkali, inorganic salt, etc, and in particular, in this specification, it refers to dissolved biologically metabolic organic compounds such as humic acid, fulvic acid.
- the flocs A + B + X are an object product of flocculation in a water purification.
- the solid particles that come into existence in the flocculation process i.e., the suspended components A, hydrolyzed product of flocculant X, flocs B + X, and hetero-flocs A + B + X
- suspended particles i.e., the suspended components A, hydrolyzed product of flocculant X, flocs B + X, and hetero-flocs A + B + X
- the information given by the conventional means is limited to the average concentration of suspended particles in a suspension, particle-size distribution, absorbance, transmittance thereof, or the like.
- using the above means for measuring the suspension in the flocculation process in which the suspended particles are being aggregated by a flocculating agent added to the suspension presents the following problems which will be explained corresponding to the above (a) - (d).
- a beam of light was preselected which included a plurality of wavelength components, and irradiated a sample liquid with the beam of light.
- the wavelength components were determined so that they exhibited a distinct or dominant absorption or scattering with regard to respective suspended components and flocculating components to be measured.
- the transmitted beam of light (which corresponds to absorbances) through the sample liquid was measured so that transmitted light signals each corresponding to the principal absorption wavelength of each suspended particle in the sample liquid were measured.
- the correlation coefficients between these light signals i.e., absorbances
- This experiment shows that the correlation coefficients vary in accordance with the flocculation state of the components to be coagulated.
- the flocculation state of the plurality of components in the sample liquid can be easily found by measuring the transmitted part of the light beam irradiating the sample liquid, and by calculating the correlation coefficients between the transmitted light signals or the absorbances by the electronic circuitry having micro-computers.
- the concentration change of the dissolved component that has not yet coagulated in the sample liquid plays an important role, as an index, of finding the process of purification of the sample liquid: this is because the removal efficiency of the dissolved component in the sample liquid can be found on the basis of the concentration change of the dissolved component that has not yet coagulated in the sample liquid; and the concentration of the uncoagulated dissolved component can be obtained from the absorbance of that component.
- the concentration of the uncoagulated dissolved component must be measured after the preliminary processing wherein the suspended particles in the sample liquid are physically removed therefrom.
- the absorbances When the absorbances are measured while irradiating the sample liquid flowing through a flow cell with the beam of light including at least two wavelengths, deviation (fluctuated) values are obtained.
- the deviation takes place because of the flocculation of the plurality of components that have been uniformly dispersed in the sample liquid.
- the flocculation of the components means the spatial localization in the distribution of the components in the sample liquid, and the distribution probability of the flocs in the light path follows the Poisson distribution.
- the inventors of the present invention have found, on the basis of the above facts, that the absorbances (concentrations) of the uncoagulated dissolved components in the sample liquid can be accurately calculated by measuring the deviations of the absorbances of the respective wavelengths, without the preliminary processing of removing the suspended particles in the sample liquid.
- the present invention is carried out in view of the above consideration.
- a method for detecting a flocculation process of a plurality of components in a sample liquid which is produced by adding a flocculant into the sample liquid including at least a suspended component and a dissolved component, the method comprises the steps of:
- the first wavelength component may be selected so as to be absorbed only by the suspended component
- the second wavelength components may be selected so as to be absorbed by both the suspended component and the dissolved component including the flocculant
- the step of calculating correlation coefficients may comprise the steps of:
- an apparatus for detecting a flocculation process of a plurality of components in a sample liquid which is produced by adding a flocculant into the sample liquid including at least a suspended component and a dissolved component, the apparatus comprises:
- photoelectric converting means for converting a transmitted beam, which is a part of the beam passing through the flow cell through which the sample liquid flows, into electric signals each corresponding to the wavelength components
- calculating means for calculating from the electric signals, intensities of the wavelength components of the transmitted beam, mean values, standard deviations and coefficients of variation of absorbances of the wavelength components, correlation coefficients between the intensities of the wavelength components of the transmitted beam, said correlation coefficients being indicative of the progress of the flocculation process.
- the present invention uses a beam of light including at least two wavelengths ⁇ 1 and X 2 which exhibit a distinct or dominant absorption or scattering characteristics with regard to suspended component and flocculated component in a sample liquid, and irradiates with the beam of light the sample liquid which includes a plurality of components to be flocculated. Then, the transmitted or absorbed amount of the wavelength components of ⁇ 1 and ⁇ 2 through the sample liquid are simultaneously measured so that the correlation coefficient between the two wavelength components of the transmitted beam is calculated in real time, thereby finding the progress of the flocculation process.
- observing the flocculation process after a flocculant is added to raw water is to observe a simple flocculation system in which the two components, namely, a suspended component A which exists in the form of suspended particles, and flocs B + X, coagulate into the final form of flocs A + B + X.
- the flocs is represented as a component M
- the suspended component is represented as a component A
- the hetero-flocs A + B + X is referred to the flocs A + M.
- the beam of light irradiating the sample liquid is selected to include two wavelengths ⁇ 1 and ⁇ 2 : the wavelength ⁇ 1 is absorbed only by the suspended component A; whereas the wavelength X 2 is absorbed by both the suspended component A and the flocs B + X.
- the correlation coefficient between the absorbances or the waveforms of the two wavelengths of the transmitted light beam is less than 1 in a period during which a sufficient number of the two components Aand M randomly pass across the light path.
- the component A + M increases, and so the concentrations of the components A and M which have been independently dispersed in the liquid decreases.
- both the absorbances of the wavelengths ⁇ 1 and X 2 simultaneously fluctuate, and the ratio of the magnitudes of the fluctuation is determined by the composition ratio of the components A and B in the component A + M.
- the correlation coefficient increases, and finally, when the flocculation completes so that the entire suspended particles in the liquid have coagulated to the component A + M, the correlation coefficient becomes one.
- the concentration change of the dissolved component B that has not yet coagulated in the sample liquid plays an important role, as an index, of finding the degree of purification of the sample liquid: this is because the removal efficiency of the dissolved component B in the sample liquid can be found on the basis of the concentration change of the dissolved component B that has not yet coagulated in the sample liquid.
- the concentration of the uncoagulated dissolved component B must be considered in a three component system including the dissolved component B: the system is considered wherein the suspended component A and the dissolved component B exist in the sample liquid, a flocculant added to the sample liquid is hydrolyzed to form product X, the dissolved component B is caught into the hydrolyzed product of flocculant X to form the flocs B + X, and the suspended component A in the raw water adheres to the flocs B + X to form the hetero-flocs A + B + X.
- the absorbance of the uncoagulated dissolved component B can be obtained as follows: first, a part of the absorbance of the light of the wavelength X 2 , which results from the suspended particles, is expressed by a measurable statistic based on the fact that the number concentration of the suspended particles is proportional to the absorbance, and that the correlation coefficient indicates the flocculation state; and second, the absorbance resulting from the suspended particles is subtracted from the total absorbance of the wavelength ⁇ 2 , thereby obtaining the absorbance of the uncoagulated dissolved component B.
- the removal efficiency by the coagulated dissolved component B is calculated by comparing the absorbance of the uncoagulated dissolved component B before and after the flocculation process.
- Fig. 1 is a schematic diagram showing an optical system of the apparatus.
- an illumination beam of light 2 emitted from a xenon lamp 1 is condensed by a reflector 3, is incident to a collimator 4, is further shaped by a slit 5 into a beam having a predetermined cross-sectional shape, and is incident onto a sampling liquid 7 flowing in the direction indicated by an arrow P in a flow cell 6 made of fused quartz.
- a beam of light 8 transmitted through the sampling liquid 7 is passed through a slit 9 identical to slit 5, and is incident to a half mirror 10.
- the half mirror 10 splits the beam into two beams: one of the two beams is incident to a photodiode 13 through an interference filter 11; and the other beam is incident to a photodiode 14 through an interference filter 12.
- the photodiodes 13 and 14 produce voltage signals V 1 and V 2 across load resistors 15 and 16, respectively.
- the apparatus of Fig. 1 produces two beams of different wavelengths to be observed by using the interference filters 11 and 12.
- This arrangement has an advantage that the configuration of the optical system and signal processing circuitry not shown in Fig. 1 can be made simple, although it has a disadvantage that the degree of freedom with regard to the selection of wavelengths is restricted.
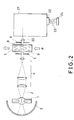
- Fig. 2 is a schematic diagram showing another optical system of the apparatus employing a spectroscope 21 as a light receiving system.
- Figs. 1 and 2 like reference numerals designate like parts.
- This system in Fig. 2 uses condenser lens 20 instead of the half mirror 10 of Fig. 1 so as to make the light beam 8 enter the spectroscope 21 which produces spectrum 28 of the beam 8 from its outlet?? 22.
- the spectrum 28 is received by a photodiode array 24, and is converted into an electric signal.
- the apparatus of Fig. 2 requires a means for calibrating the wavelength of the spectroscope 21, and a driver circuit (not shown) for driving the photodiode array 24, which makes the system more complicated as compared with the optical system in Fig. 1.
- This system has an advantage that the selection of the wavelengths can be carried out more easily because the transmitted beam 8 is produced as the spectrum 23.
- Fig. 3 is a block diagram showing a processing circuit of signals V i and V 2 corresponding to the two different wavelengths of the transmitted beam produced from the optical system of Fig. 1.
- the system is composed of the following elements: an analog signal processing circuit 31 comprising programmable gain amplifiers (PGA) and low-pass filters (LPF); a high-speed A/D conversion portion 32 comprising sample-and-hold circuits (S/H), multiplexers (MUX), and high-speed sequencers; a digital signal processing portion 33 comprising buffer memories, interfaces, a main memory and a CPU; and a man-machine interface 34 comprising a CRT, a printer, a keyboard, etc.
- PGA programmable gain amplifiers
- LPF low-pass filters
- S/H sample-and-hold circuits
- MUX multiplexers
- sequencers high-speed sequencers
- digital signal processing portion 33 comprising buffer memories, interfaces, a main memory and a CPU
- a man-machine interface 34 compris
- the analog signal processing circuit 31 amplifies the input signals V 1 and V 2 and reduces noises thereof to produce signals V 1 and V 2 .
- the high-speed A/D converting portion 32 converts the signals V 1 and V 2 digital signals.
- the digital signal processing portion 33 executes a programmed operation for the digital signals.
- the CRT or the printer displays the results of the operation.
- Various parameters necessary for the operation are entered from the keyboard to the CPU. Likewise, the operation of the entire system is controlled by entering necessary data from the keyboard to the CPU.
- the output signals V 1 and V 2 are simultaneously converted to the digital signals during one sampling time T, and are stored in the buffer memories as N-discrete data.
- the CPU immediately reads the converted data, and executes the following operation on the data.
- the CPU calculates the average of each series of data, and the correlation coefficient p between the two series of data.
- the CPU calculates the correlation coefficient p, and outputs it to the CRT or the printer to display a graph or to print the data.
- the values of V 1 , V 2 , V1rms/ V 1 and V 2rms / V 2 are equal to the coefficients of variation obtained by the turbidity fluctuation measuring method mentioned before as a conventional method. Accordingly, the average particle size of the flocs can be calculated.
- the statistic operation on the absorbance basis can be executed by performing logarithmic transformation for the two components of different wavelengths of the transmitted light beam. More specifically, the operation can be carried out by adding logarithmic transformation circuits as shown in Fig. 4 before the analog signal processing circuit 31 of Fig. 3.
- V 1 and V 2 designate the components of wavelengths ⁇ 1 and X 2 of the light beam 8 transmitted through the flow cell 6
- V 1ref and V 2ref designate reference signals which are directly fed from the light source 1 and are used to monitor the amounts of light
- V out1 and V out2 denote output signals from the logarithmic transformation circuits
- K 1 and K 2 designate scale-factor signals which are set at 1 in this system for simplicity.
- the variation of the amount of light at respective wavelengths can be canceled by logarithmically transforming the ratios between the reference signal V 1ref and the transmitted beam V 1 , and between the reference signal V 2ref and the transmitted beam V 2 .
- the absorbances E 1 and E 2 of the sampling liquid can be calculated by the following equation by using the prestored logarithmically transformed signals obtained with regard to pure water when it was flowed through the flow cell 6.
- i 1 or 2 corresponding to the wavelengths ⁇ 1 and ⁇ 2 , respectively.
- the equation (49) is an equivalent of the equations (10) and (11) in the following Appendix 1.
- the logarithmic transformation thus performed makes it unnecessary to use an approximation as in the equation (12) in the following Appendix 1.
- the calculations according to the equations (49) - (55) enables the CPU to theoretically determine strict statistic quantities by using the absorbance values as variables X and x. Furthermore, using the absorbances as variables enables the CPU to calculate the absorbance E 2 ' of the above-mentioned dissolved components that are not captured in flocs, and the removed ratios thereof by using the equations (44) and (48).
- the correlation coefficient p when only the correlation coefficient p is necessary, it can be calculated with ease as follows: first, the direct current (DC) components of the signals obtained by photoelectrically converting the transmitted light 8 are eliminated by the alternating coupling so that the average values of the signals become zero; and second, the correlation coefficient can be calculated from the effective values (rms values) of the two signals, and the product of the two signals using the equation (19) in the following Appendix 1.
- the apparatus can be constructed by only a simple analog circuit as shown in Fig. 5.
- the photoelectric converted signals V 1 and V 2 are discriminated of the DC components by highpass filters (HPFs) 41 and 42, and then are amplified to a predetermined amplitude by amplifiers 43 and 44.
- the amplification factors have no effect on the correlation coefficient p, and hence the amplification factors can be adjusted so that sufficient signal-to-noise ratios can be achieved.
- the alternating signals thus obtained is deprived of harmful high frequency noises by the low-pass filters (LPFs) 45 and 46, and are fed to RMS-DC converters 47 and 48 as signals V 1 and V 2 so that the root-mean-square values of the respective signals V 1 and V 2 are calculated by the following operations.
- LPFs low-pass filters
- the signals V 1 and V 2 are converted to the covariance by the operation executed by a multiplier 49 and an integrator 50.
- the flocculation conditions were as follows: first, a 50 ppm kaolin suspension was prepared in a 2 liter stirred vessel; second, sodium hydroxide solution was added to the kaolin suspension so that the pH would become 7 after the addition of a flocculating agent; and third, the flocculating agent, aluminum sulfate of 3 ppm was added to the suspension in the strong stirred state.
- the stirring strength was adjusted by changing the number of revolutions of the stirring propellers, thus preparing the sampling liquid of Fig. 1.
- the sampling liquid 7 was fed to the flow cell 6 by a pump not shown in Fig.
- the wavelengths used for measuring was specified as 255 nm and 830 nm to make the ( U1 , (31) and (a 2 , (3 2 ) diagonal dominating form: at 255 nm, absorptivity of aluminum sulfate hydrolysis product is large; and at 830 nm, absorption of kaolin is large.
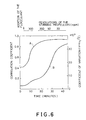
- Fig. 6 is a diagram in which the correlation coefficient p between the signals corresponding to the two wavelengths of the transmitted light signal, and the coefficient of variation (V rms / V) are plotted against the elapsed time: a curve A represents the correlation coefficient p, and a curve B represents the coefficient of variation (V rms l V) of the wavelength of 830 nm.
- a curve A represents the correlation coefficient p
- a curve B represents the coefficient of variation (V rms l V) of the wavelength of 830 nm.
- the change in the number of revolutions of the stirring propellers from the time of addition of the flocculant is depicted in Fig. 6 with the elapsed time.
- the coefficient of variation is identical to that measured by the conventional turbidity fluctuation method, and plays a role as an index of the average size of the flocs.
- the average size of the flocs sharply increases.
- the correlation coefficient of the present invention indicates the degree of progress of the flocculation reaction, and approaches 1 as the flocculation comes to an end.
- the curve A exhibits that the aggregation between the kaolin and the flocculating agent fast proceeds immediately after the addition of the flocculating agent, and nearly finishes by the high-speed stirring. Accordingly, growth of the flocs in the slow-speed stirred state is supposed to be due to collision and aggregation among the microflocs.
- Fig. 7 is a diagram illustrating changes of the removal efficiency of color against changes of the injection ratio of the flocculating agent of kaolin with a concentration of 5 mg/liter, and chromaticity (260 nm absorbance) of 0.2.
- Fig. 7 are plotted not only calculated values (open circle) by the method of the present invention, but also the following removal efficiency for comparison: the removed ratios of the supernatant liquid obtained after a 30-minute precipitation (closed triangle); the removal efficiency measured by the filtering method using 1.2 ⁇ m membrane filter (open square); and the removal efficiency measured by the filtering method using G3 glass filter (closed circle).
- Fig. 7 shows that the calculated values by the method of the present invention behave similarly to the values by the other methods: the removal efficiency of the present invention increases with the increase in the concentration of aluminum.
- Fig. 8 is a diagram comparing, under various conditions, the removal efficiency of the chromatic components of the present invention and other method mentioned above: the removal efficiency of the supernatant liquid obtained aftera 30-minute precipitation (closed triangle); the removal efficiency measured by the filtering method using 1.2 ⁇ m membrane filter (open square); and the removal efficiency measured by the filtering method using G3 glass filter (closed circle).
- Fig. 8 shows that the method of the present invention has good correlation with the other methods: in particular, the method of the present invention agrees well with the method of 30-minute precipitation.
- the present invention makes it possible to measure the flocculation process of a two- component suspension from the view point of progress offlocculation, and further to measure the sizes offlocs. Moreover, the present invention can be easily extended to measure the flocculation process of a multiple-component suspension by enabling the apparatus of the present invention to observe multiple wavelengths as shown in Fig. 2.
- Using the apparatus and method of the present invention makes it possible to positively, effectively remove suspension components such as biometabolic organic substances which are precursors of trihalomethane, clay or the like in the flocculation process like water-purification process by controlling dosage or stirring.
- the method of the present invention detects the progress of the flocculation process in a sampling liquid as follows: first, the flow of the sampling liquid is illuminated by a beam of light; second, the transmitted beam of light is detected, and the component signals of the transmitted beam which correspond to the principal absorption wavelengths of respective suspended components in the sampling liquid are extracted; and third, the correlation coefficients between any two component signals are calculated on a real time basis.
- the principle of the present invention is described with regard to an example which uses a sample liquid including two types of suspended particles, and uses two wavelength light.
- This Appendix 1 explains the relationship between the time serial correlation coefficient between the absorbances of the two wavelengths, and the concentrations of the respective components produced in the flocculation process of the two component system containing the components A and M, proves that the correlation coefficient is useful as an index indicating the progress of the flocculation process by the following equations (2) - (19), and considers the necessary conditions imposed on the selection of the wavelengths and on the components to be measured.
- Equation (2) - (5) express the basic relations between the concentrations of respective components including the flocs A + M, and the absorbances and deviations of the absorbances at the respective wavelengths.
- Equations (6) - (9) express the relations between the concentrations of the respective components and the basic statistics such as variances and covariances, which are calculated by using the measured absorbances of the wavelengths, on the basis of the equations (2) - (5).
- Equations (10) - (15) proves that the mean values and variances of the transmitted light signals instead of the absorbances of the light signals can be used to express the equations (6) - (9) by using the approximation of the equation (12). This theoretically supports the operation for calculating the correlation coefficient between the two wavelengths by using the simple analog circuitry.
- the correlation coefficient is less than 1.
- the concentration C A of the component A and the concentration C M of the component M are both zero, and hence the numerator and denominator of the above equation expressing the correlation coefficient become equal.
- the correlation coefficient becomes one. In this case, the correlation coefficient approaches one with the decline in the concentrations C A and C M .
- the numerator and denominator of the above equation expressing the correlation coefficient become equal.
- the correlation coefficient takes a value of 1 regardless of the concentrations of the components.
- the correlation coefficient can be used as an index indicating increasing flocs except for such a case in which the two components exhibit flat spectra independent of the wavelengths. This was confirmed by the experiment described within the embodiment.
- suffixes "1" and “2" correspond to the wavelengths ⁇ 1 and ⁇ 2 , respectively.
- Asuffix AM indicates that the component A in the flocs A + M is considered, and MA indicates that the component M in the flocs is considered.
- CAM is a concentration of the component A in the flocs A + M
- C MA is a concentration of the component M in the flocs A + M.
- a designates the absorptivity of the component A
- ⁇ indicates the absorptivity of the component M.
- C is a concentration and E is absorbance.
- the components of ⁇ 1 and X 2 are absorbed by the component A and the component M: in this case, the absorptivity of the components Afor the wavelength ⁇ 1 and X 2 are ⁇ 1 and a 2 , respectively; and the absorptivity of the component B for the wavelength ⁇ 1 and X 2 are ⁇ 1 and ⁇ 2 , respectively.
- the absorbances E 1 and E 2 of the suspension at the wavelengths ⁇ 1 and X 2 can be expressed by the following equations.
- the variances (the square of the standard deviation) and can be expressed by the following equations considering that the components A and M are independent, that the concentration CAM of the component A in the flocs A + M and the concentration C MA of the component M in the flocs A + M are dependent, and that the correlation coefficient between CAM and C MA is 1.
- overline - represents an mean value, which is used hereinafter.
- the correlation coefficient p between the E 1 and E 2 is expressed as and the covariance is given by the following equation.
- V photoelectric conversion output of the transmitted light
- V o photoelectric conversion output of pure water without suspensoid by V o
- the correlation coefficients can be made to take a value of 1 at flocculation, and a value of approximately 0 at non-flocculation.
- the present invention makes it possible to calculate the absorbance of the uncoagulated dissolved component in the in-line processing without carrying out the preliminary processing to the suspension, by measuring the fluctuation of the absorbance caused by the suspended particles when the two wavelengths of light pass through the flow of the suspension.
- equation (1) is derived from the following equations (20) - (48).
- the equations are developed so that a component of the absorbance of the wavelength ⁇ 2 , namely, the absorbance that is caused by the suspended particles is expressed by measurable quantities, and by subtracting this absorbance from the total absorbance of the wavelength ⁇ 2 , the absorbance of the uncoagulated dissolved component can be obtained.
- the third stage of the development of the equations [in connection with equations (28) - (41)] shows the changing process of equations wherein the equation (27) of the second stage expressing the mean number of the suspended particles is replaced with the means and standard deviations of the absorbances corresponding to respective terms of equation (27) [equation (28)] so that the right-hand side of equation (28) can be immediately calculated from the measurable values.
- the resultant equation is (41), which can be seen as a quadratic with regard to E 2 because the other variables can be directly measurable or calculable.
- Equation (42) is a root of equation (41), which is subtracted from the total absorbance E 20bs of the wavelength ⁇ 2 , thereby giving the absorbance of the uncoagulated dissolved component at the wavelength X 2 [equation (44)], which is the end of the development of the equations.
- Equations (45) - (47) shows that the following two approaches give the same result with regard to the absorbance of the dissolved component at the time when the flocculation process has completed: one of the approach calculates the absorbance from the balance of the number of the suspended particles; and the other approach calculates the absorbance from the correlation coefficient of the absorbances of the two wavelengths, thereby asserting the validity of equation (44).
- the equation (A) expressing the absorbance of dissolved components which have not been flocculated will be explained.
- the above-mentioned two wavelengths ⁇ 1 and X 2 are selected so that the component light of wavelength ⁇ 1 is absorbed by suspended components, and the component light of wavelength X 2 is absorbed by the suspended components and the dissolved components.
- the number of the suspended particles passing through the light beam varies in accordance with the Poisson distribution.
- C is expressed by Further assuming that the standard deviation of the variation of the number concentration C is Cr, the following equations are obtained.
- the average number v 2 of the suspended particles measured by the light of wavelength ⁇ 2 can be expressed by
- V21 average number of heterofloc (A+ B + X) composed of suspended components A and components B having flocculant X;
- the second term of the right-hand side of the equation (28) is expressed by the following equation using the relation of the equation (36) Furthermore, from the relation of the equation (26) and hence In addition, from the equation (33) Accordingly, the equation (37) can be written in the form
- This equation (41) can be considered as a quadratic equation with regard to the unknown E 2 because all the variances except for the E 2 (the average value of the absorbance of the floc in the absorbance of the light of wavelength ⁇ 2 ) are measurable statistics.
- the positive root of the equation (41) is expressed as the following equation (the negative root is ignored because it has no physical meaning) :
- the average value E 20bs of the absorbance measured by the light of wavelength ⁇ 2 it follows that and hence the absorbance of the dissolved components that have not yet flocculated is given by
- the equation (28) is written in the form of or and hence the following equation can be obtained.
- This equation agrees with the equation obtained by supposing that the correlation coefficient between the absorbances of two wavelengths of light is 1, that is, the two wavelengths of light measure the same floc. Accordingly, the equation (44) [i.e., the equation (1) mentioned before] can be considered as a strict solution.
- the removal efficiency P of the dissolved components resulting from the flocculation reaction can be calculated by the following equation.
Landscapes
- Chemical & Material Sciences (AREA)
- Dispersion Chemistry (AREA)
- Physics & Mathematics (AREA)
- Health & Medical Sciences (AREA)
- Life Sciences & Earth Sciences (AREA)
- Analytical Chemistry (AREA)
- Biochemistry (AREA)
- General Health & Medical Sciences (AREA)
- General Physics & Mathematics (AREA)
- Immunology (AREA)
- Pathology (AREA)
- Investigating Or Analysing Materials By Optical Means (AREA)
Claims (3)
Applications Claiming Priority (4)
| Application Number | Priority Date | Filing Date | Title |
|---|---|---|---|
| JP43064/90 | 1990-02-23 | ||
| JP4306490 | 1990-02-23 | ||
| JP261771/90 | 1990-09-29 | ||
| JP2261771A JP2583653B2 (ja) | 1990-02-23 | 1990-09-29 | 液体中に含まれる複数成分の凝集過程を検出する方法とその装置 |
Publications (3)
| Publication Number | Publication Date |
|---|---|
| EP0443593A2 EP0443593A2 (de) | 1991-08-28 |
| EP0443593A3 EP0443593A3 (en) | 1992-02-12 |
| EP0443593B1 true EP0443593B1 (de) | 1995-05-03 |
Family
ID=26382821
Family Applications (1)
| Application Number | Title | Priority Date | Filing Date |
|---|---|---|---|
| EP91102587A Expired - Lifetime EP0443593B1 (de) | 1990-02-23 | 1991-02-22 | Verfahren und Vorrichtung zum Bestimmen des Ausflockens von Bestandteilen einer Flüssigkeit |
Country Status (3)
| Country | Link |
|---|---|
| US (1) | US5194921A (de) |
| EP (1) | EP0443593B1 (de) |
| DE (1) | DE69109342T2 (de) |
Families Citing this family (44)
| Publication number | Priority date | Publication date | Assignee | Title |
|---|---|---|---|---|
| US5293049A (en) * | 1991-05-01 | 1994-03-08 | Alliedsignal Inc. | Aerosol discriminator for particle discrimination |
| DE4218127B4 (de) * | 1992-06-02 | 2005-09-22 | Heidelberger Druckmaschinen Ag | Verfahren zur Bestimmung des Verschmutzungsgrads eines Druckwerks einer Druckmaschine |
| US6117682A (en) * | 1993-04-27 | 2000-09-12 | Dexsil Corporation | Method for detecting hydrocarbons in water |
| US5493127A (en) * | 1994-12-20 | 1996-02-20 | Michigan State University | Feedback control of electrorheological fluid response |
| JP3238305B2 (ja) * | 1995-08-11 | 2001-12-10 | 株式会社東芝 | 水中粉体の画像検出装置 |
| US5870190A (en) * | 1997-11-25 | 1999-02-09 | Venturedyne, Ltd. | Particle sensor and related method offering improved particle discrimination |
| US6529276B1 (en) | 1999-04-06 | 2003-03-04 | University Of South Carolina | Optical computational system |
| US7123844B2 (en) * | 1999-04-06 | 2006-10-17 | Myrick Michael L | Optical computational system |
| US7180591B1 (en) * | 1999-06-03 | 2007-02-20 | Micron Technology, Inc | Semiconductor processors, sensors, semiconductor processing systems, semiconductor workpiece processing methods, and turbidity monitoring methods |
| US6290576B1 (en) | 1999-06-03 | 2001-09-18 | Micron Technology, Inc. | Semiconductor processors, sensors, and semiconductor processing systems |
| US7530877B1 (en) * | 1999-06-03 | 2009-05-12 | Micron Technology, Inc. | Semiconductor processor systems, a system configured to provide a semiconductor workpiece process fluid |
| AU778492B2 (en) | 2000-04-07 | 2004-12-09 | Rohm And Haas Company | Method and apparatus for determining the dispersion stability of a liquid suspension |
| US7138156B1 (en) | 2000-09-26 | 2006-11-21 | Myrick Michael L | Filter design algorithm for multi-variate optical computing |
| DE10054782A1 (de) * | 2000-10-30 | 2002-06-27 | Univ Dresden Tech | Verfahren zur Messung der Partikelgröße, der Partikelkonzentration und der Partikelgrößenverteilung von dispersen Systemen |
| EP1271127A1 (de) * | 2001-06-05 | 2003-01-02 | Akzo Nobel N.V. | Verfahren und Vorrichtung zur Messung der Zugänglichkeit von porösen Materialen für grosse, starre Verbindungen |
| DE10135320A1 (de) * | 2001-07-19 | 2003-03-13 | Zeiss Carl Jena Gmbh | Mikroskopobjektiv und Verwendung eines solchen Mikroskopobjektivs bei einem Mikroskop |
| US6709311B2 (en) * | 2001-08-13 | 2004-03-23 | Particle Measuring Systems, Inc. | Spectroscopic measurement of the chemical constituents of a CMP slurry |
| DE10202999B4 (de) * | 2002-01-26 | 2004-04-15 | Palas Gmbh Partikel- Und Lasermesstechnik | Verfahren und Vorrichtung zum Messen der Größenverteilung und Konzentration von Partikeln in einem Fluid |
| EP1612542A4 (de) * | 2003-04-07 | 2007-04-04 | Satake Eng Co Ltd | Verfahren zur messung der frische von getreide und bohnen und vorrichtung dafür |
| US7485888B2 (en) * | 2003-06-12 | 2009-02-03 | Guava Technologies, Inc. | Single detector multicolor particle analyzer and method |
| DE10358647B4 (de) * | 2003-12-15 | 2005-10-13 | Elektromanufaktur Zangenstein Hanauer Gmbh & Co. Kgaa | Sensor zur Transmissionsmessung |
| CA2563425A1 (en) * | 2004-04-19 | 2005-10-27 | Trojan Technologies Inc. | Optical radiation sensor system and method for measuring radiation transmittance of a fluid |
| WO2007061436A1 (en) * | 2005-11-28 | 2007-05-31 | University Of South Carolina | Self calibration methods for optical analysis system |
| WO2008002903A2 (en) | 2006-06-26 | 2008-01-03 | University Of South Carolina | Data validation and classification in optical analysis systems |
| CN101512613A (zh) * | 2006-09-07 | 2009-08-19 | 西门子瑞士有限公司 | 涉及微粒监控器及其方法的改进 |
| WO2008057912A2 (en) * | 2006-11-02 | 2008-05-15 | University Of South Carolina | Multi-analyte optical computing system |
| US8213006B2 (en) * | 2007-03-30 | 2012-07-03 | Halliburton Energy Services, Inc. | Multi-analyte optical computing system |
| US8184295B2 (en) * | 2007-03-30 | 2012-05-22 | Halliburton Energy Services, Inc. | Tablet analysis and measurement system |
| EP2140238B1 (de) * | 2007-03-30 | 2020-11-11 | Ometric Corporation | Messsysteme und -verfahren für inline-verfahren |
| US7782459B2 (en) * | 2007-09-24 | 2010-08-24 | Process Metrix | Laser-based apparatus and method for measuring agglomerate concentration and mean agglomerate size |
| US8212213B2 (en) * | 2008-04-07 | 2012-07-03 | Halliburton Energy Services, Inc. | Chemically-selective detector and methods relating thereto |
| TWI421485B (zh) * | 2008-12-30 | 2014-01-01 | Ind Tech Res Inst | 量測液體中懸浮顆粒沉澱特性的系統及方法 |
| US8506799B2 (en) | 2009-09-09 | 2013-08-13 | ClearCorp | Suspended particle characterization system for a water processing facility |
| CN102272574B (zh) * | 2010-03-31 | 2014-04-09 | 古河电气工业株式会社 | 光信息解析装置及光信息解析方法 |
| DE102010038897A1 (de) * | 2010-08-04 | 2012-02-09 | Robert Bosch Gmbh | Streulichtmessverfahren |
| US9146192B2 (en) * | 2012-05-17 | 2015-09-29 | Wyatt Technology Corporation | Integrated light scattering and ultraviolet absorption measurement system |
| US11130686B2 (en) | 2017-01-10 | 2021-09-28 | Vermeer Manufacturing Company | Systems and methods for dosing slurries to remove suspended solids |
| US11498858B2 (en) | 2017-05-02 | 2022-11-15 | ClearCorp | Methods for optimizing water treatment coagulant dosing |
| US10338631B1 (en) | 2017-05-02 | 2019-07-02 | ClearCorp | System for automated water sample jar testing |
| CN108007879A (zh) * | 2017-11-14 | 2018-05-08 | 建德市环保科技创新创业中心有限公司 | 一种基于分光光度计的絮凝剂絮凝效果在线检测评价方法 |
| JP6780683B2 (ja) * | 2018-09-20 | 2020-11-04 | 栗田工業株式会社 | 凝集状態モニタリングセンサー |
| CN110967306B (zh) * | 2019-11-14 | 2023-11-24 | 迈克医疗电子有限公司 | 反应稳定起始时间确定方法和装置、分析仪器和存储介质 |
| CN115469545B (zh) * | 2022-09-15 | 2025-04-25 | 西北工业大学 | 一种飞行器容错控制方法及系统 |
| CN118746523B (zh) * | 2024-06-11 | 2025-03-14 | 中国科学院东北地理与农业生态研究所 | 基于电解质浓度重度苏打盐碱土壤粘粒絮凝指数预测方法 |
Family Cites Families (9)
| Publication number | Priority date | Publication date | Assignee | Title |
|---|---|---|---|---|
| DE261839C (de) * | ||||
| US4077724A (en) * | 1973-02-09 | 1978-03-07 | National Research Development Corporation | Optical density measurement |
| JPS5291483A (en) * | 1976-01-28 | 1977-08-01 | Hitachi Ltd | Multi-component analyzer |
| FR2460896A1 (fr) * | 1979-07-13 | 1981-01-30 | Omnium Assainissement | Procede et dispositif de controle en continu de la coagulation-floculation de particules en suspension dans un liquide |
| GB2129549B (en) * | 1982-11-09 | 1986-03-12 | Univ London | Detecting particles and changes in particle size in a suspension |
| JPS62110135A (ja) * | 1985-11-08 | 1987-05-21 | Cosmo Co Ltd | アスフアルテン濃度定量方法および装置 |
| DD261839A1 (de) * | 1987-07-01 | 1988-11-09 | Medizin Labortechnik Veb K | Anordnung fuer die zweistrahlfotometrische endpunkttitration |
| JPH0249141A (ja) * | 1988-05-09 | 1990-02-19 | Cosmo Oil Co Ltd | スラッジ濃度迅速定量方法および装置 |
| US4950908A (en) * | 1989-03-20 | 1990-08-21 | Consolidation Coal Company | Flocculant control system |
-
1991
- 1991-02-22 DE DE69109342T patent/DE69109342T2/de not_active Expired - Lifetime
- 1991-02-22 EP EP91102587A patent/EP0443593B1/de not_active Expired - Lifetime
- 1991-02-22 US US07/658,635 patent/US5194921A/en not_active Expired - Lifetime
Also Published As
| Publication number | Publication date |
|---|---|
| EP0443593A3 (en) | 1992-02-12 |
| DE69109342T2 (de) | 1996-02-01 |
| DE69109342D1 (de) | 1995-06-08 |
| EP0443593A2 (de) | 1991-08-28 |
| US5194921A (en) | 1993-03-16 |
Similar Documents
| Publication | Publication Date | Title |
|---|---|---|
| EP0443593B1 (de) | Verfahren und Vorrichtung zum Bestimmen des Ausflockens von Bestandteilen einer Flüssigkeit | |
| DE19882996B4 (de) | Analysator für temperaturempfindliche kolloidale Mischungen | |
| JP2583653B2 (ja) | 液体中に含まれる複数成分の凝集過程を検出する方法とその装置 | |
| JP2003533690A (ja) | 天然水の測光分析 | |
| Govoreanu et al. | Simultaneous determination of activated sludge floc size distribution by different techniques | |
| Canfield Jr et al. | RELATIONS BETWEEN COLOR AND SOME LIMNOLOGICAL CHARACTERISTICS OF FLORIDA LAKES 1 | |
| JP2009222566A (ja) | 微生物計測方法およびシステム | |
| JP4862576B2 (ja) | 凝集装置及び凝集方法 | |
| JP2824164B2 (ja) | 微粒子計測方法 | |
| US4348112A (en) | Method of and apparatus for measuring the volume of material in suspension in a liquid | |
| Telesnicki et al. | Comparison of turbidity measurement by nephelometry and transmissometry and its relevance to water quality standards | |
| JPH02291943A (ja) | 凝集速度、平均フロック径・数の計測による凝集試験方法 | |
| JP2008068200A (ja) | 凝集装置及び凝集方法 | |
| Hildred et al. | Characterisation of particulates in the BNFL enhanced actinide removal plant | |
| JP2022026969A (ja) | 水処理システムおよび水処理方法 | |
| Eisnor et al. | Evaluation of particle removal at water treatment plants in Nova Scotia | |
| Guan et al. | Rapid determination of fractal structure of bacterial assemblages in wastewater treatment: Implications to process optimisation | |
| DE69530043T2 (de) | Verfahren zur Bestimmung einer fluoreszierenden Substanz, sowie Verfahren zur Enzym-Aktivität-Bestimmung | |
| Daraei et al. | Continuous floc image analyser (C-FIA) for tracking floc particle dynamics during coagulation–flocculation–settling processes | |
| Sammarro Silva et al. | Visibility graph analysis of particle size distribution during flocculation for water treatment | |
| JP2674226B2 (ja) | フロック形成制御装置 | |
| JP2820879B2 (ja) | 懸濁液の粒子濃度の定量方法及びその装置 | |
| JPH0493638A (ja) | 低濃度吸光度連続測定装置 | |
| Cleasby | Turbidimetric control of filter effluent quality | |
| EP0013247B1 (de) | Verfahren zum Messen des Volumens von in einer Flüssigkeit suspendierten Materien, mit Anwendung, insbesondere, zur automatischen Bestimmung der Qualität von Wasser |
Legal Events
| Date | Code | Title | Description |
|---|---|---|---|
| PUAI | Public reference made under article 153(3) epc to a published international application that has entered the european phase |
Free format text: ORIGINAL CODE: 0009012 |
|
| AK | Designated contracting states |
Kind code of ref document: A2 Designated state(s): DE FR GB |
|
| PUAL | Search report despatched |
Free format text: ORIGINAL CODE: 0009013 |
|
| AK | Designated contracting states |
Kind code of ref document: A3 Designated state(s): DE FR GB |
|
| 17P | Request for examination filed |
Effective date: 19920325 |
|
| 17Q | First examination report despatched |
Effective date: 19940630 |
|
| GRAA | (expected) grant |
Free format text: ORIGINAL CODE: 0009210 |
|
| AK | Designated contracting states |
Kind code of ref document: B1 Designated state(s): DE FR GB |
|
| REF | Corresponds to: |
Ref document number: 69109342 Country of ref document: DE Date of ref document: 19950608 |
|
| ET | Fr: translation filed | ||
| PLBE | No opposition filed within time limit |
Free format text: ORIGINAL CODE: 0009261 |
|
| STAA | Information on the status of an ep patent application or granted ep patent |
Free format text: STATUS: NO OPPOSITION FILED WITHIN TIME LIMIT |
|
| 26N | No opposition filed | ||
| REG | Reference to a national code |
Ref country code: GB Ref legal event code: IF02 |
|
| REG | Reference to a national code |
Ref country code: GB Ref legal event code: 746 Effective date: 20020620 |
|
| REG | Reference to a national code |
Ref country code: FR Ref legal event code: D6 |
|
| PGFP | Annual fee paid to national office [announced via postgrant information from national office to epo] |
Ref country code: FR Payment date: 20100223 Year of fee payment: 20 |
|
| PGFP | Annual fee paid to national office [announced via postgrant information from national office to epo] |
Ref country code: GB Payment date: 20100202 Year of fee payment: 20 Ref country code: DE Payment date: 20100303 Year of fee payment: 20 |
|
| REG | Reference to a national code |
Ref country code: DE Ref legal event code: R071 Ref document number: 69109342 Country of ref document: DE |
|
| REG | Reference to a national code |
Ref country code: GB Ref legal event code: PE20 Expiry date: 20110221 |
|
| PG25 | Lapsed in a contracting state [announced via postgrant information from national office to epo] |
Ref country code: GB Free format text: LAPSE BECAUSE OF EXPIRATION OF PROTECTION Effective date: 20110221 |
|
| PG25 | Lapsed in a contracting state [announced via postgrant information from national office to epo] |
Ref country code: DE Free format text: LAPSE BECAUSE OF EXPIRATION OF PROTECTION Effective date: 20110222 |