This application claims priority from U.S. patent provisional application No. 61/435,250, filed on 21/1/2011, which is incorporated herein by reference in its entirety.
Detailed Description
While preferred embodiments of the present invention have been illustrated and described above, it will be obvious to those skilled in the art that such embodiments are provided by way of example only. Numerous variations, changes, and substitutions will now occur to those skilled in the art without departing from the invention. It should be understood that various alternatives to the embodiments described herein may be employed in practicing the invention.
The present invention provides mobile application of the system and method to maximize sample usage. Aspects of the invention described herein are applicable to any of the specific applications described below or any other type of diagnostic or therapeutic application. The invention may be applied as a stand-alone system or method, or as part of a comprehensive preclinical, clinical, laboratory, or medical application. It is to be understood that the different aspects of the present invention may be understood separately, together or in combination with each other.
The devices and systems of the present invention provide an effective means for real-time detection of analytes in a subject's bodily fluid. The detection methods can be used in a variety of contexts, including analyte identification and quantification associated with a particular biological process, physiological condition, disease, or disease stage. Thus, the system has broad utility in, for example, drug screening, disease diagnosis, pedigree classification, paternity and forensic identification, disease onset and recurrence, response to therapy in individuals rather than in the entire population, and/or therapy monitoring. The subject devices and systems are also particularly useful for facilitating preclinical and clinical phase development of therapies, improving patient compliance, monitoring undesired reactions to prescribed drugs, developing personalized medicine, outsourcing blood testing from a central laboratory to home or on prescription, and/or monitoring therapeutic agents after regulatory approval. The subject devices and systems can be tested by payers for blood samples by outsourcing a central laboratory. The device and system may provide a flexible system for personalized medicine. With the same system, the device can be adapted or interchanged with the protocol or instructions of the system's programmable processor to perform the various analyses described. The devices and systems of the present invention, while much smaller and/or portable, achieve the novel features and provide many of the functions of laboratory instruments.
According to one aspect, the system of the invention comprises a device with an analysis unit and a reagent unit comprising reagents including liquid and/or solid phase reagents. In some embodiments, at least one, one analytical unit, one reagent unit, or a combination thereof, of the entire device is disposable. In the system of the present invention, the detection of analytes using the target device is typically automated. This automation may be achieved through built-in protocols or protocols provided to the system by the manufacturer.
The apparatus and system of the present invention may provide many features not available with existing POC systems or integrated analysis systems. For example, many POC cartridges rely on a closed liquid system or circuit to efficiently process small volumes of liquid. The fluid devices such as cartridges described herein may have open fluid movement between units within a given cartridge. For example, the reagents may be stored in one unit, the sample in a sample collection unit, the diluent in a diluent unit, and the capture surface may be in an analysis unit, with none of the units being in fluid communication with any other unit in one state of the cartridge. The units may be movable relative to the other units to place some of the units in fluid communication by the liquid transfer means of the system. For example, the liquid transfer device may include a head that mates with the analysis unit, which places the analysis unit in fluid communication with the reagent unit. In some cases, the head is a pipette head that places an analytical unit (e.g., a tip) in fluid communication with a reagent unit.
Accordingly, in one embodiment, the present invention provides a method of detecting and/or measuring the concentration of an analyte in a bodily fluid or tissue sample, the method generally comprising the steps of: the devices and systems of the present invention are provided with a sample (e.g., blood, urine, saliva, tissue, etc.), the sample is reacted in at least one analytical unit of the device, and a detectable signal generated by an analyte in the blood sample is detected.
According to one aspect of the invention, a point of care device configured to maximize sample use is used to analyze a sample. For example, more than about 15, 25, 50, 75, or 100 analyses can be performed for samples having a volume of less than about 1, 20, 50, 100, or 500 μ L. The sample may be a blood sample collected by finger prick. The sample may be collected using a sealable capillary or pipette tip. Sample preparation may be performed by processing the sample through a separation (e.g., centrifugation) and/or dilution procedure. The separated and diluted sample may be mixed with one or more reagents in a reaction chamber to prepare for one or more assays. The reaction chamber may be a pipette tip, a vial, a sample transfer device, and/or a test tube. The one or more assays may be configured to measure an optical signal indicative of the concentration of one or more analytes in the sample. The reaction chamber may contain a plurality of assays that may be spatially separated. In a single reaction chamber, one assay or multiple spatially separated assays can produce multiple optical signals. The one or more optical signals may be measured by a digital imaging camera capable of measuring multiple detection spectral regions or detection bands, such as red, green, and blue. The optical signal may be measured on an analytical reaction product in a reaction chamber, which may be a pipette tip or other sample container. The systems, devices, and methods may be fully or semi-automated by programmable logic.
According to another aspect of the present invention, systems, devices and methods are provided for preparing a sample for analysis. The sample may be prepared for analysis by one or more separation devices. For example, a sample may be prepared for analysis by centrifugation in a centrifuge. Other separations can also be made based on charge, size, hydrophobicity/hydrophilicity, and/or volatility.
According to one aspect of the invention, the sample and reaction product analysis is accomplished by image-based analysis. The system may include a camera capable of measuring an optical signal using one or more detection spectral regions. For example, a camera that measures optical signals using red, green, and blue detection spectral regions can be used. The measured signal may include three measurements, and the three measurements may be interpreted using one or more algorithms described herein. The use of more than one detection spectral region may extend the dynamic range of the analysis and may improve the accuracy of the measurement relative to measurements made using one detection spectral region.
The present invention also provides systems, devices and methods for optically measuring a sample and an analytical reaction product contained in reaction chambers, each reaction chamber having a plurality of different path lengths. The reaction chamber may have a plurality of different path lengths so that more or less light absorption may be observed. The multiple different path lengths (e.g., through the sample and/or reaction chamber) allow the dynamic range of the selected analysis procedure to be extended. The reaction chamber images can be analyzed as described herein to obtain information about the sample or the analysis reaction product. The combined use of multiple available path lengths in a single reaction chamber and the use of three channels to detect spectral regions significantly enhances the dynamic range of a particular assay.
A system for performing sample preparation and analysis may include a meter, disposable components, and reagents. The system can accept samples and perform multiple analyses automatically, without user intervention. If desired, the meter may include a graphical user interface, a mechanism for introducing a disposable cartridge, a motorized stage that may have mobility in three directions, one or more single-headed fluid handling devices, one or more multi-headed fluid handling devices, one or more sample preparation devices, optical sensors that may include PMTs and/or imaging devices, temperature controllers, and communication devices. The disposable component may comprise a disposable cartridge containing the sample tip, tip seal and reagents. In some embodiments, the disposable cartridge may further comprise a neutralization component configured to absorb and neutralize a liquid assay product.
The meter, disposable, and reagent may be contained in a closable environment, such as a box or cabinet. In some embodiments, the cross-sectional area of the box is less than about 4m2、2m2、1m2、0.5m2、0.1m2、0.05m2Or smaller. The present invention provides a distributed test system, such as a point of care device, that may include one or more of the following:
1. efficient blood separation (centrifugation) and withdrawal of separated plasma
2. The plasma sample is diluted to one or more levels (e.g., 1:10, 1:100, 1:1000) so that each assay can be performed at an optimal dilution level
3. Optimized partitioning of a sample to several different analyses that may involve several different methods
4. Optimal analysis program
5. Sample analysis, mixing with reagent, culture and submission to optical system by using open circular-section test tube
6. Experimental analysis using imaging techniques (scanning and/or photography and/or microscopy)
In one embodiment, the device of the invention is self-contained and includes all of the liquid and solid phase reagents required to perform multiple assays simultaneously. If desired, the device is configured to perform at least 2, 3, 4, 5, 6, 7, 8, 9, 10, 20, 30, 40, 50, 100, 200, 500, 1000 or more analyses. If desired, one or more control analyses performed simultaneously may also be incorporated into the device. Calibrants may also be provided for calibration of the assay system. Some examples of dried controls and calibrators that can be used for calibration of an assay system can include aqueous solutions of analytes, serum or plasma samples containing known analyte concentrations, and known amounts of such calibrators and controls can also be dried (and dissolved during analysis) by lyophilization, vacuum drying, and other manufacturing procedures.
By including these components in the point-of-care system, the patient or user can quantify multiple analytes, e.g., more than about 10, 20, 30, 50, 75, 100, 150, or 200 analytes, in less than about 0.5, 1, 2, 3, 4, 5, 10, 20, 30, 60, 120, 180, 240, 480, or 600 minutes.
The subject devices and systems can be used to perform quantitative immunoassays that can be completed in a short time. Other types of assays that can be performed using the devices of the invention include, but are not limited to, nucleic acid sequencing and the measurement of metabolites such as cholesterol or electrolytes such as magnesium and chloride ions. In some embodiments, the analysis is completed in less than one hour, preferably less than 120, 60, 30, 15, 10, 5, 4, 3, 2, or 1 minute. In other embodiments, the analysis is completed in less than 5 minutes. The duration of the analysis detection can be adjusted accordingly according to the type of analysis to be performed by the device of the invention. For example, if greater sensitivity is desired, the assay may be incubated for more than an hour or up to a day. In some instances, analyses that require a long time to complete may be more practical for home use and other POC applications than in a clinical POC environment.
In other embodiments of the invention, the reagent unit of the subject device is configured as a set of coordinated components. The reagent unit typically stores liquid or solid reagents required to perform an assay for detecting a particular analyte. The analysis unit may sometimes (optionally, not always) comprise at least one capture surface capable of reacting with an analyte in a sample of bodily fluid. The analysis unit may be a tubular tip having a capture surface therein. Examples of tips according to the present invention are described herein. Each individual analysis and reagent unit may be configured to function as an independent analysis. If a device is to be assembled, the units can be assembled in a just-in-time manner for use in an integrated device that may take the form of a cartridge.
The housing of the device of the present invention may be made of polymeric, metallic or composite materials such as aluminum, polystyrene or other moldable or machinable plastics, and may have well-defined locations for placement of the analysis and reagent units. The housing may comprise metal or any other material. The housing may partially or completely enclose the analysis unit and/or the reagent unit. The housing may support the weight of the analysis unit and/or the reagent unit. In one embodiment, the housing has means for allowing the blotting tip or analysis unit to remove excess liquid. The blotting member may be a porous membrane such as cellulose acetate or a water-absorbent material such as filter paper.
In some embodiments, at least one component of the device may be made of a polymeric material. Non-limiting examples of polymeric materials include polystyrene, polycarbonate, polypropylene, Polydimethylsiloxane (PDMS), polyurethane, polyvinyl chloride (PVC), polysulfone, Polymethylmethacrylate (PMMA), acrylonitrile butadiene styrene copolymer (ABS), and glass.
The device or sub-components of the device can be made by a variety of methods including, but not limited to, stamping, injection molding, compression molding, casting, blow molding, cutting, welding, ultrasonic welding, and heat bonding. In one embodiment, the device is made by injection molding, thermal bonding, and ultrasonic welding. The subcomponents of the device may be joined to one another by thermal bonding, ultrasonic welding, friction fit (press fit), adhesives, or, in the case of certain substrates such as glass or semi-rigid and non-rigid polymeric substrates, by natural adhesion between the two components.
The system can perform a variety of assays regardless of whether the analyte to be detected is from a bodily fluid sample. A program stored on an external device and dependent on the device identification may be transferred to the reader component, enabling the reader component to execute a specific program on the device. In some embodiments, the device has an Identifier (ID) that can be detected or read by an identifier detector as described herein. The identifier enables two-way communication between the device and the sensor or receiving system. The identifier detector may communicate with the communication component via a controller that transmits the identifier to an external device. If necessary, the external device transfers the program stored on the external device to the communication component based on the identifier. This program to be run in the system may include instructions that require the system controller to execute the program, including but not limited to the specific analysis to be run and the detection method to be employed. Once the system performs the analysis, a signal indicative of the analyte in the bodily fluid sample is generated and detected by the detection component of the system. The detected signal can then be sent to a communication assembly and then to an external device for processing, including but not limited to calculating the concentration of the analyte in the sample.
U.S. patent publication No. 2009/0088336 and U.S. patent provisional application No. 60/997,460, which are incorporated herein by reference in their entirety for all purposes, describe systems, devices and methods for sample analysis using point-of-care devices and tips that can be used as reaction chambers.
Sample processing and reaction chamber
The samples, reagents, and combinatorial assays described herein can be processed and contained by a variety of forms of reaction chambers. The sample processing device and the reaction chamber may be wells, tubes or also open tips of test tubes. As used herein, a tip may also be referred to as a sample tip, a test tube tip, a reaction chamber, a test tube, a capillary tube, a sample processing device, or a sample transfer device. A sample may be collected from a sample source into a tip or tube. The suction head can be sealed. Such seals may be permanent or reversible. The diluted sample may be mixed with one or more reagents in an "analytical element" such as a tip (open tube) or an open or capped well (as described in the previous application). When ready for reading, the analytical element may be fed into an optical system for image analysis or other types of reading. Alternatively, the analytical reaction mixture may be transferred from one type of element to another. For example, assays cultured in a tip can be spotted onto an absorbent or absorptive medium, or assays cultured in a well can be pipetted into a tip. Many analyses can be processed simultaneously. Depending on the analytical procedure and/or incubation time, analytical readings may be taken continuously or simultaneously. For the analysis of the measured rate of change, the analysis element can be fed into the optical system several times at different times.
Fluid and material transfer device
The fluid transfer device may be part of a system. The fluid transfer device may include a plurality of heads. The fluid transfer devices of the present invention may have any number of heads required to detect multiple analytes in a sample. In one example, the fluid transfer device has about 8 heads mounted in a row and spaced apart. In one embodiment, the head has a tapered nozzle that is press fit with a variety of tips, such as an analysis unit or a sample collection unit as described herein. The tips may have features that allow them to be automatically removed by the instrument and disposed of into the device housing after use. In one embodiment, the analysis tip is colorless and transparent and may be similar to a cuvette, wherein the running analysis may be detected by an optical sensor such as a photomultiplier tube or camera sensor.
In one example, a programmable processor (e.g., a Central Processing Unit (CPU)) of the system can include or be configured to receive (e.g., from a memory address) instructions or commands and, in accordance with the instructions, operate the fluid transfer device to transfer the liquid sample by withdrawing (for aspirating liquid) or advancing (for advancing liquid) the plunger within the enclosed space. The processor may be configured to facilitate aspiration and/or dispensing. Both the volume of air moved and the speed of movement can be precisely controlled, for example, by the programmable processor.
For mixing of a sample (or reagent) with a diluent (or other reagent), the components to be mixed can be aspirated into the same tube, and mixing can be accomplished by repeatedly aspirating a substantial portion of the mixed liquid volume up and down into the tip. Dissolution of the dried reagent in the tube can be accomplished in a similar manner. For culturing liquid samples and reagents on a capture surface to which a capture reagent (e.g., antibody) is bound, this can be accomplished by drawing appropriate liquid into the tip and holding it in place for a predetermined period of time. For removal of the sample and reagents, the liquid is drained into the receptacle or absorbent pad of the device. Subsequently, another reagent may be aspirated into the tip according to instructions or programming issued by the programmable processor.
The system may comprise a holder or a coupling for moving the analysis unit or the tip. The coupling member may comprise a vacuum assembly or an assembly designed for tight insertion into the tip boss of the analysis unit. For example, the means for moving the tip may be moved in a manner similar to the head of the fluid transfer device. The device can also be moved on a table top depending on the position of the binder or the bracket.
In one embodiment, the instrument for moving the tip is the same instrument for moving a volume of sample, such as the fluid transfer device described herein. For example, a sample collection tip may be inserted into a pipette head through a boss on the collection tip. The collection tip can then be used to distribute the liquid throughout the device and system. When the liquid is dispensed, the collection tip can be discarded and the pipette head can be inserted into the analysis unit through a boss on the analysis unit. The analytical unit tip can then be moved from reagent unit to reagent unit, and reagent can be distributed to the analytical unit by suction or pipetting action provided by the pipette head. The pipette head can also be mixed in a collection tip, an analysis unit or a reagent unit by suction or pipetting actions.
In another embodiment, a tip containing a liquid such as an assay reaction mixture can be disconnected from the pipetting device and "parked" at a specific location in the instrument or in a disposable unit. If desired, the tip may be covered with a seal (similar to that used in centrifuges) to prevent liquid from leaking out. In some embodiments, the seal may be a vinyl seal.
Sample tip example
A variety of container shapes can be used for the sample tips, reaction chambers, and test tubes. For example, the cuvette may be circular, cylindrical, square, rectangular, cubic, conical, pyramidal, or any other shape capable of holding a liquid sample. A rectangular cuvette, shown in top plan and cross-sectional view in fig. 63, may be used, in which the light beam is directed at a perpendicular angle to the surface of the cuvette. In such rectangular tubes, the irradiated liquid sample is also rectangular and is defined by the tube. Test tubes with a circular cross-section may also be used. For example, as shown in the top and cross-sectional views of FIG. 64, there are types of microtiter plates in which a portion of the illuminated sample volume is defined by the meniscus of the sample.
Cuvettes of different path lengths can be used to optimize and extend the analytical response, and to minimize the sample volume required for assay analysis. The length of the test tube may be longer than its cross-section in at least one region. In some cases, the path length of the cuvette may be selected based on cuvette geometry and/or material. Different tubes may be selected for different analyses.
A preferred version of the analysis tube according to the invention has a circular cross-section in the direction of the light beam, as shown in fig. 65. There are several advantages to using a tube with a circular cross-section, including but not limited to:
1. the optical path length can be precisely defined. The dimensional accuracy of injection molded parts has been found to be better than 1-2% CV. Unconstrained liquid menisci in conventional microtiter plates can cause path length inaccuracies.
2. The open nature and circular cross-section of the tip give excellent liquid handling characteristics, making liquid aspiration very accurate.
3. The position of the tip and the boundary of the liquid column can be identified from the optical image of the tip, and the position of the tip center where the signal is the largest can be determined very accurately.
4. Multiple liquid samples can be cultured and analyzed in the same tip. This is because there is substantially no material transfer (axially) between adjacent "boluses" of liquid in the narrow part of the tip.
Examples of suction heads may have the following general features:
the length of the suction head: 0.5-4 cm
The outer diameter of the suction head: 0.2-1.0 cm
Inner diameter of the suction head: 0.1-0.5 cm
Liquid capacity of the suction head: 5-50 uL
The size precision of the suction head is as follows: is generally better than 2% or +/-0.001cm
The suction head configuration: the tip typically has features that cooperate with a (cylindrical) pipette to form a liquid seal. With a generally cylindrical or conical region for imaging. Typically, the optical portion of the tip has at least two different portions having different path lengths. The lower end of the tip is usually narrow to assist in maintaining a vertical column of liquid under gravity.
Suction head material: transparent or uniformly reflective plastics (polystyrene, polypropylene, etc.) (visible light transmission > 80%)
For imaging purposes, the tip may typically be transparent or translucent, although when using three-colour analysis, the tip need not be transparent to be used as a good analysis cuvette. A tip tube that looks "blurry" may have similar performance to a transparent tip. The fuzzy tip is injection molded in a mold having a non-polished or non-textured surface or is made by adding a light scattering material to the plastic from which the tip is made. The light scattering intensity of such a obscuring tip may be selected so as not to be so high as to obscure the coloured liquid to be measured. In general, the effect of light scattering on the transmitted light can be chosen to be less than 10, (20 and 30%) of the effect of the colored material. This light scattering effect can be selected so that the fuzzy tip has a uniform light scattering.
The pipette tip and reaction chamber described herein may consist of a cylindrical (or conical) shaft 2cm long with an internal diameter of about 1-5 mm, corresponding to a capacity of about 10-50 uL.
In one example, the upper end of the barrel is a truncated "mesa" in fluid communication with the barrel and configured to mate with the tapered feature of the pipette. The bottom end of the tip may be narrowed to provide a feature that enables the tip to retain its liquid content when in a vertical position and disconnected from the pipette. The tip may be a tip. The bottom end of the tip is also typically somewhat sharp in shape, becoming smaller in diameter from the main portion of the cylindrical shaft to the tip so as to be able to be fluidly sealed by a flexible (vinyl) cover with which the tip is press-fitted. The suction head is usually made of moulded plastic (polystyrene, polypropylene etc.). The tip may be transparent or translucent so that information about the sample may be obtained by imaging.
Figures 4, 5 and 6 show examples of suction heads. The tip is configured with (1) an upper feature that can cooperate with a pipette head to form a hermetic seal, (2) a generally cylindrical (actually conical but with very little taper) shaft and a narrow, sharp bottom end. The suction head and the cover can form a liquid sealing structure. The sharp shape helps to conform well to the shape of the lid with a slight amount of force. The material used was injection molded polystyrene. The overall dimensions are: 32mm long, with a maximum outer diameter of about 7.6mm and a useful capacity of about 20 uL. The size of the tip can be scaled up to a larger volume. For example, for a 50uL sample, the inner diameter can be increased by a factor of about 1.6.
The seal may be achieved using a vinyl or other material cover that is easily press fit with the sample holding member by the force generated by the z-direction movement of the instrument stage. When the suction head is capped, air bubbles may be trapped in the suction head. The bubbles can be driven to the top of the column by a centrifugation step in order to eliminate the effect of the bubbles. The size of the tip and/or the size of the tip holder in the centrifuge can be matched so that the tip can be held during centrifugation.
Sample preparation
The present invention provides systems, methods and devices for processing and analyzing samples that may be collected from a variety of sources. For example, a sample may be taken from a patient, an animal, or the environment. The sample may be a bodily fluid. Any bodily fluid, if suspected of containing an analyte of interest, may be used with the system or device of the present invention. Commonly used body fluids include, but are not limited to, blood, serum, saliva, urine, gastric and digestive fluids, tears, stool, semen, vaginal fluids, interstitial fluid from tumor tissue, and cerebrospinal fluid.
In some embodiments, the bodily fluid is a blood sample from a human patient. The blood source may be collected from a finger prick and have a volume of less than 0.5, 1, 5, 10, 20, 50, 100, 200, 300, 400, 500, or 1000 uL.
The bodily fluid may be withdrawn from the patient and provided to the device in a variety of ways including, but not limited to, cutting, injection, or pipetting.
As used herein, the terms "subject" and "patient" are used interchangeably herein and refer to a vertebrate, preferably a mammal, more preferably a human. Mammals include, but are not limited to, murines, simians, humans, farm animals, racing animals, and pets.
In one embodiment, the skin is lanced and the sample is removed by, for example, gravity, capillary action, suction, or vacuum force. The lancet can be part of the device, or part of the system, or a separate component. If desired, the lancet can be activated by a variety of mechanical, electrical, electromechanical, or any other known activation mechanisms or any combination of such means. In another embodiment, where no active mechanism is required, the patient may simply provide body fluid to the device, for example, in the case of a saliva sample. The collected liquid may be placed into a sample collection unit in the device. In yet another embodiment, the device comprises at least one microneedle that pierces the skin.
The body fluid volume for the device may be less than about 500 microliters, typically between about 1 and 100 microliters. If desired, a sample of 1 to 50 microliters, 1 to 40 microliters, 1 to 30 microliters, 1 to 10 microliters, or even 1 to 3 microliters can be used to detect an analyte by the device. In one embodiment, the body fluid volume for detecting an analyte by a subject device or system is a drop of fluid. For example, a drop of blood taken from a needle-pricked finger may provide a sample of bodily fluid to be analyzed by the devices, systems, or methods described herein.
The bodily fluid sample may be collected directly from the subject into the tip described herein, or may be later transferred to the tip.
Sample dilution
In some examples, the processor that commands fluid transfer is configured to dilute the bodily fluid sample in the array of analysis units to a degree that produces a signal indicative of the plurality of analytes being detected within a detectable range so that the plurality of analytes can be detected by the system. In one example, the bodily fluid sample includes at least two analytes that differ in concentration by at least 1, 2, 5, 10, 15, 50, 100, 500, 1000, 10,000, 105、106、107、108、109Or 1010And (4) doubling. In one example, the bodily fluid sample is a drop of blood. In one embodiment, the concentrations of the at least two analytes present in the sample differ by up to 10 orders of magnitude (e.g., the first analyte is 0.1pg/mL and the second analyte is 500 ug/mL). In another example, some protein analytes are found at concentrations in excess of 100mg/mL, which extends the range of interest by about 12 orders of magnitude. When measuring nucleic acid analytes such as DNA and RNA by exponential amplification methods such as the polymerase reaction, the number of copies of the analyte can be increased by 10 hundred million fold prior to the assay.
If desired, the body fluid sample is diluted to such an extent that the signals representing the at least two analytes are brought within the detectable range.
The systems and devices described herein may enable many features in laboratory environment flexibility in a POC environment. For example, samples may be automatically collected, processed in a device or system having a tabletop size or smaller. One common problem with POC devices is that when performing multiple assays, which may have very different sensitivities or specificities, different dilution ranges are achieved. For example, there may be two analytes in a sample, but one analyte is present in the sample at a high concentration and the other analyte is present at a very low concentration. In this case, the system and device of the present invention can dilute the sample to very different levels so that both analytes are detected. Alternatively, the sample may be divided into two or more samples, allowing each analyte to be detected at a different dilution level.
For example, if the analyte is at a high concentration, the sample can be serially diluted into the appropriate detection range and provided to the capture surface for detection. In the same system or device, samples with low concentrations of analyte may not need to be diluted. In this way, the analysis range of POC devices and systems can be extended compared to many existing POC devices.
In POC analysis systems using disposable cartridges containing diluent, there is often a practical limit to the extent of dilution. For example, if a small blood sample (e.g., about 20 microliters) obtained by finger prick needs to be diluted, while the maximum volume of diluent that can be placed into the tube is 250 microliters, the actual dilution of the entire sample is limited to about 10 times. In one example herein, the system can aspirate a smaller volume of sample (e.g., about 2 microliters) with a maximum dilution factor of about 100 times. Such dilution factors are acceptable for many assays, but for assays like the CRP assay (as described in this example), the sample needs to be diluted more times. Separation-based ELISA assays can have inherent limitations in the capacity of the capture surface to bind the analyte (e.g., on the order of hundreds of ng/ml for a typical protein analyte). Some analytes may be present in blood at concentrations of up to several hundred micrograms/ml. Even diluted 100-fold, the analyte concentration is still outside the calibration range. In one exemplary embodiment of the systems, devices, and fluid transfer devices described herein, multiple dilutions may be achieved by performing multiple fluid transfers of diluent to a single analysis unit or sample acquisition unit. For example, if the concentration of the analyte in the sample is very high as described above, the sample may be diluted multiple times until the concentration of the analyte reaches an acceptable detection range. The systems and methods of the present invention can provide an accurate determination or estimation of dilution in order to calculate the original concentration of the analyte.
Sample separation
In some embodiments of the invention, the sample may be prepared for analysis by an initial separation step. For example, if DNA is to be analyzed, a DNA isolation step may be employed to remove or reduce contaminants or unwanted source material. The separation step may employ chromatography, centrifugation, liquid-liquid extraction, solid-liquid extraction, affinity binding, or any other mechanism known to those skilled in the art.
In some embodiments, for a blood sample that requires analysis, the first processing step may be to separate the plasma component from the blood sample. This step can be accomplished by a variety of techniques such as filtration, centrifugation, and affinity binding. Centrifugation can be an efficient method of separating blood sample components and can be used in the present invention.
Plasma separation
Blood can be introduced into a closed or sealable tip in a variety of ways, for example, a sample can be provided through a tube, and the sealable tip can receive the sample from the tube by capillary action or pneumatic force. One preferred means of introduction is by capillary action. Alternatively, the container for holding the sample for centrifugation may be configured to have only one opening, as in conventional centrifugation techniques.
When filled with blood, the tip can be automatically moved to a position in the disposable cartridge having a sealing member. The sealing member may be a small "cap" made of a deformable (flexible) material (vinyl, silicone, etc.) which is form-fitted to and seals the bottom end of the cleaner head. The suction head is pressed into the seal by the instrument, thereby forming a connection that is resistant to liquid leakage. The sealed tip is then moved to a mini centrifuge (typically located in and forming part of the instrument) and brought into a press fit with the locating features of the centrifuge rotor so that the bottom (sealing) end of the tip abuts a rigid shelf that will support the tip during the centrifugation step.
The centrifuge rotor may be circular and have a diameter of about 10 cm. The mass of the blood-containing tip is either (1) smaller than the rotor or (2) balanced, if desired, by a counterweight located at the opposite part of the rotor, thereby minimizing vibration during the centrifugation step. One exemplary orientation of the centrifugal rotor is vertical (rotation axis horizontal). The rotor is mounted in the drive shaft and is driven by an electric motor.
Centrifugation can be accomplished by spinning the rotor at about 15000rpm for 5 minutes. In the process, specific components of the blood (red and white blood cells) settle to the sealed end of the tip and form a tightly packed column, while cell-free plasma is separated away from the sealed tip end.
The tips containing the separated samples can then be placed vertically, and a fluid handling device comprising a narrow pipette tip ("sample acquisition tip") mounted on a pipetting device can be brought into position, while the pipetting device is mounted on an x-y-z table.
Plasma can now be efficiently obtained from the centrifuged sample. This can be accomplished by moving the sample acquisition tip vertically along the axis of the centrifugal tip into fluid contact with the plasma, and then drawing the plasma upward, for example, pneumatically.
Alternatively, this operation may be monitored by a camera or other imaging device, which may be used to measure the hematocrit of the sample and provide information to the tabletop/pipette controller regarding the plasma/red blood cell boundary location. With the aid of imaging the separated blood, a narrow pipette tip mounted on a pipette is slowly moved vertically downward, moving the tip down the sample container axis until it contacts the plasma. The tip is then moved further until it approaches (a distance of less than about 3, 2, 1, 0.5 or 0.1mm) the compacted cell interface. At the same time, plasma is aspirated into the narrow pipette tip under computer control. The plasma can be aspirated while moving the narrow pipette tip into the plasma column so that the plasma is not pushed to the upper portion of the sample-receiving member. Aspiration may be controlled to avoid aspiration of air during the plasma removal step.
In general, pipette tips with very narrow tips, such as tips used for processing samples in electrophoresis systems, can be used to aspirate plasma from centrifuged sample tips. The narrow tip is generally conical or tapered, having dimensions of 1-3 x 0.1-0.5 cm (long x diameter), made of any of a variety of materials (polypropylene, polystyrene, etc.). The material may be visibly transparent or translucent. One end of the suction head is matched with the liquid transfer device. The other end is very narrow (0.05-0.5 mm outer diameter) allowing it to enter the sample tip without touching the inner surface of the sample tip. Even if the plasma suction tip and the sample tip are in contact, the plasma suction is not hindered.
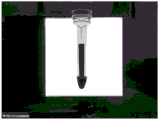
Figure 7 shows the plasma aspiration process, the illustrated stage being with the plasma aspiration tip positioned just above the plasma-packed cell interface during the aspiration step.
In this way we have found that almost all of the plasma can be removed, leaving for example only 1uL in the centrifuged sample tips. This corresponds to approximately 11uL of plasma obtained from 20uL of blood with a hematocrit of 40% (90% recovery). In addition, the quality of the plasma sample (with respect to hemolysis, lipemia and jaundice) can be determined from this centrifuged sample image.
The aspirated plasma may be moved to another location for dilution and mixing with analytical reagents for analysis of analytes, including but not limited to metabolites, electrolytes, protein biomarkers, drugs, and nucleic acids.
Leukocyte isolation
Another use of the present invention is to isolate and concentrate leukocytes from blood. In one aspect of the invention, a reagent (e.g., BD Pharmlyse) is first added to and mixed with the bloodTM555899 or BD FACSTMLysate 349202) from which the blood sample is processed to lyse the red blood cells (optionally while fixing the white blood cells). After a short incubation, the lysed sample is centrifuged as described above, allowing the leukocytes to be concentrated at the sealed end of the blood tip. The lysed red blood cell solution can then be removed by aspiration. The recovery of leukocytes can be accomplished by either (1) adding a small amount of buffer, repeating the aspiration up and down to resuspend the cells, followed by replacement into a container, or (2) removing the seal and displacing the compacted cells down into the container by air pressure.
Another protocol recovers leukocytes without erythrocyte lysis. The blood is centrifuged (as is common practice) and the white blood cells form a layer called the buffy coat over the packed red blood cells. After removal of the vast majority of the plasma (as described above), the leukocytes can be efficiently recovered (1) optionally by adding a small volume (e.g., about 5uL) of isotonic buffer, or (2) using the remaining plasma and resuspending the leukocytes by repeated aspiration and/or mechanical agitation using a sample collection tip. The suspended white blood cell mixture thus formed and a small portion of the red blood cells, which are also resuspended, can be harvested by aspiration for white blood cell analysis. In this way, a large fraction (usually all) of the white blood cells can be recovered, with only a very small (contaminating) amount of red blood cells (usually less than 5% of the original amount).
Centrifugal separator
Fig. 1, 2 and 3 show perspective views on scale of a centrifugal separator that can be integrated into the system (fig. 1-side view; fig. 2-front view; fig. 3-rear view). The centrifuge may include a motor capable of rotating the rotor at 15000 rpm. One type of centrifugal rotor is shaped somewhat like a fan blade, mounted on the rotor shaft in a vertical plane thereof. An element to support the sample receiving member (tip) is attached to the rotor, which element also provides a shelf or shelf on which the end of the tip remote from the rotor shaft can rest, thereby providing support during centrifugation so that the sample cannot be detached. The proximal end of the tip may also be supported by a mechanical stop of the rotor so that forces generated during centrifugation do not cause the tip to pass through its soft vinyl cover. The tips may be inserted and removed by standard pick and place equipment, but are preferably pipetted. The rotor is a single piece of acrylic (or other material) shaped to minimize vibration and noise during operation of the centrifuge. The rotor is (optionally) shaped so that other movable parts of the apparatus can pass over the centrifuge when it is positioned at a particular angle to the vertical. The sample receiving member is centrifugally balanced by a counterweight mounted on the opposite side of the rotor so that the center of rotational inertia is in the axial direction of the motor. The motor of the centrifuge can provide position data to a computer which can then control the stop position of the rotor (typically vertically before and after the centrifuge).
As shown in FIGS. 8 and 9, in order to minimize the centrifugation time (without generating excessive mechanical stress during centrifugation) according to published standards (DIN 58933-1; CLSI Standard H07-A3, "procedure for determining compacted cell volumes" for the United states; approved Standard-3 rd edition), a convenient rotor size is in the range of about 5-10 cm, a rotation speed of about 1-2 ten thousand rpm, and a compacted red blood cell time of about 5 minutes.
An exemplary formula for calculating centrifugal force is shown below:
wherein:
the Ag is the acceleration of gravity of the earth,
r is the radius of rotation of the rotor,
n is the rotation speed in revolutions per unit time.
Wherein:
rcmis the radius of rotation measured in centimeters (cm),
NRPMis the rotational speed measured in Revolutions Per Minute (RPM).
In some embodiments, the centrifuge may be a horizontally placed centrifuge with a swinging barrel design. In some preferred embodiments, the axis of rotation of the centrifuge is vertical. In alternative embodiments, the axis of rotation may be horizontal or any angle. Centrifugation allows for the simultaneous rotation of two or more vessels and can be designed to be fully integrated into automated systems that employ computer controlled pipettors. In some embodiments, the vessel may have a closed bottom. The swing bucket design allows the centrifuge vessel to be passively positioned in a vertical position when stopped and rotated out to a fixed angle when rotated. In some embodiments, the swing bucket may allow the centrifuge vessel to swing out to a horizontal orientation. Alternatively, they may be rotated out to any angle between the vertical and horizontal positions (e.g., about 15, 30, 45, 60, or 75 degrees from vertical). A centrifuge with a swinging barrel design can meet the positional accuracy and repeatability requirements of a robotic system employing a multiple position system.
The computer-based control system may use the position information provided by the optical encoder to rotate the rotor at a controlled slow speed. Because an appropriate motor can be designed for high speed operation, there is no need to rely solely on position feedback to maintain an accurate rest position. In some embodiments, a cam in combination with an electromagnetically actuated lever may be employed to stop at a fixed number of positions with great accuracy and stability. The speed of the rotor can be controlled very accurately at high speed by a separate control system and feedback provided by hall effect sensors built into the motor.
Because multiple sensitive instruments must be operated simultaneously in an analytical instrument system, the design of the centrifuge preferably minimizes or reduces vibration. The rotor may be aerodynamically designed and have a smooth outer appearance-fully enveloping the basket when it is in a horizontal position. Also, the damper may be employed in a plurality of positions when designing the housing.
Rotor
The centrifuge rotor may be a system component that supports and rotates the centrifuge vessel. The axis of rotation may be vertical and thus the rotor itself may be placed horizontally. However, in alternate embodiments, different rotational axes and rotor positions may be used. On each side of the rotor there are two parts called centrifuge buckets, which house the centrifuge vessels. An alternative arrangement may be employed in which the buckets are positioned in radial symmetry, for example three buckets positioned at 120 degrees. Any number of spin buckets may be provided, including but not limited to 1, 2, 3, 4, 5, 6, 7, 8 or more spin buckets. The centrifuge buckets may be equally spaced from each other. For example, if n centrifuge buckets are provided, where n is an integer, the buckets may be separated from each other by 360/n degrees. In other embodiments, the centrifuge buckets need not be equally spaced or have radial symmetry.
When the rotor is stationary, the buckets will fall passively under the influence of gravity, thereby placing the vessel in a vertical position and enabling pipettors to enter and exit the vessel. Fig. 111 shows an example in which the centrifugal bucket is vertical when the rotor is stopped. In some embodiments, the basket will passively fall to a predetermined angle, which may or may not be vertical. When the rotor rotates, the centrifugal tub is brought into a nearly horizontal position or a predetermined angle by centrifugal force. Fig. 112 shows an example where the centrifugal bucket forms a small angle with the horizontal when the rotor is rotating at a certain speed. Physical hard stops may be provided for both vertical and horizontal positions to achieve their accuracy and positional repeatability.
The rotor may be aerodynamically designed and have a disk-like profile with as few physical features as possible to minimize air turbulence induced vibrations. To achieve this, the outer geometry of the centrifuge bucket may be closely matched to the outer geometry of the rotor so that the centrifuge bucket and rotor may be perfectly aligned when the rotor is rotating and the centrifuge bucket may be turned to be horizontal.
To facilitate plasma extraction, the rotor may be angled downward relative to horizontal toward the ground. This allows a fixed rotation angle of the basket, since the angle of the basket can be matched to the angle of the rotor. The sediment obtained according to this configuration forms an angle with the vessel when it is placed vertically. A narrow extraction tip may be used to aspirate plasma from the upper portion of the centrifuge vessel. Placing the extraction tip near the sloped bottom of the angled sediment formation more efficiently extracts the final portion of plasma without agitating the sensitive buffy coat.
The centrifuge bucket of the device can accommodate a variety of tube designs. In some embodiments, different tube designs may have closed ends. Some shapes resemble conventional centrifuge tubes with a conical bottom. Other tube designs may be cylindrical. Tubes having a relatively low height to cross-sectional area are suitable for cell processing. Tubes with larger ratios (> 10: 1) can be suitable for accurate measurement of hematocrit and other imaging requirements. However, any height to cross-sectional area ratio may be used. The centrifuge bucket may be made of any of several plastics (polystyrene, polypropylene) or any other material discussed herein. The capacity of the centrifuge bucket ranges from a few microliters to about 1 milliliter. The tube may be inserted and removed from the centrifuge using a "pick and place" mechanism.
Control system
Because of the rotation and positioning requirements of the centrifuge, a dual control system approach may be employed. To mark a particular rotational position of the rotor, a position-based control system may be implemented. In some embodiments, the control system may employ a PID (proportional integral derivative) control system. Other feedback control systems known in the art may be employed. Position feedback to the position controller may be provided by a high resolution optical encoder. For operating a centrifuge from low to high speeds, a speed controller may be employed, along with a PID control system tuned for speed control. Feedback of the rotational speed to the speed controller may be provided by a set of simple hall effect sensors placed on the motor shaft. Each sensor may generate a square wave for each cycle of one rotation of the motor shaft.
Stopping mechanism
A physical stop mechanism may be employed to consistently and securely position the rotor in a particular position. In one embodiment, the physical stop mechanism may use a cam coupled to the rotor and an electromagnetically actuated lever. The cam is shaped like a circular disk with a plurality of "C" shaped cuts cut into its perimeter. To position the centrifugal rotor, its rotational speed may first be reduced to a maximum of 30 RPM. In other embodiments, the rotational speed may be reduced to any other value, including but not limited to about 5rpm, 10rpm, 15rpm, 20rpm, 25rpm, 35rpm, 40rpm, or 50 rpm. When the speed drops low enough, the lever may be actuated. The lever end is provided with a cam follower which can slide along the cam edge with minimal friction. When the cam follower reaches the center of a particular cut-out on the cam, the force of the electromagnetic actuating lever may override the force of the motor, causing the rotor to stop. At this point, the motor can be electronically braked and, by coupling with the stop mechanism, the rotational position can be held very accurately, firmly and indefinitely.
Centrifugal barrel
The swing-out centrifuge bucket may be configured to accommodate different types of centrifuge tubes. In a preferred embodiment, the different tube types may have a ring or flange at their upper (open) end. This ring or flange feature can be placed on the upper end of the centrifuge bucket and support the tube during centrifugation. As shown in fig. 113, 114 and 115, can accommodate tapered and cylindrical tubes of various lengths and volumes. Fig. 113, 114 and 115 illustrate examples of centrifuge buckets and other bucket designs that may be employed. For example, fig. 113 shows a centrifuge bucket structure example. The barrel may have a side portion that mates with the centrifuge and allows the centrifuge barrel to swing freely. The bucket may have a closed bottom and an open top. Fig. 114 shows an example of a centrifugation vessel fitted with a centrifuge bucket. As described above, the centrifuge bucket may have a shape that accepts various centrifuge vessel configurations. The centrifugal separation vessel may be shaped with one or more projections that can be placed on the centrifuge bucket. The shape of the centrifugation vessel may have one or more features that may mate with the centrifugation bowl. This feature may be a shape feature or one or more protrusions of the vessel. Fig. 115 shows another example of a centrifugal separation vessel that can be fitted with a centrifuge bucket. As mentioned above, the centrifuge bucket may have one or more shape features that may enable different centrifuge vessel configurations to be mated with the centrifuge bucket.
Centrifuge tube and sample extraction member:
the centrifuge tube and extraction tip may be provided separately and may be fitted together for extracting material after centrifugation. Centrifuge tubes and extraction tips can be designed in automated systems for complex processes. Fig. 116 shows an example of a centrifugal separation vessel. Figure 117 shows an example extraction tip. Fig. 118 shows an example of how a centrifugation vessel fits with an extraction tip. Any dimensions provided are exemplary only and other dimensions may be used, with the same or different proportions.
The present system may implement one or more of the following:
1. rapid processing of small blood samples (typically 5-50 uL)
2. Accurate and precise determination of hematocrit
3. Efficient removal of plasma
4. Efficient resuspension of tangible elements (red and white blood cells)
5. Leukocyte concentration (after labeling with fluorescent antibodies and fixation and lysis of erythrocytes)
6. Light determination of red blood cell lysis and recovery of white blood cells
Centrifuge vessel and extraction tip overview:
custom vessels and tips can be used for centrifuge operation to meet various constraints on the system. The centrifugal separation vessel may be a tube with a closed bottom designed for rotation in a centrifugal separator. In some embodiments, the centrifugation vessel may be the vessel shown in fig. 116, or may have one or more of the features shown in fig. 116. It can have a number of unique features to perform a number of desired functions, including hematocrit determination, RBC lysis, and pellet resuspension. In some embodiments, the extraction tip may be the tip shown in FIG. 117, or may have one or more of the features shown in FIG. 117. Exemplary specifications for each tip are discussed herein.
Centrifugal separation vessel
The centrifugal separation vessel may be designed to handle two different use cases, each with a different anticoagulant and whole blood volume.
The first use case may require 40uL of whole blood, where heparin is precipitated, the maximum volume of plasma is recovered, and the hematocrit is determined using computer vision. In the case of a hematocrit of 60% or less, the required or preferred plasma volume may be about 40uL by 40% ═ 16 uL.
In some embodiments, 100% recovery of plasma is not possible because the buffy coat must not be agitated, and thus a minimum distance must be maintained between the bottom of the tip and the upper portion of the sediment. This minimum distance can be determined experimentally, but can be determined by v (d) ═ d × pi 1.25mm2The volume (V) sacrificed as a function of the required safety distance (d) is estimated. For example, in the case of 60% hematocrit, the sacrificial volume may be 1.23uL for a required safety distance of 0.25 mm. This volume can be reduced by reducing the internal radius of the hematocrit portion of the centrifuge vessel. However, because in some embodiments this narrow portion must necessarily fully accommodate the outer radius of the extraction tip which is no less than 1.5mm, the existing size of the centrifugation vessel can approach this minimum.
In addition to plasma extraction, some embodiments may also require the use of computer vision to determine hematocrit. To assist in this procedure, the overall height of a given volume of hematocrit can be maximized by minimizing the inner diameter of this narrow portion of the vessel. By maximizing the height, the relationship between the hematocrit volume change and the physical change in column height can be optimized, thereby increasing the number of pixels that can be used for the assay. It is also possible to make this narrow portion of the vessel of sufficient height to accommodate the most unfavorable case of 80% hematocrit, while still leaving a small portion of plasma at the top of the column for efficient extraction. Thus, 40uL by 80% — 32uL can be the volume capacity needed to accurately determine hematocrit. The volume of this narrow portion of the tip can be designed to be about 35.3uL, which can hold some volume of plasma even in the worst case.
The second use case is much more complex and may require one, more or all of the following:
precipitation of Whole blood
Extraction of plasma
Resuspending and staining the pellet in lysis buffer
Left leukocyte (WBC) precipitation
Removing the supernatant
WBC resuspension
WBC suspension was extracted in its entirety
To completely resuspend the compacted pellet, experiments have shown that the pellet can be physically agitated using a tip that can completely reach the bottom of the vessel containing the pellet. The preferred geometry of the vessel bottom for resuspension appears to be hemispherical like a standard commercial PCR tube. In other embodiments, other vessel bottom shapes may be used. The centrifugation vessel, together with the extraction tip, can be designed to facilitate the resuspension process by complying with these geometric requirements, while also enabling the extraction tip to actually touch the bottom.
In manual resuspension experiments, it was noted that physical contact between the bottom of the vessel and the bottom of the tip created a seal that prevented fluid movement. Fine spacing may be used to fully agitate while still allowing liquid flow. To facilitate this process in a robotic system, a physical feature may be added to the bottom of the centrifuge vessel. In some embodiments, this feature may include four hemispherical nubs placed along the bottom edge of the vessel. When the extraction pipette tip is fully inserted into the vessel and physical contact is achieved, the tip end of the pipette tip can rest on these pieces and liquid can flow freely between the pieces. This can result in a small portion of volume (. 25uL) being lost in the gap.
During lysis, the maximum expected liquid volume in some embodiments is 60uL, which together with the 25uL displaced by the extraction tip may require a total volume capacity of 85 uL. The existing 100uL maximum volume design would exceed this requirement. Other aspects of the second use case require similar or already discussed features of the tip.
The upper geometry of the centrifugation vessel may be designed to mate with a pipette nozzle. Any pipette nozzle described elsewhere herein or known in the art may be used. The external geometry of the upper part of the vessel can be closely matched to the external geometry of the reaction tip around which both the existing nozzle and the cartridge can be designed. In some embodiments, a tab may surround the inner surface of the upper portion. This protrusion can become a visual indicator of the highest liquid level, intended to facilitate automatic error detection using a computer vision system.
In some embodiments, the distance from the bottom of the fully mated nozzle to the highest liquid line is 2.5 mm. This distance is 1.5mm shorter than the 4mm recommended distance to be observed by the extraction tip. This reduced distance may result from the need to minimize the extraction tip length while meeting minimum volume requirements. The particular use of this vessel proves to require this reduced distance. Because in some embodiments liquid may only be exchanged with the vessel from above, the maximum liquid that may be present when it is mated with the nozzle is the maximum total blood volume (40uL) expected at any given time. The height of this liquid may be much lower than the bottom of the nozzle. Another concern is that at other times the volume of liquid in the vessel may be much greater than this and wet the walls up to the nozzle height. In some embodiments, the meniscus of any liquid contained in the vessel is ensured by the person using the vessel not to exceed the maximum liquid height, even if the total volume is less than the specified maximum value. In other embodiments, other features may be provided to retain the liquid in the vessel.
Any dimensions, sizes, volumes, or distances provided herein are for example only. Any other size, dimension, volume, or distance that may or may not be proportional to the numbers mentioned herein may be used.
The centrifugal separation vessel can be subjected to a plurality of forces during the exchange of liquids and during the rapid insertion and extraction of the pipette tips. If the vessel is unconstrained, it is possible that these forces are sufficient to lift or otherwise move the vessel out of the centrifuge bucket. To prevent movement, the vessel should be fixed in some way. To achieve this, a ring is added around the periphery of the bottom of the vessel. This ring can easily be fitted with a matching mechanical feature on the centrifuge bucket. This problem is solved as long as the retention force of the nubs is greater than the forces experienced in liquid operation, but less than the friction force when mating with the nozzle.
Extraction suction head
The extraction tip may be designed to interface with a centrifugation vessel to efficiently extract plasma and resuspend pelleted cells, if desired, and may have an overall length (e.g., 34.5mm) that closely matches the overall length of another blood tip, including but not limited to the tip described in U.S. serial No. 12/244,723 (incorporated herein by reference), but may have sufficient length to physically contact the bottom of the centrifugation vessel. In some embodiments, the ability to contact the bottom of the centrifuge vessel may be required, both for the resuspension process and for the complete recovery of the leukocyte suspension.
The required volume of an extraction tip may be determined according to the maximum volume that it is expected to need to aspirate from the centrifugation vessel at any given time. In some embodiments, this volume may be about 60uL, which may be less than a maximum tip capacity of 85 uL. In some embodiments, tips having a volume greater than desired may be provided. As with centrifugal separation vessels, an internal feature surrounding the upper internal wall of the tip can be used to mark the height of this maximum volume. The distance between this maximum volume line and the mating nozzle tip may be 4.5mm, which may be considered a safe distance to prevent contamination of the nozzle. Any sufficient distance to prevent nozzle contamination may be used.
A centrifuge may be used to deposit precipitated LDL-cholesterol. The supernatant was clear as confirmed by imaging, thus indicating complete removal of the precipitate.
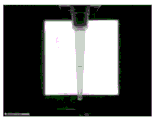
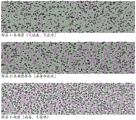
In one example, plasma may be diluted (e.g., 1: 10) into a mixture of dextran sulfate (25mg/dL) and magnesium sulfate (100mM), and then may be incubated for 1 minute to precipitate LDL-cholesterol. The reaction product can be drawn into the centrifuge tube and then capped and spun at 3000rpm for three minutes. FIGS. 119, 120 and 121 show images of the original reaction mixture before centrifugation (showing white precipitate), after centrifugation (showing clear supernatant) and LDL-cholesterol precipitate (after removal of the lid), respectively.
Other examples of centrifuges that may be used in the present invention are described in U.S. patent nos. 5,693,233, 5,578,269, 6,599,476 and U.S. patent publication nos. 2004/0230400, 2009/0305392, 2010/0047790, which are incorporated by reference in their entirety for all purposes.
Examples of the procedures
Many variations of the procedure may be used for centrifugation and processing. For example, a typical procedure for centrifuge processing and concentration of leukocytes for cytometry can include one or more of the following steps. The following steps may be provided in a different order, or additional steps may be substituted for any of the following steps:
1. receive 10uL of EDTA anticoagulated blood (pipetted into the bottom of the centrifuge bucket)
2. Erythrocytes and leukocytes were pelleted by centrifugation (<5min x 10,000 g).
3. Measurement of hematocrit by imaging
4. Plasma (4uL, corresponding to the most unfavorable case [ 60% hematocrit ]) was slowly removed by suction pipette without agitating the cell pellet.
5. 20uL of a solution containing up to five fluorescently labeled antibodies dissolved in buffered saline + BSA (1mg/mL) was added1After a suitable mixture of (2) the precipitate was resuspended (total reaction volume about 26 uL)2)。
6. Incubate at 37 ℃ for 15 minutes.
7. The lysis/fixation reagent was prepared by mixing the erythrocyte lysate (ammonium chloride/potassium bicarbonate) with the leukocyte fixation reagent (formaldehyde).
8. 30uL of lysis/immobilization reagent (total reaction volume about 60uL) was added.
9. Incubate at 37 ℃ for 15 minutes
10. Leukocytes were pelleted by centrifugation (<5min, 10,000 g).
11. The supernatant erythrocyte lysate (about 57uL) was removed.
12. The leukocytes were resuspended by addition of 8uL of buffer (isotonic buffered saline).
13. The volume is accurately measured.
14. The samples (c 10uL) were subjected to cytometry.
These steps may include receiving a sample. The sample may be a bodily fluid such as blood, or any other sample described elsewhere herein. The sample may have a small volume, as any volume measurement described elsewhere herein. In some cases, the sample may contain a retarder.
A single step may be employed. For example, density-based separation can be performed. Such separation may be accomplished by centrifugation, magnetic field separation, lysis, or any other separation technique known in the art. In some embodiments, the sample may be blood, and red blood cells and white blood cells may be separated.
Measurements can be made. In some cases, this measurement may be accomplished by imaging or any other detection mechanism described elsewhere herein. For example, determining hematocrit in an isolated blood sample can be accomplished by imaging. Imaging may be accomplished by a digital camera or any other image capture device described elsewhere herein.
One or more components of the sample may be removed. For example, if the sample is separated into solid and liquid components, the liquid components may be removed. The plasma in the blood sample can be removed. In some cases, liquid components such as plasma may be removed using a pipette. The liquid component can be removed without agitating the solid component. Imaging may aid in the removal of liquid components or any other selected components in the sample. For example, imaging may be used to determine where plasma is located and may aid in the positioning of pipettors to remove plasma.
In some embodiments, reagents or other materials may be added to the sample. For example, the solid portion of the sample may be resuspended. A material bearing a marker may be added. One or more culturing steps may be employed. In some cases, a lysis and/or immobilization reagent may be added. Additional separation and/or resuspension steps may be employed. If desired, dilution and/or concentration steps may be performed.
The sample volume can be measured. In some cases, the sample volume may be measured in an accurate and/or precise manner. The sample volume may be measured in a low coefficient of variation system with coefficient of variation values as described elsewhere herein. In some cases, the sample volume may be measured using imaging. An image of the sample may be captured and the sample volume may be calculated from the image.
The sample may be subjected to the desired treatment. For example, a sample may be subjected to a blood count.
In another example, a typical procedure for nucleic acid purification, with or without a centrifuge, may include one or more of the following steps. The system can perform DNA/RNA extraction and perform exponential amplification reactions on nucleic acid templates for detection. The procedure can be designed for extracting nucleic acids from a variety of samples including, but not limited to, whole blood, serum, viral transfer media, human and animal tissue samples, food samples, and bacterial cultures. The process can be fully automated and DNA/RNA can be extracted in a consistent, quantitative manner. The following steps may be provided in a different order, or other steps may replace any of the following steps.
1. The sample is lysed. Cells in the sample can be lysed using a chaotropic salt buffer. The chaotropic salt buffer may comprise one or more of: chaotropic salts, including but not limited to 3-6M guanidine hydrochloride or guanidine thiocyanate; sodium Dodecyl Sulfate (SDS) with typical concentrations of 0.1-5% v/v, ethylenediaminetetraacetic acid (EDTA) with typical concentrations of 1-5 mM; lysozyme at a typical concentration of 1 mg/mL; proteinase K at a typical concentration of 1 mg/mL; and the pH can be adjusted to 7-7.5 using HEPES or the like buffer. In some embodiments, the sample may be incubated in buffer at a typical temperature of 20-95 ℃ for 0-30 minutes. Isopropanol (50% -100% v/v) may be added to the mixture after lysis.
2. And (4) surface loading. The lysed sample may be exposed on a functionalized surface (often in the form of a bed of compacted microspheres), such as, but not limited to, a resin support compacted in a chromatographic column, magnetic microspheres mixed with the sample in a batch fashion, a suspension resin in which the sample is pumped through a fluidized bed pattern, a sample pumped through a closed channel and flowing across the surface in a tangential flow. The surface can be functionalized to bind nucleic acids (e.g., DNA, RNA, DNA/RNA mixtures) in a lysis buffer. Surface types may include silica, and ion exchange functionalities such as Diethylaminoethanol (DEAE). The lysed mixture may be exposed to the surface and the nucleic acids bound.
3. And (5) cleaning. The solid surface was cleaned with 0-2M saline solution of sodium chloride and ethanol (20-80% v/v) at pH 7.0-7.5. Cleaning can be accomplished in the same manner as loading.
4. And (4) eluting. The nucleic acid can be eluted from the surface by exposing the surface to water or a buffer at a pH of 7-9. Elution can be accomplished in the same manner as loading.
The present system may employ many variations of these programs or other programs. Such procedures may be used in combination with or in place of any of the procedures or approaches described herein.
In some embodiments, it is important to be able to recover centrifugally compacted and concentrated cells for cytometry. In some embodiments, this can be accomplished using a pipetting device. The liquid (typically isotonic buffered saline, a lysing agent, a mixture of lysing agent and fixative, or a mixture of labeled antibodies in buffer) can be dispensed into a centrifuge bucket and repeatedly aspirated and redistributed. The tip of the pipette may be forced into the compacted cells to facilitate this process. Image analysis aids in this process by objectively confirming that all cells have been resuspended.
Samples were processed before analysis using a pipette and centrifuge:
according to one embodiment of the invention, the system may have pipetting, pick and place, and centrifugation functions. Such functions can efficiently implement almost any type of sample pre-treatment and complex analysis procedures for very small volumes of sample.
In particular, the present system allows for the separation of the formed components (red and white blood cells) from the plasma. The system may also enable resuspension of the tangible element. In some embodiments, the present system can concentrate leukocytes from fixed and lysed blood. The system may also lyse cells to release nucleic acids. In some embodiments, the present system can use a tip containing (usually in the form of microspheres) solid phase reagents (e.g., silica) to perform filtration, thereby completing nucleic acid purification and concentration. The system also allows elution of purified nucleic acids after solid phase extraction. The system also allows for removal and collection of the precipitate (e.g., precipitation of LDL-cholesterol using polyethylene glycol).
In some embodiments, the present system can achieve affinity purification. Small molecules such as vitamin D and serotonin can be adsorbed onto microsphere (microparticle) hydrophobic matrices and subsequently eluted by organic solvents. The antigen may be provided on a matrix coated with the antibody and eluted with an acid. The same method can be used to concentrate analytes found to have low concentrations, such as thromboxane B2 and 6-keto-prostaglandin F1 alpha. The antigen may be provided on a matrix coated with an antibody or aptamer and then eluted.
In some embodiments, the present system can achieve analyte chemical modification prior to analysis. For example, to assay serotonin (5-hydroxytryptamine), it may be desirable to convert the analyte to a derivative (e.g., an acetylated form) using a reagent (e.g., acetic anhydride). This is achieved by generating a form of the analyte which is recognised by the antibody.
A liquid can be moved using a pipette (vacuum suction and pumping). Pipettes may be limited to relatively low positive and negative pressures (about 0.1-2.0 atmospheres). When it is desired to force a liquid through a microsphere-based solid phase medium, much higher pressures can be generated using a centrifuge. For example, using a rotor having a radius of 5cm and a speed of 10000rpm, a force of about 5,000x g (about 7 atmospheres) may be generated sufficient to drive a liquid through a resistive medium such as a packed bed. Any centrifuge design and centrifugation process discussed elsewhere herein or known in the art may be used.
It is possible to measure hematocrit for very small volumes of blood. For example, an inexpensive digital camera can take a good image of a small object even when the contrast is poor. By taking advantage of this function, the system of the present invention can achieve automatic hematocrit measurement using a very small volume of blood.
For example, 1uL of blood can be drawn into a glass capillary with a microcap. The capillary tube can then be sealed with a curable adhesive and centrifuged at 10,000x g for 5 minutes. The volume of the compacted cells can be easily measured and the plasma meniscus (as indicated by the arrow) is also visible, thus allowing accurate hematocrit measurement. This eliminates the need for the system to waste a large volume of blood to perform the measurement. In some embodiments, the camera may be used as is, without a microscope, to take larger images. In other embodiments, the image may be magnified using a microscope or other optical techniques. In one embodiment, the hematocrit is determined using a digital camera without additional optical interference, and the measured hematocrit is the same value as determined by conventional microphthalmoscope methods that require many microliters of sample. In some embodiments, the length of the sample column and the length of the packed red blood cell column (+/- <0.05mm) can be measured very accurately. Because the blood sample column can be about 10-20 mm, the standard deviation of hematocrit can be far better than the 1% match achieved by standard laboratory methods.
The system can realize the measurement of Erythrocyte Sedimentation Rate (ESR). The ability of a digital camera to measure very small distances and rates of change of distances can be used to measure ESR. In one example, three blood samples (15uL) are drawn into a "reaction tip". Images were taken at two minute intervals over one hour. Image analysis is used to determine the interfacial movement between red blood cells and plasma. Fig. 122 shows the results for the distance of the interface from the plasma meniscus.
The accuracy of the measurement can be estimated by fitting the data to a polynomial function and calculating the standard deviation of the difference between the data and the fitted curve (for all samples). In one example, the accuracy is determined to be 0.038mm or < 2% CV in terms of the distance moved in one hour. Accordingly, the ESR can be accurately measured using this method. Another way to determine ESR is to measure the maximum slope of the distance versus time.
Preparation of the assay
In some embodiments, the tip may be designed to accommodate multiple reactions or assays. Measurements of several different analytical mixtures and one or more control samples or one or more calibrators can be performed simultaneously in one tip of the invention. To achieve this, we have utilized the ability to sequentially aspirate liquids into the same tip in order to sample several sources of liquid. By sequentially aspirating a small volume of air and a small volume of cleaning liquid for cleaning the surface of the tip before aspirating the next liquid of interest, effective liquid segmentation and separation is greatly improved.
As mentioned above, the suction head may have a conical shape. In some embodiments, the analysis may require oxygen as a reactant. In such reactions, the availability of oxygen in the reaction may be increased by moving the sample and/or assay mixture into a wider portion of the tip to increase the surface area to volume ratio.
In fig. 93 and 94, bromophenol blue solution is drawn into the tip. The 6uL of the uppermost segment (first aspirated) was from a two-fold dilution series (highest concentration (0.0781mg/mL) on the right side of the image, except for the water blank in the leftmost pipette). Subsequently, air (2uL), wash solution (2uL) were aspirated separately, followed by a 6uL volume of a fixed concentration control (0.625 mg/mL).
Using this approach, several alternative analysis configurations can be implemented, for example:
1. simultaneous measurement of reagent and/or sample voiding and analysis
2. Simultaneous measurement of sample, blank and control
3. Analytical in-tip calibration
The following table shows some "multiplex types" in which the preferred combination of assay, control and calibrator is performed in combination in the tip.
Fig. 95 shows the 2 nd case.
Serial assays for blank solutions, samples, controls and calibrators can also be performed using a single tip. For this case, the tip is filled with the first solution, read, and then emptied. Subsequently, the tip is filled with further samples in order and readings are taken. The effect of "carryover" of colored product from one sample to another is minimized by either or both of the following steps:
1. Reading the middle of the liquid column far from the first contact part with the previous sample
2. The tips are washed between samples.
To measure the degree of "carry over" from one liquid stage to the next, the following procedure was performed. A small amount (e.g., 6uL) of highly concentrated bromophenol blue (e.g., 0.625mg/mL) is drawn into the tip, followed by 2uL of air and 2uL of wash solution. Finally, 6uL of bromophenol blue diluted twice in succession were aspirated, obtaining the following results (highest concentration (0.0781mg/mL) on the right, water blank in the leftmost tip).
As can be seen from the image shown in fig. 96 and the 3-color analysis shown in fig. 97, a measurable amount of the high concentration solution was transferred into the cleaning solution.
The average residue (from the high concentration control to the aqueous rinse) was 1.4% by calculation. In practice, since the leading region of the later bolus of liquid (closer to the earlier bolus) serves as the second washing step and the color reading is taken at a location remote from this leading region (usually in the central region of the bolus), the effective residue from one bolus to the next is usually well below 1% and is therefore generally negligible. When the tip was placed with only a dilution series of samples and the dilution series was measured therefrom, the results were the same as those obtained above. The above represents a "stress test" designed to evaluate the degree of residue.
FIG. 98 shows a calcium Ca-containing solution containing ions for two commercially available sources2+(upper paragraph) and magnesium Mg2+(lower stage) tips for analysis of the reaction products used, which are aspirated into the tipsIt is detected. Ca used in this experiment2+Concentrations of 0, 2.5, 5, 10, 20 and 40 mg/dL; mg (magnesium)2+Concentrations were 0, 1.25, 2.5, 5, 10 and 20 mg/dL. Analysis of the reaction mixture (6uL [ Ca ]2+]And 4uL [ Mg ]2 +]) Well separated by 2uL of air, 3uL of cleaning solution and a further 4uL of air. The results of the analyses read in this way are substantially the same as the results of measurements made with only one analytical reaction mixture per tip.
As described above, the present invention can evaluate multiple assays simultaneously. Many analysis tubes in the same field of view can be imaged. In particular, simultaneous evaluation of the analysis and of a control sample in the same analysis tube can be accomplished. Simultaneous evaluation of several analyses in the same analysis tube can also be done.
Reaction environment
The system may comprise a heating block for heating the analysis or analysis unit and/or controlling the analysis temperature. Heating may be employed during the incubation step of the analytical reaction to facilitate the reaction and shorten the duration of the incubation step required. The system may comprise a heating block configured to receive an analysis unit of the invention. The heating block may be configured to accommodate a plurality of analysis cells from the apparatus of the invention. For example, if 8 analyses are to be run on one device, the heating block may be configured to accommodate 8 analysis units. In some embodiments, the means for moving the analysis unit may be used to move the analysis unit into thermal contact with the heating block. Heating may be accomplished using heating means known in the art.
Program optimization
The analysis procedure for analyzing a sample can be optimized in a number of ways. When multiple assays need to be run on a single sample, all procedures can be optimized to the most stringent reaction conditions, or each assay procedure can be optimized for the performance required for a particular assay.
In some embodiments, a single program may be designed to meet the testing requirements for all possible use cases. For example, on a multiplex cartridge, a single procedure may be specified depending on the circumstances (i.e., the limiting circumstances) in which all tests on that cartridge are to be performed. This procedure may be designed to meet minimum testing requirements such as accuracy and dynamic range of tests performed on the cartridge. However, this method is not optimal for alternative uses, such as when only a portion of the cartridge is to be tested. In these cases, some assays may improve performance in terms of sensitivity and accuracy by using more samples. A trade-off can be made between how many samples to allocate for an analysis and the sensitivity of the analysis. For example, for a sample diluted 1: assay with a sensitivity of 1 unit/mL at 100, if the dilution factor is increased to 1: 10, it can detect 0.1 unit/mL. One disadvantage of using a lower dilution factor in a multiplexed analysis system with a limited sample volume may be that the fraction of sample required for this analysis increases by a factor of 10 even with the smallest volume to be analyzed. Also, the accuracy of the analysis can be improved by using higher sample concentrations. For example, an assay that yields a signal at its detection limit of, for example, 0.1 absorbance +/-0.02 (20% signal inaccuracy) can be enhanced by using a 10-fold sample concentration such that when the analyte concentration is ten times lower, the signal is 0.1+/10.02OD, the resulting signal is 10-fold higher, and at a signal of 1.0, +/-0.02, the inaccuracy is now only 2%. This occurs because the analytical signal (at lower analyte concentration ranges) is generally proportional to the analyte concentration (and thus to the sample concentration), whereas signal inaccuracies can generally correlate to the square root of the signal, thereby increasing with the square root of the analyte concentration (and sample concentration). Thus, the Coefficient of Variation (CV) of a signal may be inversely proportional to the square root of the signal; so that a 10-fold increase in signal corresponds to an approximately 3-fold decrease in signal CV. Since the concentration CV is usually directly related to the signal CV, the concentration CV decreases as the sample concentration increases (dilution is decreased).
The program may be optimized for a particular use case rather than the typical one size fit all requirements described above. For example, the program may be optimized to improve the accuracy of the various tests performed in the multiplexing device. In addition, some tests may have a higher priority for optimization than others. Program optimization can be pre-computed for a known use case in advance. Program optimization can also be performed in real time for new use cases that are unknown a priori. System validation may be performed to encompass the full set of use cases.
One example of program optimization is described below by comparing two use cases. Both use cases provided 8uL of undiluted sample for the required testing. In this example, there are 20 tests on the multiplex cartridge, with 5 tests requiring dilution 1: 5, other 15 tests required dilution 1: 25.
in the first use case, all tests are required on the sample. The procedure for this use case (use case B) is as follows:
1)1: 5 dilution preparation (8uL sample +32uL diluent)
2)1: 25 dilution preparation (15uL 1: 5 sample +60uL diluent)
3) For each test (n-20), 5uL of appropriately diluted sample was mixed with 10uL of reagent. The concentration inaccuracy of this procedure in all 20 tests was 10% CV, meeting the minimum requirement. For each 1: 5 dilution analysis, sample amount 1uL, and for each 1: the assay was diluted 25 and the sample was used in 0.2uL (total 5 × 1+15 × 0.2 ═ 8uL, using up all available samples).
In a second use case (use case B) with the same cartridge type, only 10 tests are required on the sample, instead of all 20. In addition, all of these 10 tests will be performed in the use case a of 1: 25 dilution levels were complete. The program was optimized for this use case to maximize the accuracy of all tests by using lower dilutions (1: 5). The optimization procedure for this particular use case is as follows:
1)1: 5 dilution preparation (8uL sample +32uL diluent)
2) For each test (n-10), 4uL of diluted sample was mixed with 11uL of reagent
The sample amount was 0.8uL of undiluted sample per analysis, totaling 8 uL. Because the sample concentration in the assay is increased by a factor of 5 compared to the use case A, the assay sensitivity is increased by a factor of 5, and the assay inaccuracy is reduced by a factor of about 2.4(5^0.5) to about 4.5%.
By re-optimizing the program, use case B used 5 times the amount of the original sample in each test, thereby improving overall performance. Note that the above discussion does not account for inaccuracies due to volumetric errors, only accounting for errors due to inaccuracies in the measurement of the optical signal. In the use case B, the inaccuracy due to volume inaccuracies is lower, since it takes fewer pipetting steps. For example, if in both use cases, the volume inaccuracy is 5% of the inaccuracy due to the reported analyte concentration, the total analyte inaccuracy for use case A is 11.2% (10^2+5^2) ^0.5, compared to 6.5% (4.5^2+5^2) ^0.5 for use case B (the factors that lead to the analytical inaccuracy add as the square root of the sum of the squares of the sources of the inaccuracies, according to normal correct case assumptions).
The above effect can be more easily seen in the case of luminescence-based assays, where the assay signal is expressed as the number of photons emitted per unit time. As with radiation counting in, for example, radioimmunoassays, the signal inaccuracy is equal to the square root of the signal, so the signal CV is 100/(signal square root). For example, a signal of 10000 counts will have a CV of 1%. In many assays that generate photons (e.g., chemiluminescence immunoassays, the signal is nearly strictly proportional to the analyte concentration, at least in the lower concentration range). Thus, for concentrations well above the detection limit, the measured analyte imprecision is 1/(square root of signal). Therefore, in an assay using sample dilution, the measured analyte inaccuracy would be 1/(sample dilution). For example, use is made of 1: the signal and concentration CV for the assay at 100 sample dilutions were determined using a 1: about 3.2 times (10^0.5) the assay at 10 sample dilutions (but also with about 10 times higher sensitivity).
Chemistry of the reaction
A variety of assays may be performed on the fluidic devices of the present invention to detect an analyte of interest in a sample. In assays using labels, one label that can be used to perform a target assay can be selected from a wide variety of labels available in the art. In some embodiments, the label can be detected spectroscopically, photochemically, biochemically, electrochemically, immunochemically, or by other chemical means. For example, useful nucleic acid labels include fluorescent dyes, electron-dense reagents, and enzymes. A wide variety of labels suitable for labeling biological components are reported in both the scientific and patent literature and are generally suitable for use in the present invention to label biological components. Suitable labels include enzymes, fluorescent moieties, chemiluminescent moieties, bioluminescent moieties or colored labels. Reagents defining the specificity of the assay optionally include, for example, monoclonal antibodies, polyclonal antibodies, aptamers, proteins, nucleic acid probes, or other polymers, such as affinity media, carbohydrates, or lipids. Detection may be carried out using any of a variety of known means, including spectrophotometric or optical tracking of fluorescent or luminescent labels, or other methods of tracking individual molecules by size, charge, or affinity. The detectable moiety may be any material having a detectable physical or chemical property. Such detectable labels have been well developed in the fields of gel electrophoresis, column chromatography, solid matrices, spectrophotometric techniques, and the like, and in general, labels useful in such methods are applicable to the present invention. Thus, labels include, but are not limited to, any composition that can be detected spectroscopically, photochemically, biochemically, immunochemically, nucleic acid probe-based, electrical, photothermal, or other chemical means.
In some embodiments, a label (e.g., a chromogenic compound, fluorite, or an enzyme) is bound directly or indirectly to the molecule to be detected, according to methods well known in the art. In other embodiments, the label is linked to an analyte receptor (e.g., an antibody, nucleic acid probe, aptamer, etc.). As indicated above, a wide variety of labels are used, and the choice of label depends on the sensitivity required, ease of compound binding, stability requirements, available instrumentation, and processing specifications. The attachment of the non-radioactive label is often accomplished by indirect means. Generally, a receptor specific for the analyte is linked to a signal-generating moiety. In some cases, the analyte receptor is linked to an aptamer molecule (e.g., biotin or avidin), and the set of assay reagents includes a binding moiety (e.g., biotinylation reagent or avidin) that binds the aptamer and analyte. The analyte binds to a specific receptor on the reaction site. The labeled reagent may form a sandwich complex with the analyte in the middle. The reagent may also compete with the analyte for receptors on the reaction sites or bind to empty receptors on reaction sites not occupied by the analyte. The label is detectable by itself or is bound to a signaling system comprising a detectable enzyme, a fluorescent compound, a chemiluminescent compound or a chemiluminescent entity such as an enzyme having a photoluminescent substrate. Multiple ligands and counter-ligands may be used. When a ligand has a natural anti-ligand, such as biotin, thyroxine, digoxigenin and cortisol, it can be used with a labeled anti-ligand. Alternatively, any hapten or antigenic compound can be used in combination with the antibody.
Enzymes of interest for use as labels primarily include hydrolases, especially phosphatases, esterases and glycosidases, or oxidoreductases, especially peroxidases. The fluorescent compound comprises fluorescein and derivatives thereof, rhodamine and derivatives thereof, dansyl groups and umbelliferone. Chemiluminescent compounds include dioxetanes, acridinium esters, luminogens, and 2, 3-dihydronaphthyridinones, such as luminol.
Methods for detecting the label are well known to those skilled in the art. Thus, for example, where the label is a fluorescent label, the label may be detected by exciting the fluorochrome with light of an appropriate wavelength and detecting the resulting fluorescence, for example, by microscopy, visual inspection, via photographic film, using a digital camera, a Charge Coupled Device (CCD) or an electronic detector such as a photomultiplier and a photocell, or other detection means. Likewise, enzyme labels are detected by providing the enzyme with a suitable matrix and detecting the resulting reaction products spectrophotometrically or by digital imaging (subject of the invention). Finally, for simple colorimetric labels, detection can often be accomplished by simply observing the color associated with the label. For example, colloidal gold sols often exhibit a pink color, while fuel-doped microspheres exhibit an intense color.
In some embodiments, the detectable signal may be provided by a cold light source. The term "luminescence" is generally used to denote the light emitted from a substance for any reason other than its temperature increase. Generally, atoms or molecules emit photons of electromagnetic energy (e.g., light) as they transition from an excited state to a lower energy state (typically the ground state). If the excitation agent is a photon, the luminescence process is called photoluminescence or fluorescence. If the excitation cause is electrons, the luminescence process may be referred to as electroluminescence. More specifically, electrons are directly injected and removed to form electron-hole pairs, which are subsequently recombined to emit photons, thereby causing electroluminescence. Luminescence resulting from chemical reactions is commonly referred to as chemiluminescence. Luminescence produced by living organisms is commonly referred to as bioluminescence. If photoluminescence is caused by spin-allowed transitions (e.g., singlet-singlet transitions, triplet-triplet transitions), the photoluminescence process is commonly referred to as fluorescence. Generally, transient excited states can relax quickly through such spin-allowed transitions, thereby eliminating the cause of excitation, while fluorescence emission does not persist. If photoluminescence is caused by spin-forbidden transitions (e.g., triplet-singlet transitions), the photoluminescence process is commonly referred to as phosphorescence. In general, long-acting excited states can only relax through such spin-forbidden transitions, thereby eliminating the cause of excitation, while phosphorescent emission continues for a longer time thereafter. Luminescent labels may have any of the above properties.
Suitable chemiluminescent sources include compounds that are electronically excited via a chemical reaction and then emit light as a detectable signal or provide energy to a fluorescent acceptor. It has been found that different numbers of classes of compounds chemiluminescence occur under various conditions. One class of compounds is 2, 3-dihydro-1, 4-naphthyridinedione. One frequently used compound is luminol, a 5-amino compound. Other members of this class include 5-amino-6, 7, 8-trimethoxy-and dimethylamino [ ca ] benzene analogs. These compounds can luminesce with alkaline hydrogen peroxide or calcium hypochlorite and alkali. Another class of compounds is 2,4, 5-triphenylimidazoles, the common name of the parent product being loessine. Chemiluminescent analogs include p-dimethylamino and methoxy substituents. Chemiluminescence can also be achieved using oxalates, typically p-nitrophenyl and the like oxaloacrylates, and peroxides, such as hydrogen peroxide, under alkaline conditions. Other known useful chemiluminescent compounds include-N-alkyl acridinium esters and dioxetanes. Alternatively, luciferin may be used with luciferase or lucigenin to provide bioluminescence. Particularly preferred chemiluminescent sources are "photoluminescent" enzyme substrates such as dioxetane-phosphate. These do not emit light, but produce a luminescent product by the action of phosphatases such as alkaline phosphatase. It is particularly preferred to use a photoluminescent enzyme substrate, since enzymes are amplifiers capable of converting thousands of substrate molecules into product per second. Luminescence methods are also preferred because they can detect signals (light) over a wide dynamic range, with great sensitivity, using PMTs.
The term "analyte" as used herein includes, but is not limited to, drugs, prodrugs, medicaments, drug metabolites, expressed proteins and like biomarkers and cellular markers, antibodies, serum proteins, cholesterol and other metabolites, electrolytes, metal ions, polysaccharides, nucleic acids, biological analytes, biomarkers, genes, proteins, hormones, or any combination thereof. The analyte may be a combination of polypeptides, glycoproteins, polysaccharides, lipids, and nucleic acids.
The present system may be used to detect and/or quantify various analytes. For example, analytes that can be detected and/or quantified include albumin, alkaline phosphatase, ALT, AST, bilirubin (direct), bilirubin (total), Blood Urea Nitrogen (BUN), calcium, chloride, cholesterol, carbon dioxide (CO)2) Creatinine, gamma-glutamyl transpeptidase (GGT), globulin, glucose, HDL-cholesterol, hemoglobin, homocysteine, iron, lactate dehydrogenase, magnesium, phosphorus, potassium, sodium, total protein, triglycerides, and uric acid. Detection and/or quantification of these analytes may be performed using optical, electrical or any other type of measurement.
Of particular interest are biomarkers associated with a particular disease or particular disease stage. Such analytes include, but are not limited to, autoimmune diseases, obesity, hypertension, diabetes, neuronal and/or muscle wasting diseases, heart diseases, endocrine disorders, metabolic disorders, inflammation, cardiovascular diseases, sepsis, angiogenesis, cancer, senile dementia, motor complications, and any combination thereof.
Also of interest are biomarkers that are present in varying amounts in one or more body tissues affected by different diseases, including heart, liver, prostate, lung, kidney, bone marrow, blood, skin, bladder, brain, muscle, nerve and selected tissues, diseases such as different types of cancer (malignant or non-metastatic), autoimmune diseases, inflammatory or atrophic diseases.
Also of interest are analytes indicative of microorganisms, viruses or chlamydia. Examples of microorganisms include, but are not limited to, bacteria, viruses, fungi, and protozoa. Analytes that can be detected by the subject methods also include blood-borne pathogens selected from the non-limiting group consisting of staphylococcus epidermidis, escherichia coli, methicillin-resistant staphylococcus aureus (MSRA), staphylococcus aureus, hemolytic staphylococcus, enterococcus faecalis, pseudomonas aeruginosa, staphylococcus capitis, staphylococcus vaccae, klebsiella, haemophilus influenzae, mimococcus, streptococcus pneumoniae, and candida albicans.
Analytes that can be detected by the subject methods also include a variety of sexually transmitted diseases selected from the group consisting of: gonorrhea (neisseria gonorrhoeae), syphilis (syphilis spirillum), chlamydia (chlamydia trachomatis), non-gonococcal urethritis (ureaplasma urealyticum), yeast infections (candida albicans), chancroid (haemophilus chancroid), trichomoniasis (trichomonas vaginalis), genital herpes (HSV types I and II), HIV I, HIV II and hepatitis a, b, c, g, and hepatitis caused by TTV.
More analytes that can be detected by the subject methods include a variety of respiratory pathogens, including, but not limited to, Pseudomonas aeruginosa, methicillin-resistant Staphylococcus aureus (MSRA), Klebsiella pneumoniae, Haemophilus influenzae, Staphylococcus aureus, stenotrophomonas maltophilia, Haemophilus parainfluenzae, Escherichia coli, enterococcus faecalis, Serratia serrata, Vibrio parahaemolyticus, Enterobacter cloacae, Candida albicans, Moraxella catarrhalis, Streptococcus pneumoniae, Citrobacter freundii, enterococcus faecium, Klebsiella oxytoca, Pseudomonas fluorescens, Kanetherum meningitidis, Streptococcus pyogenes, Pneumocystis carinii pneumonia, Klebsiella pneumoniae, Legionella pneumophila, Mycoplasma pneumoniae, and Mycobacterium tuberculosis.
Further exemplary markers of the invention are listed below: theophylline, CRP, CKMB, PSA, myoglobin, CA125, progesterone, TxB2, 6-keto-PGF-1-alpha and theophylline, estradiol, luteinizing hormone, triglycerides, tryptase, low density lipoprotein cholesterol, high density lipoprotein cholesterol, IGFR.
Exemplary liver markers include, but are not limited to, LDH, (LD5), glutamic-pyruvic transaminase (ALT), arginase 1 (liver type), alpha-fetoprotein (AFP), alkaline phosphatase, lactate dehydrogenase, and bilirubin.
Exemplary kidney markers include, but are not limited to, TNFa receptor, cystatin C, lipocalin-type urinary prostaglandin D, synthetase (LPGDS), hepatocyte growth factor receptor, polycystin 2, polycystin 1, fibrocystic protein, uromodulin, alanine, aminopeptidase, N-acetyl-B-D-glucosaminidase, albumin, and Retinol Binding Protein (RBP).
Exemplary cardiac markers include, but are not limited to, troponin I (TnI), troponin T (TnT), Creatine Kinase (CK), CKMB, myoglobin, Fatty Acid Binding Protein (FABP), C-reactive protein (CRP), fibrinogen D-dimer, S-100 protein, Brain Natriuretic Peptide (BNP), NT-proBNP, PAPP-A, Myeloperoxidase (MPO), glycogen phosphorylase isoenzyme BB (GPBB), Thrombin Activated Fibrinolysis Inhibitor (TAFI), fibrinogen, IschemicA Modified Albumin (IMA), cardiac dystrophy protein 1, and MLC-I (myosin light chain-I).
Exemplary pancreatic markers include, but are not limited to, amylase, pancreatitis-associated protein (PAP-1), and REG.
Exemplary muscle markers include, but are not limited to, myostatin.
Exemplary blood markers include, but are not limited to, Erythropoietin (EPO).
Exemplary bone markers include, but are not limited to, bone type I collagen cross-linking amino terminal peptide (NTx), collagen cross-linking carboxy terminal peptide, lysine-pyridinoline (deoxypyridinoline), pyridinoline, tartrate-resistant acid phosphatase, type I procollagen carboxy terminal propeptide, type I procollagen amino terminal propeptide, osteocalcin (bone gla protein), alkaline phosphatase, cathepsin K, COMP (cartilage oligomer matrix protein), osteocalcin, Osteoprotegerin (OPG), RANKL, ansrk, TRAP 5(TRACP 5), specific osteoblast factor 1(OSF-1, pleiotropic protein), soluble cell adhesion molecule, sTfR, sCD4, sCD8, sCD44, and specific osteoblast factor 2(OSF-2, periostin).
In some embodiments, the markers of the invention are disease specific. Exemplary cancer markers include, but are not limited to, PSA (total prostate specific antigen), creatinine, prostatic acid phosphatase, PSA complex, prostate specific gene 1, CA 12-5, carcinoembryonic antigen (CEA), alpha-fetoprotein (AFP), hCG (human chorionic gonadotropin), inhibin, CAA ovarian C1824, CA 27.29, CA 15-3, CAA breast C1924, Her-2, pancreas, CA 19-9, CAA pancreas, neuron-specific enolase, cancer cell angiostatin DcR3 (soluble trap receptor 3), endostatin, Ep-CAM (MK-1), free immunoglobulin kappa light chain, free immunoglobulin lambda light chain, Herstatin, chromogranin A, adrenomedullin, integrin, epidermal growth factor receptor-tyrosine kinase, VEGF receptor, VEGF, and VEGF, An N-terminal 20 peptide of an adrenomedullin precursor, a vascular endothelial growth factor receptor, a stem cell factor receptor, a c-kit/KDR, a KDR and a midkine.
Exemplary infectious disease conditions include, but are not limited to: viremia, bacteremia, sepsis, and markers: PMN elastase, PMN elastase/alpha 1-PI complex, surfactant protein D (SP-D), HBVc antigen, HBVs antigen, anti-HBVc, anti-HIV, inhibitory T cell antigen, T cell antigen ratio, helper T cell antigen, anti-HCV, pyrogen, p24 antigen, muramyl dipeptide.
Exemplary diabetes markers include, but are not limited to, C-peptide, hemoglobin A1C, glycated albumin, advanced glycation end products (AGE), 1, 5-anhydroglucitol, gastric inhibitory polypeptide, glucose, hemoglobin A1C, ANGPTL3, and 4.
Exemplary inflammatory markers include, but are not limited to, Rheumatoid Factor (RF), antinuclear antibodies (ANA), C-reactive protein (CRP), clara cell protein (uteroglobulin).
Exemplary allergy markers include, but are not limited to, total IgE and specific IgE.
Exemplary autism markers include, but are not limited to, activation of ceruloplasmin, metallothionein, zinc, copper, B6, B12, glutathione, alkaline phosphatase, and apo-alkaline phosphatase.
Exemplary markers for blood clotting disorders include, but are not limited to, b-thromboglobulin, platelet factor 4, Wireweld factor.
In some embodiments, the marker may be specific to the treatment. Markers indicative of the effect of COX inhibitors include, but are not limited to, TxB2(Cox-1), 6-keto-PGF-1-alpha (Cox 2), 11-dehydro-TxB-1 a (Cox-1).
Other markers of the invention include, but are not limited to, leptin receptor and procalcitonin, brain S100 protein, substance P, 8-iso-PGF-2 a.
Exemplary senescence markers include, but are not limited to, neuron-specific enolase, GFAP, and S100B.
Exemplary nutritional status markers include, but are not limited to, prealbumin, albumin, Retinol Binding Protein (RBP), transferrin, aminoacyl protein (ASP), adiponectin, agouti-related protein (AgRP), angiopoietin-like protein 4(ANGPTL4, FIAF), C peptide, AFABP (adipocyte-type fatty acid binding protein, FABP4), aminoacyl protein (ASP), EFABP (epidermal fatty acid binding protein, FABP5), glucagon-like peptide 1, glucagon-like peptide 2, ghrelin, insulin, leptin receptor, PYY, RELMs, resistin, and sTfR (soluble transferrin receptor).
Exemplary lipid metabolism state markers include, but are not limited to, apolipoprotein(s), Apo-A1, Apo-B, Apo-C-CII, Apo-D, Apo-E.
Exemplary markers of hemagglutination status include, but are not limited to, factor I: fibrinogen, factor II: prothrombin, factor III: tissue factor, factor IV: calcium, factor V: procoagulant fibrinogen, factor VI, factor VII: conversion accelerating factor precursor, factor VIII: anti-hemolytic factor, factor IX: kresims factor, factor X: stuart factor, factor XI: plasma thromboplastin precursor, factor XII: hageman factor, factor XIII: fibrin stabilizing factor, prekallikrein, high molecular weight kininogen, protein C, protein S, D-dimer, tissue plasminogen activator, plasminogen, a 2-antiplasmin, plasminogen activator inhibitor 1(PAI 1).
Exemplary monoclonal antibodies include antibodies for EGFR, ErbB2, and IGF 1R.
Exemplary tyrosine kinase inhibitors include, but are not limited to, Ab1, Kit, PDGFR, Src, ErbB2, ErbB 4, EGFR, EphB, VEGFR1-4, PDGFRb, FLt3, FGFR, PKC, Met, Tie2, RAF, and TrkA.
Exemplary serine/threonine kinase inhibitors include, but are not limited to, AKT, AlaroA/B/B, CDK (pan), CDK1-2, VEGFR2, PDGFRb, CDK4/6, MEK1-2, mTOR, and PKC- β.
GPCR targets include, but are not limited to, histamine receptors, serotonin receptors, angiotensin receptors, adrenergic receptors, muscarinic acetylcholine receptors, GnRH receptors, dopamine receptors, prostaglandin receptors, and ADP receptors.
Cholesterol
The metabolites can be assayed by forming a colored product using an oxidase (e.g., cholesterol oxidase) to produce H2O2 and horseradish peroxidase, plus a chromogen (e.g., N-ethyl-N- (2-hydroxy-3-sulfopropyl) -3, 5-dimethoxyaniline, sodium salt [ "DAOS" plus aminoantipyrine ] to form a colored product, such as Trinder dye). An example of this chemistry is shown in fig. 52 and 53.
NADH or NADPH
NADH or NADPH is often produced or consumed in clinical assays. This is because these coenzymes are common substrates for enzymes. For example, the determination of clinically interesting enzymes such as Lactate Dehydrogenase (LDH) can be accomplished by the rate of NADH production. Because NADH absorbs most light at 340nm and (1) polystyrene and other plastics emit undesirable light in the near-ultraviolet, (2) white light sources produce essentially no light in the near-ultraviolet, and (3) camera and scanner sensors have low sensitivity to near-ultraviolet light, it is impractical to measure NADH using three-color image analysis. To solve this problem, NADH can be converted to a colored product using a tetrazolium salt such as water-soluble tetrazolium (e.g., WST-1 (Dojindo molecular technologies)) or an "electron mediator" such as 1-methoxy-5-methylphenazinium methyl sulfate (PMS).
In some embodiments, the analysis to generate or consume NADH or NADPH can be paired with other reactions that allow colorimetric assays to be performed. For example, NADH or NADPH can be used to reduce compounds such as 2- (4-iodophenyl) -3- (4-nitrophenyl) -5- (2, 4-disulfophenyl) -2H-tetrazole, monosodium salt (WST-1), and the like, to the following colored formazan dyes, by using phenazine methosulfate as an electron mediator, as shown in FIG. 54.
As shown in FIG. 73, when NADH, WST-1 and PMS were mixed in millimolar concentrations, a yellow product was produced (indicated as shown in the mixture tip).
LDH assays were set up according to this chemistry. Lactate (mM), NAD (mM), and LDH were mixed and incubated at 37C for 10 minutes, followed by the addition of WST-1 and PMS. For two-fold serial dilutions of LDH (1000IU/L) shown in figure 74 (left to right), the dose response of LDH versus OD 450nm values was good, as shown in figure 75.
Alkaline phosphatase
In other examples, assays using enzymes such as alkaline phosphatase can be assayed using chromogenic substrates such as p-nitrophenyl phosphate. The enzymatic reaction can produce p-nitrophenol which is yellow in color under alkaline conditions.
Metal ion
Assays such as those in which a colored complex is formed between a metal ion and a chelating dye, thereby changing color upon binding, can also be performed. For example, an o-cresolphthalein complexing agent (as shown in fig. 55) forms a complex with calcium, which has a different color than the reagent. The general protocol for such analysis is: chelate dyes (color 1) + M N+<->Chelate dyes: mN+: (color 2)
The optical signal of metal ion analysis can also be determined using metal-specific enzymes. For example, sodium ions can be enzymatically assayed by β -galactosidase activity against sodium, with o-nitrophenyl galactoside (ONPG) as the matrix. The absorbance of the product o-nitrophenyl at 405nm is directly proportional to the sodium concentration.
Enzyme-linked immunosorbent assay
The analyte can be determined by chromogenic enzyme-linked immunosorbent assay. A number of enzyme-linked immunosorbent assays are known which produce color using enzymes such as horseradish peroxidase, alkaline phosphatase and beta-galactosidase, respectively, and chromogenic substrates such as o-phenylenediamine, p-nitrophenyl phosphate and o-nitrophenylgalactoside.
Fluorescence immunoassay
Fluorescence immunoassay can also be performed. The assay may employ chemiluminescent entities such as enzymes with fluorescent substrates. Chemiluminescent compounds include, for example, dioxetanes, acridinium esters, luminogens, and 2, 3-dihydronaphthyridinediones, such as luminol.
Alternatively, suitable chemiluminescent sources include compounds that are electronically excited by a chemical reaction and then emit light as a detectable signal or provide energy to a fluorescent acceptor. It has been found that different numbers of classes of compounds chemiluminescence occur under various conditions. One class of compounds is 2, 3-dihydro-1, 4-naphthyridinedione. One frequently used compound is luminol, a 5-amino compound. Other members of this class include 5-amino-6, 7, 8-trimethoxy-and dimethylamino [ ca ] benzene analogs. These compounds can luminesce with alkaline hydrogen peroxide or calcium hypochlorite and alkali. Another class of compounds is 2,4, 5-triphenylimidazoles, the common name of the parent product being loessine. Chemiluminescent analogs include p-dimethylamino and methoxy substituents. Chemiluminescence can also be achieved using oxalates, typically p-nitrophenyl and the like oxaloacrylates, and peroxides, such as hydrogen peroxide, under alkaline conditions. Other known useful chemiluminescent compounds include-N-alkyl acridinium esters and dioxetanes. Alternatively, luciferin may be used with luciferase or lucigenin to provide bioluminescence.
Nucleic acid amplification
The analysis that may be performed also includes nucleic acid amplification. Examples of such assays are isothermal amplification and loop-mediated isothermal amplification assay (LAMP). Nucleic acid amplification can be used to generate visibly turbid, fluorescent or colored assay reaction products for analytes such as nucleic acid targets (genes, etc.). Nucleic acid amplification techniques can be used for isothermal amplification of specific DNA and RNA targets. Goto et al, "colorimetric detection of Loop-mediated isothermal amplification reactions Using hydroxynaphthol blue", Biotechnology, Vol.46, No. 3, 2009, 3.167-.
Nucleic acid amplification can be used to assay DNA and, when used with reverse transcriptase, RNA. When the reaction is initiated, the amplified product is detected by an intercalating dye or a chromogenic reagent that reacts with pyrophosphate produced and released as an amplification byproduct.
This reaction can be visually observed by color change (enhancement), fluorescence or turbidity. Very small numbers of DNA copies can be detected in less than 1 hour. In the present invention, this technique is conveniently read out using three-color image analysis. As shown below, the image of the reaction product of isothermal nucleic acid amplification assay can be determined by the following method: (1) backlighting (transmission optics) measures the light absorption rate, (2) captures an image of the light transmitted through the reaction product by a digital camera, or (3) illuminates a fluorescence image produced by the reaction product with a UV source (or any other suitable light source) and captured by a digital camera.
Nucleic acid amplification assays are generally performed in a "one-pot" format, wherein the sample and reagents are mixed in a sealed tube and incubated at elevated temperatures. In some forms, the reaction may be monitored in real time by changes in optical properties. In other assay formats, the reaction is stopped and the reaction product is visually observed after addition of a chromogenic or fluorogenic reagent. The present invention allows for the reading of nucleic acid amplification assay products either directly in the reaction vessel or after aspiration of the tip as described herein.
Turbidity of water
Optical turbidity analysis is also contemplated by the present invention. For example, immunoassays can be set up by measuring the aggregation of small latex particles (50-300 nm). In these assays, the particles may be coated with an antigen and/or antibody, which agglutinates when a binding partner, such as an antibody or antigen, is added to the sample. The assay can be set up directly (e.g., antibodies on the particle react with polyepitopic proteins or biomarkers) or in a competition mode (e.g., drug haptens on the particle react with anti-drug antibodies that compete with free drug in the sample). Latex dispersion becomes more hazy, and as light transmission decreases, haze can be measured using 3-color optics.
Also, assays based on agglutination of large latex particles (about 1um in diameter) or red blood cells can be determined. The analysis setup is similar to the turbidity analysis described above, but the amount and size of agglutinates can be interpreted using software, and the measurement done by image analysis (scanner or camera measurements).
The reagents required for the reaction chemistry may be contained in the cartridges described above, such as in a pipette tip. The reagents may be stored as liquids or dried, lyophilized or in a glassy state.
Localizing agents
In some embodiments, the location and configuration of the reaction sites is an important component in the assay device. Most, if not all, disposable immunoassay devices are provided with their capture surface as an integral part of the device.
In one embodiment, the molded plastic analysis unit is commercially available or made by injection molding and has a precise shape and size. For example, the characteristic dimension may be a diameter of 0.05-3 mm or a length of 3 to 30 mm. The units may be coated with capture reagents in a manner similar to that used to coat microtiter plates, but advantageously they may be placed in a large container for batch processing, coated reagents added, the devices processed and retrieved using screens, racks, etc., and cleaned as needed.
The analysis unit (e.g., comprising a tip, vessel, or any other vessel described herein) can provide a rigid support upon which reagents can be immobilized. The analysis unit may also be selected to provide characteristics suitable for interaction with light. For example, the analytical element may be made of a material such as functionalized glass, Si, Ge, GaAs, GaP, SiO2, SiN4, modified silicon, or any of a variety of gels or polymers, such as (poly) tetrafluoroethylene, (poly) vinylidene fluoride, polystyrene, polycarbonate, polypropylene, Polymethylmethacrylate (PMMA), acrylonitrile butadiene styrene copolymer (ABS), or combinations thereof. In one embodiment, the analysis unit comprises polystyrene. In some embodiments, the analysis unit may be made of a homogeneous material, a heterogeneous material, a coating material, a doping material, and/or an embedding material. Other suitable materials may be used in accordance with the present invention. Transparent reaction sites may be preferred. In addition, when there is an optically transmissive window to allow light to reach the optical detector, it is advantageous that the surface is opaque and/or preferably light scattering. In some embodiments, the analysis unit may be made of a transparent material. Alternatively, a part of the analysis unit may be made of a transparent material.
The analytical unit may be coated with a reagent and/or doped with a reagent. In some embodiments, the reagent may be a capture reagent capable of immobilizing a reactant on a capture surface. The reactant may be a cell and/or analyte, or any other reactant described elsewhere herein. In some embodiments, the agent can be a molecule that acts as a cell capture agent. The cell capture agent can be anchored to the surface of the desired cell during fluid transfer. In some embodiments, the capture reagent can be an antibody, a peptide, an organic molecule (e.g., which can have a lipid chain, a lipophilic molecule), a polymer matrix, a protein composite, a glycoprotein that can interact with a cell membrane. The capture reagent may be a molecule, cross-linked molecule, nanoparticle, nanostructure, and/or scaffold. In some embodiments, microstructures may be provided to become an analytical mechanism in the container. The capture reagent (which may include a capture structure formed from the analysis unit material) may allow the cells to be tethered, restrained, and/or trapped.
The capture reagent may immobilize a reactant such as a cell during processing. The capture techniques may be chemical, physical, electrical, magnetic, mechanical, size-dependent, density-dependent, or any combination thereof. In some embodiments, capture reagents can be used to concentrate reactants, such as cells, at a desired location. For example, the analysis unit may be coated with a capture reagent, which may allow the cells to be captured to the surface of the analysis unit, thereby concentrating the cells at the capture surface. The capture reagent can hold the captured reactant immobilized on the cell surface. This may help to keep reactants (e.g., cells, analytes) stationary during imaging.
In applications with long acquisition times for reaction and/or detection, immobilization of the reactants may be helpful. For example, multiple imaging applications may require longer exposure times (<1 minute) or imaging small objects with intense brownian motion (<1 um).
In some embodiments, the capture reagent may be made of a material that has little or no background for imaging. In some cases, the material of the analysis unit has little or no background to the imaging. The capture reagent may be selected so that it does not interfere or only minimally interferes with imaging and/or detection.
The reagent immobilized on the capture surface can be anything useful for detecting an analyte of interest in a bodily fluid sample. For example, such reagents include, but are not limited to, nucleic acid probes, antibodies, cell membrane receptors, monoclonal antibodies, antisera, and aptamers that react with a particular analyte. Various commercially available reagents may be used, such as a large number of polyclonal and monoclonal antibodies developed specifically for a particular analyte.
It will be appreciated by those skilled in the art that there are many ways in which different reactants can be immobilised to a support on which a reaction can take place. The immobilization may be covalent or non-covalent, by linker moieties, or by tethering them to the immobilization moiety. Non-limiting exemplary binding moieties for attaching a protein molecule, such as a nucleic acid or an antibody, to a solid support include streptavidin or avidin/biotin binding, carbamate binding, ester binding, amide, thiol ester, (N) -functionalized thiourea, functionalized maleimide, amino, disulfide, amide, hydrazone binding, and the like. In addition, the nucleic acid can be attached with a silyl moiety directly on a substrate such as glass using methods known in the art. Surface immobilization can also be achieved by poly-L-lysine plugs that provide charge-charge coupling to the surface.
After the last step of binding the capture surface, the analysis unit may be dried. For example, drying can be accomplished by passive exposure to a drying atmosphere or using a vacuum manifold and/or applying clean drying air through the manifold or by lyophilization.
The capture surface may be applied to the analysis unit using any technique. For example, the capture surface may be painted, printed, electrospray, embedded in the material, doped with the material, or any other technique. The capture reagent may be coated onto, incorporated into, co-permeated with, or made from the analysis unit material. For example, reagents such as capture reagents may be embedded in a polymer matrix that may be used as a sensor. In some embodiments, one or more small particles, such as nanoparticles, microparticles, and/or microspheres, may be coated onto and/or doped with an agent. In some embodiments, the capture reagent may be part of the analytical unit material itself, or may be added to the material.
In many embodiments, the analysis unit is designed to enable the unit to be manufactured in a high volume, rapid manufacturing process. For example, the tips may be mounted in a large-scale array so that the capture surface can be painted into or onto the tip in batches. In another example, the tips may be placed on a moving belt or rotating table for continuous processing. In yet another example, a large array of tips can be connected to vacuum and/or pressure manifolds for simple handling.
The capture reagent may be applied to the analysis unit at any point in the process. For example, the capture reagent may be applied to the analysis unit during the manufacturing process. The capture reagent may be applied to the analysis unit before the analysis unit is shipped to the destination. Alternatively, the capture reagent may be applied to the analysis unit after the analysis unit is shipped. In some cases, the capture reagent may be applied to the analysis unit at a point of use, such as a service site.
In some embodiments, the capture reagent may cover the entire surface or area of the analysis unit. The capture reagent may be applied to the inner surface of the analysis unit. In some embodiments, the capture reagent may cover a portion or part of the analysis unit. The capture reagent may be applied to the surface in a pattern. The unit may have a portion of the surface to which the capture reagent is applied and a portion of the surface to which the capture reagent is not applied. For example, there may be painted and unpainted areas. The capture reagent can be applied to the surface according to geometric choices of how the capture reagent is applied. For example, the capture reagent may be applied in dots, rows, columns, arrays, areas, circles, rings, or any other shape or pattern. The capture reagent may be applied at the desired surface location.
Multiple capture reagents can optionally be applied to one analytical unit. In some embodiments, multiple capture reagents can be applied such that different capture reagents do not overlap (e.g., different capture reagents are not applied to the same area or region). Alternatively, they may overlap (e.g., different capture reagents may be applied to the same area or region). A space without any capture reagent may or may not be provided in between the areas of different capture reagents. Different capture reagents may be used to immobilize different reactants. For example, different capture reagents may be used to immobilize different cells and/or analytes on the capture surface. By using multiple capture reagents in a pattern at the selection area, multiple reagents can be detected from the same analytical unit. In some embodiments, 2 or more, 3 or more, 4 or more, 5 or more, 7 or more, 10 or more, 15 or more, 20 or more, 30 or more, 40 or more, 70 or more, 100 or more, 150 or more, 200 or more, or 300 or more different capture reagents may be applied on the surface of one analysis unit. These different capture reagents may be applied in any pattern or shape. For example, different capture reagents may be applied in an array or continuous ring shape on the inner surface of one analysis unit. For example, different capture reagents may be applied to the inner surface of a tip, a vessel, a cuvette, or any other vessel described elsewhere herein.
The position of the different capture reagents on the analytical unit can be known before the captured reactants are detected. In some embodiments, the analysis unit may have an identifier that may indicate the type of analysis unit and/or the pattern in which the reagents are captured. Alternatively, the location of the different capture reagents on the analytical unit may be unknown prior to detection of the captured reactant. The location of the different capture reagents can be determined based on the pattern in which the captured reactants are detected.
The capture reagent may be applied using any technique, such as those described elsewhere herein. In some cases, different capture reagents may be applied using masking or lithographic techniques.
Any description herein of capture reagents and/or coatings applied to an analysis unit applies to any other unit or vessel described elsewhere herein, including but not limited to tips, vessels, test tubes, or reagent units.
Reagent assembly
In many embodiments of the invention, the reagent units are modular. The reagent unit can be designed to be manufactured in a high volume, rapid manufacturing process. For example, many reagent units can be simultaneously filled and sealed in a large scale process. The reagent units may be filled depending on the type of analysis to be performed by the device. For example, if one user requires a different analysis from another user, the reagent unit may be manufactured accordingly according to the preference of each user without manufacturing the entire device. In another example, the reagent units may be placed on a moving belt or a rotating table for continuous processing.
In another embodiment, the reagent unit is directly received in an aperture in the device housing. In this embodiment, the area of the enclosure surrounding the unit may be sealed.
Reagents of the invention include, but are not limited to, wash buffers, enzyme matrices, dilution buffers, conjugates, enzyme-labeled conjugates, DNA amplicons, sample diluents, wash solutions, sample pre-treatment reagents including additives such as detergents, polymers, chelators, albumin binding reagents, enzyme inhibitors, enzymes, anticoagulants, red blood cell agglutinating agents, antibodies, etc., or other materials necessary to run an assay on a device. The enzyme-labeled conjugate may be an enzyme-labeled polyclonal or monoclonal antibody that produces a detectable signal upon reaction with a suitable substrate. Non-limiting examples of such enzymes are alkaline phosphatase and horseradish peroxidase. In some embodiments, the reagent comprises an immunoassay reagent. Typically, reagents, particularly reagents that are less stable when mixed with liquids, are stored separately in a defined area (e.g., a reagent unit) within the device.
In some embodiments, the reagent unit contains about 5 microliters to about 1 milliliter of liquid. In some embodiments, the cell may contain about 20-200 microliters of liquid. In yet another embodiment, the reagent unit contains 100 microliters of liquid. In one embodiment, the reagent unit contains about 40 microliters of liquid. The volume of liquid in the reagent unit may vary depending on the type of analysis being run or the type of bodily fluid sample being provided. In one embodiment, the reagent volume need not be predetermined, but it must be more than the known minimum. In some embodiments, the reagents are initially stored dry and then dissolved at the beginning of an assay run on the device.
In one embodiment, the reagent unit may be filled using a siphon, funnel, pipette, syringe, needle, or a combination thereof. The reagent unit can be filled with liquid via a filling channel and a vacuum suction channel. The reagent units may be loaded individually or as part of a high volume manufacturing process.
In one embodiment, each individual reagent unit includes a different reagent as a means of isolating the reagents from each other. The reagent unit may also be used to contain a cleaning solution or matrix. Alternatively, the reagent unit may be adapted to contain a fluorescent matrix. In another embodiment, multiple reagents are contained in the same reagent unit.
In some cases, the device is configured such that the analysis unit and the reagent unit can be pre-calibrated before the disposable of the target device is assembled.
Aptamer binding assay
The present invention allows for a variety of assays to be performed based on the use of binding members that specifically bind to one or more analytes in a sample. Generally, a binding member that is a member of a binding pair is capable of specifically and selectively binding to the other member of the binding pair in the presence of a plurality of different molecules. Examples of binding elements include, but are not limited to, antibodies, antigens, metal binding ligands, nucleic acid probes and primers, receptors and reactants described herein, and aptamers. In some embodiments, the binding member for detecting an analyte is an aptamer. The term "aptamer" is used to refer to a peptide, nucleic acid, or combination thereof selected for the ability to specifically bind to one or more target analytes. Peptide aptamers are affinity agents, typically comprising one or more variable loop domains displayed on the surface of a scaffold protein. An aptamer is a specific binding oligonucleotide, an oligonucleotide that selectively forms a complex with a desired target analyte. This complexation is specific to the target because other materials, such as other analytes that may be with the target analyte, do not complex with the aptamer with as great an affinity. It is well known that both complexation and affinity are relative; however, in this context, "specific for a target" means that the aptamer binds to the target with much higher affinity than it binds to the contaminating material. Thus in this context, the meaning of specificity is similar to that applicable to e.g. antibodies. The aptamers can be prepared by any known method, including synthetic, recombinant, and purification methods. In addition, the term "aptamer" also includes "secondary aptamers" comprising consensus sequences derived from the comparison of two or more known aptamers to a particular target.
Typically, aptamers are about 9 to about 35 nucleotides in length. In some embodiments, the nucleic acid aptamer is at least 4, 5, 6, 7, 8, 9, 10, 11, 12, 13, 14, 15, 20, 25, 30, 35, 40, 45, 50, 55, 60, 65, 70, 80, 90, 100 or more residues long. Although the oligonucleotide of the aptamer is generally single-stranded or double-stranded, it is contemplated that the aptamer may sometimes have a triple-stranded or quadruplex structure. . In some embodiments, the nucleic acid aptamer is circular, such as described in US 20050176940. The aptamer specific binding oligonucleotide should contain sequence-conferring specificity, but may be extended via the flanking regions and may be derivatized or modified in other ways. Aptamers found to bind to target analytes can be isolated, sequenced, and then synthesized again as conventional DNA or RNA moieties, or can be modified oligomers. Such modifications include, but are not limited to, the following: (1) modified or analogous forms of carbohydrates (e.g., ribo-saccharides and deoxyribose); (2) (ii) an alternative linking group; or (3) analogous forms of purine and pyrimidine bases.
Aptamers may include DNA, RNA, functionalized or modified nucleic acid bases, nucleic acid analogs, modified or alternative backbone chemistry, or combinations thereof. The oligonucleotide of the aptamer may comprise the conventional bases adenine, guanine, cytosine and thymine or uridine. Included within the term "aptamer" are synthetic aptamers that incorporate analogous forms of purines and pyrimidines. The "analogous" forms of purines and pyrimidines are forms well known in the art, many of which are used as chemotherapeutic agents. Non-limiting examples of purine and pyrimidine-like forms (i.e., base analogs) include aziridinylcytosine, 4-acetylcytosine, 5-fluorouracil, 5-bromouracil, 5-carboxymethylaminomethyl-2-thiouracil, 5-carboxymethylaminomethyluracil, inosine, N6-isopentenyladenine, 1-methyladenine, 1-methylpseudouracil, 1-methylguanine, 1-methylinosine, 2-dimethylguanine, 2-methyladenine, 2-methylguanine, 3-methylcytosine, 5-methylcytosine, N6-methyladenine, 7-methylguanine, 5-methylaminomethyl-uracil, 5-methoxyaminomethyl-2-thiouracil, beta-D-mannose Q nucleoside, 5-methoxy uracil, 2-methyl-sulfur-N6-isopentenyladenine, uracil-5-oxyacetic acid methyl ester, pseudouracil, Q nucleoside, 2-thiocytosine, 5-methyl-2-thiouracil, 4-thiouracil, 5-methyluracil, uracil-5-oxyacetic acid, 5-pentynyl-uracil and 2, 6-diaminopurine. In the present invention, the use of uracil as a substituent for thymine (hereinafter referred to as "dU") in deoxyribonucleic acid is considered to be an "analogous" form of pyrimidine.
Aptamer oligonucleotides may comprise similar forms of nucleic acid sugars or deoxyribose, well known in the art, including, but not limited to, 2 ' substituted sugars such as 2 ' -O-methyl-, 2 ' -O-allyl, 2 ' -fluoro-or 2 ' -azido-nucleic acid sugars, carbocyclic sugar analogs, α -anomeric sugars, epimeric sugars such as arabinose, xylose, or lyxose, pyranoses, furanoses, sedoheptulose, Locked Nucleic Acids (LNAs), Peptide Nucleic Acids (PNAs), acyclic analogs, and abasic nucleoside analogs, such as methylriboside.
Aptamers may also include intermediates in their synthesis. For example, any of the hydroxyl groups typically present may be replaced with phosphonate groups, phosphate groups, protected with standard protecting groups, or activated to prepare additional linkages to additional nucleic acids or substrates. Conventionally, the 5' terminal OH is a free radical, but can be phosphorylated; the 3' OH substituent may also be phosphorylated. The hydroxyl groups may also be derivatized to standard protecting groups. One or more phosphodiester linkages may be replaced with an alternative linking group. These alternative linking groups include, but are not limited to, the following examples: wherein P (O) O is replaced by P (O) S ("thio"), by P (S) S ("dithio"), by P (O) NR 2 ("amidation"), by P (O) R, by P (O) OR ', by CO OR by CH 2 ("methylal"), wherein R OR R' are each independently H OR substituted OR unsubstituted alkyl (1-20C), optionally comprising an ether (-O-) linkage, aryl, alkenyl, cycloalkyl, cycloalkenyl OR aralkyl.
One specific example of an aptamer useful in the present invention is based on the RNA aptamers disclosed in U.S. patent nos. 5,270,163 and 5,475,096, which are incorporated herein by reference. The aforementioned patents disclose SELEX methods that involve making selections from a mixture of candidate oligonucleotides, and stepwise iterations of binding, isolation and amplification, using the same general selection scheme, to achieve almost any desired binding affinity and selectivity criteria. The SELEX method starts from a mixture of nucleic acids preferably comprising randomized sequence fragments and comprises the following steps: contacting the mixture with a target, such as a target analyte, under conditions conducive to binding, isolating unbound nucleic acids from those nucleic acids that specifically bind to the target molecule, isolating nucleic acid-target complexes, amplifying the nucleic acids isolated from the nucleic acid-target complexes to produce a ligand-enriched nucleic acid mixture, and then repeating the steps of binding, isolating and amplifying through a desired number of cycles to produce highly specific, high affinity nucleic acid ligands on the target molecule. In some embodiments, a negative screening is employed in which a plurality of aptamers are exposed to an analyte in a sample to be analyzed or other material that may be found with the analyte of interest, while only unbound aptamers are left behind.
The SELEX method involves the identification of high affinity nucleic acid ligands that contain modified nucleotides to confer improved properties to the ligand, such as improved in vivo stability or improved delivery properties. Examples of such modifications include chemical substitutions at the nucleic acid sugar and/or phosphate and/or base positions. In some embodiments, two or more aptamers are linked together to form a single, multivalent aptamer molecule. Multivalent aptamer molecules can include multiple copies of one aptamer, all targeting the same analyte, two or more different aptamers targeting different analytes, or a combination thereof.
Aptamers can be used as diagnostic and prognostic agents, such as agents for the discovery of novel therapies, agents for monitoring monomeric drug responses, and agents for the discovery of targets for novel therapies. The ligand may be used to detect, modify or interfere with or inhibit the function of one or more target analytes. The term "analyte" as used herein includes, but is not limited to, drugs, prodrugs, pharmaceutical agents, drug metabolites, biomarkers, such as expressed proteins and cell markers, antibodies, serum proteins, cholesterol and other metabolites, electrolytes, metal ions, polysaccharides, nucleic acids, biological analytes, biomarkers, genes, proteins, hormones, or any combination thereof. The analyte may be a combination of polypeptides, glycoproteins, polysaccharides, lipids, and nucleic acids. Aptamers can inhibit the function of a gene product by mechanisms including, but not limited to, any of the following: (i) modulating the affinity of protein-protein interactions; (ii) regulating the expression of the protein at the transcriptional level; (iii) regulating the expression of proteins at the post-transcriptional level; (iv) modulating protein activity; and (v) modulating protein position. The precise mechanism of peptide aptamer behavior can be determined by biochemical and genetic means in order to ascertain their specific function in the context of interaction with other genes and gene products.
The aptamer can be used to detect an analyte according to any of the detection protocols described herein. In one embodiment, the aptamer is covalently or non-covalently bound to the matrix. Non-limiting examples of substrates to which aptamers may be bound include microarrays, microspheres, pipette tips, sample transfer devices, test tubes, capillaries or other tubes, reaction chambers, or any other suitable format compatible with a target detection system. Biochip microarray production can employ various semiconductor manufacturing techniques such as solid phase chemistry, combinatorial chemistry, molecular biology, and robotics. One process that is commonly used is the photolithographic fabrication process for producing microarrays with millions of probes on a single chip. Alternatively, if the probes are pre-synthesized, they can be attached to the array surface by techniques such as microchannel pumping, "ink jet" spotting, stencil stamping, or photocrosslinking. An exemplary photolithography process first coats a quartz wafer with a photosensitive compound to prevent the quartz wafer from binding to the first nucleotide of the DNA probe to be fabricated. A photolithographic mask may be used to inhibit or allow light transmission to specific locations on the wafer surface. The surface is then contacted with a solution that may contain adenine, thymine, cytosine or guanine, with binding occurring only at those regions of the glass that are deprotected by illumination. The bound nucleotide has a photosensitive protecting group so that the cycle can be repeated. In this manner, probes are synthesized by repeated deprotection and binding cycles, thereby manufacturing a microarray. This process can be repeated until the probe reaches its full length. Commercially available arrays are typically manufactured at densities exceeding 130 million different features per array. Each wafer may be divided into tens or hundreds of individual arrays, depending on experimental requirements and the number of probes per array required.
Other methods may be used to produce biochips. The biochip can be a Langmuir-Bodgett film, functionalized glass, germanium, silicon, PTFE, polystyrene, gallium arsenide, gold, silver, film, nylon, PVP, or any other material known in the art that is capable of having amino, carboxyl, Diels-Alder reactants, thiol, or hydroxyl groups bound to its surface. These groups can then be covalently attached to the cross-linker such that subsequent attachment of the nucleic acid ligand and its interaction with the target molecule occurs in solution, unhindered by the biochip. Typical crosslinking groups include glycol oligomers, diamines, and amino acids. Alternatively, the aptamers can be bound to the array using an enzymatic procedure, as described in U.S. patent No. 20100240544.
In some embodiments, the aptamer is bound to the surface of the microsphere. Microspheres that can be used to bind to oligonucleotides are well known in the art and include magnetic, magnetizable and non-magnetic microspheres. The microspheres may be labeled with 1, 2, 3, 4, 5, 6, 7, 8, 9, 10 or more dyes to facilitate the encoding and identification of the aptamer bound thereto by the microspheres. At least 10, 50, 100, 200, 300, 400, 500, 600, 700, 800, 900, 1000, 1500, 2000, 5000 or more different microspheres in a single array may be distinguished by microsphere encoding, each microsphere corresponding to a different aptamer specific for a different analyte.
In some embodiments, the reagent is bound to a reaction chamber surface, such as a tip. For example, the interior surface of the tip may be coated with an aptamer specific for a single analyte. Alternatively, the internal surface of the tip may be coated with two or more aptamers specific for different analytes. When two or more different aptamers are bound to the same tip interior surface, each of the different aptamers may be bound to a different known location, such as to form different ordered rings or bands at different locations along the axis of the tip. In this case, a plurality of different analytes in the same sample may be analysed by aspirating the sample onto the tip and allowing the analytes in the sample to bind to aptamers coated at successive locations along the tip. Binding can then be visually observed, as described herein, with each band corresponding to a particular known analyte at a position in the patterned strip.
In some embodiments, binding of one or more aptamers to one or more target analytes can be detected by an optical signature. In some embodiments, the optical characteristic is fluorescence. In some embodiments, a sample containing an analyte to be analyzed is treated with a labeled compound to form a conjugate with the analyte having a fluorescent label. Binding can then be measured by fluorescence to detect the presence and optionally the amount of one or more analytes, as shown in figure 136, in combination with aptamers bound to the array, and as shown in figure 137, in combination with aptamers bound to the encoded microspheres. In some embodiments, the sample is treated with a labeling compound to form a conjugate with the analyte via a linker. After binding, the linker is functionalized with a fluorescent tag and this positive event is measured by fluorescence. In some embodiments, the analyte binding domain of the aptamer is partially hybridized to a fluorescently labeled complementary probe. After binding to the analyte, the complementary probe is released, resulting in an optically measurable decrease in the fluorescent signal. In some embodiments, the aptamer is fluorescently labeled and is partially hybridized to a complementary probe labeled with a fluorescence quencher, which is proximal to the fluorescent label. Upon binding to the analyte, the complementary probe is released, resulting in a measurable increase in fluorescence of the label conjugated to the aptamer. In some embodiments, the aptamer is partially hybridized to a complementary probe, the hybridization blocking a domain comprising the secondary structure. Upon binding to the analyte, the complementary probe is released and the secondary structure is provided to an intercalating dye that is used to generate a measurable signal. Labels useful for detecting binding between an aptamer and an analyte in a binding pair can include, for example, fluorescein, tetramethylrhodamine, Texas Red, or any other fluorescent molecule well known in the art. The level of label detected at each address on the biochip will vary depending on the amount of target analyte in the mixture being analyzed.
In some embodiments, the replaced complementary probe forms a conjugate with a member of a pair of affinity pairs, such as biotin. One detectable molecule is then conjugated to the other member of the affinity pair, such as an avidin. The conjugated detectable molecule is added after the test mixture is applied to the biochip. The number of detectable molecules at each site on the biochip will vary inversely with the number of target molecules present in the test mixture. In another embodiment, the replaced complementary probe will be biotinylated and can be detected by the addition of a fluorescently labeled antibiotic protein; the antibiotic protein itself is then linked to another fluorescently labeled, biotin conjugated compound. The biotin group on the substituted oligonucleotide may also be used to bind a reporter enzyme linked to an avidin; the enzyme will then catalyze a reaction that will cause the compounds that can be detected to break down. Alternatively, the reporter enzyme will catalyze the generation of an insoluble product that will locally quench the fluorescence of the intrinsically fluorescent biochip. In another embodiment of the replaced assay, the replaced complementary probe will be labeled with an immunodetectable probe such as digoxigenin. The replaced complementary probe will then be bound by a first set of antibodies that specifically recognize the probe. These first antibodies will then be recognized and bound by a second set of antibodies that are fluorescently labeled or conjugated with a reporter enzyme. Numerous variations of these samples are well known to those skilled in the art or will now be appreciated by them. An assay similar to the double antibody sandwich indirect ELISA method can also be set up using an antibody in combination with an aptamer as the receptor. For example, the capture surface may be functionalized with an aptamer, and the detection reagent may be an enzyme-labeled antibody. Conversely, the antibody may be located on the capture surface and the detection reagent is a labeled aptamer.
In some embodiments, a sample containing an analyte to be analyzed is dispersed into a three-dimensional hydrogel matrix. The hydrogel matrix can be activated to covalently trap proteins and small molecules. After washing the excess and unbound sample, a fluorescently labeled aptamer can be introduced to detect the presence of a particular analyte, as shown in FIG. 138. In some embodiments, the three-dimensional hydrogel matrix is divided into small portions or microwells to which a single aptamer may be added to allow for specific analysis of the analyte present. In some embodiments, the aptamer is tagged with a set of coded quantum dots or fluorescent tags corresponding to a unique signature. In some embodiments, the labeled aptamer is added to the three-dimensional hydrogel matrix simultaneously with the sample.
In some embodiments, aptamers are used in ELISA assays instead of antibodies. Generally, the sample is exposed to the surface and binds specifically or non-specifically thereto. In a sandwich ELISA, an analyte is specifically bound to a surface by binding to a first antibody that is bound to the surface. In a typical ELISA, the analyte, whether specifically or non-specifically bound, is detected by binding to a second antibody carrying a label. In an aptamer ELISA, the first antibody, the second antibody, or both are replaced with an aptamer specific for the analyte.
Image analysis of samples and analysis of reaction products
In some embodiments of the invention, the analysis of the sample and the analysis of the reaction products may be accomplished using digital imaging. The analysis tubes may be aligned, measured, and scanned or imaged in a single operation. In the instrument system of the invention, this is done automatically by mechanical means. The analysis tubes are located in a defined position in the cartridge and are moved to the scanner while maintaining the same positioning and spacing. The curve shown in fig. 92 corresponds to the green channel response over the entire cuvette width. As shown, the test tube edges are well defined, as are the locations corresponding to the middle of the test tube.
The image obtained by scanning or imaging may be a two-dimensional array of pixels, where each pixel includes a plurality of intensity values corresponding to different detection spectral regions (e.g., red, blue, green). The image may be interpreted by a line scan, which may correspond to a horizontal portion of the tip. If the tip is circular, the image line scans are deconvoluted according to a suitable function, thereby determining the effective absorbance. Example functions include parabolic functions and functions for circles. In some embodiments, data averaging may be performed on multiple images of the same tip or sample taken at multiple physical locations.
In one embodiment, a sensor is provided to determine the position of the analysis unit relative to the detector when a certain analysis is detected.
As shown in fig. 61 and 62, the bromophenol blue solution was aspirated into a set of conical tips and imaged under frontal illumination (light source and detector on the same side of the object). A series of small volume (5uL) dilutions of 0.78mg/mL solution were used for the highest concentration above the image. In FIG. 61, the left-hand tip has the sample at the widest position of the conical tip, whereas the right-hand tip has the sample at the narrowest position. The image in fig. 61 is taken by a scanning optical system.
Fig. 62 shows the use of a backlight configuration (light source and detector on opposite sides of the object being imaged). This backlight configuration is preferred because it achieves higher image quality.
As shown in FIGS. 61 and 62, the effective optical path length of the colored solution can be varied by changing the tip design. In particular, this path length can be varied in a single tip to increase the sensitivity of the measurement to light absorbance (long path length), or to increase the dynamic range of the measurement. For example, the path length can be varied by varying the diameter of the tip.
An additional feature of the tip design may enable the assay to read very small volumes of the assay reaction product, requiring very small volumes of sample. Typically, the assay reaction mixture is incubated at the narrow portion of the tip, and the ratio of liquid/air surface area to volume is high, thereby minimizing evaporation. This small volume can then be moved to the wide part of the tip to measure the coloured product, thereby maximising the optical path length available for a given reaction mixture volume (and thereby increasing the absorbance of light).
For example, in the following table, we compare readings for a 10uL assay reaction mixture, where a 1uL sample is diluted 1: 10. in the tip of the present invention, the reaction mixture may be incubated in a tip region of 13mm length and 1mm diameter and then moved to a region of 3mm diameter for color measurement. In comparison to the same analysis using standard sized microtiter plates (typically 384 well plates) for incubation and reading, the surface area of liquid exposed to air (allowing evaporation) is about 5 times smaller, while the optical path length is about twice as large.
Optimizing optical path length
Spectroscopic measurements of colored solutes have traditionally been made by recording the fraction of light transmitted through a cuvette at the wavelength of maximum absorption. The data is then converted to absorbance (a) or Optical Density (OD) values. According to beer's law, a (λ max) ═ M × L concentration, where M is the molar extinction coefficient (L/mol.cm), L is the optical path length (), and the concentration is in molar units. For l ═ 1, OD ═ a. This completes measurement a, which is directly proportional to the solute concentration.
There are two major limitations to analyzing solute concentrations by absorbance measurements. At low concentrations, the transmission changes very little, and variations in background (or blank) transmission can therefore cause inaccuracies. At high concentrations, transmission is very low (e.g., when a is 3, the transmitted light is 1/1000 times less than the incident light. any "stray" light or other forms of signal noise has a significant effect on the measurement, and the response to concentration becomes non-linear and inaccurate.
The method of the present invention readily enables color measurements over a wide dynamic range (up to 1000 times), thereby largely overcoming these problems.
1. Different path lengths: low concentrations can be measured over long path lengths, while high concentrations use short path lengths.
2. Different color channels: low concentrations can be measured in the best matching color channel, while high concentrations use color channels that do not match.
The data in fig. 79 illustrates this. Bromophenol blue solution obtained from serial dilutions of a 5mg/mL stock solution was analyzed by trichromatism at two positions in the tip, one position having a maximum path length of about 5mm ("wide") and the other position being about 1mm ("narrow"). The signals in the three color channels were normalized to their highest and lowest levels as shown in the following figure. An algorithm for optimal extraction of analyte (bromophenol blue) concentration was established as follows:
1. for normalized signals within the range of 10% max < signal < 90% max, the concentration value ═ a + b × Log (signal) + c × (Log (signal)) ^2, q where is an arbitrary constant, is calculated. This operation is performed for each color over both path lengths.
2. The best fit values for a, b and c are calculated for all colors and path lengths using a well-known optimization program (e.g., "Solver" in microsoft Excel).
3. The calculated density values are averaged for all colors and path lengths.
As shown in fig. 80, this method yielded accurate results over a 1000-fold concentration range. When this algorithm was used to calculate concentration values for repeated measurements (N-3), the average CV was 3.5%.
Measurements can be made over different path lengths. In some cases, the path length is at least partially dependent on the vessel (e.g., test tube, tip, vial) geometry. The receptacle geometry and/or features within the receptacle, such as dispersion features, may affect the optical path and path length within the receptacle.
Multicolor analysis
The scanner and camera have detectors capable of measuring a plurality of different color channels to detect spectral regions (e.g., red, green, blue). Because the spectral widths of each of these channels are wide and the color chemicals produce colored products with a wide bandwidth, multiple channels can be used to detect the colored reaction products using the spectrum. For example, FIG. 71 shows an image of the response of the spectra in the red (squares), green (diamonds), and blue (triangles) detection channels as a function of analyte concentration. The signal generated by each detector corresponds to the light intensity in each detected spectrum and is typically expressed as a number from 0 to 255. As indicated above, when white light is transmitted through a circular cross-section cuvette containing colored solutes, the light is absorbed and the intensity of the light is reduced, with a corresponding change in the detector.
For example, when bromophenol blue is dissolved in alkaline buffer at a concentration of 0 to 5mg/mL and scanned at the location labeled "C3" in FIG. 62, the signal shown in FIG. 66 is the detector response averaged over an area corresponding to 7 pixels along the length of the cuvette. The signal was recorded on an Epson scanning backlight. FIG. 66 shows a set of 11 tubes (left to right in the figure) containing 2-fold serial dilutions of bromophenol blue solution at 5mg/mL and a "blank" solution. The three color response of (c). An image of the scanned tip is shown in FIG. 67. The signal in each channel corresponding to the solution is attenuated to a degree correlated to the optical path. Accordingly, the largest signal change was observed in the middle of the tube. The dose-response curve shown in figure 68 is observed when the signal from the middle region of the tube is averaged (for the small rectangular marked region of the 4 th tube from the left) and plotted against bromophenol blue concentration. In each color "channel", the signal steadily decreases with concentration. The green signal changes most and the blue signal is least. The corresponding optical density measured with an M5 spectrometer (molecular device) at a wavelength with maximum absorbance (e.g., 589nm) is also shown. At the highest concentration, the spectrometer response is no longer linear and varies little with concentration. Similar effects were observed in the scanner green and red channel responses. In contrast, the blue channel response is very slight up to the maximum concentration.
Solution absorbance is equal to M concentration path length according to beer's law. The absorbance is defined as Log10 (transmission/blank transmission), where blank transmission corresponds to the transmission of the solvent. Strictly speaking, beer's law applies to a parallel column of monochromatic light (in practice a band several nm wide) passing perpendicularly through a rectangular tube. The spectrometer responds linearly with concentration up to an absorbance value of about 1.5. For higher absorbances, the instrument response becomes nonlinear due to "stray light" and other effects. Optical density is defined as the absorption of 1cm of optical path length.
In a conventional spectrometer, the color signal data obtained from the above experiment was converted according to the expression for linearized light transmission so as to obtain absorbance values (-Log (signal/blank signal)) proportional to concentration, the curves shown in fig. 69 being from green (square) and red (diamond) channels.
The green channel data followed beer's law, but the red channel data did not, and plateaus occurred for approximately 2mg/mL of sample, with a style similar to that of the spectrometer OD response.
Increasing analysis usage by tristimulus analysis and optical path length optimization
Analysis results from reaction equipment that would otherwise provide uninterpretable data can be salvaged using the present invention. The present invention expands the dynamic range and sensitivity of the analysis by combining optical path length optimization and tristimulus analysis. The inability to salvage data due to reduced dynamic range is a significant problem in analytical management, particularly when the sample being evaluated for diagnostic or therapeutic management purposes has the following background, the analytical dynamic range or range of analyte values that can be reported with high confidence is very limited. There are two main reasons why analytical results cannot be obtained from laboratory-based analytical systems or from distributed test cases. I.e. analyte values that are too high or too low to be reported. In some cases, this can be corrected in a clinical laboratory by re-analyzing a portion of the retained sample with a different dilution. In distributed testing, there is no other method than recalling a patient, taking a new sample and using a different (laboratory) method. This is because the assay system employs a fixed procedure and a fixed level of sample dilution. In both cases, it is very inconvenient and expensive to correct the problem. In addition, valuable information associated with proper diagnosis and/or treatment management can be lost, causing harm to the patient.
In the system of the present invention, these problems are eliminated by: monitoring the assay during its performance, finding any problems, modifying the optical path length for measuring the assay product, or utilizing different sensitivity levels of the three color channels to the assay color and consequently to the analyte sensitivity.
Specifically, when the analytical reaction product is measured, if the measured signal is too high or too low, the system may respond as follows:
1. measurements were made with different path lengths (moving the optical cuvette relative to the optical system, making the path length larger or smaller). This can be done by the following steps: (a) taking a measurement at a standard first location, (b) reporting the results to software that manages the analysis (in the instrument and/or on a remote server), (c) finding a problem condition, and (d) modifying the reading location and taking a second measurement; and/or
2. Emphasizing the more or less sensitive channels in the signal analysis. This can be done automatically by a suitable analysis algorithm.
Color calibration
The signal response can be calibrated to calculate the concentration of the colored species from the imaging data. The following procedure may be used to obtain a data transformation that predicts colored solute concentration.
1. For each channel of all concentrations, the conversion-Log (signal/blank signal) was calculated and designated "a".
2. For all concentrations, another transition ("C") is calculated from a + b A ^2+ C A ^3 (the initial values of a, b, and C are arbitrary values), -Log (Signal/blank signal), and is designated "A".
3. For all concentrations, the C values for all three color channels were summed and assigned as CValuation。
4. Target (known) concentrations and C were calculated for all concentrationsValuationThe sum of squared differences between them.
5. The a, b and c parameter values for all channels are derived using well known algorithms that minimize the sum of squared differences.
The results shown in fig. 70 show accurate calibration of the scanner response over the entire concentration range.
Other auto-calibration algorithms have been developed and found to be equally effective. For example, the following is an example of calibration performed on cholesterol analysis performed in a reaction tip.
The measured signal is decomposed into red (R), green (G) and blue (B) color channels. The calibration formula is calculated to optimize accuracy, precision and dynamic range according to the analytical design requirements.
In this analysis example, only the red and green channels were used to calculate the concentration. These two signals are converted to a calculation intermediate variable (F), as follows:
F=p1+p2·G+p3·G2+p4·R+p5·R2:
Wherein p isiAre calibration parameters.
Finally, the signal F is used to calculate the concentration (C) via linear transformation.
C=(F-p6)/p7
Where C is the calculated concentration, p6And p7Are calibration parameters, in this case intercept and slope parameters, respectively, representing a linear relationship.
When used in a large set of assays for multiple analytes, a colored product (lambda) covering the entire visible spectrum is producedMaximum ofIn the 400-700nm range) and the same method was used for the set of analyses, comparable results were obtained.
In conventional transmission spectroscopy measurements, a "blank" value is used for normalization of the measurement. Method (1), a blank is typically constructed by measuring a sample that is identical to the sample but does not contain any of the components to be determined. The measurement is usually performed in the same cuvette or in an optically identical cuvette for the sample. Thus, in spectroscopic analysis, the same procedure can be used to combine all reagents at the same concentration, replacing the sample with a zero analyte solution. Method (2) uses a two-step procedure to measure an absolute standard such as air (which never changes the absorbance), and then measures the sample and the blank based on the absolute standard. Subsequently, the blank value is subtracted from the sample value, thereby calculating the sample absorbance. Method (3) requires the collection of a sample or analysis of the spectrum of the reaction product and comparing the absorbance (or transmittance) measured at the optimum wavelength (typically the wavelength of highest absorbance of the substance being measured) with the absorbance at a wavelength for which the substance being measured is known to have zero absorbance. The absorbance is the difference between the absorbance recorded at these two wavelengths.
Digital cameras and tristimulus analysis may be employed, but in some embodiments may be varied according to the digital (pixilated) characteristics of the analysis signal. Namely:
1. for each pixel in the image and for each color, a white standard is imaged and the signal intensity is adjusted to a value corresponding to no absorption. This can be accomplished by the following exemplary procedure:
a. adjusting the intensity of a light source
b. Adjusting the (preferred) sensitivity of the detector, or
c. Software adaptation (not preferred per se)
A preferred embodiment is a combination of the above (b) and (c). First, the detector is tuned in the analog domain, and then the result is fine-tuned in the digital domain.
For analog adjustment, the amplifier gain and offset between the photosensor and the analog-to-digital section are adjusted to ensure maximum resolution of the digitization. The low end of the light range of interest will be set to zero and the low end of the range will be set just below the sensor saturation.
The image can then be fine-tuned in the digital domain. In particular, a preferred method is to use a method called "two-image calibration" for m × n images. The mechanism is to first block all light directed to the detector and collect a black image. We call this picture BLACK [ m, n ]. The second image recorded consists of light at the highest end of the sensitivity range. We call this image WHITE [ m, n ]. Thus, the calibration image a [ m, n ] may be constructed pixel by pixel as follows:
Note that this digital correction does not improve the dynamic range of the digitized data, but adjusts its value so that the entire white and black criteria remain consistent.
2. The image of the physical blank in the tip can be used as a pixel-by-pixel and color-by-color blank. This blank may be:
a. air;
b. water;
c. blank analysis reaction product (no analyte);
d. sample blank (no analytical reagent); or
e. Some combination of the above;
3. signals from color channels with zero or weak response may be used to normalize signals from other channels.
Another method of controlling and normalizing optics is to image a set of physical (stable) standards before or during analysis. For example, an array of printing dyes (as shown in fig. 104) can be prepared to correspond to a set of standard colors with standard intensities (similar to the standard "color wheels" used to calibrate cameras and scanners).
Such criteria can be measured using reflectance from an opaque surface or (preferably) transmittance through a transparent film.
Depending on the optical stability, the optical calibration and normalization can be (1) disposable, (2) performed periodically, or (3) performed for each analysis.
Calibrating digital imager range
In some embodiments, methods may be provided to calibrate a digital imager for imaging optical density.
When testing the optical density of an analyte, it is desirable to utilize as much of the dynamic range of the image as possible. For normal use, this equipment may include a relatively homogeneous illuminated white background, an imager, and an analyte to be tested in a transparent tube in between. In operation, this test may include placing the cuvette between the imager and a white backlight and measuring the amount of light absorbed by the analyte in the cuvette. To maximize the overall dynamic range of the sensor, this background can be sensed as the maximum intensity that can be measured. Care is taken not to saturate the sensor, since information is lost from sensor saturation and attenuation cannot be accurately measured. Such a system may be configured to efficiently maximize the measurement of the backlight while minimizing saturated pixels.
The illuminated background may emit white light of the same intensity over its entire surface. There may be some variation in light output that produces a normal distribution of pixel intensities as detected by the imager, as shown by the curve in fig. 128. For this example, the sensor may return a value between 0 and 256 from each pixel indicating the amount of light it receives. Each pixel may be saturated at a value of 256. In other words, only 256 values can be recorded regardless of whether the light intensity or sensor sensitivity is further increased. Series 1 in fig. 128 is a dotted line, showing the region of excessive light, which cuts off the normal curve. Series 3 is a dashed line showing that all pixels read the intensity correctly, but the imager sensitivity is lower than its sensitivity to maximum dynamic range. Most pixels have values below 200. Series 2 represents the desired setting where the mean of the distribution is as high as possible, but a sufficiently small number of pixels are saturated.
In one embodiment, the intensity of the backlight may be held constant and the imager settings may be adjusted. For the sensitivity of the imager, two control quantities can be used: exposure time and gain. The exposure time may be the amount of time that the sensor pixel is allowed to collect photons before the value is read out. For a given amount of light, this readout value may be larger as the exposure time becomes longer. This control may be a "coarse" control of the application. The amount of gain control may adjust the amount of amplification applied to the sensor signal. Increasing the gain increases the value of the signal emitted by the sensor. The gain may be "fine" control.
An exemplary procedure for setting imager sensitivity parameters may include one or more of the following:
1. the exposure time is set to a value known to be below saturation. The gain is set to the highest available value.
2. The binary search is started upwards and the exposure time is adjusted to find a setting where not all pixels are saturated in the region of interest in the image. The setting can be detected by observing the point at which the average pixel value becomes lower than 256.
3. The gain is gradually adjusted down until there are sufficiently few pixels at the saturation extremum. The number of pixels at an acceptable level is determined by the shape of the distribution. A wide standard deviation increases the number of pixels that are allowed to saturate.
Next, the white balance may be corrected. In a digital imager, there are three sets of sensors. Each group member collects light of a different wavelength, red, green or blue. When white light is detected, the sensor will preferably see the same value, or red, green and blue. The white balance control adjusts the relative gains of the red and blue channels. Since the light from the backlight is defined as white, this procedure will only adjust the white balance until the channel reads the same value. In practice, the green channel is usually not adjusted, while the red and blue channels change in opposite directions to each other as the control changes. In other embodiments, however, another channel, such as the red or blue channel, may not be adjusted, while the other two channels may be adjusted.
Finally, the imager can be trimmed in the digital domain. In particular, a preferred method is to use a method called "two-image calibration" for m × n images.
Analysis of the formation of various colored products has been analyzed in the present invention. The color emitted from those products with low wavelength absorption maxima (yellow) to those with high wavelength absorption maxima (blue) has been successfully measured. Some representative analysis wavelength maxima are: 405. 450, 500, 510, 540, 570, 612, and 620nm, indicating the ability to read color across the entire visible spectrum.
Color can be quantified using the average data of many pixels (typically about 1000). A good fit (e.g., maximum R) may be selected2) A parameter (f) of the dose-response data. This parameter may first be compared to the form a1+ b 1R + c 1R2+b2*G+c2*G2+b3*B+c2*B2Fitting, where a, B, c are constants, and R, G and B are the intensity values of the red, green and blue channels, respectively. Then, the parameter f may be forced to have a maximum value of 1 and a minimum value of 0, thereby deriving the parameter f. The parameter f is related to the transmission of light through the colored reaction product. As might be expected, f can be closely related to the parameter Optical Density (OD) used in spectrophotometry to quantify absorbing species. When 1-f, measured by 3-color imaging, is plotted against the OD measured by a spectrophotometer for the same analytical reaction product in a microtiter plate at the absorption maximum, it can be observed that 1-f is roughly linearly related to OD. In fig. 129, this data for five analyses is shown. OD can be normalized to "relative OD" ═ or (OD-OD)Minimum size)/(ODMaximum of–ODMinimum size). In some cases, the relationship is somewhat curved, but the correlation coefficient (R) is generally>0.99。
The parameter f can be used to calibrate the analysis measured by the 3-color imaging analysis. A smooth calibration relationship for a representative cholesterol assay, when plotted against analyte concentration, can be shown in graph 130. Deriving a formula relating concentration to f in the form of concentration a + b f + c f 2(where a, b, and c are constants), the calculated concentrations are substantially the same as the "nominal" (expected, desired) values (regression line slope), as shown in graph 130Degree near 1.0, intercept near 0.0, R20.998). Also shown in the graph 130 are images of the accuracy and precision of the analysis. The accuracy was near 100% (mean 100.2%) and the inaccuracy (expressed as CV%) was very low (less than 10%, mean CV 3.9%).
Simultaneous imaging of analysis
As shown in fig. 56, 57, 58, 59 and 60, several analytical elements (tips, wells, blots) can be imaged in parallel. Generally, these elements may be placed in known locations in the cartridge or mounted in a subsystem of the instrument so that a particular element may be associated with a particular assay. Even if these elements are not perfectly positioned or placed, image analysis can be used to correct any such mis-placement by locating features of the analysis elements.
Commercially available albumin (fig. 56) and cholesterol (fig. 57) were used for the analysis according to the manufacturer's instructions. A series of analyte concentrations in a clinically significant range were measured using a series of calibrators in which the analyte concentration was reduced by a factor of 2 from the highest concentration. In FIGS. 56 and 57, the analyte concentration is highest on the right, while the tip on the far left corresponds to zero analyte. The volume of the assay reaction mixture drawn into the tip was 20 uL.
Fig. 58, 59 and 60 show apertures that can be imaged in parallel. A set of shallow hemispherical holes is machined in a piece of white opaque plastic. In these wells, three commercially available color formation assays were performed and the reaction products were imaged. As described above, the rightmost well has the highest analyte concentration, while the concentration of each adjacent well is reduced by a factor of two, except for the leftmost well containing zero analyte. 7uL of assay reaction product was introduced into each well.
It is also possible to image the reaction product after it has been printed onto the porous film or paper, the image being formed after the liquid has penetrated into the medium. It is also possible to impregnate paper or film with any of a variety of analytical chemicals and, after addition of the sample, image the resulting reaction product.
Analysis of turbidity
Turbidity measurements are accomplished by measuring the decrease in intensity of the incident light after it has passed through the sample being measured. This technique is used where the result of the analysis is a dispersed precipitate that increases the opacity of the liquid.
Turbidity can be measured in latex agglutination assays. As a latex agglutination assay response model, polystyrene latex particles (1um diameter) were dispersed in buffer at a given concentration (w/v) and subjected to 3-color image analysis. As can be seen from figure 72, good responses were found in all three channels, which can be used to measure latex particle concentration and latex agglutination.
Analysis of agglutination
Similar to turbidity analysis, this system can be used to measure agglutination, red blood cell coagulation and inhibition thereof.
This system can be used for blood typing by erythrocyte agglutination. The blood was diluted and mixed with blood typing reagents (anti-a, anti-B, anti-D) from commercially available typing kits. B + type blood, as shown below, can be readily seen to have an appropriate agglutination response when the mixture is imaged. Furthermore, by measuring the change in the three colour signals, a quantitative measurement of agglutination can be obtained as shown in FIG. 78, as the image shown in FIG. 77 is scanned along the vertical axis of the tip. Larger changes are indicative of agglutination and can be detected in each color channel. It is clear that this method can be used to measure the extent of such agglutination reactions.
Shape recognition
The images may be analyzed for shape recognition. Shape recognition can be done at normal magnification and very high magnification. At high magnification, image analysis can be used to identify the size and shape of the cells. These techniques are commonly used for cell counting to determine the relative concentrations of red blood cells, white blood cells and platelets. Under normal magnification, shape recognition can be used to observe the state of the sample. Air bubbles and other defect identification techniques are used to ensure that the measured amount of liquid is properly aspirated and dispensed.
Analysing samples on solid matrices
Digital imaging with front illumination can also be used to read out the analytical response on the solid phase matrix as shown in FIG. 76. Potassium chloride solutions (0, 2, 4 and 8mM) were added to Reflotron potassium assay strips designed for use in reflectance analysis systems (Boehringer-Mannheim/Roche).
Analysis of sample quality
Specific sample characteristics can invalidate the assay results. For example, hemolysis causes potassium ions to leak from red blood cells to plasma, resulting in measurement of plasma or serum potassium ion concentrations that are falsely high. Similarly, jaundice and lipemia change the measured absorbance, which interferes with several chromogenic chemicals. In the present invention, we can detect and quantify such interfering substances using image analysis. Subsequently, the analysis that would give a false result can be (1) deleted from the results list submitted by the analysis system, or (2) the optical signal can be corrected to account for the measured level of the interfering agent. Figure 99 shows images of different types of serum samples (from left to right: hemolysis, lipemia, jaundice (yellow) and "normal").
Digital data analysis
According to conventional methods of data generation and calibration in analytical methods of generating and/or changing color, an analog signal representing a change in the absorption properties of an analytical mixture formed by mixing a sample with a reagent is typically measured. A portion of the reaction mixture is illuminated, and the light transmitted through or reflected by the portion impinges on a detector and is evaluated as an analog signal. The analytical mass determined by the combination of sample volume and mass, sample processing, analysis and analysis mixture, and the combination of physical elements that deliver the mixture to the optical system depends on the assumed mass of the physical system used.
In the present invention, we can image (1) the sample, (2) the sample processing procedure, and (3) the analytical mixture, and collect the data as a set of one or more digital images. Each pixel in the analysis mixture image represents a very small fraction of the population, but by averaging the 3-color signals from many pixels, we obtain an analysis signal that is at least as good as the signal obtained by conventional analog methods. However, while the conventional approach loses information on average, the present invention not only aggregates information, but also retains the details lost by the conventional approach. In this context, color-based assays include assays for metabolites, electrolytes, enzymes, biomarkers (by immunoassay), drugs (by immunoassay), and nucleic acid targets (by the "LAMP" technique). The same principle can be applied to assays using fluorescence and/or luminescence.
Volume confirmation and correction
The volume of a sample or any other material such as a liquid or solid can be determined optically by: the sample volume of the portion of the container containing the sample being observed can be determined mathematically by imaging a container of known internal dimensions. The solids measurement is mainly used to measure solids precipitated by centrifugation. The most common example is reading the volume of centrifuged red blood cells to determine hematocrit levels. Examples 6-11 and 16 describe the calculation of sample volumes and other measurements using image analysis. This may lead to improved analysis results. For example, if the target volume to be used is 10uL, whereas the solution of the invention determines that the actual volume is 8uL, the analysis system may correct the result according to the volume (in this example, the analyte concentration calculated from the assumption of a 10uL sample will be multiplied by 10/8).
Information about the actual sample and reagent volumes can be obtained by imaging the sample and reagent, which can be used to correct calculations used to detect and/or quantify the analyte in the sample.
As shown in many of the examples above, the use of imaging enables samples and analytical mixtures to be evaluated for quality and analytical response. In addition, imaging "tips" that serve as reaction vessels and sample acquisition means can achieve (1) accurate and precise sample and reagent volume measurements, and (2) use of such data to correct for any inaccuracies and/or inaccuracies in the analysis results due to volume errors. To do this, the tip may have an accurately and precisely known geometry (e.g. a tip formed by injection moulding). Repeated measurements of the tip by imaging showed that the dimensional accuracy was better than about 1%. If the pipetting of samples and reagents is less accurate and precise, it is possible to correct the results by knowing the actual volume (by image measurement).
For example, consider an assay whose response is directly proportional to the analyte concentration (as many of the assays described herein). A sample volume error of 10% can result in a 10% error in the value reported by the analytical system. But if this inaccurately dispensed sample volume is measured accurately (e.g., within 2% of the actual value), the system response can be corrected, with the error reduced from 10% to 2%. A corresponding correction can be made for volume errors in reagent volumes. The calibration algorithm depends on the response of the analysis system to the volume or knowledge of the individual analytical components (sample, reagents), and this information can be easily determined during the analysis progress and validation process.
Thus, the present invention provides various advantages as compared with the conventional art. The present invention enables detection of physical defects in the analysis tube, defects (bubbles, etc.) in the analysis mixture, when generating an "analysis signal". When these defects are found (image analysis), the analysis results can be rejected so that no false results occur or, preferably, the effect of the defects can be eliminated and an accurate analysis signal can be calculated.
Any and all defects can be detected when formulating the assay mixture: incorrect sample type (e.g., blood versus plasma), incorrect sample volume, for blood samples, failure to separate plasma from visible components (red and white blood cells), sample factors that can degrade the quality of the assay results (e.g., lipemia, jaundice, hemolysis, presence of precipitates or other unidentified inhomogeneities), formulation deficiencies of the assay mixture (e.g., presence of air bubbles, failure to mix well (color non-uniformity)), mechanisms for retrospective qualitative quantity assessment and detailed archival information preservation, mechanisms for measuring sample and reagent volumes (and correcting inaccuracies and/or inaccuracies in such volumes).
Evaluating therapeutic agents
In another embodiment, devices and methods are provided for monitoring more than one pharmacological parameter for assessing the efficacy and/or toxicity of a provided therapeutic agent. For example, a therapeutic agent may include any substance having a therapeutic function and/or potential. Such substances include, but are not limited to, biological or chemical complexes, such as simple or complex organic or inorganic molecules, peptides, proteins (e.g., antibodies), or polynucleotides (e.g., antisense). A large number of compounds can be synthesized, such as polymers, such as polypeptides and polynucleotides, and synthetic organic compounds based on various nuclear structures, and these can also be included as therapeutic agents. In addition, different natural sources may provide compounds for screening, such as plant or animal extracts, and the like. It is to be understood that although not always explicitly stated, the therapeutic agent may be used alone or in combination with other therapeutic agents having the same or different biological activity as the therapeutic agent identified by the inventive screen of the present invention. These therapeutic agents and methods are also intended for use in combination with other therapies. For example, small molecule drugs are often measured by mass spectrometers, which can lead to inaccuracies. ELISA (antibody-based) assays are much more accurate and precise.
Physiological parameters of the present invention include, but are not limited to, parameters such as temperature, heart rate/pulse, blood pressure, and respiratory rate. The pharmacodynamic parameters include protein and other biomarkers, nucleic acid, cell and cell marker concentration. Biomarkers can be indicative of disease or the result of drug action. Pharmacokinetic (PK) parameters of the invention include, but are not limited to, drug and drug metabolite concentrations. For proper safety and efficacy of a drug, real-time identification and quantification of PK parameters of a sample is highly desirable. If drug and metabolite concentrations are outside of desired ranges and/or unexpected metabolites are produced due to unexpected reactions of the drug, immediate action is required to ensure patient safety. Similarly, if any Pharmacokinetic (PK) parameters are not within the desired range during treatment, immediate action must be taken.
The ability to monitor the rate of change of analyte concentration or PD or PK parameters, or trend the concentration, PD or PK parameters, whether the drug or metabolite thereof, in a subject over a period of time helps prevent potentially dangerous situations. For example, if glucose is the analyte of interest, the glucose concentration in the sample at a given moment and the rate of change of the glucose concentration over a given period may be very useful to predict and avoid, for example, hypoglycemic events. Such trend analysis has broad beneficial implications for drug dose selection. When multiple drugs and their metabolites are involved, the ability to discover trends and take proactive steps is often desirable.
In some embodiments, the present invention provides a business method that assists clinicians in providing personalized medicine. Business methods may include post-prescription monitoring of drug treatments by monitoring biomarker trends over time. The method of operation may include collecting at least one pharmacological parameter from an individual receiving drug therapy, contacting a bodily fluid sample with a reagent contained in a fluid device provided to the individual to generate a detectable signal indicative of the at least one pharmacological parameter, thereby completing the collecting step; cross-referencing the at least one pharmacological parameter of the individual with the help of the computer medical record of the individual, thereby assisting the clinician in providing personalized medicine.
The devices, systems, and methods described herein enable the automated quantification of a patient's pharmacological parameters and the automated comparison of the parameters to, for example, a medical record of the patient that may include a history of parameter monitoring or a medical record of another group of subjects. For example, real-time analyte monitoring is coupled with an external device that can store data, which can also perform any type of data processing or algorithm, thereby providing a device that can assist in typical patient care, which can include, for example, comparing current patient data with past patient data. Accordingly, a business method is also provided herein that efficiently performs at least a portion of the patient monitoring currently performed by medical personnel.
Optical device for imaging samples and reaction products
Sample and reaction product analysis can be accomplished using optical equipment. The optical equipment may include a light source, an aperture and a sensor or detector. Fig. 100 and 101 are schematic diagrams of an optical apparatus. In some embodiments, the camera may be a Robotic C600 webcam, the camera sensor may be 1/3' 2.0MP (1600x1200) CMOS (MI-2010-SOC), and the lens may be glass with a standard object distance webcam lens (lens-to-object distance: 35 mm). The light source may be a Moritex white-edge light source MEBL-Cw25 (white) operating at 9.4 volts. The camera images may be taken in a sequence in which 1, 2, 3, 4 or more pipettes are moved into the optical path by the x-y-z stage.
In one embodiment, the detector is a reader assembly housing a detection assembly to detect a signal generated by at least one assay on the device. The detection assembly may be located above the device or at a different position relative to the device depending on, for example, the type of analysis being run and the detection mechanism being employed. The detection member may be moved into contact with the analysis unit, or the analysis unit may be moved into contact with the detection member.
The sensor may be a PMT, wide-area photodiode, avalanche photodiode, single-frequency photodiode, image sensor, CMOS chip, and CCD. The illumination source may be a laser, a monochromatic LED, a fluorescent lamp or broad-band light from an LED, an array of LEDs, a mixture of red, green and blue light sources, LED-activated phosphors, a fluorescent tube, incandescent light and an optical arc source, such as a flash tube.
In many cases, a light detector is provided and used as the detection means. Non-limiting examples include photodiodes, photomultiplier tubes (PMTs), photon counters, avalanche photodiodes, or charge-coupled devices (CCDs). In some embodiments, a PIN diode may be used. In some embodiments, a PIN diode may be combined with an amplifier to form a detection device with sensitivity comparable to a PMT. Some assays may produce luminescence, as described herein. In some embodiments, chemiluminescence is detected. In some embodiments, the detection assembly may include a plurality of fiber optic cables forming a bundle that is connected to a CCD detector or PMT array. The bundle may be formed of individual fibers or a plurality of small fibers fused together to form an integral bundle. Such whole bundles are commercially available and easily connected to a CCD detector.
The detector may also include a light source, such as a light bulb or a Light Emitting Diode (LED). The light source may illuminate the analysis for detecting the result. For example, the assay may be a fluorescence assay or an absorbance assay, as is commonly used in nucleic acid assays. The detector may also include optics such as lenses or optical fibers to route the light source to the analysis.
In some embodiments, the detection system may include a non-optical detector or sensor to detect a particular parameter of the object. Such sensors may include temperature, conductivity, potential signals, and current signals for oxidized or reducedCompounds, e.g. O2、H2O2And I2Or an organic compound that can be oxidized/reduced.
The illumination may be back-lit, front-lit, and oblique (side-) lit. Back-lighting can be used in general chemistry to detect light absorption (colorimetry) or scattering (turbidity). This arrangement has two forms, one is a broad, uniformly illuminated back field and the other is a beam of light of a specific shape, interrupted by the object. Forward illumination may be used for reflectance and fluorescence excitation. For reflection, the object is illuminated from the front by a light source, and measurement is performed by observing the light reflected by the object. The absorbed color yields the same information as the liquid under back illumination. For reflection, the object may also be illuminated by oblique illumination. Using oblique (from the side) illumination, the image has a 3-dimensional appearance and can highlight features that would otherwise not be visible. A newer technique based on this approach is huffman modulation phase contrast, which is built on an inverted microscope for cell culture. Oblique illumination has the same limitations as bright field microscopy (low contrast for many biological samples; low visible resolution due to object defocus), but can highlight features that are not otherwise visible.
In fluorescence excitation, the object may be illuminated from the front in order to achieve fluorescence illumination. These are typically monochromatic lights, most commonly lasers. A confocal laser scanning microscope is a common example. Oblique illumination may also be used for fluorescence excitation. In fluorescence cytometry, the object is excited, often at an angle, typically 90 degrees, at which decay photons emerge. This form of illumination enables scattering detection (backlighting) directly behind the object and side fluorescence emission.
In some embodiments, the fluorescence may be imaged at 90 degrees to the excitation beam. In fig. 102A, a photon source (S), typically a high brightness LED, passes through a beam diffuser (D) and a trim lens (L1) to generate a collimated or slowly diverging excitation beam. The excitation beam passes through a band-pass filter (F1) and illuminates a sample consisting of a vessel (tube, test tube or pipette tip) containing a sample solution with a fluorescent label. The isotropically emitted fluorescence is spectrally separated from the excitation light using a long or band-pass filter (F2) adapted to pass stokes shift fluorescence. The light is then imaged by a lens (L2) onto a digital camera (C) or other detector. By image analysis, the fluorescence intensity is extracted from the obtained image.
The image captured using the optical setup shown in fig. 102A generates a single tube image (as shown in fig. 103A). Successive experiments show the difference between the fluorescence intensities obtained from the negative and positive LAMP experiments with intercalating dyes.
In other embodiments, the transmitted light is optically filtered before being imaged to remove light at the excitation wavelength. In fig. 102B, a photon source (S), typically a high brightness LED, passes through a beam diffuser (D) and a trim lens (L1) to generate a slowly diverging elliptical excitation beam. The excitation beam passes through a band-pass filter (F1) and irradiates a sample in the form of an array of sample vessels (tubes, test tubes or pipette tips), each vessel containing a solution of a fluorescently labeled sample. The isotropically emitted fluorescence is spectrally separated from the excitation light using a long or band-pass filter (F2) adapted to pass stokes shift fluorescence. Subsequently, the light is imaged on the digital camera (C) through the camera lens (L2). By image analysis, the fluorescence intensity is extracted from the obtained image. The optical setup shown in fig. 103 can be used to simultaneously generate an array image of multiple tubes (as shown in fig. 103B).
For colorimetry, a preferred embodiment of sensing is to back-illuminate the object with white light, the result of which is sensed by the imaging sensor. In this example, the transmitted color absorption is measured.
For turbidity measurements, a preferred embodiment of sensing is to backlight the object with white light, the result of which is sensed by the imaging sensor. For turbidity measurements, the decrease in intensity of transmitted light was measured.
Luminescence measurements do not use illumination methods because the object emits photons itself. The emitted light may be weak light and may be detected using an extremely sensitive sensor such as a photomultiplier tube (PMT).
In some embodiments, imaging may be achieved using fluorescence, dark field illumination, or bright field illumination. Such imaging may be used for cytometry or other applications. Epi-fluorescent illumination may be achieved using three illumination sources having different wavelengths. In addition, two different sources may be used simultaneously if desired. Thus, the imaging platform can be used to image a wide variety of fluorescent dyes. The combination of the illumination source and the emission optics may be configured to implement multiple spectrally independent imaging channels.
Dark field illumination can be achieved by using (above or below the sample) ring illumination, a dark field abbe condenser, a dark field condenser with a toroidal mirror, an epi-dark field condenser built into the sleeve around the objective, or a combination of ring illumination and a table condenser with a light barrier. Fundamentally, these optical components produce a cone beam whose Numerical Aperture (NA) is greater than the NA of the objective lens used. The choice of illumination scheme depends on a number of considerations, such as required magnification, mechanical design considerations, imaging sensor size, and the like. Illumination schemes based on annular illumination generally provide uniform dark field illumination for a wider area, while the mechanical design of the overall system also has sufficient flexibility.
Bright field illumination can be achieved by using a white light source and a desk condenser to generate the keller illumination.
In some embodiments, an automatic filter wheel may be employed. The automatic filter wheel can control the imaging optical path to realize the imaging of a plurality of fluorophors in the same field of view.
In some embodiments, image-based autofocus may be implemented. The z-position (e.g., vertical position) of the objective lens (i.e., its distance from the sample) can be controlled using an image-based algorithm to achieve auto-focus. Briefly, a small image (e.g., 128x128 pixels) is captured quickly using dark field illumination. This image can be analyzed to derive an autofocus function, which is a measure of the sharpness of the image. The next z-position of the objective lens is calculated according to a fast search algorithm. The objective lens can be moved to a new z position and then another small image captured. This closed loop system does not require the use of any other hardware for focusing. The microscope stage may be connected to a computer-controlled stepper motor to effect translation in the X and Y directions (e.g., horizontally). At each position, the desired number of images are captured, and the table is then moved to the next XY position.
Imaging or other sensing may be performed with the aid of a detector. The detector may include a camera or other sensing device configured to convert electromagnetic radiation into an electronic signal. In one example, the camera may be a charge Coupled CCD (CCD) or electron multiplying CCD (emccd) camera. The detector may be a sensor, such as an active pixel sensor or a CMOS sensor. The detector may comprise a photomultiplier tube to detect the signal.
The detector may be in optical communication with a sample container (e.g., test tube, tip, vial). In some cases, the detector is in direct line of sight of the sample container. In other cases, the detector is in optical communication with the sample container with the aid of one or more optical devices such as lenses, mirrors, collimators, or a combination thereof.
Cell counting can be accomplished by imaging and blood cell counting. In case the object is illuminated with a bright field, a preferred embodiment is to illuminate the object with white light from the front and sense the cells with an imaging sensor. Subsequent digital processing will count the cells. If the cells are small or not, the preferred embodiment is to attach a fluorescent label and then irradiate the object field with laser light. Confocal scanning imaging is preferred. For flow cytometry, the object is labeled with a fluorescent label and then flows through a sensing device. There are two types of sensors, one positioned to back-illuminate the subject and measure the light beam scatter to determine if a cell is present. Another sensor arrangement is such that the illumination comes from the side and the fluorescence emitted from the marked object is measured.
End user system
The devices and systems, after being manufactured, may be shipped to the end user together or separately. The device or system of the present invention may be boxed with a user manual or instructions for use. In one embodiment, the system of the present invention is adapted to the type of analysis running on the different devices. Because the components of the device can be modular, a user need only have one system and a variety of devices or analytical or reagent units in order to run a large number of assays in a point-of-care or other distributed testing environment. In this context, the system may be reused with multiple devices and it is necessary to follow sensors on both the devices and the system to detect such changes, for example, during shipment. Pressure or temperature changes during shipment can affect the performance of various components of the present system, whereby sensors located on the device or system can communicate these changes to, for example, an external device so that adjustments can be made during calibration or data processing on the external device. For example, if the temperature of a liquid device is changed to a particular level during shipment, a sensor located on the device will detect the change and communicate this information to the system when the user inserts the device into the system. There may be an additional detection device in the system to accomplish these tasks, or such a device may be included in another system component. In some embodiments, information may be transmitted wirelessly to a system or external device, such as a personal computer or television. Likewise, sensors in the system may detect similar changes. In some embodiments, it is also desirable to install a sensor in the shipping package that can replace or be added in addition to the system components. For example, adverse conditions that may be sensed to cause failure of an analysis cartridge or system include exposure to temperatures in excess of the maximum tolerable, or a breach in the integrity of the cartridge, resulting in moisture infiltration.
In one embodiment, the system includes a communication component capable of wirelessly transmitting and receiving information from an external device. This wireless communication may be bluetooth or RTM technology. Various communication methods may be used, such as dial-up wired connections with modems, T1, ISDN, or cable line direct connections, and the like. In some embodiments, a wireless connection is established using an exemplary wireless network, such as a cellular telephone, a satellite or paging network, GPRS, or a local data transmission system, such as token ring over Ethernet or a local area network. In some embodiments, this information is encrypted before being transmitted over the wireless network. In some embodiments, the communication assembly may include a wireless infrared communication component to transmit and receive information. The system may include an integrated graphics card to facilitate information display.
In some embodiments, the communication component may include a memory or storage device, such as localized RAM, in which the collected information may be stored. If the information cannot be transmitted at a given time, for example because a wireless connection to the network is temporarily not possible, storage means are required. The information may be associated with a device identifier in the storage device. In some embodiments, the communication component may retry sending the stored information after a particular time.
In some embodiments, an external device communicates with the communication component in the reader component. The external device may communicate wirelessly or physically with the system, but may also communicate with third parties, including but not limited to medical personnel, clinicians, laboratory personnel, or others in the medical industry.
In some embodiments, the system may include an external device, such as a computer system, server, or other electronic device capable of storing or processing information. In some embodiments, the external device includes one or more computer systems, servers, or other electronic devices capable of storing or processing information. In some embodiments, the external device may include a patient information database, such as, but not limited to, a medical record or patient history, a clinical trial record, or a preclinical trial record. The external device may store a program to be run on the system, which may be passed to the communication component of the system when it receives an identifier indicating what device has been inserted into the system. In some embodiments, the procedure may depend on the device identifier. In some embodiments, the external device stores more than one program for each device. In other embodiments, the patient information on the external device includes more than one program. In some cases, the external device stores mathematical algorithms to process photon counts transmitted from the communication component and, in some embodiments, calculate analyte concentrations in the bodily fluid sample.
In some embodiments, the external device may include one or more servers, as is well known in the art. Such servers may provide load balancing, task management, and backup capabilities to prevent one or more servers or other components of the external device from failing and to increase the availability of the servers. As is well known in the art, the server may also be applied in a distributed network of storage and processor units, wherein the data processing according to the invention is located on a computer or the like workstation, thereby eliminating the need for a server.
The server may include a database and a system process. The database may be located in the server or may be located on another server system accessible to the server. Because the information in the database may include sensitive information, a security system may be applied to prevent unauthorized users from gaining access to the database.
An advantage of some of the features described herein is that information can be transmitted from an external device to the reader assembly, but also to other parties or other external devices, such as but not limited to a PDA or cell phone. Such communication may be achieved through the wireless networks disclosed herein. In some embodiments, the calculated analyte concentration or other patient information may be sent to, for example, but not limited to, medical personnel or the patient.
Accordingly, data generated using the subject devices and systems can be used to trend analyte concentrations in a subject over time.
Another advantage described herein is that the results of the analysis can be communicated substantially immediately to any third party who can benefit from obtaining such results. For example, when the analyte concentration is determined on an external device, it may be communicated to the patient or medical personnel who may need to take further action. This communication step with the third party can be performed wirelessly as described herein and by transmitting the data to the third party's handheld device, the third party can be notified of the results of the analysis at almost any time and at any location. Thus, in time critical situations, the patient can be contacted anywhere if emergency medical action is required.
As described elsewhere herein, imaging may be used for detection. Imaging may be used to detect one or more characteristics of the sample. For example, imaging can be used to detect the presence or absence of a sample. Imaging may be used to detect the position, orientation, volume or concentration of a sample. Imaging may be used to detect the presence, absence, and/or concentration of one or more analytes in a sample.
In some embodiments, a single measurement may be used to capture various information about the sample and/or analyte. For example, a single measurement may be used to capture information about the volume of the sample and the concentration of the analyte in the sample. A single measurement may be used to capture information about the presence and/or concentration of multiple analytes and/or the type of analyte in a sample. A single measurement may be used to capture information about 1, 2, or more information or types of information described herein.
Such imaging and detection may provide for more accurate and precise analysis, which may be advantageous in the case of small sample volumes as described elsewhere herein. Additional examples of sample volumes can include 500 μ L or less, 250 μ L or less, 200 μ L or less, 175 μ L or less, 150 μ L or less, 100 μ L or less, 80 μ L or less, 70 μ L or less, 60 μ L or less, 50 μ L or less, 30 μ L or less, 20 μ L or less, 15 μ L or less, 10 μ L or less, 8 μ L or less, 5 μ L or less, 1 μ L or less, 500nL or less, 300nL or less, 100nL or less, 50nL or less, 10nL or less, 1nL or less, 500pL or less, 250pL or less, 100pL or less, 50pL or less, 10pL or less, 5pL or less, or 1pL or less. In some embodiments, the sample volume may include less than or equal to about 3 drops, less than or equal to about 2 drops, or less than or equal to about 1 drop from a finger prick. Such a small volume is useful for point-of-service applications.
Such imaging and/or detection may provide an analysis with a low coefficient of variation. The coefficient of variation may be the ratio between the standard deviation and the absolute value of the mean. In one embodiment, the reaction and/or assay may have a Coefficient of Variation (CV) (also referred to herein as "relative standard deviation") of less than or equal to about 20%, 15%, 12%, 10%, 9%, 8%, 7%, 6%, 5%, 4%, 3%, 2%, 1%, 0.5%, 0.3%, or 0.1%. A single reaction and/or assay, or a process with multiple reactions and/or assays, may have a coefficient of variation of less than or equal to about 20%, 15%, 12%, 10%, 9%, 8%, 7%, 6%, 5%, 4%, 3%, 2%, 1%, 0.5%, 0.3%, or 0.1%. In some embodiments, one imaging and/or detection step, or a procedure having multiple imaging and/or detection steps, may have a coefficient of variation of less than or equal to about 20%, 15%, 12%, 10%, 9%, 8%, 7%, 6%, 5%, 4%, 3%, 2%, 1%, 0.5%, 0.3%, or 0.1%.
In some embodiments, imaging by a device that can be placed at a point-of-care location can improve the overall performance of the device. The accuracy and/or precision thereof may be improved and/or the coefficient of variation may be reduced. The performance of the device to process small samples, such as those described herein, can be improved. Imaging may be used with other detection systems, with other processes, or as a stand-alone system. The performance improvement may include a reduction in coefficient of variation by about 15%, 12%, 10%, 9%, 8%, 7%, 6%, 5%, 4%, 3%, 2%, 1%, 0.5%, 0.3%, or 0.1%.
Imaging may be used for one or more types of analysis or various types of detection applied by a sample manipulation procedure. Examples of such analysis or sample manipulation procedures may include centrifugation, separation, blood cell counting, immunoassay, ELISA, nucleic acid analysis, enzymatic analysis, colorimetry, or any other analysis or reaction type described elsewhere herein.
Imaging systems have multiple advantages over other methods in data acquisition, data processing, and result interpretation. The imaging system may maximize or improve the efficiency and use of small samples and enhance system-level performance. The imaging system may be used for detection as a stand-alone system or in combination with other detection systems or mechanisms.
In some systems, sensors and systems (e.g., photodiodes, photomultipliers, and associated optics/devices) may be used that do not generally provide any spatial information about the sample under study. Instead, these systems may collect information about the sample after the information is spatially integrated, often losing spatial information related to the sample. Although integration of the signal of the sample into the space may enhance the signal level detected by the sensor, advances in the sensitivity of optical and other sensors have made such integration unnecessary. Imaging detection may be used in place of such sensors, or may be used in conjunction with such sensors.
Imaging systems having one or more of the following advantageous features may be used. The imaging sensor may have a sensitivity and dynamic range that meets and/or exceeds that of conventional non-imaging sensors. The imaging device can maintain the spatial aspect of the sample under study, and has strong post-processing capability. Post-processing may include QA/QC (e.g., quality control, such as automated error detection and/or pathologist review), and/or point sensors with means to translate the sample relative to the acquisition optics/sensors, thereby enabling spatial reconstruction of the sample. The data collected from the imaging device may be processed to extract very specific information such as morphological features of the sample (such as cell count), data collected from selected image regions (fluorescence peak in the entire sample or in one cell in the image). The data collected from the imaging device allows for the assessment of signal variations across the sample being imaged. The data may be post-processed in order to calculate a mean, standard deviation, maximum, minimum, and/or other applicable statistical data for the entire sample or within any region of interest identified on the sample image. The imaging device acquires a plurality of images and compares changes in the images over time and space, thereby enabling the changes in the sample over time to be studied. Such as changes that are apparent during the pooling process (e.g., prothrombin time analysis) or that occur in time and space (e.g., chemical, physical, biological, electrical, morphological) in other samples. The imaging device may enable more rapid data acquisition of arrays, tissue slices, and other analysis/sample configurations.
Blood cell count
In some embodiments, any of the embodiments described herein can be adapted to enable the system to perform blood cell counts. Blood cell counting in the system (e.g., counting and functional analysis of cells) can be accomplished by image analysis. Blood may be processed using pipettes and centrifuges as described herein above. Generally, it is known that a measured volume of blood (1-50 uL) can be first centrifuged and then the plasma fraction removed. Subsequently, the cell fraction can be resuspended in buffer by repeated dispensing and aspiration with a pipette. The mixture of fluorescent antibodies can be directed to a selected cell marker (e.g., CD45, CD4, etc.). After a brief incubation, reagents can be added as leukocyte fixatives and erythrocyte lysing agents. After another incubation, the leukocytes can be collected by centrifugation and the supernatant lysate removed by aspiration. Stained leukocytes can be resuspended in a measured volume of buffer, typically less than the original blood volume (e.g., 1-20uL), and dispensed into a clear capillary channel for image analysis. In general, up to 3 or even 5 or more cell types can be imaged using antibodies with different fluorescent labels and/or antibodies labeled with different fluorescence/protein ratios. More than one reaction mixture may be used when more cell types have to be counted or analyzed. In some embodiments, the reaction mixture can be used to count or analyze various numbers of cell types.
In some embodiments, the capillary channel is typically about 10-100 um deep, 0.5-2 mm wide and 0.5-5 cm long. The capillary channel may have other dimensions including, but not limited to, those described elsewhere herein. The stained cell dispersion is typically filled into the channels by capillary action, allowing the cells to settle on the surface of the lower channels. One or more lasers or other light sources (e.g., LEDs) may be used to illuminate the channels. The optical train may have one or more optical elements, such as dichroic mirrors or lenses, and may or may not magnify the field of view. In some embodiments, the field of view may be magnified 2-100 times. A series of images can typically be acquired, representing a field of view of about 1mm x 0.5mm, and containing 1-10,000 cells (ideally 300 cells of interest) imaged onto a sensor having an area of about 1000x1000 pixels (1 million total).
A series of images representing adjacent portions of the channel may be acquired. A mechanical stage may be used to move the tunnel relative to the light source. In some cases, a servo mechanism may move the stage in a vertical direction in order to focus the image. In some embodiments, the light source or one or more optical elements may be moved relative to the stage to focus the image. Imaging is typically performed using one or more combinations of light sources and filters. The light source can be turned on and off as needed, while the filter is moved into the optical path. Preferably, up to 1000 cells of any given type can be counted. In other embodiments, a variety of numbers of cells of any given type may be counted, including but not limited to greater than, less than, or equal to about 1 cell, 5 cells, 10 cells, 30 cells, 50 cells, 100 cells, 150 cells, 200 cells, 300 cells, 500 cells, 700 cells, 1000 cells, 1500 cells, 2000 cells, 3000 cells, 5000 cells. The cells can be counted using available counting algorithms. Cells can be identified by their characteristic fluorescence, size and shape. The pattern recognition algorithm can be used to exclude stained cell debris and in most cases with aggregated cells, these can be excluded from analysis or interpreted as aggregates.
The blood cell counting platform may be an integrated automated microscopy device capable of performing the following tasks in a fully automated, controlled environment. One or more of the following tasks may occur in a cytometry application. The following tasks may occur in the order in which they occur or in other orders, or other tasks may be suitably substituted.
1. Isolation of blood cells of the type desired
2. Labelling cells with fluorescent and/or coloured dyes and/or microspheres
3. Confining a cell suspension in an optically compatible tube
4. Imaging cells using fluorescence microscopy, dark field illumination and/or bright field illumination
5. Automated analysis of images to extract desired cellular attributes
6. Automated analysis of the extracted information is accomplished using advanced statistical and classification methods to derive clinically reportable information.
In the following sections, various tasks are discussed in detail; images and sketches are provided where needed.
1. Isolating the desired type of blood cells. The desired type of blood cells can be isolated according to one or more embodiments described elsewhere herein. For example, such separation may be performed as described above with respect to a hemocytometer or centrifuge.
2. Cells are labeled with fluorescent and/or colored dyes and/or microspheres.
Specific fluorescent dyes may be used. The cells of interest may be incubated with a pre-dispensed solution of a fluorescent label binder (e.g., antibody, aptamer, etc.) specific for the label on the cells. The key consideration is to pair "bright" or high extinction coefficient and high quantum yield fluorescence with a label that has a lower binding capacity for cells; and vice versa. For example, the marker CD22 may be expressed on B lymphocytes at a level of about one tenth of CD 45. Based on this relative expression, CD22 can be labeled with a "light" dye, while CD45 can be labeled with a "darker" dye. The marker labeled using this technique may be an intracellular or cell surface marker. By using a secondary labeling scheme for the under-expressed markers, the sensitivity of detection and quantification can be increased. In brief, the primary binder may be conjugated to another molecule that is specifically recognized by the secondary binder. Then, the secondary binders labeled with a larger number of fluorophores can bind in situ with the primary binders and enhance the fluorescence signal. A solution to achieve this could be to use biotin conjugated to an anti-CD 22 antibody which in turn is recognised by an anti-biotin antibody labelled with Fluorescein Isothiocyanate (FITC). The use can greatly enhance the fluorescence signal. Fig. 123 provides an example of a fluorescence micrograph showing labeled granulocytes. This example shows fluorescence micrographs of human leukocytes labeled with Alexa-Fluor 647-anti-CD 45 in fixed, lysed blood samples. Pseudo-color protocols are used to enhance the different cognitive abilities between "bright" cells (with high CD45 expression) and "dark" cells (with low CD45 expression).
Staining of cell smears may also be used in the system. For example, StainRITETMThe manual program provided in Wright-Giemsa dye (Polysciences Inc.) can be automated and read in the practice of the present invention.
In some embodiments, non-specific fluorescent dyes may be used. To differentiate between subpopulations of granulocytes, the platform may also use fluorescent dyes that bind to nucleic acids (e.g., SYTO, Hoechst) or lipid membranes (e.g., Dil, DiD, FM-4-64).
3. The cell suspension was confined in an optically compatible tube.
In some embodiments, the platelet counting tube may be designed to confine a pre-labeled cell suspension having a fixed volume in a "channel" fabricated to provide optically clear imaging material above and below the cells. A sample may be introduced into the channel through the sample inlet. At some distance from the sample inlet, a vent allows air pressure to be released and the sample flows into the channel.
The channel can be sized to hold a predetermined known volume of liquid regardless of the volume dispensed at the sample inlet. Each cuvette may have multiple channels of the same and/or different volumes, each channel having at least one sample inlet and at least one vent.
The concentration of cells of interest in the sample can be adjusted during sample preparation so that, after being confined in the cuvette, the desired number of cells for each field of view in the imaging system can be achieved. One way to achieve this is to image the container with the cell dispersion and then measure the turbidity. Cell density can be calculated using a pre-established relationship between turbidity and cell count. Typically, the cell dispersion is made in a volume of buffer such that, with the cell count as low as possible, the cell concentration will be greater than the optimal value for image-based cell count. More buffer can then be added to bring the dispersion up to the optimum level.
The imaging portion of the cuvette may be designed to provide a sufficient number of cells for the application of interest. For example, counting a large number of RBCs may require counting only 1000 and 2000 cells, thus diluting the sample and requiring only a small imaging area in the tube. However, counting rare myeloblasts may require, in some cases, the ability to image more than 100000 (in total) cells. In this case, the system can concentrate the cell suspension so that 100000 cells can be imaged using a reasonable number of fields of view. Thus, the channel dedicated to RBC imaging on the cuvette is smaller than the mountainous area dedicated to myeloblast imaging.
The tube may be designed to be lifted by a standard pipetting mechanism in an automated manner so that the tube is transferred to the imaging platform. A tip ejector of the pipetting mechanism may push the test tube from the pipetting mechanism to the imaging platform. Positioning the cuvette to the imaging platform can be done in two steps. When the cuvette is transferred to the imaging platform, the static locating features on the cuvette may interact with mating features on the imaging platform, causing the cuvette to be parallel to the optical axis (X, Y location) of the imaging platform. Subsequently, positioning may be accomplished by a mechanism located on the imaging platform. This mechanism can bias the cuvette against a plane perpendicular to the optical axis of the imaging platform (Z-orientation), thereby confining the sample to the focal range of the imaging platform.
4. The cells are imaged using fluorescence microscopy, dark field illumination and/or bright field illumination. The method of cell imaging may also be used in other applications of the invention as described elsewhere herein. As noted above, the imaging techniques may be used for other imaging applications.
Illumination capability: the blood cell counting platform can be designed with three types of illumination protocols: epi-fluorescence, dark field, and bright field. Due to the modular nature of the equipment, phase contrast and Differential Interference Contrast (DIC) can also be integrated into the equipment.
Epi-fluorescent lighting can be achieved using three laser lines (e.g., 488nm, 532nm, and 640nm), but other laser sources, LEDs, and standard arc lamps (e.g., xenon, mercury, and halogen) can be integrated into the system due to the modular nature of the system. In addition, two different light sources may be used simultaneously if desired. Thus, the cytometry platform can be used to image a wide variety of fluorescent dyes. The combination of the illumination source and the emission optics may be configured to implement multiple (e.g., 3-5) spectrally independent imaging channels.
Dark field illumination can be achieved by using (above or below the sample) ring illumination, a dark field abbe condenser, a dark field condenser with a toroidal mirror, an epi-dark field condenser built into the sleeve around the objective, or a combination of ring illumination and a table condenser with a light barrier. Fundamentally, these optical components produce a cone beam whose Numerical Aperture (NA) is greater than the NA of the objective lens used. The choice of illumination scheme depends on a number of considerations, such as required magnification, mechanical design considerations, imaging sensor size, and the like. Illumination schemes based on annular illumination generally provide uniform dark field illumination for a wider area, while the mechanical design of the overall system also has sufficient flexibility. Fig. 124 is an example of an intracellular mode using a dark field image. This example shows different intracellular modes of human leukocytes in dark-field images. (a) A strong scattering pattern due to the presence of particles in eosinophils, (b) polymorphonuclear neutrophils with characteristic nucleolar lobes, and (c) cells without a high degree of optical scattering (lymphocytes or basophils).
Bright field illumination can be achieved by using a white light source and a desk condenser to generate the keller illumination. Fig. 126 is an example of a human whole blood bright-field image. This example is shown as a bright field image of a human whole blood smear stained by the Wright-Giemsa staining method. The characteristic pattern of human leukocyte staining is clearly visible. In these images, red blood cells having a characteristic shape can also be identified.
Automatic filter wheel: the automatic filter wheel may control the imaging optical path to achieve imaging of multiple phosphors in the same field of view.
Image-based autofocus: the cytometry platform can use an image-based algorithm to control the z-position (e.g., vertical position) of the objective lens (i.e., its distance from the sample) to achieve auto-focus. Briefly, a small image (e.g., 128x128 pixels) is captured quickly using dark field illumination. This image may be analyzed to derive an autofocus function, which may be used to measure the sharpness of the image. The next z-position of the objective lens is calculated according to a fast search algorithm. The objective lens can be moved to a new z position and then another small image captured. In some embodiments, this closed loop system does not require the use of any other hardware for focusing.
The table is translated: the microscope stage may be connected to a computer-controlled stepper motor to effect translation in the X and Y directions (e.g., horizontally). At each position, the desired number of images are captured, and the table is then moved to the next XY position.
An imaging sensor: a camera with a CCD, EMCCD, CMOS or in some cases a photomultiplier tube may be used to detect the signal.
5. The images are analyzed to extract the desired cell attributes.
The blood cell counting platform may use different illumination techniques to acquire images that exhibit different properties and characteristics of the cells. Labeling with a specific binder for a cell marker may indicate the extent to which the particular marker is expressed on the cell surface or within the cell. The dark field image may show the light scattering properties of the cell. In dark field images, the internal and external features of the cell that scatter more light appear brighter, while the features that scatter less light appear darker. Cells such as granulocytes have internal particles in the size range (100-500nm) that scatter a large amount of light and generally appear brighter in dark field images. In addition, the outer edges of any cell scatter light and appear as a bright ring of light. The diameter of this loop can directly give the size of the cell. Bright field images of cells may show cell size, dense phase material in the cells, and colored features within the cells (if the cells were previously stained).
The image processing library may extract one or more of the following information (but not limited to) for each cell:
1. Cell size
2. Quantitative measurement of cell granularity (also commonly referred to as "side scatter" in flow cytometry terminology)
3. Quantitative measurement of fluorescence in each imaged spectral channel after compensation for interference between spectral channels
4. Cell shape quantified by standard and custom attributes such as aspect ratio, friett diameter, kurtosis, moment of inertia, circularity, solidity, etc.
5. When cells are stained with a dye (not attached to an antibody or other type of receptor), cell color, color distribution, and shape.
6. Intracellular patterns of staining or scattering or color defined as quantitative measures of biological features, such as intracellular particle density in dark field images, or the number and size of nucleolar lobes in Giemsa-Wright staining images of polymorphonuclear neutrophils.
7. Co-localization of cellular features shown in different images
The library of image processing algorithms employed in this step may use a combination of image filtering, edge detection, template matching, automatic thresholding, morphological operations and shape analysis of the object.
6. Analysis of the extracted information is accomplished using advanced statistical and classification methods to derive clinically reportable information.
Any number of measured attributes can be extracted from the cell image. For example, each cell measurement attribute extracted from the image may be in the range of 7-15, thereby creating a 7-to 15-dimensional space in which each cell is a point. If n measured attributes are extracted from the image, an n-dimensional space can be provided in which each cell is a point.
From data acquired for a large number of cells (e.g., 100-100,000 cells), a complex n-dimensional scatter data set can be generated.
Statistical methods can be used to cluster the cells into separate populations in this n-dimensional space. These methods can also apply up-to-date knowledge from cell biology and hematology in clustering and cell population identification.
FIG. 125 is an example of multi-parameter data acquisition for a labeled cell sample. Human leukocytes were labeled with the leukocyte marker anti-CD 45-Alexa Fluor 700 (shown in green) and the B-cell marker anti-CD 22-APC (shown in red). Each channel showed a different CD45, CD22 expression and side scatter profile. Cells positive for CD22 and CD45 (B lymphocytes) showed characteristically low side scatter. On the other hand, neutrophils and eosinophils with high side scatter do not show the CD22 marker.
FIG. 127 is an example of quantitative multi-parameter data acquisition and analysis. For example, a histogram may be provided showing the intensity distribution of CD45 on human leukocytes. Any other image data distribution technique may be used to display the distribution. In some embodiments, a scatter plot of the side scatter may be provided. This side scatter can be determined from dark field image analysis of human leukocytes versus CD45 fluorescence intensity. This side scatter plot can show two major populations of granulocytes (upper left) and lymphocytes (lower right).
The above sections describe the major components and capabilities of the blood cell counting platform and applications. Based on these capabilities, various cell-based assays can be designed to work on this platform. For example, an analysis may be provided that performs a 5-part white blood cell classification. In this case, the number of cells per microliter of blood can be reported for the following leukocyte types: monocytes, lymphocytes, neutrophils, basophils and eosinophils. The basic strategy for developing such an analysis on a blood cell counting platform is to convert it into a problem in which some property of the white blood cells, such as side scatter, CD45 fluorescence intensity or CD20 fluorescence intensity, is measured so that in this n-dimensional space the white blood cells can be separated into (e.g., 5) distinct clusters. The region surrounding a population of cells may be positioned on a scatter plot in 2-dimensional space and termed a "gate" according to flow cytometry.
| Cell type
|
Door "
|
| Basophilic granulocytes
|
CD2/CRTH2/CD19/CD3 positive, SSC low, CD45, CD14/CD36 low
|
| Eosinophils
|
CD2/CRTH2/CD19/CD3 positive, SSC high, CD45 high, CD14/CD36 low
|
| Neutral white blood cell
|
CD2/CRTH2/CD19/CD3 negative, SSC high, in CD45 (less eosinophils)
|
| Lymphocytes
|
CD2/CRTH2/CD19/CD3 positive, SSC low, CD45 high, CD14/CD36 low
|
| Monocyte cell
|
CD2/CRTH2/CD19/CD3 negative, in SSC, in CD45, CD14/CD36 positive |
Using ordered samples, the blood cell counting platform and analysis system described herein may advantageously enable automated sample preparation and execution. In contrast to VCS (volume, conductivity, and scattering), the system and method also enable specific cell identification, which can improve identification confidence and reduce instances of validation testing. The image analysis described herein may also preserve the cell image for future required validation, analysis. An additional advantage is that morphological characteristics of the cells can be obtained. In some embodiments, dynamic adjustment of sample preparation and imaging parameters may be provided to process cell samples having a wide variety of concentrations.
In some embodiments, a centrifuge may be used to prepare and concentrate a population of cells. The method may include the use of a centrifuge in a cell preparation and imaging and analysis system as described elsewhere herein.
In some embodiments, a combination of dark field imaging and imaging of cells stained with multiple fluorescent antibodies may be used. Such a combination can provide an equivalent for FACS analysis in a device that is much simpler and less expensive than other techniques.
According to some embodiments of the invention, the systems and methods described herein may implement one or more of the following features. Such features are advantageous for various applications. In some embodiments, automated sample inspection and processing may be implemented. Such sample inspection and processing may include one or more of the following: sample mass, sample volume measurement, dilution (and dilution factor measurement), and separation of red and white blood cells from plasma.
An automated chemistry/analysis related process may also be employed. This may include precipitation, mixing or sedimentation.
In some embodiments, any and all assays that produce luminescence or change light (e.g., color chemicals) may be automatically measured. These may include one or more of the following techniques: spectrophotometry, fluorometry, luminescence measurement, turbidity measurement, nephelometry, refraction measurement, 3-color image analysis, polarimetry, agglutination measurement, image analysis (which may employ one or more of the following techniques: camera, digital camera, scanner, lensless photography, 3-dimensional photography, video photography), or microscopy.
Automated analytical quality control and/or calibration may also be provided in the systems and methods described herein.
In some embodiments, two-way communication may be provided. Such communication may enable log saving of all analysis steps. The two-way communication may also alter the analysis process to optimize or improve the completion of multiple analyses.
Quality control/supplemental applications
In some embodiments, imaging may be used with one or more other measurement or detection steps. Imaging may be in addition to other techniques, procedures, reactions, and/or analyses. For example, imaging may be used to perform one or more quality control checks or steps on any other action such as sample preparation, analysis, or detection steps. Imaging may be used to facilitate other detections. Imaging may be used to improve the accuracy and/or precision of the acquired data. Imaging may become a quality control part of the verification data, results and/or any measurements. Imaging may become a control mechanism or an improvement mechanism. Imaging may be used to detect one or more conditions that may affect the acquired data and/or the accuracy and/or precision of the data. Thus, imaging may improve sample preparation, analysis, or detection operations. This can be particularly advantageous for situations with small sample volumes, such as those described elsewhere herein.
In one example, there may be a detection step to determine the presence and/or concentration of the analyte. One or more signals may be detected which represent data useful for subsequent qualitative and/or quantitative evaluation. Detection may or may not include visible light detection. Detection may include measuring energy emitted from any point in the electromagnetic spectrum (e.g., infrared, microwave, ultraviolet, gamma ray, X-ray, visible light). Any type of sensor may be used for detection, and the sensor may include a light sensor, a temperature sensor, a motion sensor, a pressure sensor, an electrical sensor, a sound sensor, a chemical sensor, a spectrometer, or any other sensor described elsewhere herein, or any combination thereof. In some embodiments, the detection may or may not include the spatial distribution of light and/or energy. In some cases, the detection may or may not include an energy density profile.
The imaging may be capable of detecting one or more conditions under which the detection is performed. Imaging can be used to detect the condition of samples, reagents, containers, portions of devices that can be used for detection. In some embodiments, the imaging may be visual imaging. For example, imaging may include capturing snapshots, photographs, and/or photographs. Imaging may include capturing the spatial distribution of energy in the electromagnetic spectrum. The energy in the electromagnetic spectrum may include visible light, or may include other ranges (e.g., infrared, ultraviolet, or any other ranges described herein). For example, the spatial distribution of visible light may comprise a two-dimensional image. In some embodiments, imaging may include using an image capture device, which is described in detail elsewhere herein. Some examples of image capture devices include cameras, such as lensless (computing) cameras (e.g., frankencamara) or open source cameras. The image capture device may be capable of capturing a signal that is capable of generating a one-, two-, or three-dimensional representation of the imaged object. In some cases, the image capture device may move a sensory input device configured to provide a three-dimensional or pseudo-three-dimensional representation of an object.
The imaging technique may be the same or different from the detection mechanism used. In some cases, different types of detection mechanisms are employed between the detection step and the quality control imaging step. In some cases, the detection may include energy band assessment or energy density distribution, such as using a spectrometer, and the quality control imaging may include spatial distribution of visible light, such as with a camera.
Sensitive detection can be achieved by imaging. For example, the imaging device may be capable of capturing images within the following dimensions: 1mm, 500 microns (um), 200um, 100um, 75um, 50um, 25um, 15um, 10um, 7um, 5um, 1um, 800 nanometers (nm), 700nm, 500nm, 300nm, 100nm, 50nm, 30nm, 10nm, 5nm, 1nm, 500 picometers (pm), 300pm or 100 pm. In one example, the imaging may be accomplished by a camera, which may have a resolution greater than or equal to about 2 megapixels, 4 megapixels, 6 megapixels, 8 megapixels, 10 megapixels, 12 megapixels, 15 megapixels, 20 megapixels, 25 megapixels, 30 megapixels, 40 megapixels, 50 megapixels, or more.
Imaging may be used to detect errors or other fault conditions. Imaging may be used to determine conditions that may increase the likelihood of error and/or cause inaccuracies and/or inaccuracies. For example, imaging may be used to determine the presence and/or absence of one or more undesired materials. Examples of undesirable materials may include bubbles, particles, fibers, particulates, residues, precipitates, or other materials that may affect the measurement. In another example, imaging may be used to determine whether a volume of sample, reagent, or other material is within a desired range, or whether the sample, reagent, or other material is located at a desired location. Imaging may be used to determine the concentration of a sample, reagent, or other material, or whether a sample, reagent, or other material is within a desired concentration range.
In one example, the enzymatic analysis can be done on a small volume of sample. Examples of volume values have been provided elsewhere herein. A spectrometer or other detection methods or mechanisms described elsewhere herein may be used to perform the detection step of the enzymatic assay. The imaging step may be performed to determine the conditions under which the detection is made. For example, the imaging step may determine whether there are undesirable particles such as bubbles or any other undesirable conditions. The imaging step may verify that the analysis is performed as planned. This imaging step may confirm that the analysis is performed and/or detect whether the operating conditions under which it is performed are within the required tolerances or optimized conditions. In some examples, imaging may include taking a snapshot of the reactions occurring in the container. The captured images may be analyzed for any undesirable and/or desirable conditions. In some cases, the captured images may be automatically analyzed using computer-assisted methods. The one or more processors may facilitate analysis of the captured images, and in some cases, may execute one or more programs via machine-executable code stored in memory. Imaging can be used for quality control without requiring human intervention.
Imaging can provide intelligence to the system. The imaging step may provide information about the conditions under which the sample is prepared, analyzed, and/or detected. When imaging is used in quality control operations, the detection method may provide more reliable, accurate, and/or precise measurements on the point-of-service device or a component of the device.
Dynamic feedback
In some embodiments, dynamic feedback may be provided during the sample processing step. For example, dynamic feedback may be performed during the sample preparation step, the analysis step, and/or the detection step. In some embodiments, dynamic feedback may be provided by imaging. Alternatively, the dynamic feedback may be via any other detection mechanism, such as those described elsewhere herein. In some embodiments, the dynamic feedback mechanism may use optical detection, electromechanical, impedance, electrochemical, microfluidic, any other mechanism, or a combination thereof.
The dynamic feedback mechanism may alternatively use imaging or other detection mechanisms. Dynamic feedback may be included in the automatic decision making of the system. For example, an image may be captured and then the data to be considered in the decision step may be captured. Sensors such as imaging sensors may capture physical information that may be used to determine a next step or operation. Such next steps or operations may be determined on the fly in an automated manner.
In one example, dynamic dilution may be performed. A sample may be contained in a container such as a test tube or any other container described herein. A dynamic feedback mechanism (such as imaging, spectrometer, or other detection mechanism) may determine the concentration of the sample. In some embodiments, the determination may be an approximate or coarse determination. The initial determination may be a coarse determination to provide feedback to place the sample in a state for more accurate or fine-tuned detection and/or analysis. In one example, the dynamic feedback mechanism may be an imaging method that may accomplish an initial estimate of concentration through initial fluorescence detection.
The dynamic feedback mechanism may determine whether the sample concentration is within an acceptable range. In one example, the concentration may be a cell concentration. Approximate cell counts can be performed to determine cell concentration. One or more signals from the dynamic feedback mechanism may be used for cell counting. In some embodiments, the cell concentration can be in a wide range. In some cases, the concentration may vary by orders of magnitude of 1, 2, 3, 4, 5, 6, 7, or more. In some embodiments, different concentrations may be provided in the same sample depending on the cells or analytes to be measured and/or analyzed. Depending on the determined concentration, the sample may be diluted or concentrated and/or amplified. For example, if the concentration is above the desired range, the sample may be diluted. If the concentration is below the desired range, the sample may be concentrated and/or amplified. The extent of dilution and/or concentration/amplification may be determined on the fly based on the estimated concentration.
The extent of dilution and/or concentration/amplification can be determined in an automated manner. Dynamic feedback may be automated. Dynamic feedback mechanisms (such as imaging or other detection mechanisms) may provide data that may be analyzed to determine operating conditions. For example, the sample concentration may be determined according to a dynamic feedback mechanism. A processor may be provided that is capable of accepting and/or processing one or more signals from the dynamic feedback mechanism. From the received signals, the processor may determine the concentration and whether the concentration is within a desired range. If the concentration is within the desired range, the processor may decide that dilution or concentration/amplification is no longer required. If the concentration is above the desired range, the processor may determine that dilution is required. Depending on the extent to which the concentration deviates from the desired range, the processor may determine the degree of dilution desired. If the concentration is below the desired range, the processor may determine that concentration (or amplification) is required. Depending on the extent of deviation of the concentration from the desired range, the processor may determine the desired degree of amplification. Such a determination may be based on a tangible computer-readable medium, which may comprise code, logic, or instructions to perform one or more steps. Such determinations can be automated and thus can be accomplished without human intervention. This is applicable to all operating conditions and is not limited to sample concentrations such as cell concentration.
In some embodiments, more accurate measurements may be made after an initial feedback measurement and a dilution or concentration/amplification step. For example, more accurate cell count measurements can be made after the sample is determined to be within the desired range. In some embodiments, the sample may reach the desired range after a single dilution and/or concentration/amplification step. In other embodiments, more feedback steps may be performed, and more dilution and/or concentration/amplification steps provided, if desired. For example, if it is initially determined that the sample is found to have a high concentration, a dilution step may be performed. After the dilution step, a further feedback step is optionally performed. If the sample concentration is not within the desired (or predetermined) range, a further dilution or concentration/amplification step may be performed, depending on whether the measured concentration is above or below the desired range, respectively. This can be repeated as many times as necessary until the sample is within the desired range. Alternatively, the feedback step may or may not be repeated, or repeated a fixed number of times. In some embodiments, each feedback step has a higher accuracy. Alternatively, the same accuracy can be used in each feedback step.
In some embodiments, a sample can be effectively analyzed when the sample concentration (e.g., cell concentration, analyte concentration) is within a desired range. For example, the sample cell concentration may have a desired range that facilitates imaging. The required number of cells can be provided for each field.
Cell quantification and counting by means of imaging can be enhanced by controlling the cell density during imaging and thereby limiting the crowding and clustering of cells. Thus, the range of analyte concentrations in which the assay is linear can be maximized or increased. To extend the linear range of the analysis, the dynamic system can take a preliminary, non-destructive measurement of the sample using a method with a high dynamic range to determine the approximate cell concentration in the sample. Subsequently, the dilution ratio required to bring the cell concentration within the range acceptable for the main measurement can be calculated by an algorithm. Dilution and/or concentration/amplification may be provided accordingly, thereby providing dynamic dilution and/or concentration.
Such dynamic feedback as dynamic dilution may be advantageous for systems employing small volumes. In some embodiments, the total sample volume may include any of the volumes described elsewhere herein. In some cases, the volume of a particular portion of the sample to be analyzed may be any of the volumes described elsewhere herein. Dynamic dilution helps to provide a low coefficient of variation. For example, the coefficient of variation of the sample preparation, analysis, and/or detection steps can be the coefficient of variation described elsewhere herein. This is advantageous for a point-of-care device, which can use a small volume and/or have a low coefficient of variation.
Dynamic feedback may be advantageous for enabling non-destructive testing of a sample. This is advantageous for systems using small volumes. The same sample can be used for the initial feedback test and the subsequent tests. The same sample can be used for both the initial feedback test and the subsequent test in the same vessel (e.g., test tube, vial, tip). The vessel may contain a sample which is outside the desired and/or detectable range in its initial state. For example, the concentration of the one or more analytes and/or cells may initially be outside of a desired and/or detectable concentration range. The same sample may be measured in the same vessel within range. In some embodiments, the concentration of the one or more analytes and/or cells in the same vessel may then be within a desired and/or detectable concentration range. In some embodiments, one or more intervening steps of dilution and/or concentration/amplification may be performed on the sample in order to bring the sample into the desired and/or detectable concentration range. Such an intervention step may be performed in an automated manner.
In some embodiments, the sample may be diluted in an automated manner. For example, a diluent may be dispensed into a container containing the sample and mixed with the sample to achieve a new sample volume. In some cases, the diluent comprises a single diluent. In other cases, the diluent comprises a plurality of diluents. The flow may be facilitated by a pumping system, valves, and/or fluid flow channels to dispense the diluent into a container, such as a microfluidic system having one or more microfluidic channels and/or one or more microfluidic pumps. The microfluidic system may include one or more mechanical and/or electromechanical components, such as a mechanical pumping system, having one or more actuated (e.g., pneumatically actuated) valves to facilitate the flow of fluid. In some cases, the pumping system includes a mechanical pump configured to facilitate fluid flow. The pumping system may include one or more sensors to measure and communicate operating parameters, such as fluid flow rate, concentration, temperature, and/or pressure, to the control system. In one example, the diluent is dispensed into the container via a microfluidic system having a mechanical pump connected to the microfluidic channel via a microfluidic system such that the container is in fluid communication with the diluent reservoir.
In some cases, a pumping system is provided to put in diluent depending on the sample dilution measured. The sample dilution can be measured by a sensor such as a photosensor. In one example, the light sensor is coupled to a light source to direct a beam of light through the sample and subsequently measure sample dilution based at least in part on light scattering through the sample. The pumping system introduces a diluent (e.g., water) from a diluent reservoir into the container containing the sample if the measured sample (e.g., cell, tissue) concentration is above a predetermined limit (or threshold).
In some embodiments, dynamic dilution is electronically automated with the aid of a fluid flow system having a pump (e.g., a microfluidic pump) in fluid communication with a fluid flow channel (e.g., a microfluidic channel), and further comprising one or more valves for regulating fluid flow. Dilution automation may be used to test and/or adjust calibration settings, such as a preset dilution fluid volume to achieve a desired concentration.
In some cases, the pump includes one or more valves, such as pneumatically actuated valves. The pump, fluid flow channel, and one or more valves place the diluent reservoir in fluid communication with a container configured to hold a sample. The one or more valves and/or pumps may be in electrical communication with a control system having a processor to regulate the flow of diluent from the diluent reservoir to regulate the concentration of the sample.
Dynamic feedback advantageously enables automatic adjustment of sample concentration while minimizing, if not eliminating, user involvement. In some cases, the sample concentration is automatically adjusted (e.g., diluted or amplified) without any user involvement. This minimal user involvement may provide a low coefficient of variation in imaging and overall system usage, as described elsewhere herein.
In one example, dynamic feedback is used to adjust the cell concentration in the liquid sample by imaging. For samples provided in sample containers such as test tubes, imaging is used to measure the concentration of cells in a liquid sample. The measured concentration may be an approximate (or coarse) concentration measurement. The dynamic feedback system then dilutes the liquid sample by providing a diluent to the sample container. This minimizes, if not eliminates, any interference (or damage) to the cells upon dilution. After dilution, an optional measurement of the cell concentration in the liquid sample may be performed to measure the concentration. In some cases, the reaction may be performed in the same sample container used to dilute the sample after dilution. In some cases, the reaction may be carried out in instances where dilution is not optimal.
In some cases, a rough measurement of the sample concentration is made with a spectrometer in dynamic feedback and a more accurate measurement of the sample concentration is made with an imaging device. The imaging device may include a light source (coherent light such as a laser or incoherent light) and a camera, such as a charge-coupled device (CCD) camera. In one example, after a coarse measurement, the dynamic feedback system coarsely adjusts the sample concentration by providing a diluent, followed by a more accurate measurement. The sample concentration can be further adjusted by providing a smaller volume of diluent than that used in the coarse adjustment (i.e., fine adjustment). Alternatively, a rough measurement of the sample concentration is made using an imaging device and a more accurate measurement of the sample concentration is made using a spectrometer. Coarse tuning and fine tuning
The dynamic feedback systems described herein can be configured to concentrate/amplify (i.e., increase the concentration of) cells in a sample, such as a liquid sample. In some cases, this is accomplished by centrifugation or field separation (e.g., electric field separation, magnetic separation).
In some cases, sample concentration is accomplished using an imaging device whose position is selected to achieve a desired path length and/or focal point. In some cases, the position of one or more optics associated with the imaging device may be adjusted to provide a desired path length and/or focus. In some cases, images are captured using a lensless camera, which may provide image analysis and various focal points through calculations.
Dynamic dilution can be performed on various sample volumes. In some cases, if the sample volume exceeds a predetermined limit, the sample may be distributed among multiple sample containers (e.g., cuvettes) for continuous or parallel processing and/or imaging.
Self-learning
The dynamic feedback mechanism may lead to self-learning of the system. For example, for a dynamic dilution/concentration system, an initial feedback measurement may be made. Based on this feedback measurement, the sample may take no action, may be diluted, or may be concentrated/amplified. Measurements and/or detections may then be made. Subsequent measurements and/or detections may or may not be additional feedback measurements. Based on subsequent measurements, it can be determined whether the action taken (e.g., no action, dilution, concentration/amplification) is correct and/or whether a correct degree of action (e.g., sufficient dilution or concentration/amplification) has been taken. For example, the initial feedback mechanism may determine that the sample concentration is high and dilution is required. The sample may be diluted by a specific amount. Subsequent measurements may be made (e.g., images of the sample may be taken). If the degree of dilution does not bring the sample into the desired range (e.g., too much or too little dilution), the system may receive an indication that different degrees of dilution may be used for subsequent dynamic dilutions/concentrations with the same or similar initial feedback mechanism. If the degree of dilution brings the sample into the desired range, the system can be validated, i.e., the amount of dilution should be used in subsequent dilutions for the same or similar type of initial feedback measurement.
Data may be collected based on initial conditions and subsequent actions, which may help determine the appropriate action to take in subsequent dynamic feedback situations. This allows the system to self-learn over time what steps should be taken in a particular dynamic situation. This self-learning may be applicable to individualized situations. For example, the self-learning system may learn that a particular individual from whom a sample is drawn may require a different degree of dilution/concentration than another individual. The self-learning may be applicable to a group of people having one or more characteristics. For example, the self-learning system may learn that an individual using a particular type of medication may require a different degree of dilution/concentration than another individual. The self-learning system may also be generalized. For example, the system may learn patterns that a particular population or person with particular characteristics may or may not require different degrees of dilution/concentration. The system may utilize past data points, personal records, other personal records, general health information, public information, medical data and statistics, insurance information, or other information. Some of this information is publicly available on the internet (e.g., websites, articles, periodicals, databases, medical statistics). The system may optionally search a website or database for updates to the information. In some embodiments, the self-learning may be implemented on the device, the cloud, or an external device. As more data is collected, it may be uploaded to the cloud or external device and accessed by the self-learning system.
Image capturing and/or manipulating device
In some embodiments, sample preparation, processing, and/or analysis is accomplished by an image capture and/or manipulation device, including an electromagnetic radiation (or light) capture and/or manipulation device, such as an imaging device or spectrometer. In some cases, the imaging device may be used with a spectrometer. The spectrometer may be used to measure properties of light over selected portions of the electromagnetic spectrum, which properties may be used for spectral analysis, such as material analysis. Imaging (or image capture) devices can be used to measure sample concentration, composition, temperature, turbidity, flow rate, and/or viscosity.
In one example, the image capture device may be a digital camera. The image capture device may also include a Charge Coupled Device (CCD) or a photomultiplier and a photocell, or a photodetector or other detection device, such as a scanning microscope of the backlit and frontlit type. In some cases, the camera may use a CCD, CMOS, may be a lensless (computing) camera (e.g., frankencamara), an open source camera, or may use any other visual detection technique known in the art. In some cases, the imaging device may include an optical element that may be a lens. For example, the optical element captures light from a lens focal plane on the detector. The camera may comprise one or more optical elements which may focus light in use, or may capture images which are focused later. In some embodiments, the imaging device may employ 2-dimensional imaging, 3-dimensional imaging, and/or 4-dimensional imaging (including changes over time). The imaging device may capture still images or moving images (e.g., video). Still images may be captured at one or more points in time. The imaging device may also capture video and/or dynamic images. The video images may be captured continuously in one or more periods.
In some cases, the image capture device is a computational camera that is used to measure the concentration of multiple samples over a short period of time (such as at once). In some embodiments, the computing camera may have optics other than a lens. In one example, the computing camera is a lensless camera that takes pictures of multiple samples in a series of sample containers (e.g., test tubes). Subsequently, the sample concentration in a particular sample container can be calculated by: for example, mathematically representing the image, selecting a focal point at or near the portion of the image having the particular sample container, and deriving the sample concentration from the represented image. Such mathematical manipulation of the image acquired by the lensless camera may provide additional information about points in space in the field of view of the lensless camera, which may include points in space inferred from scattered light. In some embodiments, the final signal may be analyzed by complex algorithms. One example of such equipment is a computational camera equipped with optical elements that can generate fourier transform images on a detector. The resulting "image" can be analyzed to extract the desired information. The detector can make people obtain rich information from the photographing subject. For example, by obtaining different features from the image, information at different focal lengths can be obtained purely by software, simplifying the imaging hardware and providing more rapid, useful data acquisition.
The electromagnetic radiation capture and/or manipulation device can be used in various applications described herein, such as measuring sample concentration, including dynamic dilution. In one example, the light capture and/or manipulation device includes a light source, such as coherent light (e.g., laser) coupled to a light sensor, such as a CCD camera, for capturing scattered light that may emanate from the sample when the light source is directed at the sample. This can be used to measure the concentration of the sample. The light sensor may be configured to capture (or sense) different wavelengths of light, such as red, green, and blue, or other color combinations, some of which are for example combinations of red, orange, yellow, green, blue, violet-blue, and violet. In some cases, the light sensor is configured to sense light having a wavelength equal to or longer than infrared or near infrared, or light having a wavelength equal to or shorter than ultraviolet, in addition to the visible band of light.
The light capturing and/or operating device may be used to capture information at a particular point in time or at different points in time, which information may be used to produce a video having a plurality of still images and/or sound (or other data, such as text data) associated with the images.
Light capture and/or manipulation devices, including computational (or lens-less) cameras, may be used to capture two-dimensional images or three-dimensional (or pseudo-three-dimensional) images and/or video.
In some embodiments, the image capture and/or manipulation device perturbs the object and measures the response resulting from the perturbation. The perturbation may be accomplished by light (e.g., X-rays, ultraviolet light), sound, electromagnetic fields, electrostatic fields, or combinations thereof. For example, perturbations made by sound may be used for acoustic imaging. Acoustic imaging can employ similar principles for diagnosis of ultrasound for medical purposes. Acoustic imaging may function the same as a normal microscope, but may use acoustic waves. The ultrasound source may generate waves that can pass through the sample and be reflected/scattered due to inhomogeneities in the elasticity of the sample. The reflected waves may be "imaged" by the sensor. A variation of this method may include "photo-acoustic imaging" in which acoustic waves passing through the sample may cause local compression and elongation of the sample. This compression/elongation can cause a change in the refractive index of the sample material, which can be detected by measurement/imaging of the sample with the laser beam.
In some cases, an imaging device may be used to measure cell volume. In one example, a combination of a light source and a CCD camera is used to capture still images of the cells. The computer system digitizes the still image and draws a line through the cell, such as through the center of the cell. The computer system then measures the distance between the intersection of the line and the cell boundary line (or cell wall or membrane) to provide an estimate of the cell diameter, which can be used to estimate the volume of the cell.
The imaging device may use a line scanning microscope to illuminate the sample with a thin line or spot of coherent laser light so that the power of the light source can be concentrated in a small area to achieve high power density. The detector geometry may be matched to the line or point. The entire sample may be scanned along this line/point so that different portions thereof can be imaged. The individual scan lines can then be joined to form the entire image (e.g., in a similar manner as a document scanner). As an analytical/imaging method, this method has advantages for one or more of the following reasons: (1) high power density of illumination, (2) line scanning can achieve higher speeds (although both are slower than full or conventional imaging), (3) analytical measurements of the sample, such as fluorescence, absorbance, luminescence, etc., with high precision and/or accuracy, (4) in combination with spectral or hyperspectral imaging, such that the entire spectrum of the sample can be obtained for each pixel, (5) dynamic adjustment of resolution (i.e., the sample can be scanned at a desired low or high lateral resolution without changing any elements), or (6) can provide a high depth of field, enabling imaging of tissue samples.
In some embodiments, the imaging device is configured to detect light emitted from an ionization (fluorescence or luminescence) event, such as by scintillation. In one example, the scintillator is coated with or embedded in a material comprising the sample container. When the sample is coupled to (or otherwise interacts with) the scintillator, the scintillator emits light (e.g., fluorescence) that is detected by the imaging device detector. This can be used to measure radioactive decay (e.g. alpha and/or beta decay) of a particular sample.
In some cases, the imaging device is a field effect transistor for measuring charged particles such as ions. Alternatively, the imaging device may be a thermal detector for measuring thermal changes, which may be used, for example, to construct a thermal map.
In some cases, the sample container includes one or more wells to hold the sample. The sample container may be coupled to an imaging device that images the sample secured in the one or more wells. Microspheres with surface binding agents (e.g., antibodies) or surface binding agents that can be disposed, for example, at the bottom of the well can facilitate sample fixation. The diameter of the pores may be on the order of nanometers or micrometers or more.
In some embodiments, an image enhancing substance such as a dye may facilitate sample detection and/or analysis. The dye may bind to the sample and provide an optical, electrical or optoelectronic signal that may be detected by a detector of the imaging device. In one example, the dye binds to the cells and fluorescence, which can be recorded by the detector. By measuring fluorescence, the spatial distribution and/or concentration of cells can be measured. Image enhancing substances may help to achieve improved signal-to-noise ratios during image acquisition (or capture). The dye may be bound to the cells with the aid of surface receptors and/or antibodies.
In some cases, the use of dyes can generate background fluorescence, which can distort the image-fluorescent samples can be difficult to distinguish from the fluorescent background. In this case, image acquisition may be enhanced by contacting the sample in the liquid with a fluorescent dye. Unbound dye can be removed with the aid of a centrifuge (or magnetic or electrical separation). The centrifuge may be integrated into a point-of-service device equipped with an imaging device. The sample may then be resuspended in a liquid and then imaged with the aid of an imaging device.
In some cases, image acquisition may be enhanced using dynamic feedback, which may be in addition to or in place of image enhancing substances. In one example, dilution and/or amplification prior to image acquisition can help optimize sample concentration.
The centrifuge facilitates sample separation. Alternatively, sample separation can be accomplished by magnetic or electric fields. For example, magnetic particles may be associated with cells, which may be used to attract cells to a source of magnetic attraction in the presence of a magnetic field.
The systems and methods described herein can be applied to various types of samples, such as cells, saliva, or urine, which can be obtained from tissue (e.g., skin, blood). In one example, dynamic feedback and/or imaging may be applied to a tissue sample or a cell sample obtained from the tissue sample.
Examples of the invention
Example 1: nucleic acid amplification by Loop-mediated isothermal amplification (LAMP)
The following experiments were performed to evaluate the ability of the 3-color image analysis method to perform fluorescence or absorbance reading LAMP analysis.
Lamp reaction conditions
LAMP reactions were performed in a total volume of 25. mu.L in 500uL PCR tubes (VWR, West Chester, Pa.). The reaction mixture included 0.8. mu.M primer 1 and 2, 0.2. mu.M primer 3 and 4, dNTP (Invitrogen, Carlsbad, CA) 400. mu.M each, 1M betaine (Sigma, St. Louis, MO), 1X Thermopol buffer (New England Biolabs, Ipswitch, MA), 2mM MgSO4(Rockland immunochemics, Gilbertville, Pa.), 8U Bst DNA polymerase long fragment (New England Biolabs, Ipswitch, MA) and a given number of DNA templates (ranging from-10 and-10 ^9 parts). In the case of negative blanks, about 10^9 parts of irrelevant DNA were added.
Reaction conditions
The reaction was incubated at 65 ℃ for 1 hour in a sealed tube. The reaction product was then heated to 80 ℃ for a period of 5 minutes, thereby inactivating the polymerase.
Product detection and visualization
Mother liquors of SYBR green I stain (Invitrogen, Carlsbad, CA) were diluted 100 fold, 5 μ L mixed with the finished 10 μ LLAMP reaction product and incubated at room temperature for 5 min. The reaction product was then read out in the following manner:
Fluorescence reading: PCR tubes or pipettes containing the mixture were 302nm UV and fluorescent (. lamda.)Maximum of524nm) and imaged by a digital camera (Canon EOS T1i,18-55mm, Canon, Lake Success, NY).
Color reading: the reaction products are aspirated into the tip and imaged using a digital camera.
As a result:
FIG. 81 shows a fluorescence image of the assay product in a test tube.
FIG. 89 shows a fluorescence map of the reaction product used in the tip.
FIGS. 82, 83, 84, 85, 86 and 87 show color images of reaction products in the tip. Fig. 88 shows a background color image acquired for calibration.
Figure 90 shows a comparison between the LAMP dose-dependent response obtained by measuring "bulk" fluorescence (conventional fluorimetry) and the two-color channel response obtained by a camera. It is clear that the colour method gives a response comparable to the results of fluorimetry.
When analyzing and calibrating color images using all three color channels according to the methods described herein, there is a clear close relationship between the calibrated color signal and the fluorescence signal, as shown in fig. 91.
Example 2: system to maximize sample usage
The system for maximizing sample use may have the following features:
1. Efficient blood separation into plasma and efficient plasma recovery
a. Separation is accomplished in a capillary by centrifugation
2. Plasma dilution to several predetermined levels suitable for high and low sensitivity assays
3. Minimizing the volume of each assay reaction mixture required for each assay
a. The use of open small-volume test tubes facilitates analytical culture while preventing evaporation
i. The test tube being longer relative to the width
b. In the small-capacity cuvette, the sensitivity of the analysis signal is improved by modifying the optical path
i. The tubes being conical, or having a wide and narrow width
c. If desired, the sensitivity of the analytical signal is increased by moving the reaction product (which does not fill the cuvette) to a selected position having a longer path when performing the optical measurement
i. The internal volume of the cuvette is much larger than the volume of the analysis mixture
4. Using either or both of variable path length and 3-color channel analysis to increase useful dynamic range of analysis
Example 3: fixed-point care analysis device
The point-of-care analysis device may include a single-use disposable cartridge, an instrument for processing a sample and operating an analysis, and a server remote from the instrument, the measurement and detection system comprising:
the disposable cartridge contains:
Sample collection and measurement methods (e.g. sample tips)
The instrument housing contains:
light imaging sensors (such as cell phone camera with light source (e.g. flash) and CCD image capture device)
-means for moving the tip to a position where the optical imaging sensor can acquire images
Uploading the image wirelessly (or otherwise) to a server remote from the instrument
Image interpretation software having the following functions:
-measuring a volume from the two-dimensional image
-differentiating sample types
The sample type and/or volume data is taken as part of an operating algorithm to:
-providing a prompt to a system user regarding sample integrity
-providing any required cues to provide additional or replacement samples
Interpreting the signal data of the instrument to obtain an analysis result, wherein the sample type and/or the sample volume are taken into account
The system may optionally include additional mechanisms in the "sample acquisition device (capillary tube)" for processing and/or imaging the sample acquired by the user, including:
mechanisms for accommodating the capillary in a determined position and moving the capillary to another determined position where an image can be acquired
Mechanisms for pushing substantially all of the sample into the cartridge in a determined position
Example 4: analysis of capillary containing blood sample
The sample is collected by contacting the distal end of the capillary tube with a drop of blood (typically obtained by finger prick). As long as there is sufficient blood, the capillaries are typically filled by capillary action. In one version of the invention, the user places the capillary tube in a locked position on the cartridge, then inserts the cartridge into a slide in the instrument, and then presses a screen button on the instrument GUI to initiate the analysis. All subsequent analysis steps were automated. The instrument moves the cartridge in its housing and closes the door where the cartridge is inserted. In this version of the invention, the instrument moving part grasps the capillary tube and moves it to a position in front of the digital camera equipped with the flash lamp and the CCD. The capillary is imaged by flash illumination and the image is wirelessly transmitted to a server, which interprets the image to obtain the type, location and quantity of the sample. If the predetermined criteria are met, the server instructs the instrument to continue the analysis. If the sample is not appropriate, the capillary is withdrawn into the cartridge and the cartridge is withdrawn, and the server causes the GUI to display the appropriate prompt. Thereupon, the user may either (1) add more sample or (2) take a new sample and use the new capillary. When the user indicates via the GUI that corrective action has been taken and the capillary/cartridge has been reinserted into the instrument, the server commands the instrument to resume the analysis process. The criterion for a suitable sample volume is generally that the volume exceeds the minimum required for analysis. Thus, for example, in some assays 10uL of sample may be used, and a sufficient sample is generally considered to be present when the measured volume of the sample is >12 uL.
In a second version of the invention, image acquisition is used to measure the sample volume obtained from the raw sample. This version may be implemented alone or in combination with the first version. In the analysis sequence, the sample is pushed (1) by the user or (2) by the instrument from the capillary into the sample well of the cartridge. Subsequently, the correct volume is removed from the sample well by capillary action or (preferably) pneumatically using a second tip. At this stage, the type and volume of the aliquot is measured (as described above) by imaging the pipette tip. If the sample type and volume are acceptable (target +/- < 5%), the analysis is continued. If not, the analysis may be abandoned while the user is prompted to take remedial action. The types of samples that can be distinguished are blood and plasma or serum and others. The imaging system makes this distinction by observing a contrast between blood (opaque) and tip (transparent) that is much greater than that between plasma and serum. If the sample volume not reaching the target level is still sufficient for the analysis to provide satisfactory results (in the above example, if the target volume is 10uL, a volume greater than 5uL is acceptable). The analysis algorithm that calculates the analyte concentration then uses the calibration function: concentration (true) concentration (concentration observed when the target volume is reached) target volume/measurement volume.
Blood can be easily detected and its volume can be measured by creating a map of tip pixels, counting the number of black pixels and then comparing with the number of pixels for a known target volume. Despite the transparency of the sample types serum and plasma (and other aqueous non-blood samples), the imaging system can still detect the presence of the sample due to changes in the meniscus refraction of the sample and differences in the refractive index between the tip material and the sample. Alternatively, the capillary may be coated with a layer of dry dye which will be dissolved by the sample, thereby adding the dye to the sample.
Other methods of measuring sample volume include determining the top and bottom position of each meniscus and applying simple geometric techniques (as described herein). Air bubbles in the sample liquid column can be identified and measured by the method described above, and the appropriate volume subtracted from the total volume occupied by the sample.
The above method measures the sample in the sample capillary or suspended at the end of the capillary (as described herein). After the sample is measured and accepted by the system, the sample is withdrawn by pipetting/pneumatic methods in the instrument. When this occurs, the pipette tip can be re-imaged and all remaining samples measured. The volume actually used in the analysis is the difference between the total volume and the residual volume.
Another particular problem in POC analysis systems, especially when used by technically untrained users, is the presence of a sample outside the sample capillary.
This can be imaged and measured using the present invention and the user prompted to remove the excess blood.
Sample collection and delivery effectiveness in an analytical device depends on the liquid handling technique employed. The automated device may use (1) pneumatic aspiration and expulsion (as in many laboratory single and multi-channel pipetting devices using disposable tips; pneumatic methods may use positive or negative pressure (vacuum)), (2) positive displacement (e.g., syringes), inkjet technology, etc. Other liquids such as samples and reagents may be drawn (3) out of the cell by capillary action or (4) into the porous medium. The liquid (sample and/or reagent) may be withdrawn with or without contact with other liquids. For example, if the sample is to be diluted, the sample tip may be immersed in a diluent or displaced into the air so as to drip into a dry well or a well containing a diluent. The present invention can be used to verify and/or measure the performance of all of the above systems and methods.
In other embodiments, the capillary tube may be imaged by a user located outside the instrument and equipped with an external camera. The volume measurement may be performed in terms of capillary dimensions. The externally located camera can be used for user/patient identification so that the results can be attributed to the correct patient more reliably. This method can also be used to verify that the appropriate medication is being used (imaging of the pill container or pill, or a bar code reader in the instrument can be used for this purpose).
The present invention can also be used to measure the location and volume of reagents drawn into an analytical tip. In some cases, dyes may be added to the reagents to more conveniently image them (to improve contrast).
In the analysis of plasma separation from blood, the present invention can be used to verify the effectiveness of red blood cell removal, and the available volume of plasma. An alternative to moving the sample-containing tips is to move the camera
The system may have the following advantages:
1. quantitative measurement of samples
2. Ability to identify sample type
3. Generating an objective, quantitative record of sample volume
4. Enabling analysis to give results when sample volumes are incorrect
5. Improving reliability of an analysis system
Example 5: suction head
Figure 18 shows a tip (dimensions shown are in millimeters) for aspirating sample and reagents.
Example 6: cylindrical capillary tubeGeometric measurement of
Figure 19 shows the cylindrical capillary dimensions containing the sample.
Radius R ═ radius
L1-distance from the bottom end of the cylinder to the low sample meniscus
L2-distance from bottom to the meniscus at the lower and upper ends of the sample
Inhaled volume pi x (R2) L2-L1
Example 7: geometric measurement of conical capillaries
Fig. 20 and 21 show the dimensions of the cone capillary.
Radius of cone base
Length L ═ length
L1Distance from (projection) cone top to low sample meniscus
L2Distance from (projection) cone top to low-high meniscus
Imbibed volume pi x (Rb/L) ^2 x [ (L)1)^3-(L2)^3]/3
Tanθ=Rb/L
Example 8: influence of liquid meniscus
It is well known that the liquid in a capillary tube generally has a curved liquid surface. Depending on the contact angle, the meniscus may bend inwardly or outwardly with respect to the liquid. When no net external pressure is applied, the meniscus is inward if the capillary surface is hydrophilic (contact angle < π/2); if the surface is hydrophobic (contact angle > π/2), the meniscus is outward. When a net external pressure is applied to the liquid column (the capillary tube is placed vertically or air pressure is applied by the instrument), the low meniscus may extend below the lower end of the capillary tube. For small diameter capillaries, the surface tension along the meniscus is strong with respect to the smaller gravitational forces. In a vertically positioned capillary, the surface tension pressure along the meniscus is 2 π R γ cos θ, where γ is the surface tension and θ is the contact angle. The pressure created by gravity along the meniscus is ρ g Δ L/(π R ^2), where ρ is the liquid density, Δ L is the distance along the meniscus, and g is the gravity constant. Accordingly, the meniscus surface is spherical. The volume of liquid in the portion occupied by the meniscus can be calculated as follows and used to obtain a more accurate estimate of the volume.
Distance defined from the bottom of the sample capillary
L1-distance to the bottom of the low meniscus
L2-distance to the top of the low meniscus
L3-distance to the bottom of the meniscus
L4-distance to the top of the meniscus
Volume of spherical cap
πh(3a2+h2)/6
Fig. 22 shows the dimensions of the spherical cap.
Depending on the number and location of the menisci, several different situations may occur. Note that the following equations relate to inward and outward menisci.
Case 1: the high meniscus is curved and the low meniscus is horizontal (as shown in FIG. 23)
And (3) replacing: a ═ R, h ═ L4–L3
L3And L4With a volume of pi (L) in between4–L3)*(3*(R)2+(L4–L3)2)/6
Total volume pi ═ R ((R))2)*L3+(L4–L3)*(3*(R)2+(L4–L3)2)/6)
Case 2: both menisci are located within the capillary and are curved (as shown in FIG. 24)
Total volume pi ═ R ((R))2)*L3-(L2–L1)*(3*(R)2+(L2–L1)2)/6+(L4–L3)*(3*(R)2+(L4–L3)2)/6
Case 3: there are two menisci. The low meniscus is curved and below the lower end of the capillary (as shown in FIG. 25)
Total volume pi ═ R ((R))2)*L3+(L1)*(3*(R)2+(L1)2)/6+(L4–L3)*(3*(R)2+(L4–L3)2)/6)
Example 9: air bubble
Air bubbles in the liquid sample or reagent cause a different degree of reduction in the volume of the liquid being measured. In small capillaries, the bubble is spherical when it is smaller than the capillary cross section. When they are large, they occupy a cylindrical space (in a cylindrical capillary tube) and have hemispherical ends.
Case 1: the bubbles are not large enough to span the entire width of the capillary (as shown in FIG. 26)
Minus the bubble volume (4/3) × pi × r3
Case 2: the entire width of the bubble-enclosed capillary tube (as shown in FIG. 27)
Subtracting the bubble volume 4 pi R3+π*R2*L
Example 10: blood outside capillary suction head
Case 1: blood or reagents hanging outside the vertical capillary can cause significant problems in analysis, as it represents an uncontrolled situation. As shown in fig. 28, imaging can easily identify this.
Case 2: blood outside the capillary, but not suspended
Residual blood outside the capillary is also problematic because it is a potential source of contamination for the reagents and has additional volume. Again, imaging may identify this.
Example 11: blood remaining in the capillary after the sample is dispensed
This problem can be solved by estimating the residual volume and subtracting it from the total sample volume. Fig. 29 shows an example of a capillary tube with residual blood.
Residual volume pi R2*L
Example 12: assessing red blood cell separation in a blood sample
In many assays, it is necessary to remove red blood cells from a sample in order to obtain plasma. When this is done, it is necessary (especially for POC devices) to know whether the separation is effective and to determine whether there is sufficient plasma for analysis.
Fig. 30-39 illustrate a preferred embodiment of red blood cell removal suitable for use in POC devices of the invention. In the wells that will receive the blood sample, a dry preparation of magnetizable particles with red blood cell antibodies mixed with red blood cell free antibodies is provided, as shown in fig. 30. When a blood sample is added to the well (as shown in FIG. 31) and mixed with the magnetic reagent (as shown in FIGS. 32, 33 and 34), red blood cells agglutinate with the magnetic particles and can be removed when the blood sample-containing well is placed in proximity to a strong magnet (as shown in FIG. 35). By appropriately moving the well relative to the magnet, red blood cells can be separated from the plasma (as shown in fig. 36), which can then be pushed into the receiving well for analysis (as shown in fig. 37, 38 and 39). It is clear that imaging analysis can determine how effectively separation is performed and can estimate the volume of plasma available for analysis.
Example 13: image of liquid sample in capillary
FIG. 40 shows a high contrast image of a cylindrical tip containing a low absorbance liquid.
Figure 41 shows an image of a conical tip containing a high absorption liquid.
FIG. 42 shows a tip containing a high uptake rate liquid and showing two meniscuses located within the tip.
FIG. 43 shows a tip containing sample liquid and large bubbles across the diameter of the tip.
FIG. 44 shows a tip containing water showing a clear upper meniscus in a transparent tip or capillary.
The graph 41 was analyzed to obtain the length of the liquid column (corresponding to 5uL) and the resolution of the upper meniscus (determination of meniscus position with > 90% confidence). The meniscus position accuracy corresponds to < 1% of the liquid column length.
| Size of
|
Width of pixel
|
| Length of
|
276
|
| Resolution of meniscus
|
2
|
| Accuracy of measurement
|
0.7% |
Example 14: effect of insufficient sample volume on analysis results
The system is used to measure protein-C in blood. When the sample transfer device is used properly, the sample volume inserted into the system is designed to be 20 uL. The instrument was set up to use 10uL of blood in this sample. The system calculates the analyte concentration as shown in fig. 45, where the sample volume is deliberately reduced below the target level. The result remains substantially constant until the sample volume is below the desired volume.
Example 15: sample transfer device
Fig. 46 shows a sample transfer device example. The device comprises (a) (glass or plastic) a capillary tube, optionally coated with anticoagulant or other reagents suitable for sample processing prior to analysis, (b) a housing containing the capillary tube, the capillary tube being provided with (c) a plunger (piston) slidable in the housing, having a protruding feature that slides in a groove in the housing, (d) a groove in the housing that cooperates with the piston feature and limits axial movement of the piston so that its movement stops when the sample is displaced, and (e) a housing vent, normally in an open state, that is closed to displace any liquid in the capillary tube when the piston is actuated (moved towards the distal end of the device).
FIG. 47 shows a sample transfer device with a sample in a capillary tube. The "add" position is noted.
Fig. 48 shows the sample transfer device after pushing out the sample with the plunger.
Fig. 49 shows the sample transfer device after the sample is incompletely pushed out.
Example 16: volume measurement by image analysis
By means of the pipetting device, a known volume of the liquid sample is aspirated into the sample tip. A commercial flatbed scanner (Dell) was used to acquire the tip image and measure the distance between (a) the meniscus from the distal tip and (b) the features marked in the lower graph from the distal tip. Tip positioning and its position relative to the scanner platen are not controlled because the image is analyzed by measuring the ratio of distance (a) to distance (b) as a measure of sample volume. The position of the tip, meniscus and features were measured using commercial imaging software (Jasc). The software is used to place the image horizontally before the position is recorded, and the image can be read directly in the scale provided by the software. Fig. 50 shows an exemplary image.
Distance L1 is the tip position.
Distance L2 is the meniscus position.
Distance L3 is the position of the arrow shown in fig. 50.
As shown in fig. 51, the volume to distance ratio is simply related and can be calculated. Volume estimates are on average within less than 2% of the actual volume.
Example 17: image of blood centrifuged in a tip
By measuring the length ratio of the packed red blood cell column to the total liquid column (tip to meniscus), the hematocrit can be determined from the digital image. This can be easily done by feature recognition software positioning the tip in a known orientation and then counting the pixels between features. With the above-described pipette tip, distances corresponding to several hundred pixels can be accurately measured.
Figure 10 shows an empty capped sample tip.
FIG. 11 shows a capped sample tip containing a blood sample.
FIG. 12 shows a capped sample tip containing a sample of blood having a hematocrit of about 23% after centrifugation.
FIG. 13 shows a capped sample tip containing a sample of blood containing about 31% hematocrit after centrifugation.
FIG. 14 shows a capped sample tip containing a sample of blood having a hematocrit of about 40% after centrifugation.
FIG. 15 shows a capped sample tip containing a sample containing approximately 52% hematocrit blood after centrifugation.
FIG. 16 shows a capped sample tip containing a sample of blood containing 68% hematocrit after centrifugation.
FIG. 17 compares the hematocrit ("hematocrit,% reported value") measured using the digital imaging system for centrifuged samples with the hematocrit ("hematocrit,% target value") measured using standard techniques. An example of a standard technique for hematocrit measurement may include a micro red blood cell measurement performed in a glass capillary tube by a standard laboratory centrifuge and measuring the length of the packed red blood cell column and the total length of the capillary tube occupied by the sample.
Example 18: system comprising a blood separation component
Systems designed for blood separation may include the following features:
1. the shape of the suction head is designed.
a. Aspect ratio of about 20: 1 (long: diameter), provides a convenient length for measurement of sample, packed cell and plasma volumes.
b. The molded tip can be tightly sealed with a vinyl cover and the cap easily removed when desired.
c. The main portion of the tip has a slightly tapered shape, while the upper portion of the tip has a wider tapered shape, which is desirable for insertion into a plasma recovery member. Note that the "anti-radial" design (narrower suction end away from the axis of rotation) is unique.
d. The wider tip upper cone is configured to be accommodated on automated pipetting and x-y-z direction moving stages. This facilitates the formation of a liquid-tight connection and, if desired, easy removal.
2. The plasma recovery tip is moved using a very precise and accurate x-y-z stage.
3. Centrifugation and plasma recovery operations were controlled using automated imaging techniques. The movement of the plasma recovery tip is within less than 1 mm of the compacted cell-plasma interface.
Example 19: using liquid volume image measurements to improve analytical calibration
Automated pipetting devices are typically accurate and precise, for example, to about 5% or better of the 5-50uL range. In many assays, both the volumetric accuracy and precision must be very good (e.g., < 2%) to obtain the precision and accuracy required for analyte measurement. Poor accuracy and precision often occurs when metering and delivering (1) volumes of less than 5uL of liquid, which is highly desirable when maximizing the use of small sample volumes, and (2) liquids with "problematic" physical characteristics, such as viscous solutions, detergent-containing solutions, etc., thereby compromising the accuracy of the assay results. An innovative solution to these problems is to measure the liquid volume (sample, diluent, reagents, calibrant and control) by image analysis of the liquid and then correct the analytical calibration function to account for deviations in the required volume (up to [ say ] 20%). We have demonstrated that in pipetting tips with very precise dimensions, volumes as small as 5uL can be measured with very good accuracy and precision (< 2%). Next, we record (1) the accuracy and precision of the volume measurement and (2) correct the analytical calibration by analyzing the known relationship between the volume of solution used (sample, reagents, etc.) and the analytical response.
(1) Accuracy of volume measurement by image analysis:
in the table below, a known volume of bromophenol blue solution was aspirated into a conical tip.
The solution is placed in the middle of the tip and imaged by the scanner. Tip positioning and location is determined by standard methods. The positioning of the suction head is adjusted by an algorithm and the measured length of the liquid column. The column of liquid is calculated using the known internal dimensions of the tip. Four replicates of four of the four tips were imaged. Thus, the errors provided below reflect the image reproducibility and the accuracy and precision of tip size.
| Target volume
|
Measuring volume
|
Total error
|
| uL
| uL
|
% |
|
| 5
|
5.01
|
1.39
|
| 20
|
19.98
|
1.80 |
Note that the volume measurement does not depend on the exact positioning of the liquid in the pipette tip. Image analysis provides information about the position of the liquid in the tip. Knowing the size of the tip, the volume can always be calculated based on the portion of the tip that is occupied by the liquid (regardless of the position).
(2) Correction of analytical calibration by incorporating liquid volume measurement
This is achieved by the simulation shown below. Consider an assay in which a sample is combined with two reagents (referred to as 1 and 2). The target volume of sample, reagent 1 and reagent 2 was 10 uL. The analytical result is calculated from a standard curve relating the measured signal to the analyte concentration. As part of the analytical calibration procedure, the volumes used for samples and reagents were changed to 8 and 12uL in addition to 10uL in the experiment, and the analytical results were calculated from a calibration appropriate for the 10uL volume. In fig. 105, 106 and 107, the results are plotted against the actual volume. For sample volumes, the analysis results were roughly directly proportional to the volume used (as shown in fig. 105). For the reagents, a somewhat non-linear response was seen (as shown in fig. 106 and 107). These responses are based on "typical" analysis well known in the art, and the magnitude of the volume change is representative.
We then simulated an assessment in which we added some random error (about 5% to reflect the "real world situation") to the analysis results, except for the effect of using inappropriate volumes. We include results for various combinations of sample, reagent 1 and reagent 2 volumes set to 8, 10 and 12 uL. When the result of this operation is plotted without correction for volume errors, as shown in fig. 108, significant errors in the reported results occur as expected, due to disregarding the fact that the actual volume used is different from the volume used for the analytical calibration.
The results are greatly improved when we consider the volume deviation from the target value using the known analytical response to the volume and plot the corrected analyte values we obtained, as shown in fig. 109. This is achieved by performing multiple regression analyses on the data.
A summary of the statistical comparisons with and without volume correction is shown in the table below and reflects the significant improvement achieved by all metrics using volume correction. SEE refers to the standard error of the estimate.
| Volume correction
|
Gradient of regression
|
Correlation coefficient
|
Analyte CV
|
SEE/mean value
|
| |
|
R^2
|
%
|
%
|
| No correction
|
0.994
|
0.914
|
13.3
|
16.5
|
| Correction
|
0.999
|
0.994
|
3.6
|
7.4 |
Example 20: read out of hemagglutination inhibition assay using microscope and image analysis
In phosphate buffered saline (100uL), containing 0.3% w/v glutaraldehyde stabilized turkey red blood cells and 0.5mg/mL bovine serum albumin, as indicated, 2 hemagglutination units of inactivated influenza virus and 15ug of goat polyclonal anti-influenza B antibody were incubated in a conical-bottomed PCR tube at room temperature for 15 minutes. The analytical product at the bottom of the tube was transferred to a transparent slide illuminated with white light and imaged at 4 x magnification using a digital camera. As shown in FIG. 131, the agglutination of erythrocytes by reaction with viral hemagglutinin (FIG. 131, sample 3) was easily observed by comparison with the non-agglutinated control (FIG. 131, sample 1). When too much viral antibody is present, the aggregation is completely inhibited. Two effects of the condensation reaction are evident: (1) there were more red blood cells in the aggregate sample due to faster settling of the aggregates than the control, (2) on average, the red blood cells formed more clusters with other red blood cells. The agglutination reaction can be quantified after the image recognition software identifies, locates and counts the red blood cells and aggregates.
Figure 131, sample 1 shows no agglutination control (no virus, no antibody). Fig. 131, sample 2 shows the non-agglutinated sample (virus and antibody). Figure 131, sample 3 shows agglutination (virus, no antibody).
Example 21: sample preparation, supernatant quality check and LDL-pellet treatment assessment
Plasma was diluted (1: 10) in a mixture of dextran sulfate (25mg/dL) and magnesium sulfate (100mM) and then incubated for 1 min to precipitate LDL-cholesterol. The reaction product was sucked into the centrifuge tube of a centrifuge, then the cap was closed and rotated at 3000rpm for 3 minutes. The original reaction mixture was imaged before centrifugation (showing a white precipitate), after centrifugation (showing a clear supernatant) and the LDL-cholesterol precipitate (after removing the lid). For example, fig. 132, 134 show examples of imaging reaction products.
The image analysis of the LDL precipitation reaction product was as follows. The pixel color level is plotted as a function of its vertical position. The variance of these values is measured and the values of the three colors are summed. Because the particles of precipitated LDL scatter light strongly, the precipitate value (1154) is much higher than that of the clear supernatant (672). By comparing the supernatant values to a control not exposed to the precipitating reagent, the centrifuge quality can be assessed (data not shown). FIG. 133 provides an example of images analyzed before and after spinning in the centrifuge.
After removing the black vinyl cover, the LDL pellet was imaged. Knowing the tip geometry and the size of the pixels in the image, its volume can be measured very accurately. In this experiment, the pellet volume was estimated to be 0.155+/-0.015 uL.
Example 22: improved alanine Aminotransferase (ALT) assay performance by 3-color imaging of blank sample optical signals
ALT in serum can be measured by an assay in which an enzyme converts alanine to pyruvate, followed by the production of hydrogen peroxide from pyruvate by oxygen and pyruvate oxidase. This peroxide is then used by horseradish peroxidase, aminoantipyrine and N-ethyl-N- (3-sulfopropyl) aniline to make a coloured product. The coloured product absorbs the highest at 560 nm.
Some serum samples were found to have high absorbance at this wavelength, as shown in figure 135, and the analysis was correspondingly interfered with. Especially when higher sample concentrations (e.g., 1: 10 final dilution in the assay) are used, the ALT3 color image analysis of clinical samples is poor.
Fig. 135 shows spectra of several serum samples in buffer at 1: 10, diluting; OD is plotted against wavelength (nm). The large OD variation is shown in figure 135.
In conventional spectroscopy, this problem is solved by taking a blank reading of the sample without adding an analytical reagent to the sample and then subtracting the blank from the signal generated by the analysis. In the 3-color image analysis of the present invention, it was found that a similar method can be used. The diluted sample can be imaged and then a 3-color value extracted. Subsequently, the analytical calibration algorithm can be altered to include the signal of the unreacted sample. Specifically for this example, the original algorithm (not including the sample blank signal) was ALT concentration a + B R + c G + d B + e R2Where a, b, c, d, e are empirical constants and R, G, B are the signal values for the red, green and blue channels, respectively. The improved algorithm is: ALT concentration ═ a + B R + c G + d B + e Rs, + f Rs2Where Rs is the signal of the blank sample in the red channel (note that the empirical constants a, b, c, d, e are different from the values in the original algorithm).
The results of three replicates of 21 serum samples having ALT activity ranging from 0 to 250U/L were compared with the results obtained using the clinical laboratory method (Teco) for 3-color image analysis, from which the following regression statistics were obtained, indicating a great improvement in the results.
| Calibration method
|
R^2
|
Slope of slope
|
Intercept (U/L)
|
SEE
|
| Original
|
0.922
|
0.922
|
4.5
|
18.9
|
| Improvements in or relating to
|
0.972
|
0.972
|
1.6
|
10.0 |
Example 23: objective analysis of accelerated and anti-influenza antibody hemagglutination
The reaction mixture prepared as described in example 20 was incubated for only 1 minute, then placed in three different microchannels (as described in the above cytometry example), and imaged. Approximately 5-10 images were taken for each sample in order to obtain sufficient statistics. On average, each image consisted of approximately 800-900 cells. The process of agglutination can be objectively assessed by selecting representative individual cells using a function and measuring the radial cell distribution around the cells.
Processing images toThe geometric center position of the single cell in 2-dimensional space is obtained. These 2-dimensional positions are used to compute a Radial Distribution Function (RDF), also known as an even correlation function. The radial distribution function g (r) quantifies the probability that a cell is found at a certain distance from the selected cell. Mathematically, g (r) ═ ρ (r)/ρoWhere ρ (r)2 π rdr is the number of cells found at a distance r from a particular cell, and ρoIs the average cell density over the entire image window. The g (r) value is calculated as the average of all particles in the image and images to ensure that a statistically significant result is obtained.
Results
The first g (r) peak quantifies the number of paired cells in the sample. Thus, the g (r) value of the condensed sample should be a certain order of magnitude higher than the other two samples. The g value rises quickly from 0 to a maximum value (corresponding to about 12um, i.e. about twice the red cell diameter) over a distance of about 20 pixels and then drops to about 1.0. As shown below, the aggregation caused by the virus can be distinguished from the case where the aggregation caused by the virus is inhibited without the virus or the antibody and the aggregation is not caused.
| Virus
|
Antibodies
|
Agglutination
|
g max
|
| Is free of
|
Is free of
|
Whether or not
|
1.44
|
| Is provided with
|
Is free of
|
Is that
|
1.67
|
| Is provided with
|
Is provided with
|
Whether or not
|
1.47 |
Example 24: analyte detection system preparation using aptamers
Two oligo-DNA aptamers were designed to selectively capture proteins (thrombin and insulin). The oligomeric DNA aptamers consist of binding sites having a sequence selected from published data, an insert extending the binding sites from the surface of the microsphere or microarray, and a reactive group chemically immobilizing the aptamers to the surface. Aptamer 1 (specific for thrombin) has the following sequence: 5' -Am- (T)45GGTTGGTGTGGTTGG-3'. Aptamer 2 (specific for insulin) has the following sequence: 5' -Am- (T)32ACAGGGGTGTGGGGACAGGGGTGTGGGG-3'. The "Am" at the beginning of each sequence represents an amino group.
These two aptamers were immobilized on carboxyl functionalized polystyrene microspheres (5 um). The microspheres are then washed to remove excess reagents. Subsequently, the microspheres are mixed with a fluorescently labeled oligo-DNA probe complementary to the aptamer binding site. Hybridization of the probe to the aptamer is detected by fluorescence emission. Based on the mean fluorescence emission, only complementary probes show positive hybridization events. The specificity of hybridization can be seen by comparing FIG. 139 with FIG. 140, with FIG. 139 showing the microspheres after hybridization with complementary probes and FIG. 140 showing the microspheres after hybridization with non-complementary probes. After the microspheres are precipitated onto the assay matrix, their emission is filtered by a CCD camera at 650nm (+ -10 nm) at 635nm laser excitation, thereby performing detection. A similar procedure was also applied to the glass surface coated with epoxysilane to immobilize aptamers 1 and 2. The array was hybridized with fluorescent probes and the specific recognition of the aptamer binding site was detected by fluorescence emission detection using a CCD camera setup and array scanner (Inopsys). FIG. 141 shows the binding specificity of the aptamers on the array, and more detail is shown in FIG. 142. Fig. 143 illustrates an exemplary array scan.
Example 25: detection of analytes using aptamers
An array comprising aptamers 1 hybridized to fluorescently labeled complementary probes was prepared as described in example 24. Thrombin was introduced into the array at a concentration of about 100nM and reacted with the aptamer 1-probe complex. The fluorescence emission signal from aptamer 1 on the array was attenuated by a factor of 2.5, indicating that the probe was displaced by the binding of aptamer 1 to the thrombin.
Example 26: binding device
Both types of binders were biotinylated and used to generate capture surfaces on solid phases of avidin coated array elements. Assay reagent production and luminescence readout analysis results were obtained using (1) aptamers and (2) single chain Fv antibody fragments (SCFVs) on microtiter plates. Aptamers and SCFVs as binders for luminescence-based assays are suitable for use in the tips and imaging systems and devices described herein. The analyte can be determined and read by changing the signal-generating reagent from alkaline phosphatase to, for example, horseradish peroxidase with a chromogenic substrate, or by measuring the color using a camera using alkaline phosphatase with a chromogenic substrate. The tips in a microtiter plate (or other format) can be read in any cartridge (assay unit) format.
Example 27: analysis of vitamin D on microtiter plates Using DNA aptamers
In this example, the analysis of vitamin D was performed using single-stranded DNA aptamers. Biotinylated DNA aptamers were coated on microtiter plates with multiple wells coated with a polystyrene surface coated with super avidin. Aptamers were rapidly denatured and renatured by heating at about 95 degrees celsius prior to coating, and then immediately cooled on ice. Subsequently, about 15. mu.l of NaCl, MgCl were contained2Folded biotinylated vitamin D DNA aptamers in 25mM Tris, 10% ethanol, pH 7.5, were added to each well to form a capture surface. After coating, each well was washed and blocked with approximately 100uL of blocking reagent to reduce non-specific binding.
The analyte (vitamin D) for this assay was assayed in Tris, NaCl, MgCl 210% ethanol, pH 7.5, and mixed with vitamin D-alkaline phosphatase conjugate solution at various concentrations within the desired range of analysis, and then sent to the analysis unit for 10 minutes at room temperature. Subsequently, the analysis unit was washed three times with 100uL of wash buffer. About 40uL of alkaline phosphatase substrate was added to each assay well and chemiluminescent data (as listed in the table below) was collected after about 10 minutes. FIG. 144 shows a chemiluminescence versus vitamin D concentration (ng/ml).
| Vitamin D (ng/ml)
|
0
|
1
|
100
|
200
|
| Chemiluminescence (RLU)
|
155674.1
|
113824.3
|
49346.13
|
33824.27
|
| |
159471
|
110794.2
|
49699.04
|
35794.18
|
| |
162650.3
|
101655.7
|
53158.25
|
36655.66
|
| |
159920.8
|
99266.41
|
50195.63
|
35166.41
|
| Mean value of
|
159429.1
|
106385.1
|
50599.76
|
35360.13
|
| cv%
|
1.80
|
6.60
|
3.44
|
3.37
|
| B/B0
|
100%
|
67%
|
32%
|
22% |
Example 28: estradiol assay on microtiter plates
In this example, steroid hormone (estradiol) was analyzed using single chain variable fragment (scfv). In this assay, the inner surface of the assay unit is coated with biotinylated scfv, which is located on a polystyrene surface coated with super avidin in a microtiter plate with multiple wells. To each assay unit was added approximately 15 microliters of 1ug/ml biotinylated scfv Tris buffered saline, pH 8, 0.03% BSA, 0.05% thimerosal. After washing, each assay unit was fixed with 100uL of fixing reagent, followed by drying in dry air overnight and kept dry for storage.
The analyte (free estradiol) for this assay was diluted in Tris buffered saline, pH 8, BSA, thimerosal, and mixed with estradiol-alkaline phosphatase conjugate solution in a stabilizer provided by Biostab, and then sent to the scfv-coated assay unit for about 10 minutes at room temperature.
The assay wells were then washed 5 times with 100uL of wash buffer. After washing, 40uL of a fluorogenic substrate of alkaline phosphatase (KPL PhosphaGlo) was added to each assay unit and chemiluminescence data (listed in the table below) was collected after about 10 minutes. FIG. 145 shows chemiluminescence vs. estradiol concentration (pg/ml).
Example 29: white blood cell count and differential analysis
The concentration of White Blood Cells (WBCs) in the peripheral blood of the human subject ranges from about 1000 to 100000 white blood cells per ul. In some cases, however, the range of imaging systems is more limited, such as from about 4000 to 7000 per ul. If the cell concentration is below 4000 cells/ul, the system will not count up to the 10000 cells target that may be required for analysis. If the cell concentration in the sample exceeds 7000 cells/ul, each field of view may be too crowded to allow accurate image segmentation and cell counting. An exemplary method for WBC imaging is as follows.
In one example, an imaging system (e.g., a cytometer) is provided that is configured for use with fluorescence spectrophotometry. The system uses fluorescence spectrophotometry to measure the concentration of cells in a sample. The sample is labeled with a fluorescent conjugated antibody (e.g., AF647-CD45) and a fluorescent nucleic acid marker (e.g., DRAQ5) for imaging. Quantitative fluorescence readings on the spectrophotometer module provide WBC concentration measurements with low sensitivity (LLOQ of about 5000/ul) but high dynamic range (e.g., 5000-. Concentration measurements on a spectrophotometer can allow calculation of the optimal dilution ratio such that the final concentration of the cell suspension is between 4000-7000/ul.
Fig. 146 shows the high fluorescence dynamic range in WBC concentration spectrophotometry. The WBCs with fluorescently labeled anti-CD 45 and other antibody tags were excited with red light at a wavelength of about 640nm and their quantitative fluorescence emission spectra were collected. The integrated fluorescence is plotted on the y-axis.
Example 30: isothermal amplification detection of group A streptococcus
Isothermal amplification of a particular genomic sample can be detected by turbidity. In this example, the mother liquor concentration provided by group a streptococcus (StrepA) cells (My biosource) is 2x10⁸org/ml) was subjected to isothermal amplification, and the reaction progress was measured by turbidity. About 5ul of stock bacterial cells and 45ul of RT PCR grade water (10X dilution of stock) were heat treated at about 95 degrees Celsius for about 8 to 10 minutes (cells burst and release DNA). The genomic sample is diluted and introduced into a PCR tube containing amplification reagents (e.g., DNA polymerase, primers, buffer) in a sample volume of about 25 ul. The PCR tube was incubated at about 61 degrees celsius for about 60 minutes while recording the reaction progress by turbidity. The results are as follows, and FIG. 147 shows an image of turbidity as a function of time:
three different experiments were performed at 800 parts/uL and 80 parts/uL. StrepA with synthetic genomic DNA template (supplied by Genescript) was used in experiment a. In experiment B, StrepA was diluted 10-fold, followed by heat inactivation at 95 degrees celsius for about 8 to 10 minutes, and then serial dilutions of heat inactivated, 10-fold diluted mother liquor StrepA were performed. In experiment C, a stock solution StrepA (inactivated bacterial cells) with variable concentration was used, followed by heat inactivation at 95 degrees celsius for about 10 minutes. The inflection point of each experiment is shown in fig. 148. For each of 800 parts/uL and 80 parts/uL, the three plots are categorized as experiment A on the left, experiment B in the middle, and experiment C on the right. The mean inflection points are provided in the table below.
Example 31: use of magnetic microspheres
In this example, magnetic microspheres were used to analyze proteins and small molecules by ELISA. FIG. 110 shows an exemplary method of an enzyme-linked immunosorbent assay. The assay included two proteins, protein 1 and protein 2. Protein 1 had about 150 sample dilutions (pipette tip procedure ═ 30 fold dilutions), a sample volume of about 0.007uL, a diluted sample volume of about 1uL, a reaction volume of about 3uL, and a reaction time of about 10 minutes (sample incubation and matrix incubation). The results for protein 1 are listed in the table below. The results of test 2 for protein 1 are shown in FIG. 149.
Protein 2 had a sample dilution of about 667 times, a sample volume of about 0.0015uL, a diluted sample volume of about 1uL, a reaction volume of about 3uL, and a reaction time of about 10 minutes (sample incubation and matrix incubation). The results for protein 2 are listed in the table below. The results of test 1 for protein 2 are shown in figure 150.
It will be appreciated from the foregoing that, while specific implementations have been illustrated and described, various modifications may be made. The specific examples provided in the specification are not intended to limit the invention. While the present invention has been illustrated by reference to the above description, the description of the preferred embodiments and the accompanying drawings herein are not to be construed in a limiting sense.
It is also to be understood that all aspects of the present invention are not limited by the specific depictions, configurations or relative proportions herein which depend upon a variety of conditions and variables. Various changes in form and detail of embodiments of the invention will be apparent to those skilled in the art. It is therefore intended that any such modifications, variations and equivalents fall within the scope of the present invention.