WO2025022632A1 - 処理システム、処理装置、処理方法および処理プログラム - Google Patents
処理システム、処理装置、処理方法および処理プログラム Download PDFInfo
- Publication number
- WO2025022632A1 WO2025022632A1 PCT/JP2023/027493 JP2023027493W WO2025022632A1 WO 2025022632 A1 WO2025022632 A1 WO 2025022632A1 JP 2023027493 W JP2023027493 W JP 2023027493W WO 2025022632 A1 WO2025022632 A1 WO 2025022632A1
- Authority
- WO
- WIPO (PCT)
- Prior art keywords
- processing
- graph
- cutting
- sensor
- cutting tool
- Prior art date
- Legal status (The legal status is an assumption and is not a legal conclusion. Google has not performed a legal analysis and makes no representation as to the accuracy of the status listed.)
- Pending
Links
Images
















Classifications
-
- B—PERFORMING OPERATIONS; TRANSPORTING
- B23—MACHINE TOOLS; METAL-WORKING NOT OTHERWISE PROVIDED FOR
- B23Q—DETAILS, COMPONENTS, OR ACCESSORIES FOR MACHINE TOOLS, e.g. ARRANGEMENTS FOR COPYING OR CONTROLLING; MACHINE TOOLS IN GENERAL CHARACTERISED BY THE CONSTRUCTION OF PARTICULAR DETAILS OR COMPONENTS; COMBINATIONS OR ASSOCIATIONS OF METAL-WORKING MACHINES, NOT DIRECTED TO A PARTICULAR RESULT
- B23Q17/00—Arrangements for observing, indicating or measuring on machine tools
-
- B—PERFORMING OPERATIONS; TRANSPORTING
- B23—MACHINE TOOLS; METAL-WORKING NOT OTHERWISE PROVIDED FOR
- B23Q—DETAILS, COMPONENTS, OR ACCESSORIES FOR MACHINE TOOLS, e.g. ARRANGEMENTS FOR COPYING OR CONTROLLING; MACHINE TOOLS IN GENERAL CHARACTERISED BY THE CONSTRUCTION OF PARTICULAR DETAILS OR COMPONENTS; COMBINATIONS OR ASSOCIATIONS OF METAL-WORKING MACHINES, NOT DIRECTED TO A PARTICULAR RESULT
- B23Q17/00—Arrangements for observing, indicating or measuring on machine tools
- B23Q17/09—Arrangements for observing, indicating or measuring on machine tools for indicating or measuring cutting pressure or for determining cutting-tool condition, e.g. cutting ability, load on tool
-
- G—PHYSICS
- G05—CONTROLLING; REGULATING
- G05B—CONTROL OR REGULATING SYSTEMS IN GENERAL; FUNCTIONAL ELEMENTS OF SUCH SYSTEMS; MONITORING OR TESTING ARRANGEMENTS FOR SUCH SYSTEMS OR ELEMENTS
- G05B19/00—Program-control systems
- G05B19/02—Program-control systems electric
- G05B19/18—Numerical control [NC], i.e. automatically operating machines, in particular machine tools, e.g. in a manufacturing environment, so as to execute positioning, movement or co-ordinated operations by means of program data in numerical form
- G05B19/406—Numerical control [NC], i.e. automatically operating machines, in particular machine tools, e.g. in a manufacturing environment, so as to execute positioning, movement or co-ordinated operations by means of program data in numerical form characterised by monitoring or safety
Definitions
- This disclosure relates to a processing system, a processing device, a processing method, and a processing program.
- Patent Document 1 discloses a method for setting or monitoring operating parameters of a workpiece processing machine, the workpiece processing machine having a tool holder and a means for moving the workpiece and the tool holder relative to each other along at least a first axis, wherein during a processing operation of the tool holder to which the workpiece is attached and during application of the tool to the workpiece, values of at least one of the following measurement variables (a) to (c) occurring at the tool during the interaction between the tool and the workpiece and transmitted to the tool holder are detected and recorded for a processing sequence, and the ascertained value of the at least one measurement variable is used to set operating parameters for an extended service life of the tool used, to monitor the processing operation in terms of its reproducibility, or to monitor tool wear or machine errors of the workpiece processing machine, in conjunction with a processing time below the maximum processing time: (a) an axial force acting in a direction parallel to the first axis; (b) a torque present about the first axis
- the processing system disclosed herein includes a cutting tool, a sensor, and a processing unit, and the sensor measures a physical quantity indicating the state of the load on the cutting tool during cutting processing.
- the processing unit creates a graph including multiple plots showing data on the load at each measurement time point based on the measurement results of the sensor at multiple measurement time points, and detects the state of cutting processing using the cutting tool based on the area occupied by the multiple plots in the created graph.
- One aspect of the present disclosure can be realized not only as a processing system having such a characteristic processing unit, but also as a semiconductor integrated circuit that realizes part or all of the processing system.
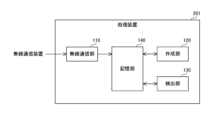
- FIG. 1 is a diagram illustrating a configuration of a processing system according to an embodiment of the present disclosure.
- FIG. 2 is a cross-sectional view showing a configuration of a cutting tool according to an embodiment of the present disclosure.
- FIG. 3 is a diagram showing a configuration of a processing device in a cutting system according to an embodiment of the present disclosure.
- FIG. 4 is a perspective view illustrating a cutting tool according to an embodiment of the present disclosure.
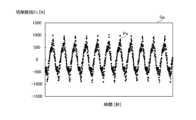
- FIG. 5 is a diagram illustrating an example of a graph created by a creating unit in the processing device according to the embodiment of the present disclosure.
- FIG. 6 is a diagram illustrating an example of a graph created by a creating unit in the processing device according to the embodiment of the present disclosure.
- FIG. 1 is a diagram illustrating a configuration of a processing system according to an embodiment of the present disclosure.
- FIG. 2 is a cross-sectional view showing a configuration of a cutting tool according to an embodiment of the present disclosure.
- FIG. 3 is a diagram
- FIG. 7 is a diagram illustrating an example of a graph created by a creating unit in the processing device according to the embodiment of the present disclosure.
- FIG. 8 is a diagram illustrating an example of a graph created by a creating unit in the processing device according to the embodiment of the present disclosure.
- FIG. 9 is a diagram illustrating an example of a graph created by a creating unit in the processing device according to the embodiment of the present disclosure.
- FIG. 10 is a diagram illustrating an example of a graph created by a creating unit in the processing device according to the embodiment of the present disclosure.
- FIG. 11 is a diagram illustrating another example of a graph created by the creating unit in the processing device according to the embodiment of the present disclosure.
- FIG. 12 is a diagram illustrating another example of a graph created by the creating unit in the processing device according to the embodiment of the present disclosure.
- FIG. 13 is a diagram illustrating another example of a graph created by the creating unit in the processing device according to the embodiment of the present disclosure.
- FIG. 14 is a diagram illustrating another example of a graph created by the creating unit in the processing device according to the embodiment of the present disclosure.
- FIG. 15 is a diagram illustrating an example of a detection process performed by a detection unit in the processing device according to an embodiment of the present disclosure.
- FIG. 16 is a diagram illustrating a simulation result for explaining the detection accuracy of abnormal vibration by the processing device according to the embodiment of the present disclosure.
- FIG. 17 is a diagram illustrating a simulation result for explaining the detection accuracy of abnormal vibration by the processing device according to the embodiment of the present disclosure.
- FIG. 18 is a diagram illustrating a simulation result for explaining the detection accuracy of abnormal vibration by the processing device according to the embodiment of the present disclosure.
- FIG. 19 is a diagram illustrating a simulation result for explaining the detection accuracy of abnormal vibration by the processing device according to the embodiment of the present disclosure.
- FIG. 20 is a diagram illustrating a simulation result for explaining the detection accuracy of abnormal vibration by the processing device according to the embodiment of the present disclosure.
- FIG. 21 is a diagram illustrating a simulation result for explaining the detection accuracy of abnormal vibration by the processing device according to the embodiment of the present disclosure.
- FIG. 22 is a diagram illustrating a simulation result for explaining the detection accuracy of abnormal vibration by the processing device according to the embodiment of the present disclosure.
- FIG. 23 is a diagram illustrating a simulation result for explaining the detection accuracy of abnormal vibration by the processing device according to the embodiment of the present disclosure.
- FIG. 24 is a diagram illustrating a simulation result for explaining the detection accuracy of abnormal vibration by the processing device according to the embodiment of the present disclosure.
- FIG. 25 is a schematic diagram of a graph created by a creating unit in a processing device according to an embodiment of the present disclosure.
- FIG. 26 is a schematic diagram showing the positional relationship of plots in a graph created by a creation unit in a processing device according to an embodiment of the present disclosure.
- FIG. 27 is a schematic diagram showing the positional relationship of plots in a graph created by a creation unit in a processing device according to an embodiment of the present disclosure.
- FIG. 28 is a diagram showing a simulation result for explaining the relationship between the pitch of plots included in a graph created by a processing device according to an embodiment of the present disclosure and detection accuracy.
- FIG. 29 is a diagram showing a simulation result for explaining the relationship between the pitch of plots included in a graph created by a processing device according to an embodiment of the present disclosure and detection accuracy.
- FIG. 30 is a diagram showing a simulation result for explaining the relationship between the pitch of plots included in a graph created by a processing device according to an embodiment of the present disclosure and detection accuracy.
- FIG. 28 is a diagram showing a simulation result for explaining the relationship between the pitch of plots included in a graph created by a processing device according to an embodiment of the present disclosure and detection accuracy.
- FIG. 31 is a flowchart defining an example of an operational procedure when a processing device according to an embodiment of the present disclosure acquires a sensor measurement value.
- FIG. 32 is a flowchart defining an example of an operation procedure when a processing device according to an embodiment of the present disclosure performs a detection process.
- FIG. 33 is a diagram illustrating a configuration of a processing system according to a modified example of the embodiment of the present disclosure.
- FIG. 34 is a diagram illustrating an example of a graph created by a creating unit in the processing device according to an embodiment of the present disclosure.
- FIG. 35 is a diagram illustrating an example of a graph created by a creating unit in the processing device according to an embodiment of the present disclosure.
- the present disclosure has been made to solve the above-mentioned problems, and its purpose is to provide a processing system, processing device, processing method, and processing program that are capable of more accurately detecting the state of cutting processing using a cutting tool.
- a processing system includes a cutting tool, a sensor, and a processing unit, the sensor measures a physical quantity indicating a state related to the load on the cutting tool during cutting processing, the processing unit creates a graph including multiple plots indicating data related to the load at each measurement time point based on the measurement results of the sensor at multiple measurement time points, and detects the state of cutting processing using the cutting tool based on the area occupied by the multiple plots in the created graph.
- the processing unit may create the graph in which the size of the plot is set according to the pitch of the plot.
- This configuration makes it possible to create a graph in which changes in the amplitude of abnormal vibrations are easily reflected by the area occupied by multiple plots.
- the processing unit may create the graph including the plot having a diameter that is 5% or more of the maximum value of the data based on the measurement results of the sensor obtained in advance before the operation of the processing system and that is 20% or less of the maximum value of the data.
- This configuration ensures that there is an area where the plots overlap when no abnormal vibrations are occurring, and when abnormal vibrations occur, the overlap between the plots is more reliably eliminated without the plots going beyond the graph, so abnormal vibrations can be detected with higher sensitivity by using the area occupied by multiple plots as an evaluation value.
- the processing unit may create the graph based on the measurement results of the sensor at the multiple measurement points during the period required for the cutting tool or the object to be cut to rotate multiple times.
- This configuration makes it possible to obtain the measurement results necessary to create graphs while keeping the sampling period for obtaining sensor measurement results low.
- the processing unit may create multiple graphs in which the plot sizes are different.
- This configuration makes it possible to create multiple graphs depending on the application, such as graphs for analysis and graphs for display.
- the processing unit may perform a process of selectively displaying at least one of the multiple graphs.
- the processing unit may detect the state of cutting processing using the cutting tool based on the area occupied by the multiple plots in each of the multiple graphs.
- This configuration makes it possible to detect a variety of abnormal vibrations with different amplitudes with greater sensitivity.
- the processing unit may create the graph of a time series including the multiple plots showing the correspondence between the measurement time points and the data.
- the processing system may include a plurality of the sensors, and the processing unit may create the graph including the plurality of plots showing the correspondence of the data regarding the load in two directions in a plane perpendicular to the rotation axis of the cutting tool for each of the measurement points based on the measurement results of each of the sensors at the measurement points.
- This configuration allows for more sensitive detection of changes in the amplitude of abnormal vibrations compared to configurations that use time-series graphs to detect the state of the cutting process.
- the senor may be a strain sensor or an acceleration sensor.
- the senor is a strain sensor, it can more accurately detect deformations of the cutting tool that affect machining accuracy. Also, if the sensor is an acceleration sensor, it can detect smaller vibrations of the cutting tool.
- a processing device includes a measurement result acquisition unit that acquires a measurement result of a sensor, which is a measurement result of a physical quantity that indicates a state related to the load of a cutting tool during cutting processing; a creation unit that creates a graph including a plurality of plots that indicate data related to the load at each measurement time point based on the measurement results of the sensor at multiple measurement time points acquired by the measurement result acquisition unit; and a detection unit that detects the state of cutting processing using the cutting tool based on the area occupied by the plurality of plots in the graph created by the creation unit.
- a processing method is a processing method in a processing device, and includes the steps of acquiring a measurement result of a sensor, the measurement result being a physical quantity indicating a state related to the load of a cutting tool during cutting processing, creating a graph including a plurality of plots indicating data related to the load at each of the measurement points based on the acquired measurement results of the sensor at the plurality of measurement points, and detecting the state of cutting processing using the cutting tool based on the area occupied by the plurality of plots in the created graph.
- a processing program is a processing program used in a processing device, and causes a computer to function as: a measurement result acquisition unit that acquires the measurement results of a sensor, which are measurement results of a physical quantity that indicates the state of the load on the cutting tool during cutting processing; a creation unit that creates a graph including multiple plots that indicate data on the load for each measurement time point based on the measurement results of the sensor at multiple measurement time points acquired by the measurement result acquisition unit; and a detection unit that detects the state of cutting processing using the cutting tool based on the area occupied by the multiple plots in the graph created by the creation unit.
- FIG. 1 is a diagram showing a configuration of a processing system according to an embodiment of the present disclosure.
- the processing system 301 includes a cutting tool 101, a plurality of strain sensors 20, and a processing device 201.
- the processing device 201 is an example of a processing unit in the processing system 301.
- the cutting tool 101 is, for example, an end mill used in a machine tool such as a milling machine, and is used for milling an object to be cut that is made of metal or the like.
- the cutting tool 101 is, for example, an end mill with an indexable cutting edge.
- the cutting tool 101 is used while being held in a tool holder 210 such as an arbor.
- the cutting tool 101 includes a shaft portion 10, a housing 24, a battery 22, a wireless communication device 23, and a blade attachment portion 12.
- the shaft portion 10 includes a shank portion 11.
- the housing 24 is indicated by an imaginary two-dot chain line.
- the blade attachment portion 12 is provided on the cutting tool 101 closer to the tip than the shaft portion 10.
- the blade attachment portion 12 includes, for example, four blade fixing portions 13.
- a tip 14 is attached to each blade fixing portion 13.
- the blade attachment portion 12 may include one, two, three, five or more blade fixing portions 13.
- the tip 14 is, for example, a throw-away tip.
- the tip 14 is attached to the blade fixing part 13 by, for example, screwing.
- the tip 14 may be fixed to the blade fixing part 13 by means other than screwing.
- the cutting tool 101 may be a so-called solid end mill that has a cutting blade that is integrated with the shaft part 10 instead of the blade attachment part 12.
- the tool holder 210 is attached to the spindle 220 of the machine tool.
- the spindle 220 is cylindrical and applies a rotational force to the tool holder 210.
- the tool holder 210 is a cylindrical member that is arranged on an extension of the spindle 220. Specifically, the upper end of the tool holder 210 is held by the spindle 220. Furthermore, the lower end of the tool holder 210 holds the shank portion 11 of the cutting tool 101.
- the strain sensor 20 is attached to the circumferential surface of the shaft portion 10 via an adhesive or a pressure sensitive adhesive.
- the strain sensor 20 may also be attached to the circumferential surface of the tool holder 210.
- the housing 24 houses the strain sensor 20. Specifically, the housing 24 includes a bottom plate portion and a side wall portion, not shown. The housing 24 covers the strain sensor 20 from below and from the sides.
- the battery 22 and the wireless communication device 23 are stored in the housing 24.
- the battery 22 and the wireless communication device 23 are fixed to a bottom plate or a side wall of the housing 24.
- the wireless communication device 23 includes a communication circuit, for example, a communication IC (Integrated Circuit).
- the battery 22 is connected to the strain sensor 20 and the wireless communication device 23 via a power line (not shown).
- the battery 22 supplies power to the strain sensor 20 and the wireless communication device 23 via the power line.
- the processing system 301 has three strain sensors 20.
- the processing system 301 may be configured to have a smaller number of strain sensors 20 than the number of tips 14 in the cutting tool 101, or may be configured to have a larger number of strain sensors 20 than the number of tips 14 in the cutting tool 101.
- the processing system 301 may also be configured to have a number of strain sensors 20 that is not correlated with the number of tips 14 in the cutting tool 101.
- FIG. 2 is a cross-sectional view showing the configuration of a cutting tool according to an embodiment of the present disclosure.
- FIG. 2 is a cross-sectional view taken along line II-II in FIG. 1.
- strain sensors 20A, 20B, and 20C are provided on the shaft portion 10 as the strain sensor 20.
- Strain sensor 20B is provided at a position shifted 90° from the position where strain sensor 20C is provided in the circumferential direction of the shaft portion 10.
- Strain sensor 20A is provided at a position shifted 90° from the position where strain sensor 20B is provided in the circumferential direction of the shaft portion 10.
- Strain sensors 20A and 20C are provided at positions that are point symmetrical with respect to the rotation axis 17 of the shaft portion 10.
- Strain sensors 20A, 20B, and 20C may be provided at the same position or at different positions in the direction along the rotation axis 17 of the shaft portion 10, for example.
- the strain sensors 20A, 20B, and 20C may be provided, for example, on the circumferential surface of the shaft portion 10 or the tool holder 210 as described above, regardless of the position of the blade attachment portion 12. In other words, the strain sensors 20A, 20B, and 20C do not need to be provided at a position along the rotation axis 17 from the blade fixing portion 13 on the circumferential surface of the shaft portion 10 or the tool holder 210.
- the direction from the rotation axis 17 to the position where the strain sensor 20A is provided is referred to as the X direction
- the direction from the rotation axis 17 to the position where the strain sensor 20B is provided is referred to as the Y direction.
- the strain sensor 20 measures a physical quantity that indicates the state of the load on the cutting tool 101 during cutting processing. More specifically, the strain sensor 20 measures the strain ⁇ of the shaft portion 10 as a physical quantity that indicates the state of the load on the cutting tool 101 during cutting processing.
- the strain sensor 20 may be configured to measure shear strain as the strain ⁇ , may be configured to measure vertical strain, or may be configured to measure both shear strain and vertical strain.
- the strain sensor 20 measures the strain ⁇ , for example, during the period from time ts, which is the start time of the cutting process, to time te, which is the end time, and transmits an analog signal of a level corresponding to the strain ⁇ to the wireless communication device 23 via a signal line (not shown).
- the wireless communication device 23 performs AD (Analog Digital) conversion on the analog signal received from the strain sensor 20 at a predetermined sampling period, and generates a sensor measurement value that is a digital value after conversion. More specifically, the wireless communication device 23 generates a sensor measurement value sx by AD converting the analog signal of strain ⁇ received from the strain sensor 20A, generates a sensor measurement value sy by AD converting the analog signal of strain ⁇ received from the strain sensor 20B, and generates a sensor measurement value sr by AD converting the analog signal of strain ⁇ received from the strain sensor 20C.
- AD Analog Digital
- the wireless communication device 23 assigns a timestamp indicating the sampling timing to the generated sensor measurement values sx, sy, sr, and stores the sensor measurement values sx, sy, sr with the timestamp in a storage unit (not shown).
- the wireless communication device 23 acquires one or more sets of sensor measurement values sx, sy, sr from the storage unit, for example at a predetermined interval, generates a wireless signal including the acquired sensor measurement values sx, sy, sr and identification information of the corresponding strain sensor 20, and transmits the generated wireless signal to the processing device 201.
- the processing device 201 includes a wireless communication unit 110, a creation unit 120, a detection unit 130, and a storage unit 140.
- the wireless communication unit 110 is an example of a measurement result acquisition unit.
- a part or all of the wireless communication unit 110, the creation unit 120, and the detection unit 130 are realized, for example, by a processing circuit including one or more processors.
- the storage unit 140 is, for example, a non-volatile memory included in the processing circuit.
- the processing device 201 performs a detection process to detect the state of cutting processing using the cutting tool 101.
- the wireless communication unit 110 acquires the measurement results of the strain sensor 20, which are physical quantity measurement results that indicate a state related to the load on the cutting tool 101 during cutting processing.
- the wireless communication unit 110 communicates wirelessly with the wireless communication device 23 in the cutting tool 101.
- the wireless communication device 23 and the wireless communication unit 110 communicate wirelessly using a communication protocol such as ZigBee (registered trademark) conforming to IEEE 802.15.4, Bluetooth (registered trademark) conforming to IEEE 802.15.1, and UWB (Ultra Wide Band) conforming to IEEE 802.15.3a.
- a communication protocol other than the above may be used between the wireless communication device 23 and the wireless communication unit 110.
- the wireless communication unit 110 acquires the sensor measurement values sx, sy, sr and the identification information from the wireless signal received from the wireless communication device 23 in the cutting tool 101. The wireless communication unit 110 then associates the sensor measurement values sx, sy, sr with the identification information and stores them in the storage unit 140.
- the creation unit 120 creates a graph G including a plurality of plots P showing data related to the load on the cutting tool 101 at each measurement time point, based on the measurement results of the strain sensor 20 at a plurality of measurement time points acquired by the wireless communication unit 110. More specifically, the creation unit 120 creates the graph G based on the sensor measurement values sx, sy, and sr stored in the storage unit 140 by the wireless communication unit 110. The graph G is used in the detection process in the detection unit 130, which will be described later.
- FIG. 4 is a perspective view showing a schematic diagram of a cutting tool according to an embodiment of the present disclosure.
- a load i.e., cutting resistance F [N]
- F [N] cutting resistance
- the creation unit 120 calculates cutting resistance Fx, which is the cutting resistance F in the X direction that the cutting tool 101 receives on the cutting resistance acting surface 18, and cutting resistance Fy, which is the cutting resistance F in the Y direction that the cutting tool 101 receives on the cutting resistance acting surface 18, based on the sensor measurement values sx, sy, and sr.
- the storage unit 140 stores a conversion formula Fm1 for converting the sensor measurement values sx, sy, sr into cutting resistances Fx, Fy.
- the conversion formula Fm1 is created in advance using the techniques described in Patent Documents 2 and 3. More specifically, the conversion formula Fm1 is a conversion matrix created in advance based on the sensor measurement values sx, sy, sr obtained when a known load is applied to the cutting tool 101.
- the creation unit 120 calculates the cutting resistances Fx and Fy based on the sensor measurement values sx, sy, and sr and the conversion formula Fm1 in the storage unit 140.
- the sensor measurement values sx, sy, and sr and the cutting resistances Fx and Fy are an example of data related to the load.
- FIGS. 5 and 6 are diagrams showing an example of a graph created by the creation unit in the processing device according to the embodiment of the present disclosure.
- FIG. 5 and FIG. 6 show graph Ga created by the creation unit 120 when cutting is performed using the cutting tool 101 under a specified machining condition Wc1.
- the horizontal axis is time [seconds] and the vertical axis is cutting resistance Fx [N].
- FIG. 5 shows graph Ga in a state where no chatter vibration is occurring in the cutting tool 101
- FIG. 6 shows graph Ga in a state where chatter vibration is occurring in the cutting tool 101.
- the creation unit 120 creates a graph Ga, which is a time-series graph G including a plurality of plots Pa showing the correspondence between the measurement time points and the cutting resistance Fx.
- the plots Pa are an example of plots P.
- the shape of the plots Pa is a circle.
- the shape of the plots Pa may be a shape other than a circle, such as a rectangle or a triangle.
- the creation unit 120 may be configured to create a graph Ga including plots Pa showing the correspondence between the measurement time points and the cutting resistance Fy, or may be configured to create a graph Ga including plots Pa showing the correspondence between the measurement time points and the sensor measurement value sx or the sensor measurement value sy.
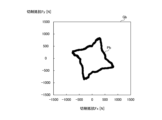
- FIGS. 7 and 8 are diagrams showing an example of a graph created by the creation unit in a processing device according to an embodiment of the present disclosure.
- FIGS. 7 and 8 show a graph Gb of cutting resistances Fx, Fy created by the creation unit 120 when cutting is performed under machining conditions Wc1 using a cutting tool 101.
- the horizontal axis is the cutting resistance Fx [N]
- the vertical axis is the cutting resistance Fy [N].
- FIG. 7 shows the graph Gb in a state where no chatter vibration is occurring
- FIG. 8 shows the graph Gb in a state where chatter vibration is occurring.
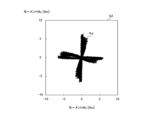
- the creation unit 120 creates a graph Gb, which is a graph G including a plurality of plots Pb showing the corresponding relationship between the cutting resistances Fx, Fy on the cutting resistance acting surface 18 for each measurement time point, based on the measurement results of each strain sensor 20 at multiple measurement time points.
- the plots Pb are an example of plots P.
- the shape of the plots Pb is a circle.
- the shape of the plots Pb may be a shape other than a circle, such as a rectangle or a triangle.
- FIGS. 9 and 10 are diagrams showing an example of a graph created by a creation unit in a processing device according to an embodiment of the present disclosure.
- FIGS. 9 and 10 show a graph Gb in which the diameter of the plot Pb is larger than that of the graph Gb shown in FIGS. 7 and 8.
- the creation unit 120 creates multiple graphs G with plots P of different sizes. More specifically, the creation unit 120 creates multiple graphs Gb with plots Pb of different diameters using the same cutting resistances Fx, Fy calculated based on the same sensor measurement values sx, sy, sr. As an example, the creation unit 120 creates two graphs Gb with plots Pb of different diameters using the same cutting resistances Fx, Fy calculated based on the same sensor measurement values sx, sy, sr, and creates a display graph Gdis with a plot Pb of a smaller diameter than the two graphs Gb.
- the creation unit 120 calculates the cutting resistances Fx, Fy at each measurement time point in a predetermined target period T, which starts from time (Pg x m), based on multiple sensor measurement values sx, sy, sr during the target period T at a creation timing according to the creation period Pg.
- the creation unit 120 then creates graphs Ga, Gb and a display graph Gdis using the calculated cutting resistances Fx, Fy.
- m is a positive integer.
- the creation period Pg may be the same as the target period T, so that the target periods T are continuous.
- the creation period Pg may be shorter than the target period T, so that the target periods T may overlap in part.
- the creation period gP may be longer than the target period T, so that the target periods T are provided intermittently.
- the creation unit 120 creates a graph G based on the measurement results of the strain sensor 20 at multiple measurement points during the period required for the cutting tool 101 to rotate multiple times.
- the target period T is the period required for the cutting tool 101 to rotate multiple times.
- the creation unit 120 creates graphs Ga, Gb and a display graph Gdis for each target period T at a creation timing according to the creation period Pg, and stores the created graph information including the graphs Ga, Gb and the display graph Gdis in association with the target period T in the storage unit 140.
- the creation unit 120 may be configured to calculate a moment Mx, which is the moment M generated by a load in the X direction, and a moment My, which is the moment M generated by a load in the Y direction, within the cutting resistance acting surface 18, instead of or in addition to the cutting resistances Fx and Fy.
- the storage unit 140 stores a conversion formula Fm2 for converting the sensor measurement values sx, sy, and sr into moments Mx and My.
- the conversion formula Fm2 is created in advance using the techniques described in Patent Documents 2 and 3. More specifically, the conversion formula Fm2 is a conversion matrix created in advance based on the sensor measurement values sx, sy, and sr obtained when a known load is applied to the cutting tool 101.
- the creation unit 120 calculates the moments Mx and My based on the sensor measurement values sx, sy, and sr and the conversion formula Fm2 in the storage unit 140.
- the moments Mx and My are an example of data related to the load.
- the creation unit 120 creates a graph Gc, which is a time series graph G including a plurality of plots Pc showing the correspondence between the measurement time points and the calculated moment Mx.
- the plots Pc are an example of plots P.
- the shape of the plots Pc is a circle.
- the shape of the plots Pc may be a shape other than a circle, such as a rectangle or a triangle.
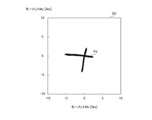
- 11 and 12 are diagrams showing other examples of graphs created by the creation unit in the processing device according to the embodiment of the present disclosure.
- 11 and 12 show a graph Gd of moments Mx and My created by the creation unit 120 when cutting is performed using the cutting tool 101 under specified machining conditions Wc2.
- the horizontal axis is moment Mx [Nm] and the vertical axis is moment My [Nm].
- FIG. 11 shows the graph Gd for the first cutting operation
- FIG. 12 shows the graph Gd for the 150th cutting operation.
- FIGS. 13 and 14 are diagrams showing other examples of graphs created by the creation unit in the processing device according to the embodiment of the present disclosure.
- FIG. 13 and FIG. 14 show a graph Gd of moments Mx, My created by the creation unit 120 when cutting is performed under a specified machining condition Wc3 using a cutting tool 101.
- FIG. 13 shows the graph Gd for the first cutting operation
- FIG. 14 shows the graph Gd for the 50th cutting operation.
- the creation unit 120 creates a graph Gd, which is a graph G including a plurality of plots Pd showing the corresponding relationship between the moments Mx, My on the cutting resistance acting surface 18 for each measurement time point, based on the measurement results of each strain sensor 20 at multiple measurement time points.
- the plots Pd are an example of plots P.
- the shape of the plots Pd is a circle.
- the shape of the plots Pd may be a shape other than a circle, such as a rectangle or a triangle.
- the absolute value of the cutting resistance Fx is larger than in the graph Ga in the state where chatter vibration is not occurring. This is because, in the state where chatter vibration is occurring, abnormal chatter vibration is added to the fundamental vibration, which is the normal vibration caused by the cutting edge biting into and separating from the workpiece to be cut. Chatter vibration has a higher frequency than the fundamental vibration, and the amplitude is small in the early stages of chatter vibration occurrence. Also, in the graph Ga in the state where chatter vibration is occurring, the area Ag occupied by the plot Pa is larger than in the graph Ga in the state where chatter vibration is not occurring. This is because the range of possible values of the cutting resistance Fx is larger in the graph Ga in the state where chatter vibration is occurring than in the graph Ga in the state where chatter vibration is not occurring, so there is less overlap between the multiple plots Pa.
- the absolute values of the cutting resistances Fx and Fy are larger in the graph Gb when chatter vibration is occurring than in the graph Gb when chatter vibration is not occurring. This is because when chatter vibration is occurring, chatter vibration, which is an abnormal vibration, is added to the fundamental vibration. Also, the area Ag occupied by the plot Pb in the graph Gb when chatter vibration is occurring is larger than in the graph Gb when chatter vibration is not occurring. This is because the absolute values of the cutting resistances Fx and Fy are larger in the graph Gb when chatter vibration is occurring than in the graph Gb when chatter vibration is not occurring, resulting in a smaller area where multiple plots Pb overlap.
- the absolute values of the moments Mx and My are larger in the graph Gd for the 150th cutting operation than in the graph Gd for the first cutting operation. This is because, when using a tip 14 that has been used for 150 cutting operations, not only does the fundamental vibration increase due to wear on the cutting blade, but abnormal vibration due to wear on the cutting blade is added to the fundamental vibration. The abnormal vibration due to wear on the cutting blade has a higher frequency and a smaller amplitude than the fundamental vibration. Also, the area Ag occupied by the plot Pd is larger in the graph Gd for the 150th cutting operation than in the graph Gd for the first cutting operation.
- the detection unit 130 performs a detection process to detect the state of cutting processing using the cutting tool 101 based on the area Ag occupied by the multiple plots P in the graph G created by the creation unit 120.
- the detection unit 130 acquires the graph G from the storage unit 140.
- the detection unit 130 generates a binary image in which the area occupied by the plot P in the acquired graph G is colored black, and the area in the graph G in which the plot P does not exist is colored white.
- the detection unit 130 calculates the number of pixels of the black area in the generated binary image as the area Ag.
- the detection unit 130 After calculating the area Ag, the detection unit 130 performs detection processing using the calculated area Ag as an evaluation value. More specifically, the detection unit 130 compares the calculated area Ag with a predetermined threshold value ThA, and detects abnormal vibrations based on the comparison result.
- the threshold value ThA is set in advance based on the area Ag that the plot P occupies in the graph G created by the creation unit 120 when normal cutting processing is being performed.
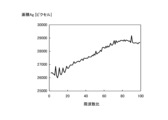
- FIG. 15 is a diagram showing an example of detection processing by a detection unit in a processing device according to an embodiment of the present disclosure.
- the horizontal axis represents the number of processing operations
- the vertical axis represents the area Ag [pixels].
- each time the detection unit 130 calculates the area Ag it compares the calculated area Ag with a threshold value ThA1, which is an example of a threshold value ThA. If the area Ag is equal to or smaller than the threshold value ThA1, the detection unit 130 determines that the state of the cutting process using the cutting tool 101 is normal. On the other hand, if the area Ag is larger than the threshold value ThA1, the detection unit 130 determines that abnormal vibrations are occurring due to wear of the cutting edge.
- the detection unit 130 may also perform the detection process using a threshold value ThA2, which is an example of the threshold value ThA, instead of or in addition to the threshold value ThA1. More specifically, the detection unit 130 compares the calculated area Ag with the threshold value ThA2 each time the area Ag is calculated. If the area Ag is equal to or smaller than the threshold value ThA2, the detection unit 130 determines that the state of the cutting process using the cutting tool 101 is normal. On the other hand, if the area Ag is larger than the threshold value ThA2, the detection unit 130 determines that chatter vibration, which is an abnormal vibration, is occurring.
- the threshold value ThA2 may be a value different from the threshold value ThA1, or may be the same value.
- the detection unit 130 may detect other abnormal vibrations that may cause changes in the plot P in the graph G, such as abnormal vibrations due to chipping of the cutting blade. Furthermore, instead of or in addition to detecting abnormal vibrations, the detection unit 130 may determine the life of the cutting tool 101 based on the area Ag. As described above, wear of the cutting blade may cause the fundamental vibration to increase. Therefore, the life of the cutting tool 101 can be determined based on the change in area Ag that accompanies an increase in the fundamental vibration.
- the detection unit 130 detects the state of cutting processing using the cutting tool 101 based on the area Ag occupied by multiple plots P in each of multiple graphs G in which the plots P are different in size. More specifically, the detection unit 130 calculates the area Ag occupied by each of multiple graphs G in which the plots P are different in size, created by the creation unit 120 using the same cutting resistances Fx and Fy. When the detection unit 130 calculates the area Ag for each graph G, it compares the calculated area Ag for each graph G with multiple thresholds ThA that differ according to the size of the plot P. For example, if at least one of the multiple areas Ag calculated for each graph G is larger than the corresponding threshold ThA1, the detection unit 130 determines that abnormal vibration due to wear of the cutting blade is occurring. Also, for example, if at least one of the multiple areas Ag calculated for each graph G is larger than the corresponding threshold ThA2, it determines that chatter vibration is occurring.
- the detection unit 130 determines that abnormal vibrations are occurring, it performs a notification process to notify the user of the processing system 301 of the determination result. For example, the user receives the notification of the determination result and stops the cutting process using the cutting tool 101.
- chatter vibrations have a small amplitude when they first occur, but as the chatter vibration grows, the amplitude increases, which may affect the machining accuracy and tool life.
- the processing device 201 can detect chatter vibrations that have a small amplitude when they first occur, and can therefore urge the user to stop cutting before they affect the machining accuracy and tool life.
- the detection unit 130 performs a process of selectively displaying at least one of a plurality of graphs G having different sizes of plot P. More specifically, when the creation unit 120 stores graph information in the storage unit 140, the detection unit 130 performs a process of displaying the display graph Gdis included in the graph information on a display (not shown). In addition, the detection unit 130 performs a process of displaying, in accordance with a user's operation, a graph G other than the display graph Gdis out of a plurality of graphs G having different sizes of plot P on a display (not shown).
- the detection unit 130 may be configured to perform the detection process using an area ratio Rg, which is the ratio of the area Ag to the area of the entire area of the graph G, as an evaluation value instead of or in addition to the area Ag. More specifically, the detection unit 130 calculates the ratio of the number of pixels of the black area in the binary image to the number of pixels of the entire area of the graph G as the area ratio Rg. After calculating the area ratio Rg, the detection unit 130 compares the calculated area ratio Rg with a predetermined threshold value ThB and detects abnormal vibrations based on the comparison result.
- the threshold value ThB is set in advance based on the area ratio Rg of the area Ag to the area of the entire area of the graph G created by the creation unit 120 when normal cutting is being performed.
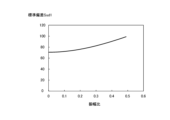
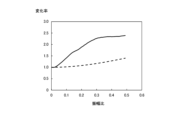
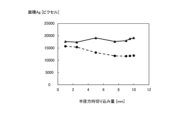
- FIG. 16 to 18 are diagrams showing simulation results for explaining the detection accuracy of abnormal vibration by the processing device according to the embodiment of the present disclosure.
- FIG. 16 to FIG. 18 show simulation results of the detection accuracy of abnormal vibration when the frequency of abnormal vibration is set to 20 times the frequency of the fundamental vibration, and the amplitude of abnormal vibration is changed from 0 to 0.5 times the amplitude of the fundamental vibration.
- the horizontal axis is the amplitude ratio of the amplitude of abnormal vibration to the amplitude of fundamental vibration.
- the vertical axis is the standard deviation Ssd1 of the amplitude of vibration.
- the vertical axis is the area Ag.
- FIG. 17 shows the simulation results of the area Ag in the graph G in which the maximum value of the data regarding the load of the cutting tool 101 is a value corresponding to 169 pixels, and the diameter of the plot P is 11 pixels.
- the vertical axis is the rate of change of the evaluation value based on the case where the amplitude of abnormal vibration is zero.
- the dashed line in FIG. 18 shows the rate of change of the standard deviation Ssd1 based on the case where the amplitude of abnormal vibration is zero.
- the solid line in FIG. 18 indicates the rate of change of the area Ag with respect to when the amplitude of the abnormal vibration is zero.
- the rate of change of area Ag when the amplitude of abnormal vibration is zero is greater than the rate of change of standard deviation Ssd1 when the amplitude of abnormal vibration is zero. Therefore, by using area Ag as the evaluation value, changes in the amplitude of abnormal vibration can be detected with higher sensitivity than when standard deviation Ssd1 is used as the evaluation value. Similarly, when area ratio Rg is used as the evaluation value, changes in the amplitude of abnormal vibration can be detected with higher sensitivity than when standard deviation Ssd1 is used as the evaluation value.
- FIG. 19 to 21 are diagrams showing simulation results for explaining the detection accuracy of abnormal vibration by a processing device according to an embodiment of the present disclosure.
- FIG. 19 to FIG. 21 show simulation results of the detection accuracy of abnormal vibration when the amplitude of abnormal vibration is set to 0.05 times the amplitude of the fundamental vibration, and the frequency of abnormal vibration is changed from 2 to 100 times the frequency of the fundamental vibration.
- the horizontal axis is the frequency ratio of the frequency of abnormal vibration to the frequency of the fundamental vibration.
- the vertical axis is the standard deviation Ssd2 of the vibration amplitude.
- the vertical axis is the area Ag.
- the vertical axis is the rate of change of the evaluation value based on the time when the frequency of abnormal vibration is twice the fundamental vibration.
- the dashed line in FIG. 21 shows the rate of change of the standard deviation Ssd2 when the frequency of the abnormal vibration is twice that of the fundamental vibration.
- the solid line in FIG. 21 shows the rate of change of the area Ag when the frequency of the abnormal vibration is twice that of the fundamental vibration.
- the rate of change of the area Ag when the frequency of the abnormal vibration is twice that of the fundamental vibration is greater than the rate of change of the standard deviation Ssd2 when the frequency of the abnormal vibration is twice that of the fundamental vibration. Therefore, by using the area Ag as the evaluation value, changes in the frequency of the abnormal vibration can be detected with higher sensitivity than when the standard deviation Ssd2 is used as the evaluation value. Similarly, when the area ratio Rg is used as the evaluation value, changes in the frequency of the abnormal vibration can be detected with higher sensitivity than when the standard deviation Ssd2 is used as the evaluation value.
- FIGS. 22 to 24 are diagrams showing simulation results for explaining the detection accuracy of abnormal vibration by the processing device according to the embodiment of the present disclosure.
- the horizontal axis is the radial cutting depth [mm].
- the vertical axis is the standard deviation of the cutting resistances Fx and Fy.
- the vertical axis is the area Ag.
- FIG. 23 shows the simulation results of the area Ag in the graph G in which the maximum value of the data on the load of the cutting tool 101 is a value corresponding to 175 pixels and the diameter of the plot P is 11 pixels.
- the vertical axis is the rate of change of the evaluation value.
- FIGS. 22 and 23 show the simulation results of the evaluation value when only the fundamental vibration due to the cutting resistances Fx and Fy is generated.
- the solid lines in FIGS. 22 and 23 show the simulation results of the evaluation value when the fundamental vibration is added with an abnormal vibration whose amplitude is 5% of the maximum value of the fundamental vibration and whose frequency is 40 times that of the fundamental vibration.
- the dashed line in FIG. 24 shows the rate of change in the standard deviation of the cutting resistances Fx and Fy due to the application of abnormal vibration.
- the solid line in FIG. 24 shows the rate of change in the area Ag due to the application of abnormal vibration.
- the area Ag has a large rate of change in standard deviation due to the application of abnormal vibration, regardless of the amount of radial cut-in. Specifically, the area Ag increases by 12% or more due to the occurrence of abnormal vibration whose amplitude is 5% of the maximum value of the fundamental vibration. Therefore, regardless of the amount of radial cut-in, abnormal vibration can be detected by using the area Ag as an evaluation value.
- the area ratio Rg has a large rate of change in standard deviation due to the application of abnormal vibration, and therefore abnormal vibration can be detected by using the area ratio Rg as an evaluation value.
- Fig. 25 is a schematic diagram of a graph created by a creation unit in a processing device according to an embodiment of the present disclosure.
- Fig. 25 shows a graph G in a state in which abnormal vibration is not occurring.
- the creation unit 120 creates a graph G including a plurality of plots P arranged on the circumference of a circle C1 of a radius R based on the sensor measurement values sx, sy, and sr.
- FIG. 26 is a schematic diagram showing the positional relationship of plots in a graph created by a creation unit in a processing device according to an embodiment of the present disclosure.
- FIG. 26 shows the positional relationship of two adjacent plots in FIG. 25.
- the creation unit 120 creates a graph G in which at least some of the plots P are arranged to overlap with other plots P in a state in which no abnormal vibration is occurring, i.e., in a state in which only fundamental vibration is occurring.
- the diameter of the plots P is d, and the plots P are arranged at a constant pitch PT.
- FIG. 27 is a schematic diagram showing the positional relationship of plots in a graph created by a creation unit in a processing device according to an embodiment of the present disclosure.
- FIG. 27 shows the positional relationship of plots P when abnormal vibration is occurring.
- the overlapping area of the two plots P becomes smaller, and therefore the area Ag occupied by plots P in graph G becomes larger. Therefore, by using the area Ag as an evaluation value, the occurrence of abnormal vibration can be detected.
- FIGS. 28 to 30 are diagrams showing simulation results for explaining the relationship between the pitch of the plots included in the graph created by the processing device according to the embodiment of the present disclosure and the detection accuracy.
- the horizontal axis is the ratio Prt_pt [%] of the pitch PT to the diameter D of the circle C1
- the vertical axis is the change rate CRg of the area Ag based on the amplitude of the abnormal vibration being zero.
- the solid lines in FIGS. 28 to 30 show the change rate CRg in a state where a random abnormal vibration of normal distribution with a standard deviation of 4% of the diameter D of the circle C1 occurs.
- FIGS. 28 to 30 show the change rate CRg in a state where a random abnormal vibration of normal distribution with a standard deviation of 12% of the diameter D of the circle C1 occurs.
- the dashed lines in FIGS. 28 to 30 show the change rate CRg in a state where a random abnormal vibration of normal distribution with a standard deviation of 20% of the diameter D of the circle C1 occurs.
- Figure 28 shows the relationship between the ratio Prt_pt and the rate of change CRg when the ratio Prt_d of the diameter d of the plot P to the diameter D of the circle C1 is 40%.
- Figure 29 shows the relationship between the ratio Prt_pt and the rate of change CRg when the ratio Prt_d of the diameter d of the plot P to the diameter D of the circle C1 is 10%.
- Figure 30 shows the relationship between the ratio Prt_pt and the rate of change CRg when the ratio Prt_d of the diameter d of the plot P to the diameter D of the circle C1 is 5%.
- the smaller the diameter d of the plot P the larger the rate of change CRg in the region where the ratio Prt_pt of the pitch PT is small. Therefore, by setting the diameter d of the plot P to a smaller value and setting the pitch PT of the plot P to a smaller value, abnormal vibrations can be detected with higher sensitivity. However, the smaller the pitch PT, the greater the number of plots P required for detection processing.
- the larger the diameter d of the plot P the smaller the rate of decrease in the rate of change CRg in response to an increase in the ratio Prt_pt. Therefore, when the diameter d of the plot P is set to a larger value, there is a greater degree of freedom in setting the pitch PT for detecting abnormal vibrations. Therefore, by setting the pitch PT to a larger value, it is possible to detect abnormal vibrations while reducing the number of plots P required for the detection process.
- the creation unit 120 creates a graph G in which the size of the plot P is set according to the pitch PT of the plot P. More specifically, the creation unit 120 acquires in advance the magnitude of the fundamental vibration that occurs when cutting is performed using the cutting tool 101. Next, the creation unit 120 acquires the magnitude of abnormal vibration that may occur when cutting is performed using the cutting tool 101, expressed as a ratio to the magnitude of the fundamental vibration. Next, the creation unit 120 determines the ratio Prt_pt of the pitch PT and the ratio Prt_d of the diameter d, which are capable of detecting abnormal vibrations that may occur, based on the simulation results of, for example, Figures 28 to 30. Note that instead of determining the ratio Prt_pt of the pitch PT, the creation unit 120 may acquire the ratio Prt_pt of the pitch PT that is preset based on the processing conditions, etc.
- the creation unit 120 creates a graph G including a plot P having a diameter d that is 5% or more and 20% or less of the maximum value of the data based on the measurement results of the strain sensor 20 acquired in advance before the operation of the processing system 301. More specifically, the creation unit 120 generates a graph G including a plurality of plots P arranged on the circumference of a circle C1 of radius R, for example, in a state where abnormal vibration is not occurring, and sets the ratio Prt_d of the diameter d of the plot P to the diameter D of the circle C1 in a numerical range of 5% or more and 20% or less.
- FIG. 31 is a flowchart defining an example of an operational procedure when a processing device according to an embodiment of the present disclosure acquires a sensor measurement value.
- the processing device 201 waits for a wireless signal from the wireless communication device 23 in the cutting tool 101 (NO in step S11), and when it receives a wireless signal (YES in step S11), it acquires the sensor measurement values sx, sy, sr and the identification information from the received wireless signal (step S12).
- the processing device 201 stores the acquired sensor measurement values sx, sy, sr and the identification information in the memory unit 140 (step S13), and waits for a new wireless signal from the wireless communication device 23 in the cutting tool 101 (NO in step S11).
- FIG. 32 is a flowchart showing an example of an operational procedure when a processing device according to an embodiment of the present disclosure performs a detection process.
- the processing device 201 waits for the creation timing according to the creation period Pg (NO in step S21), and when the creation timing arrives (YES in step S21), it calculates the cutting resistances Fx, Fy at each measurement point in the target period T based on the multiple sensor measurement values sx, sy, sr in the target period T. Note that the processing device 201 may calculate moments Mx, My instead of or in addition to the cutting resistances Fx, Fy (step S22).
- the processing device 201 creates a graph G using the calculated cutting resistances Fx and Fy (step S23).
- the processing device 201 performs a process of displaying the display graph Gdis from the created graph G on a display (not shown) (step S24).
- the processing device 201 calculates the area Ag occupied by the multiple plots P in the created graph G (step S25).
- the processing device 201 performs detection processing using the calculated area Ag as an evaluation value. More specifically, the processing device 201 compares the area Ag with a threshold value ThA, and detects abnormal vibrations based on the comparison result (step S26).
- the processing device 201 determines that abnormal vibration or chatter vibration is occurring due to wear of the cutting edge, it performs a notification process to notify the user of the processing system 301 of the determination result (step S27).
- the processing device 201 waits for a new generation timing (NO in step S21).
- the processing system 301 is configured to include a strain sensor 20, this is not limiting.
- the processing system 301 may be configured to include an acceleration sensor instead of the strain sensor 20.
- the acceleration sensor measures the acceleration in the vibration of the shaft portion 10 as a physical quantity indicating the state related to the load on the cutting tool 101 during cutting processing.
- the creation unit 120 in the processing device 201 creates a graph G based on the measurement results by the acceleration sensor.
- the strain sensor 20 can detect deformation of the cutting tool 101 that affects processing accuracy.
- the acceleration sensor can detect smaller vibrations of the cutting tool 101.
- the creation unit 120 is configured to create a graph G in which the size of the plot P is set according to the pitch PT of the plot P, but this is not limited to this.
- the creation unit 120 may also be configured to create a graph G including plots P having a size that is set regardless of the pitch PT.
- the creation unit 120 is configured to set the ratio Prt_d of the diameter d of the plot P to the diameter D of the circle C1 within a numerical range of 5% or more and 20% or less, but this is not limited to this.
- the creation unit 120 may also be configured to set the ratio Prt_d to a value outside this numerical range.
- the creation unit 120 is configured to create the graph G based on the measurement results of the strain sensor 20 at multiple measurement points in the period required for the cutting tool 101 to rotate multiple times, but this is not limited to the above.
- the creation unit 120 may be configured to create the graph G based on the measurement results of the strain sensor 20 at multiple measurement points in the period required for the cutting tool 101 to rotate once.
- the creation unit 120 is configured to create multiple graphs Gb with different diameters of the plot Pb using the same cutting resistances Fx, Fy calculated based on the same sensor measurement values sx, sy, sr, but this is not limited to the above.
- the creation unit 120 may be configured to create only one graph G using the same cutting resistances Fx, Fy calculated based on the same sensor measurement values sx, sy, sr.
- the detection unit 130 is configured to perform a process of displaying the display graph Gdis included in the graph information on a display (not shown) when the creation unit 120 stores the graph information in the storage unit 140, but this is not limited to the above.
- the detection unit 130 may be configured not to perform a process of displaying a graph G such as the display graph Gdis.
- the detection unit 130 is configured to detect the state of cutting processing using the cutting tool 101 based on the area Ag occupied by multiple plots P in each of multiple graphs G in which the plots P are different in size, but this is not limited to this.
- the detection unit 130 may also be configured to detect the state of cutting processing using the cutting tool 101 based on the area Ag occupied by multiple plots P in one graph G.
- the creation unit 120 is configured to create time-series graphs Ga, Gc and graphs Gb, Gd, but this is not limited to this.
- the creation unit 120 may be configured to create graphs Ga, Gc but not create graphs Gb, Gd.
- the creation unit 120 may be configured to create graphs Gb, Gd but not create graphs Ga, Gc.
- processing system 301 is configured to include a cutting tool 101 used in milling, this is not limited to this.
- the processing system 301 may be configured to include a generating tool used in generating tool machining instead of the cutting tool 101.
- FIG. 33 is a diagram showing the configuration of a processing system according to a modified embodiment of the present disclosure.
- processing system 302 includes cutting tool 102 instead of cutting tool 101.
- Cutting tool 102 is used for turning the workpiece WK.
- the workpiece WK is a cylindrical metal having a groove on its outer circumferential surface.
- Tip 14s is attached to cutting tool 102.
- Cutting tool 102 performs intermittent machining of the outer circumferential surface of the rotating workpiece WK.
- the wireless communication unit 110 in the processing device 201 acquires the sensor measurement values sx, sy, sr and the identification information from the wireless signal received from the wireless communication device 23 in the cutting tool 102.
- the wireless communication unit 110 then associates the sensor measurement values sx, sy, sr with the identification information and stores them in the storage unit 140.
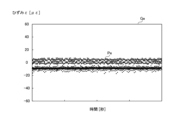
- FIGS. 34 and 35 are diagrams showing an example of a graph created by the creation unit in the processing device according to the embodiment of the present disclosure.
- FIGS. 34 and 35 show a graph Ge created by the creation unit 120 when cutting is performed using the cutting tool 103 under a specified machining condition Wc4.
- the horizontal axis is time [seconds] and the vertical axis is strain ⁇ [ ⁇ ]. Strain ⁇ is correlated with cutting resistance F.
- FIG. 34 shows the graph Ge in a state where no chatter vibration is occurring in the cutting tool 102
- FIG. 35 shows the graph Ge in a state where chatter vibration is occurring in the cutting tool 102.
- the creation unit 120 creates a graph Ge, which is a time series graph G including a plurality of plots Pe showing the correspondence between the measurement time points and the strain ⁇ .
- the plots Pe are an example of plots P.
- the shape of the plots Pe is a circle.
- the shape of the plots Pe may be a shape other than a circle, such as a rectangle or a triangle.
- the creation unit 120 creates the graph Ge based on the measurement results of the strain sensor 20 at a plurality of measurement time points during the period required for the cutting target object WK to make multiple rotations.
- the absolute value of the strain ⁇ is larger than in the graph Ge when chatter vibration is not occurring. This is because, when chatter vibration is occurring, abnormal chatter vibration is added to the fundamental vibration, which is a normal vibration caused by the cutting edge biting into and separating from the workpiece. Chatter vibration has a higher frequency than the fundamental vibration, and its amplitude is small in the early stages of chatter vibration occurrence. Also, in the graph Ge when chatter vibration is occurring, the area Ag occupied by the plot Pe is larger than in the graph Ge when chatter vibration is not occurring. This is because the range of possible values of the strain ⁇ is larger in the graph Ge when chatter vibration is occurring than in the graph Ge when chatter vibration is not occurring, so there is less overlap between multiple plots Pe.
- the detection unit 130 acquires the graph Ge from the storage unit 140.
- the detection unit 130 generates a binary image in which the area occupied by the plot Pe in the acquired graph Ge is colored black, and the area in the graph Ge where the plot Pe is not present is colored white.
- the detection unit 130 calculates the number of pixels of the black area in the generated binary image as the area Ag. After calculating the area Ag, the detection unit 130 performs detection processing using the calculated area Ag as an evaluation value.
- the processing system 301 includes a cutting tool, a strain sensor 20, and a processing device 201.
- the strain sensor 20 measures a physical quantity indicating the load state of the cutting tool 101 during cutting processing
- the processing device 201 creates a graph G including multiple plots P indicating data regarding the load at each measurement time point based on the measurement results of the strain sensor 20 at multiple measurement time points, and detects the state of cutting processing using the cutting tool 101 based on the area occupied by the multiple plots P in the created graph G.
- Each process (each function) in the above-mentioned embodiments is realized by a processing circuit (circuitry) including one or more processors.
- the above-mentioned processing circuit may be composed of an integrated circuit or the like that combines one or more memories, various analog circuits, and various digital circuits in addition to the one or more processors.
- the one or more memories store programs (instructions) that cause the one or more processors to execute each of the above processes.
- the one or more processors may execute each of the above processes according to the programs read from the one or more memories, or may execute each of the above processes according to a logic circuit designed in advance to execute each of the above processes.
- the processor may be any of various processors suitable for computer control, such as a CPU (Central Processing Unit), a GPU (Graphics Processing Unit), a DSP (Digital Signal Processor), an FPGA (Field Programmable Gate Array), and an ASIC (Application Specific Integrated Circuit).
- the physically separated processors may cooperate with each other to execute the above processes.
- the processors mounted on each of the physically separated computers may cooperate with each other via a network such as a LAN (Local Area Network), a WAN (Wide Area Network), or the Internet to execute the above processes.
- the above program may be installed into the memory from an external server device or the like via the network, or may be distributed in a state stored on a recording medium such as a CD-ROM (Compact Disc Read Only Memory), DVD-ROM (Digital Versatile Disc Read Only Memory), or semiconductor memory, and installed into the memory from the recording medium.
- a recording medium such as a CD-ROM (Compact Disc Read Only Memory), DVD-ROM (Digital Versatile Disc Read Only Memory), or semiconductor memory, and installed into the memory from the recording medium.
- a cutting tool A sensor; a processing unit;
- the sensor measures a physical quantity indicating a state related to a load on the cutting tool during cutting processing;
- the processing unit creates a graph including a plurality of plots showing data related to the load at each of the measurement time points based on the measurement results of the sensor at the plurality of measurement time points, and performs a detection process to detect a state of cutting processing using the cutting tool based on an area occupied by the plurality of plots in the created graph;
- the processing unit executes at least one of the following in the detection process: detection of abnormal vibrations due to wear of the cutting edge of the cutting tool, detection of chatter vibrations, detection of abnormal vibrations due to damage to the cutting edge, and determination of the life of the cutting tool.
Landscapes
- Engineering & Computer Science (AREA)
- Mechanical Engineering (AREA)
- Human Computer Interaction (AREA)
- Manufacturing & Machinery (AREA)
- Physics & Mathematics (AREA)
- General Physics & Mathematics (AREA)
- Automation & Control Theory (AREA)
- Numerical Control (AREA)
- Machine Tool Sensing Apparatuses (AREA)
Priority Applications (3)
| Application Number | Priority Date | Filing Date | Title |
|---|---|---|---|
| CN202380100109.XA CN121487808A (zh) | 2023-07-27 | 2023-07-27 | 处理系统、处理装置、处理方法以及处理程序 |
| PCT/JP2023/027493 WO2025022632A1 (ja) | 2023-07-27 | 2023-07-27 | 処理システム、処理装置、処理方法および処理プログラム |
| JP2024501155A JP7456074B1 (ja) | 2023-07-27 | 2023-07-27 | 処理システム、処理装置、処理方法および処理プログラム |
Applications Claiming Priority (1)
| Application Number | Priority Date | Filing Date | Title |
|---|---|---|---|
| PCT/JP2023/027493 WO2025022632A1 (ja) | 2023-07-27 | 2023-07-27 | 処理システム、処理装置、処理方法および処理プログラム |
Publications (1)
| Publication Number | Publication Date |
|---|---|
| WO2025022632A1 true WO2025022632A1 (ja) | 2025-01-30 |
Family
ID=90367054
Family Applications (1)
| Application Number | Title | Priority Date | Filing Date |
|---|---|---|---|
| PCT/JP2023/027493 Pending WO2025022632A1 (ja) | 2023-07-27 | 2023-07-27 | 処理システム、処理装置、処理方法および処理プログラム |
Country Status (3)
| Country | Link |
|---|---|
| JP (1) | JP7456074B1 (https=) |
| CN (1) | CN121487808A (https=) |
| WO (1) | WO2025022632A1 (https=) |
Families Citing this family (4)
| Publication number | Priority date | Publication date | Assignee | Title |
|---|---|---|---|---|
| DE102019135488A1 (de) * | 2019-12-20 | 2021-06-24 | Trumpf Werkzeugmaschinen Gmbh + Co. Kg | Verfahren und System zur Ermittlung des dynamischen Verhaltens einer Maschine |
| WO2025234201A1 (ja) * | 2024-05-09 | 2025-11-13 | 村田機械株式会社 | 情報処理装置、情報処理方法及び工作機械 |
| JP7740594B1 (ja) * | 2024-08-22 | 2025-09-17 | 住友電気工業株式会社 | 処理装置、処理方法、システムおよびコンピュータプログラム |
| WO2026049039A1 (ja) * | 2024-09-02 | 2026-03-05 | 京セラ株式会社 | 測定システム、切削工具、処理装置、工作機械システムおよび工作機械 |
Citations (9)
| Publication number | Priority date | Publication date | Assignee | Title |
|---|---|---|---|---|
| JPS6138847A (ja) * | 1984-07-27 | 1986-02-24 | Kawasaki Steel Corp | 切削状況の監視方法および装置 |
| JPH01118625A (ja) | 1988-10-21 | 1989-05-11 | Oji Paper Co Ltd | 多孔質炭素板の製造方法 |
| JPH0976144A (ja) * | 1995-09-14 | 1997-03-25 | Fanuc Ltd | 工作機械における加工状態監視方法 |
| JP2006071485A (ja) | 2004-09-02 | 2006-03-16 | Univ Kansai | 6軸センサ |
| US20150261207A1 (en) | 2014-03-11 | 2015-09-17 | Pro-Micron Gmbh & Co. Kg | Method for setting and/or monitoring operating parameters of a workpiece processing machine |
| JP2019069490A (ja) * | 2017-10-10 | 2019-05-09 | Dmg森精機株式会社 | 工作機械、加工方法、および加工プログラム |
| JP2019095951A (ja) * | 2017-11-21 | 2019-06-20 | 三菱重工工作機械株式会社 | 加工状態表示装置、加工システム、加工状態表示方法、プログラム |
| JP2020011330A (ja) * | 2018-07-18 | 2020-01-23 | 株式会社日立製作所 | 工作機械の状態判定システム及び工作機械の状態判定方法 |
| WO2022029988A1 (ja) * | 2020-08-07 | 2022-02-10 | 住友電気工業株式会社 | 切削システム、表示システム、処理装置、処理方法および処理プログラム |
-
2023
- 2023-07-27 WO PCT/JP2023/027493 patent/WO2025022632A1/ja active Pending
- 2023-07-27 JP JP2024501155A patent/JP7456074B1/ja active Active
- 2023-07-27 CN CN202380100109.XA patent/CN121487808A/zh active Pending
Patent Citations (9)
| Publication number | Priority date | Publication date | Assignee | Title |
|---|---|---|---|---|
| JPS6138847A (ja) * | 1984-07-27 | 1986-02-24 | Kawasaki Steel Corp | 切削状況の監視方法および装置 |
| JPH01118625A (ja) | 1988-10-21 | 1989-05-11 | Oji Paper Co Ltd | 多孔質炭素板の製造方法 |
| JPH0976144A (ja) * | 1995-09-14 | 1997-03-25 | Fanuc Ltd | 工作機械における加工状態監視方法 |
| JP2006071485A (ja) | 2004-09-02 | 2006-03-16 | Univ Kansai | 6軸センサ |
| US20150261207A1 (en) | 2014-03-11 | 2015-09-17 | Pro-Micron Gmbh & Co. Kg | Method for setting and/or monitoring operating parameters of a workpiece processing machine |
| JP2019069490A (ja) * | 2017-10-10 | 2019-05-09 | Dmg森精機株式会社 | 工作機械、加工方法、および加工プログラム |
| JP2019095951A (ja) * | 2017-11-21 | 2019-06-20 | 三菱重工工作機械株式会社 | 加工状態表示装置、加工システム、加工状態表示方法、プログラム |
| JP2020011330A (ja) * | 2018-07-18 | 2020-01-23 | 株式会社日立製作所 | 工作機械の状態判定システム及び工作機械の状態判定方法 |
| WO2022029988A1 (ja) * | 2020-08-07 | 2022-02-10 | 住友電気工業株式会社 | 切削システム、表示システム、処理装置、処理方法および処理プログラム |
Also Published As
| Publication number | Publication date |
|---|---|
| JPWO2025022632A1 (https=) | 2025-01-30 |
| CN121487808A (zh) | 2026-02-06 |
| JP7456074B1 (ja) | 2024-03-26 |
Similar Documents
| Publication | Publication Date | Title |
|---|---|---|
| WO2025022632A1 (ja) | 処理システム、処理装置、処理方法および処理プログラム | |
| CN104884926B (zh) | 轴承装置振动分析方法、轴承装置振动分析装置和滚动轴承状态监视装置 | |
| EP4137257B1 (en) | Processing system, display system, processing device, processing method and processing program | |
| EP0762248B1 (en) | Characterising a machine tool system | |
| JP7468464B2 (ja) | 取付モジュール | |
| US10830637B2 (en) | Abnormality diagnosis device and sensor detachment detection method | |
| CN105452835A (zh) | 轴承装置振动分析方法、轴承装置振动分析器以及滚动轴承状态监视系统 | |
| JP7276631B1 (ja) | 異常検知システム、異常検知装置、異常検知方法、及びコンピュータプログラム | |
| US20220364959A1 (en) | Determination apparatus, machining system, determination method, and recording medium | |
| Girardin et al. | Tool wear detection in milling—An original approach with a non-dedicated sensor | |
| US9823145B2 (en) | Bearing nut for measuring the rotational speed of a shaft connected to a turbomachine and associated measuring device | |
| CN103858013B (zh) | 用于确定铁磁组件的旋转速度的方法及装置 | |
| CN110944799A (zh) | 电动工具和方法 | |
| WO2023243043A1 (ja) | 異常検知システム、異常検知装置、異常検知方法、及びコンピュータプログラム | |
| JP7047979B1 (ja) | 切削システム、表示システム、処理装置、処理方法および処理プログラム | |
| US20240042565A1 (en) | Processing system, display system, processing apparatus, processing method, and record medium | |
| US7987919B2 (en) | Discontinuous tightening wrench comprising means for measuring dynamic events caused by this tightening on the casing of the wrench | |
| JPWO2021049338A1 (ja) | 切削工具、切削システム、処理方法および処理プログラム | |
| US20040074315A1 (en) | Method and apparatus for determining bearing parameters | |
| CN109738358B (zh) | 控制光学物质检测设备的方法、装置及光学物质检测设备 | |
| JP7260077B1 (ja) | 切削システムおよび転削工具の状態判定方法 | |
| Girardin et al. | A new method for detecting tool wear and breakage in milling | |
| JP6730152B2 (ja) | ブレーキ圧力分布計測方法およびブレーキ圧力分布計測装置 | |
| US20240426866A1 (en) | Multi-sensor field unit | |
| JP2011106546A (ja) | 転がり軸受装置及び保持器に作用する荷重の検出方法 |
Legal Events
| Date | Code | Title | Description |
|---|---|---|---|
| WWE | Wipo information: entry into national phase |
Ref document number: 2024501155 Country of ref document: JP |
|
| 121 | Ep: the epo has been informed by wipo that ep was designated in this application |
Ref document number: 23946714 Country of ref document: EP Kind code of ref document: A1 |
|
| WWE | Wipo information: entry into national phase |
Ref document number: 2023946714 Country of ref document: EP |
|
| NENP | Non-entry into the national phase |
Ref country code: DE |