WO2024161619A1 - 疵検出装置、圧延装置、疵検出方法及び圧延方法 - Google Patents
疵検出装置、圧延装置、疵検出方法及び圧延方法 Download PDFInfo
- Publication number
- WO2024161619A1 WO2024161619A1 PCT/JP2023/003505 JP2023003505W WO2024161619A1 WO 2024161619 A1 WO2024161619 A1 WO 2024161619A1 JP 2023003505 W JP2023003505 W JP 2023003505W WO 2024161619 A1 WO2024161619 A1 WO 2024161619A1
- Authority
- WO
- WIPO (PCT)
- Prior art keywords
- work roll
- image data
- frequency
- metal plate
- level data
- Prior art date
- Legal status (The legal status is an assumption and is not a legal conclusion. Google has not performed a legal analysis and makes no representation as to the accuracy of the status listed.)
- Ceased
Links
Images






Classifications
-
- G—PHYSICS
- G01—MEASURING; TESTING
- G01N—INVESTIGATING OR ANALYSING MATERIALS BY DETERMINING THEIR CHEMICAL OR PHYSICAL PROPERTIES
- G01N21/00—Investigating or analysing materials by the use of optical means, i.e. using sub-millimetre waves, infrared, visible or ultraviolet light
- G01N21/84—Systems specially adapted for particular applications
- G01N21/88—Investigating the presence of flaws or contamination
- G01N21/89—Investigating the presence of flaws or contamination in moving material, e.g. running paper or textiles
- G01N21/892—Investigating the presence of flaws or contamination in moving material, e.g. running paper or textiles characterised by the flaw, defect or object feature examined
Definitions
- This disclosure relates to a defect detection device, a rolling device, a defect detection method, and a rolling method.
- Patent Document 1 describes a method for detecting defects in rolling rolls using images obtained by imaging the surface of a steel plate rolled by rolling rolls (work rolls).
- this defect detection method the brightness data of the image of the steel plate surface captured by a CCD camera or the like is added (i.e., superimposed) to increase the S/N ratio by multiple brightness and darkness level data obtained for each length equivalent to one rotation of the rolling roll, and defects in the rolling roll are detected based on the peaks of the brightness and darkness level data.
- the ratio of signals (peaks) indicating defects in the rolling roll to noise (S/N ratio) is increased by superimposing light and dark level data for each rotation of the rolling roll.
- S/N ratio the ratio of signals (peaks) indicating defects in the rolling roll to noise
- the device configuration becomes complex, or it is necessary to image the surface of the metal plate for a long period of time during low-speed operation in order to obtain a large number of light and dark level data, which may reduce the production efficiency of the product.
- At least one embodiment of the present invention aims to provide a defect detection device, rolling device, defect detection method, and rolling method that are simple in configuration and capable of properly detecting defects in work rolls while minimizing declines in production efficiency.
- a flaw detection device includes: A defect detection device for detecting defects in a work roll of a rolling mill, comprising: an image data acquisition unit configured to acquire image data obtained by imaging a surface of the metal plate rolled by the work roll; a brightness level data acquisition unit configured to acquire brightness level data including brightness levels at each position in a conveying direction of the metal plate with respect to the image data; a frequency analysis unit configured to perform frequency analysis on the brightness level data to obtain a frequency spectrum; a detection unit configured to detect defects in the work roll based on a magnitude of a signal of a first frequency component in the frequency spectrum corresponding to a period of one rotation of the work roll; Equipped with.
- a rolling apparatus includes: a rolling mill including a work roll for rolling a metal plate;
- the above-mentioned defect detection device configured to detect defects in the work roll; Equipped with.
- a flaw detection method includes: A defect detection method for detecting defects in a work roll of a rolling mill, comprising the steps of: acquiring image data obtained by imaging a surface of the metal plate rolled by the work rolls; acquiring brightness level data including brightness levels at each position in a conveying direction of the metal plate with respect to the image data; performing frequency analysis on the brightness level data to obtain a frequency spectrum; detecting defects in the work roll based on a magnitude of a signal of a first frequency component in the frequency spectrum corresponding to a period of one rotation of the work roll; Equipped with.
- the rolling method of the present invention rolling a metal plate using a work roll; detecting defects on the work roll that has rolled the metal plate by carrying out the above-mentioned defect detection method; Equipped with.
- At least one embodiment of the present invention provides a defect detection device, rolling device, defect detection method, and rolling method that can appropriately detect defects in work rolls while suppressing a decrease in production efficiency with a simple configuration.
- FIG. 1 is a schematic configuration diagram of a rolling facility to which a flaw detection device according to an embodiment is applied; 1 is a schematic configuration diagram of a flaw detection device according to an embodiment; 1 is a flowchart of a flaw detection method according to an embodiment;
- FIG. 4 is a diagram showing an example of a change over time in the conveying speed of a metal plate in a rolling device.
- FIG. 4 is a diagram showing an example of a change over time in the conveying speed of a metal plate in a rolling device.
- FIG. 4 is a diagram showing an example of a change over time in the conveying speed of a metal plate in a rolling device.
- FIG. 2 is a diagram illustrating an image including a surface of a metal plate.
- FIG. 1 is a schematic diagram of a rolling facility to which a flaw detection device according to an embodiment is applied.
- the rolling device 1 includes a rolling mill 10 for rolling a metal sheet S (e.g., a strip-shaped steel sheet) and a flaw detection device 20.
- the rolling device 1 shown in FIG. 1 also includes an unwinder 2 provided on the entry side of the rolling mill 10 (i.e., the upstream side of the rolling mill 10 in the conveying direction of the metal sheet S being rolled), and a winder 3 provided on the exit side of the rolling mill 10 (i.e., the downstream side of the rolling mill 10 in the conveying direction of the metal sheet S being rolled).
- one rolling mill 10 is provided between the unwinder 2 and the winder 3, but in some embodiments, two or more rolling mills 10 may be provided between the unwinder 2 and the winder 3.
- the rolling mill 10 includes a pair of work rolls (rolling rolls) 12, 13 that are provided on both sides of the metal sheet S, sandwiching the metal sheet S. As shown in FIG. 1, the rolling mill 10 may also include a pair of intermediate rolls 14, 15 and a pair of backup rolls 16, 17 that are provided on the opposite side of the metal sheet S, sandwiching the pair of work rolls 12, 13. The intermediate rolls 14, 15 and the backup rolls 16, 17 are configured to support the work rolls 12, 13.
- the rolling mill 10 also includes a reduction device (hydraulic cylinder, etc.; not shown) for applying a load to the pair of work rolls 12, 13 to reduce the metal sheet S between the pair of work rolls 12, 13.
- a motor (not shown) is connected to the work rolls 12, 13 via a spindle (not shown) or the like, and the work rolls 12, 13 are rotated by the motor.
- the work rolls 12, 13 are rotated by the motor while the metal sheet S is being pressed down by the pressing device, generating frictional force between the work rolls 12, 13 and the metal sheet S, and this frictional force sends the metal sheet S to the exit side of the work rolls 12, 13.
- the unwinder 2 is configured to unwind a coil of metal sheet S toward the rolling mill 10.
- the winder 3 is configured to wind up the metal sheet S from the rolling mill 10.
- Guide rolls 6, 8, etc. may be provided between the rolling mill 10 and the unwinder 2 or winder 3 to guide the transport of the metal sheet S.
- the rolling device 1 may be a reverse-type rolling device (reverse mill) configured to roll the metal sheet S passed between a pair of work rolls 12, 13 by moving it back and forth.
- the rolling device shown in FIG. 1 is equipped with a pair of tension reels 4A, 4B provided on both sides of the rolling device in the conveying direction of the metal sheet S, and is configured to roll the metal sheet S with the rolling device 10 while moving it back and forth between the pair of tension reels 4A, 4B.
- Each of the pair of tension reels 4A, 4B is configured to be rotated by a motor when rolling the metal sheet S to apply an entry tension or an exit tension to the metal sheet S, and to function as the winder 3 and the unwinder 2 described above.
- the metal sheet S is unwound from one tension reel 4A (a tension reel that functions as an unwinder) toward the rolling mill 10, while the other tension reel 4B (a tension reel that functions as a winder) winds up the metal sheet S, while performing an odd-numbered rolling (first pass, etc.).
- the metal sheet S is unwound from the other tension reel 4B (a tension reel that functions as an unwinder) toward the rolling mill 10, while the metal sheet S is wound up by one tension reel 4A (a tension reel that functions as a winder), while the metal sheet S is advanced in the opposite direction to the previous rolling, while performing an even-numbered rolling (second pass, etc.).
- the roles of the pair of tension reels 4A, 4B are switched depending on the traveling direction (transport direction) of the metal sheet S.
- the rolling device 1 is equipped with an imaging unit 32 for imaging the surface of the metal sheet S rolled by the work rolls 12, 13.
- the imaging unit 32 may include, for example, a camera (such as a CCD camera) capable of capturing at least one of moving images and still images.
- the imaging unit 32 is configured to image one of the two surfaces of the metal sheet S that is in contact with the work roll (work roll 12 or 13) of interest for defect detection.
- the imaging unit 32 is configured to image the top surface of the rolled metal sheet S. Since defects on the upper work roll 12 are transferred to the top surface of the metal sheet S, in this embodiment, defects on the upper work roll 12 can be detected.
- the imaging unit 32 may be configured to image the bottom surface of the rolled metal sheet S. Since defects on the lower work roll 13 are transferred to the bottom surface of the metal sheet S, in this embodiment, defects on the lower work roll 13 can be detected.
- the imaging unit 32 may be configured to image the surface of the metal sheet S at a predetermined sampling interval (or frame rate).
- the imaging unit 32 is configured to image the surface of the metal sheet S over the entire width of the metal sheet S in the width direction of the metal sheet S, and over a length of at least two rotations of the work roll 12 or 13 to be detected for defects in the conveying direction of the metal sheet S (i.e., at least twice the circumference of the work roll).
- the imaging unit 32 is configured to image the surface of the metal sheet S while the metal sheet S is being conveyed while being rolled by the rolling mill 10 (i.e., while the work rolls 12, 13 are rotating while pressing down the metal sheet).
- the length (circumference) of one rotation of the work roll is approximately ⁇ D (where D is the diameter of the work roll), but more precisely, it depends on factors such as the forward slip ratio of the rolling mill 10.
- the imaging unit 32 and the flaw detection device 20 are electrically connected, and image data of the surface of the metal plate S captured by the imaging unit 32 is sent to the flaw detection device 20.
- the image data may be stored (accumulated) in a storage device provided in the flaw detection device 20.
- Fig. 2 is a schematic configuration diagram of a flaw detection device 20 according to one embodiment.
- the flaw detection device 20 is configured to detect flaws in the work roll 12 or 13 of the rolling mill 10.
- the flaw detection device 20 includes an image data acquisition unit 22, a brightness level data acquisition unit 24, a frequency analysis unit 26, and a detection unit 28.
- the flaw detection device 20 may further include a high-frequency component reduction unit 30.
- the flaw detection device 20 includes a computer equipped with a processor (CPU, etc.), a main memory device (memory device; RAM, etc.), an auxiliary memory device, and an interface.
- the flaw detection device 20 receives signals from the imaging unit 32 via the interface.
- the processor is configured to process the signals received in this manner.
- the processor is also configured to process a program deployed in the main memory device. This realizes the functions of each of the functional units described above (image data acquisition unit 22, brightness level data acquisition unit 24, frequency analysis unit 26, detection unit 28, and/or high frequency component reduction unit 30).
- the processing contents of the flaw detection device 20 are implemented as a program executed by the processor.
- the program may be stored in an auxiliary storage device, for example. When the programs are executed, they are deployed in the main storage device.
- the processor reads the program from the main storage device and executes the instructions contained in the program.
- the image data acquisition unit 22 is configured to acquire image data of the surface of the metal plate S (the metal plate S rolled by the work rolls 12, 13) captured by the imaging unit 32.
- the image data acquisition unit 22 is configured to acquire image data (i.e., image data of the surface of the metal plate S of the full width of the metal plate S x the length of two or more rotations of the work roll 12 or 13 to be detected for defects) obtained by imaging the metal plate S over the full width of the metal plate S in the width direction of the metal plate S and over a length of two or more rotations of the work roll 12 or 13 to be detected for defects in the conveying direction of the metal plate S (i.e., a length of two or more times the circumference of the work roll).
- the image data acquisition unit 22 may acquire image data obtained by combining multiple images captured by the imaging unit 32 at multiple sampling times (i.e., images with different imaging ranges of the metal plate S in the conveying direction) during the conveying of the metal plate S.
- the number of pixels corresponding to the length in the transport direction (hereinafter also simply referred to as the transport direction) of the imaged metal plate S is N
- the number of pixels corresponding to the length (width) in the width direction (hereinafter also simply referred to as the width direction) of the imaged metal plate S is M. That is, this image data includes N ⁇ M pixels.
- the coordinates of each pixel included in this image data in the transport direction are defined as X1 to XN
- the coordinates in the width direction are defined as Y1 to YM . That is, the coordinates of each pixel can be expressed as ( X1 , Y1 ) to ( XN , YM ).
- the brightness level data acquisition unit 24 is configured to acquire brightness level data including brightness levels at each position (e.g., each pixel) in the conveying direction of the metal plate S for the image data acquired by the image data acquisition unit 22.
- the brightness level data acquisition unit 24 may acquire brightness level data for the image data, for example, in the following manner. That is, first, the image data is grayscaled to acquire pixel values (numerical values indicating brightness; for example, 256 levels) of each of the N ⁇ M pixels. Then, for each position (X 1 to X N ) in the transport direction, the sum of the pixel values of M pixels in the width direction is calculated, and this is acquired as the brightness level at each position (X 1 to X N ) in the transport direction. In addition, a collection of brightness levels at each position (X 1 to X N ) in the transport direction is acquired as brightness level data.
- the frequency analysis unit 26 is configured to perform frequency analysis on the brightness level data acquired by the brightness level data acquisition unit 24 to acquire a frequency spectrum.
- This frequency spectrum indicates the relationship between the frequency (horizontal axis) and the strength of the signal indicating the brightness level (vertical axis) for the brightness level data.
- the detection unit 28 is configured to detect defects in the work roll based on the magnitude of the signal of the first frequency component corresponding to the period ( ⁇ D) of one rotation of the work roll (the work roll to be detected for defects; work roll 12 or 13) in the frequency spectrum obtained by the frequency analysis unit 26.
- a signal i.e., a signal of the first frequency component
- a pattern defects, etc.
- the high-frequency component reduction unit 30 is configured to reduce high-frequency components, the frequency of which is greater than the first frequency, from the light and dark level data acquired by the light and dark level data acquisition unit 24. Before the frequency analysis unit 26 performs frequency analysis of the light and dark level data, the high-frequency component reduction unit 30 reduces the above-mentioned high-frequency components from the light and dark level data, so that the signal components of the light and dark level data of the target frequency (first frequency) can be detected with high accuracy in the frequency spectrum obtained by the frequency analysis. In other words, defects in the work roll can be detected with high accuracy.
- Visual information (text, images, etc.) related to the detection results (presence or absence of defects in the work roll being detected) from the detection unit 28 may be output to a display unit 36 (display, etc.).
- auditory information (sound, etc.) related to the detection results from the detection unit 28 may be output from a sound generator (not shown; speaker, etc.).
- defect detection method Next, a method for detecting defects in a work roll according to some embodiments will be described.
- the defect detection method may be performed using other devices, or some or all of the procedures described below may be performed manually.
- the following describes a case where defects in the work roll 12 (upper work roll) of the above-mentioned rolling mill 1 are detected, but in some embodiments, defects in the lower work roll may be detected.
- FIG. 3 is a schematic flowchart of a defect detection method according to some embodiments.
- the image data acquisition unit 22 first acquires image data of the surface of the metal sheet S (the metal sheet S rolled by the work rolls 12, 13) captured by the imaging unit 32 (S100).
- image data is acquired by imaging the metal sheet S over the full width of the metal sheet S in the width direction of the metal sheet S and over a length of at least two rotations of the work roll 12 or 13 to be detected for defects in the conveying direction of the metal sheet S (i.e., a length of at least twice the circumference of the work roll) (i.e., image data of the surface of the metal sheet S over a length of at least the full width of the metal sheet S times two rotations of the work roll).
- the image data acquisition unit 22 may acquire image data that is a composite of multiple images captured by the imaging unit 32 at multiple sampling times during the conveying of the metal sheet S (i.e., images with different imaging ranges of the metal sheet S in the conveying direction).
- the brightness level data acquisition unit 24 acquires brightness level data including the brightness level at each position (e.g., each pixel) in the transport direction of the metal plate S for the image data acquired in step S100, for example, using the procedure already described (S200).
- the frequency analysis unit 26 performs frequency analysis on the brightness level data acquired in step S200 to acquire a frequency spectrum (S300).
- This frequency spectrum indicates the relationship between the frequency (horizontal axis) and the strength of the signal indicating the brightness level (vertical axis) for the brightness level data.
- the detection unit 28 detects defects in the work roll 12 based on the magnitude of the signal of the component of the first frequency fw that corresponds to the period ( ⁇ D) of one rotation of the work roll 12 (the work roll to be detected for defects) in the frequency spectrum obtained in step S300 (S400).
- a frequency spectrum obtained by frequency analysis of brightness level data obtained from image data capturing an image of the surface of the metal sheet S is used to detect defects on the work roll 12 based on the magnitude of the signal of the first frequency fw component corresponding to the period of one rotation of the work roll ( ⁇ D). Therefore, by acquiring image data that can be acquired in a relatively short time (image data of the metal sheet surface for two or more revolutions of the work roll), periodic defects that appear on the surface of the metal sheet S for each rotation of the work roll 12 can be properly detected. Therefore, defects on the work roll 12 can be properly detected while suppressing a decrease in production efficiency with a simple configuration.
- step S100 image data captured during a period when the transport speed of the metal sheet S is slower than during normal operation while the work rolls 12, 13 are rotating with the metal sheet S pressed down (i.e., while the metal sheet S is being transported while being rolled) may be acquired.
- the transport speed during normal operation is the speed at which the metal sheet S is rolled at a constant speed while being wound by the winder 3 in the rolling device 1.
- the transport speed during normal operation is, for example, approximately 500 to 1000 mpm.
- image data captured when the transport speed of the metal sheet S is 50% or less of the transport speed during normal operation may be acquired.
- the period during which the conveying speed of the metal sheet S is slower than during normal operation may be the period before the start of normal operation of the rolling device 1 (for example, the period during which the rolling device 1 is accelerating toward normal operation), or it may be the period after the end of normal operation of the rolling device 1 (for example, the period during which the rolling device 1 is decelerating toward stopping).
- the surface of the metal sheet S rolled by the work rolls 12, 13 is imaged and image data is obtained during a period when the conveying speed is relatively slow, making it easy to obtain a clear image of the surface of the metal sheet S. Therefore, using a clear image obtained in a relatively short period of time, defects in the work roll 12 (the work roll to be detected for defects) can be detected with high accuracy while suppressing a decrease in production efficiency.
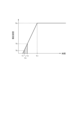
- FIGS. 4 to 6 are diagrams showing an example of the change over time in the transport speed of the metal sheet S in the rolling device 1.
- the transport speed V A in Fig. 4 to Fig. 6 indicates the transport speed of the metal sheet S during normal operation of the rolling device 1.
- the work rolls 12, 13 start rotating (i.e., tensionless pressing (rolling) of the tip of the metal sheet S is started) in a state where the work rolls 12, 13 have pressed down the metal sheet S and the tip St of the metal sheet S has not yet reached the winder 3 as shown in FIG. 1 (i.e., the tip St of the metal sheet S is not held by the winder 3 and the tension on the delivery side is zero).
- the rotation of the work rolls 12, 13 accelerates from time t21, and the conveying speed of the metal sheet S becomes V4 at time t22. Between time t22 and t23, the conveying speed of the metal sheet S is maintained at V4.
- the conveying speed of the metal sheet S is decelerated and becomes zero at time t24.
- the tip St of the metal sheet S reaches the winder 3 between time t23 and time t24, the tip St of the metal sheet S is held by the winder 3.
- the work rolls 12, 13 start to rotate (i.e., rolling of the metal sheet S starts with the delivery tension greater than zero).
- the rotation of the work rolls 12, 13 accelerates from time t25, and at time t26 the transport speed of the metal sheet S becomes V A (where V A > V4).
- V A where V A > V4
- image data may be acquired during a period in which the conveying speed of the metal sheet S is slower than the conveying speed V A during normal operation while the work rolls 12, 13 are rotating while pressing down the metal sheet S (for example, the period from time t2 to t3 in FIG. 4, the period from time t12 to t13 in FIG. 5, or the period from time t12 to t23 in FIG. 6).
- the surface of the rolled metal sheet S is imaged and image data is acquired during a period when the conveying speed is relatively slow, making it easy to acquire a clear image of the surface of the metal sheet S. Therefore, by using a clear image acquired in a relatively short period of time, defects in the work roll 12 (the work roll to be detected for defects) can be detected with high accuracy while suppressing a decrease in production efficiency.
- image data may be acquired during a period from when the work rolls 12, 13 start to rotate while pressing down the metal sheet S until the conveying speed of the metal sheet S becomes the conveying speed V A during normal operation (for example, the period from time t2 to t3 in FIG. 4, the period from time t12 to t13 in FIG. 5, or the period from time t22 to t23 in FIG. 6).
- image data is acquired from the time when rolling of the metal sheet S with the work rolls 12, 13 begins until the conveying speed of the metal sheet S reaches the conveying speed V A during normal operation (i.e., during low-speed operation at the start of rolling), so it is easy to acquire a clear image of the surface of the metal sheet S. Therefore, by using a clear image acquired in a relatively short period of time, it is possible to accurately detect defects in the work roll 12 (the work roll that is the target of defect detection) while suppressing a decrease in production efficiency.
- step S100 described above image data captured during the period until the tip St of the metal plate S is wound by the winding machine 3 (for example, the period from time t22 to t23 in FIG. 6) may be acquired.
- image data is captured during the time when the metal sheet S is transported at a low speed until the tip St of the metal sheet S is wound by the winding machine 3. Therefore, by using a clear image acquired during the time until the tip St of the metal sheet S is wound by the winding machine 3, defects in the work roll 12 (the work roll to be detected for defects) can be detected with high accuracy while more effectively suppressing a decrease in production efficiency.
- the system is configured to acquire image data captured while the transport speed of the metal plate S is constant (for example, image data captured during the period from time t2 to t3 in FIG. 4, or the period from time t22 to t23 in FIG. 6).
- the surface of the rolled metal sheet S is imaged at a relatively slow conveying speed within a fixed period of time to obtain image data, so that a clearer image of the surface of the metal sheet S can be obtained. Therefore, defects in the work roll 12 (the work roll to be detected for defects) can be detected with greater accuracy while suppressing a decrease in production efficiency with a simple configuration.
- image data captured while the conveying speed of the metal plate S is accelerating (e.g., image data captured during the period from time t12 to t13 in FIG. 5) may be acquired.
- the surface of the rolled metal sheet S is imaged and image data is acquired during a period when the conveying speed is relatively slow and accelerating, so that an image of the surface of the metal sheet S can be acquired while accelerating the conveying speed. Therefore, with a simple configuration, it is possible to more effectively suppress a decrease in production efficiency while accurately detecting defects in the work roll 12 (the work roll to be detected for defects).
- image data captured while the metal sheet S is being rolled may be acquired with zero tension applied to the metal sheet S on the exit side of the work rolls 12, 13.
- image data is captured during the time when the metal sheet S is transported at a low speed while the metal sheet S is being rolled in a state where the tension applied to the metal sheet S on the exit side of the work rolls 12, 13 is zero. Therefore, by using a clear image acquired during the time when the metal sheet S is being rolled in a state where the tension applied to the metal sheet S on the exit side of the work rolls 12, 13 is zero, it is possible to accurately detect defects in the work roll 12 (the work roll to be detected for defects) while more effectively suppressing a decrease in production efficiency.
- the light and dark level data acquired in step S200 may be processed to reduce at least one high-frequency component that is greater than the first frequency wf (a frequency corresponding to the period ( ⁇ D) of one rotation of the work roll 12 (the work roll to be detected for defects). Then, in step S300, the light and dark level data after the high-frequency components have been reduced in this manner may be frequency analyzed.
- the light and dark level data acquired in step S200 is discrete data for each conveying direction position, so that when the measured pitch is large, the light and dark level may change suddenly with respect to the change in the conveying direction position, and then, in that case, an apparent high-frequency component appears in the frequency spectrum obtained as a result of the frequency analysis.
- the high-frequency components having a frequency higher than the first frequency fw are reduced from the light and dark level data acquired in step S200 before the frequency analysis in step S300 is performed, so that the ratio (S/N ratio) between the signal of the first frequency fw component to be detected (signal indicating the presence of a flaw in the work roll 12) and the signal of the component with a higher frequency (noise) in the frequency spectrum obtained as a result of the frequency analysis in step S300 can be increased. Therefore, it is possible to more accurately detect flaws in the work roll 12 (the work roll to be detected for flaws) while suppressing a decrease in production efficiency with a simple configuration.
- high frequency components may be reduced by using a low pass filter that cuts out high frequency components having a frequency equal to or greater than a predetermined value (e.g., a frequency equal to or greater than twice or ten times the first frequency fw) from the signal representing the brightness level data.
- a predetermined value e.g., a frequency equal to or greater than twice or ten times the first frequency fw
- high frequency components may be reduced by obtaining a moving average of the brightness levels at each position in the conveying direction included in the brightness level data over a time period of approximately 1/10 to 1/2 of a period ( ⁇ D; a period corresponding to the first frequency fw) corresponding to the length of one rotation of the work roll 12 (the work roll to be detected for defects).
- high frequency components may be reduced by obtaining an approximation curve for brightness level data, which is discrete data for each position in the transport direction.
- step S100 image data of the surface of the metal sheet S (the metal sheet S rolled by the work rolls 12, 13) imaged by the imaging unit 32 is acquired.
- the acquired image data is image data obtained by imaging the metal sheet S over a length of at least two rotations of the work roll 12 to be subjected to defect detection in the conveying direction of the metal sheet S (i.e., a length at least twice the circumferential length of the work roll).
- step S100 for example, an image as shown in FIG. 7 is acquired.
- FIG. 7 is a schematic diagram showing an image including a pattern on the surface of the metal sheet S (transferred traces of defects on the work roll, etc.).
- FIG. 7 shows image data of the surface of the metal sheet S over a length of five rotations of the work roll 12 (conveying direction positions 0 to 5L1).
- the surface of the metal sheet S shown in Figure 7 has various kinds of marks.
- Marks D1 (D1a to D1e), D2 (D2a to D2e), and D3 (D3a to D3e) shown in Figure 7 are periodic marks whose period in the conveying direction is the length L1 ( ⁇ D) of one revolution of the work roll 12.
- These marks D1 to D3 indicate the presence of defects in the roll (i.e., the work roll 12) having a circumference ( ⁇ D) corresponding to the period L1.
- the marks D4 (D4a to D4d) shown in FIG. 7 are periodic marks with a period L2 in the transport direction that is different from the above-mentioned L1 ( ⁇ D). These marks D4 indicate the presence of defects in a roll (i.e., a roll other than the work roll 12, such as a roll used in a previous process) that has a circumferential length that corresponds to the period L2.
- the marks D5 to D9 shown in Figure 7 are random marks and do not have a specific period.
- periodic mark D4 with a period L2 periodic mark D5-D9 are shown within specific regions R1-R3 in the width direction of the metal sheet S, respectively.
- a specific type of mark is not applied within a specific region in the width direction of the metal sheet S, and various types of marks are mixed across the entire width range in the width direction of the sheet, and it is not possible to distinguish which mark is which type (i.e., what the mark originates from) from the outside.
- step S200 brightness level data is obtained for the image data obtained in step S100. Note that in the image data, the brightness level is higher at positions that include defects than at positions that do not include defects.
- Figure 8 is a graph that shows a schematic example of brightness level data obtained in step S200. The horizontal axis of the graph in Figure 8 indicates the position in the transport direction of the metal plate S, and corresponds to the transport direction position in the image data in Figure 7.
- the brightness level data shown in FIG. 8 is a schematic representation of the brightness levels resulting from marks D1 to D9 shown in FIG. 7. That is, the brightness level data shown in FIG. 8 includes brightness levels resulting from marks D1 to D3 of period L1, mark D4 of period L2, and random marks D5 to D9, as shown in FIG. 9. However, this breakdown cannot be seen from the brightness level data actually obtained (see FIG. 8). Note that FIG. 9 is a graph visually showing the breakdown of the brightness level data in FIG. 8.
- the brightness level data obtained in step S200 may be shown in the form of continuous data, for example as shown in FIG. 10.
- FIG. 10 is a graph that shows a schematic example of the brightness level data obtained in step S200.
- step S300 the light and dark level data obtained in step S200 is frequency analyzed to obtain a frequency spectrum.
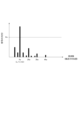
- FIG. 11 is a graph that shows a schematic example of a frequency spectrum obtained in step S300.
- a peak appears in the frequency spectrum at a first frequency fw (a frequency corresponding to the length L1 ( ⁇ D) of one rotation of the work roll 12 to be detected for defects)
- this indicates that marks are attached to the surface of the metal sheet S at intervals of L1 in the conveying direction. Therefore, the above-mentioned peak in the frequency spectrum suggests the presence of scratches on the surface of the work roll 12.
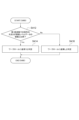
- Fig. 12 is a flow chart of step S400 (step of detecting defects on the work roll 12) in the defect detection method according to this embodiment.
- defects on the work roll 12 may be detected according to the procedure shown in Fig. 12.
- the magnitude of the signal of the first frequency fw in the frequency spectrum acquired in step S300 is compared with a threshold value Ath (S402). Then, if the magnitude of the signal of the first frequency fw is equal to or greater than the threshold value Ath (Yes in S402), it is determined that there is a defect on the surface of the work roll 12 (S404). On the other hand, if the magnitude of the signal of the first frequency fw is less than the threshold value Ath (No in S402), it is determined that there is no defect on the surface of the work roll 12 (S406).
- a frequency spectrum obtained by frequency analysis of brightness level data obtained from image data capturing an image of the surface of the metal sheet S is used to detect defects on the work roll 12 based on the magnitude of the signal of the first frequency fw component corresponding to the period L1 ( ⁇ D) of one rotation of the work roll 12. Therefore, by acquiring image data that can be acquired in a relatively short time (image data of the surface of the metal sheet S for two or more revolutions of the work roll 12), periodic defects that appear on the surface of the metal sheet S every length L1 ( ⁇ D) of one rotation of the work roll 12 can be properly detected. Therefore, defects on the work roll 12 can be properly detected while suppressing a decrease in production efficiency with a simple configuration.
- step S100 image data of the surface of the metal sheet S (the metal sheet S rolled by the work rolls 12, 13) imaged by the imaging unit 32 is acquired.
- the acquired image data is related to an image obtained by imaging the metal sheet S over a length of at least three rotations of the work roll 12 to be subjected to defect detection in the conveying direction of the metal sheet S (i.e., a length three times or more the circumference of the work roll), and a plurality of image data including images s1 to s5 (see FIG. 13) separated by a length L1 of one rotation of the work roll 12 are acquired.
- FIG. 13 is a diagram that shows a schematic image including a pattern on the surface of the metal sheet S (transferred traces of defects on the work roll, etc.), and is a diagram similar to FIG. 7.
- FIG. 13 shows image data of the surface of the metal sheet S over a length of five rotations of the work roll 12 (conveying direction positions 0 to 5L1).
- step S200 multiple pieces of brightness level data corresponding to the multiple pieces of image data acquired in step S100 (image data corresponding to images s1 to s5) are acquired.
- step S300 frequency analysis is performed on multiple combinations of two or more brightness level data selected from the multiple brightness level data acquired in step S200, and multiple frequency spectra corresponding to each of the multiple combinations are acquired.
- Figs. 14 to 16 are diagrams for explaining a flaw detection method according to one embodiment.
- Figs. 14 and 16 are graphs showing an example of a frequency spectrum acquired by a flaw detection method according to one embodiment
- Fig. 15 is a diagram showing an example of image data acquired by a flaw detection method according to one embodiment.
- step S300 from the five brightness level data related to the five image data corresponding to the images s1 to s5 (FIG. 13), five brightness level data corresponding to the images s1 to s5 (FIG. 13) are selected as a first combination, and three brightness level data corresponding to the images s1, s2, and s4 (FIG. 15) are selected as a second combination. Then, for each of the first and second combinations, a frequency analysis is performed on the multiple brightness level data connected together (connected to form a continuous data in the conveying direction of the metal plate S) to obtain a frequency spectrum.
- FIG. 13 From the five brightness level data related to the five image data corresponding to the images s1 to s5 (FIG. 13), five brightness level data corresponding to the images s1 to s5 (FIG. 13) are selected as a first combination, and three brightness level data corresponding to the images s1, s2, and s4 (FIG. 15) are selected as a second combination.
- a frequency analysis
- FIG. 14 is a graph showing an example of a frequency spectrum obtained by performing a frequency analysis on the connected five brightness level data related to the five image data corresponding to the images s1 to s5 (FIG. 13)
- FIG. 16 is a graph showing an example of a frequency spectrum obtained by performing a frequency analysis on the connected three brightness level data related to the three image data corresponding to the images s1, s2, and s4 (FIG. 15).
- the number of pieces of brightness level data constituting each of the multiple combinations of multiple brightness level data (the first and second combinations described above) acquired in step S300 may be two or more.
- the multiple brightness level data contained in the first combination do not completely match the multiple brightness level data contained in the second combination. That is, the first combination includes one or more pieces of brightness level data other than the multiple brightness level data constituting the second combination.
- the second combination includes one or more pieces of brightness level data other than the multiple brightness level data constituting the first combination.
- the order of the multiple brightness level data is not limited.
- step S400 defects in the work roll 12 (the work roll to be detected for defects) are detected based on a comparison of the signal magnitudes of the first frequency fw component in the multiple frequency spectra obtained in step S300.
- step S400 step of detecting defects on the work roll 12 in the defect detection method according to this embodiment.
- defects on the work roll 12 may be detected according to the procedure shown in FIG. 17.
- it is determined whether or not the number of light and dark level data constituting each combination is proportional to the magnitude of the signal of the first frequency fw in the frequency spectrum acquired from the combination (S412).
- step S412 If it is determined that the number of data and the magnitude of the signal of the first frequency fw are proportional to each other (Yes in S412), it is determined that there is a defect on the surface of the work roll 12 (S414). On the other hand, if the result of the judgment in step S412 is that the number of the above-mentioned data and the magnitude of the signal of the above-mentioned first frequency fw are not proportional (No in S412), it is judged that there are no defects on the surface of the work roll 12 (S416).
- the number of pieces of brightness level data constituting the first combination is 5 (see Figure 13), and the magnitude of the signal of the first frequency fw in the frequency spectrum obtained from the multiple brightness level data constituting the first combination is A1 (see Figure 14).
- the number of pieces of brightness level data constituting the second combination is 3 (see Figure 15), and the magnitude of the signal of the first frequency fw in the frequency spectrum obtained from the multiple brightness level data constituting the second combination is A2 (see Figure 16).
- frequency analysis is performed on multiple combinations (first and second combinations) of two or more pieces of light and dark level data selected from multiple pieces of light and dark level data corresponding to multiple pieces of image data acquired for each length L1 ( ⁇ D) of one rotation of the work roll 12, and defects in the work roll are detected based on a comparison of the signal magnitude of the first frequency component in the multiple frequency spectra obtained thereby. Therefore, defects in the work roll 12 can be appropriately detected while suppressing a decrease in production efficiency with a simple configuration.
- At least one embodiment of the flaw detection device (20) of the present invention comprises: A defect detection device for detecting defects in a work roll (12) of a rolling mill (10), comprising: an image data acquisition unit (22) configured to acquire image data by imaging the surface of the metal plate (S) rolled by the work roll; a brightness level data acquisition unit (24) configured to acquire brightness level data including brightness levels at each position in the conveying direction of the metal plate with respect to the image data; a frequency analysis unit (26) configured to perform frequency analysis on the brightness level data to obtain a frequency spectrum; a detection unit (28) configured to detect defects in the work roll based on a magnitude of a signal of a first frequency component in the frequency spectrum corresponding to a period of one rotation of the work roll; Equipped with.
- defects on the work roll are detected based on the magnitude of the signal of the first frequency component corresponding to the period of one rotation of the work roll, using a frequency spectrum obtained by frequency analysis of brightness level data acquired from image data capturing an image of the surface of the metal plate. Therefore, by acquiring image data that can be acquired in a relatively short time (image data of the metal plate surface for two or more revolutions of the work roll), periodic defects that appear on the surface of the metal plate for each rotation of the work roll can be properly detected. Therefore, with a simple configuration, defects on the work roll can be properly detected while suppressing a decrease in production efficiency.
- the light-dark level data acquisition unit is configured to acquire a plurality of light-dark level data respectively corresponding to a plurality of image data acquired for each length of one rotation of the work roll in the conveying direction;
- the frequency analysis unit is configured to perform a frequency analysis on each of a plurality of combinations of two or more of the light and dark level data selected from the plurality of light and dark level data (for example, the above-mentioned first combination and second combination), thereby acquiring a plurality of the frequency spectra corresponding to the plurality of combinations
- the detection unit is configured to detect defects in the work roll based on a comparison of signal magnitudes of the first frequency component in the plurality of frequency spectra.
- frequency analysis is performed on multiple combinations of two or more pieces of brightness level data selected from multiple pieces of brightness level data corresponding to multiple pieces of image data acquired for each rotation of the work roll, and defects in the work roll are detected based on a comparison of the signal magnitude of the first frequency component in the multiple frequency spectra obtained thereby. Therefore, defects in the work roll can be appropriately detected while suppressing a decrease in production efficiency with a simple configuration.
- the detection unit is configured to determine that there is a defect in the work roll when the number of the light/dark level data constituting the plurality of combinations is proportional to the magnitude of the signal of the first frequency component in the plurality of frequency spectra.
- the above configuration (3) allows for accurate detection of defects in the work roll based on whether or not the number of pieces of light and dark level data constituting the multiple combinations of light and dark level data is proportional to the magnitude of the signal of the first frequency component in the frequency spectrum.
- the image data acquisition unit is configured to acquire the image data captured during a period in which the conveying speed of the metal plate is slower than that during normal operation while the work roll is rotating while pressing down on the metal plate.
- the image data acquisition unit is configured to acquire the image data captured during the period from when the work roll starts to rotate while pressing down on the metal plate until the conveying speed reaches the conveying speed during normal operation.
- image data is acquired from the time when rolling of the metal plate with the work rolls begins until the conveying speed of the metal plate reaches the conveying speed during normal operation (i.e., during low-speed operation at the start of rolling). Therefore, with the above configuration (5), defects in the work rolls can be detected with high accuracy while suppressing a decrease in production efficiency by using clear images acquired in a relatively short time.
- the image data acquisition unit is configured to acquire the image data captured during the time until the leading end (St) of the metal plate is wound by a winding machine (3).
- the image data acquisition unit is configured to acquire the image data captured while the transport speed of the metal plate is constant.
- the surface of the rolled metal plate is imaged at a relatively slow conveying speed within a fixed period of time to obtain image data, so that a clearer image of the surface of the metal plate can be obtained. Therefore, with the above configuration (7), defects in the work rolls can be detected with greater accuracy while suppressing a decrease in production efficiency.
- the image data acquisition unit is configured to acquire the image data captured while the transport speed of the metal plate is accelerating.
- the surface of the rolled metal sheet is imaged and image data is acquired during a period when the conveying speed is relatively slow and accelerating, so that an image of the surface of the metal sheet can be acquired while accelerating the conveying speed. Therefore, according to the above configuration (8), defects in the work rolls can be detected with high accuracy while more effectively suppressing a decrease in production efficiency.
- the image data acquisition unit is configured to acquire the image data captured while the metal plate is being rolled in a state in which tension applied to the metal plate on the exit side of the work roll is zero.
- image data is captured during the time when the metal plate is transported at a low speed while the tension applied to the metal plate at the exit side of the work roll is zero. Therefore, according to the above configuration (9), defects in the work roll can be detected with high accuracy while more effectively suppressing a decrease in production efficiency by using clear images acquired during the time when the metal plate is rolled while the tension applied to the metal plate at the exit side of the work roll is zero.
- the flaw detection device includes: A high-frequency component reduction unit (30) configured to reduce high-frequency components having a frequency higher than the first frequency with respect to the light/dark level data,
- the frequency analysis section is configured to perform a frequency analysis of the light and dark level data after the high frequency components have been reduced.
- At least one embodiment of the rolling device (1) of the present invention comprises: A rolling mill (10) including a work roll (12) for rolling a metal plate (S); A flaw detection device according to any one of (1) to (10) above, configured to detect flaws in the work roll; Equipped with.
- defects on the work roll are detected based on the magnitude of the signal of the first frequency component corresponding to the period of one rotation of the work roll, using a frequency spectrum obtained by frequency analysis of the brightness level data acquired from image data capturing an image of the surface of the metal plate. Therefore, by acquiring image data that can be acquired in a relatively short time (image data of the metal plate surface for two or more revolutions of the work roll), periodic defects that appear on the surface of the metal plate for each circumference of the work roll can be properly detected. Therefore, with a simple configuration, defects on the work roll can be properly detected while suppressing a decrease in production efficiency.
- the rolling device is A pair of tension reels (4A, 4B) are provided on both sides of the rolling mill in the conveying direction of the metal plate, The metal plate is rolled by the rolling mill while being reciprocated between the pair of tension reels.
- a flaw detection method for detecting defects in a work roll of a rolling mill, comprising the steps of: A step (S100) of acquiring image data obtained by imaging the surface of the metal plate rolled by the work roll; A step (S200) of acquiring brightness level data including brightness levels at each position in a conveying direction of the metal plate from the image data; A step (S300) of performing frequency analysis on the brightness level data to obtain a frequency spectrum; detecting defects in the work roll based on the magnitude of a signal of a first frequency component in the frequency spectrum corresponding to a period of one rotation of the work roll (S400); Equipped with.
- a frequency spectrum obtained by frequency analysis of brightness level data obtained from image data capturing an image of the surface of a metal plate is used to detect defects in the work roll based on the magnitude of the signal of the first frequency component corresponding to the period of one revolution of the work roll. Therefore, by acquiring image data that can be acquired in a relatively short time (image data of the metal plate surface for two or more revolutions of the work roll), periodic defects that appear on the surface of the metal plate for each circumference of the work roll can be properly detected. Therefore, with a simple configuration, defects in the work roll can be properly detected while suppressing a decrease in production efficiency.
- a rolling method rolling a metal plate using a work roll; Detecting defects on the work roll that has rolled the metal sheet by carrying out the defect detection method described in (13) above; Equipped with.
- a frequency spectrum obtained by frequency analysis of brightness level data obtained from image data capturing an image of the surface of a metal plate is used to detect defects in the work roll based on the magnitude of the signal of the first frequency component corresponding to the period of one revolution of the work roll. Therefore, by acquiring image data that can be acquired in a relatively short time (image data of the metal plate surface for two or more revolutions of the work roll), periodic defects that appear on the surface of the metal plate for each circumference of the work roll can be properly detected. Therefore, with a simple configuration, defects in the work roll can be properly detected while suppressing a decrease in production efficiency.
- expressions expressing relative or absolute configuration do not only strictly express such a configuration, but also express a state in which there is a relative displacement with a tolerance or an angle or distance to the extent that the same function is obtained.
- expressions indicating that things are in an equal state such as “identical,””equal,” and “homogeneous,” not only indicate a state of strict equality, but also indicate a state in which there is a tolerance or a difference to the extent that the same function is obtained.
- expressions describing shapes such as a rectangular shape or a cylindrical shape do not only refer to shapes such as a rectangular shape or a cylindrical shape in the strict geometric sense, but also refer to shapes that include uneven portions, chamfered portions, etc., to the extent that the same effect can be obtained.
- the expressions "comprise,””include,” or “have” a certain element are not exclusive expressions that exclude the presence of other elements.
Landscapes
- Engineering & Computer Science (AREA)
- Textile Engineering (AREA)
- Physics & Mathematics (AREA)
- Health & Medical Sciences (AREA)
- Life Sciences & Earth Sciences (AREA)
- Chemical & Material Sciences (AREA)
- Analytical Chemistry (AREA)
- Biochemistry (AREA)
- General Health & Medical Sciences (AREA)
- General Physics & Mathematics (AREA)
- Immunology (AREA)
- Pathology (AREA)
- Investigating Materials By The Use Of Optical Means Adapted For Particular Applications (AREA)
Priority Applications (2)
| Application Number | Priority Date | Filing Date | Title |
|---|---|---|---|
| PCT/JP2023/003505 WO2024161619A1 (ja) | 2023-02-03 | 2023-02-03 | 疵検出装置、圧延装置、疵検出方法及び圧延方法 |
| JP2024574204A JPWO2024161619A1 (https=) | 2023-02-03 | 2023-02-03 |
Applications Claiming Priority (1)
| Application Number | Priority Date | Filing Date | Title |
|---|---|---|---|
| PCT/JP2023/003505 WO2024161619A1 (ja) | 2023-02-03 | 2023-02-03 | 疵検出装置、圧延装置、疵検出方法及び圧延方法 |
Publications (1)
| Publication Number | Publication Date |
|---|---|
| WO2024161619A1 true WO2024161619A1 (ja) | 2024-08-08 |
Family
ID=92145998
Family Applications (1)
| Application Number | Title | Priority Date | Filing Date |
|---|---|---|---|
| PCT/JP2023/003505 Ceased WO2024161619A1 (ja) | 2023-02-03 | 2023-02-03 | 疵検出装置、圧延装置、疵検出方法及び圧延方法 |
Country Status (2)
| Country | Link |
|---|---|
| JP (1) | JPWO2024161619A1 (https=) |
| WO (1) | WO2024161619A1 (https=) |
Citations (8)
| Publication number | Priority date | Publication date | Assignee | Title |
|---|---|---|---|---|
| JPS5930216B2 (ja) * | 1977-12-27 | 1984-07-25 | 新日本製鐵株式会社 | 板材の表面疵検出方法 |
| JPS6142221B2 (https=) * | 1977-11-28 | 1986-09-19 | Nippon Steel Corp | |
| JPH06324005A (ja) * | 1993-05-13 | 1994-11-25 | Nippon Steel Corp | 鋼板の圧延ロール疵検出方法 |
| JPH071237B2 (ja) * | 1989-03-31 | 1995-01-11 | 新日本製鐵株式会社 | 鋼板の欠陥疵識別用表示の検出装置 |
| JP2001281154A (ja) * | 2000-03-30 | 2001-10-10 | Nkk Corp | 欠陥検出方法及び欠陥検出装置 |
| US20070286472A1 (en) * | 2006-06-13 | 2007-12-13 | Abb Oy | Method and apparatus for identifying repeated patterns |
| JP2013522595A (ja) * | 2010-03-10 | 2013-06-13 | スリーエム イノベイティブ プロパティズ カンパニー | ウェブ製造プロセスにおける用途固有の繰り返し欠陥検出 |
| WO2021005818A1 (ja) * | 2019-07-11 | 2021-01-14 | Primetals Technologies Japan株式会社 | 圧延装置の運転方法並びに圧延装置の制御装置及び圧延設備 |
-
2023
- 2023-02-03 JP JP2024574204A patent/JPWO2024161619A1/ja active Pending
- 2023-02-03 WO PCT/JP2023/003505 patent/WO2024161619A1/ja not_active Ceased
Patent Citations (8)
| Publication number | Priority date | Publication date | Assignee | Title |
|---|---|---|---|---|
| JPS6142221B2 (https=) * | 1977-11-28 | 1986-09-19 | Nippon Steel Corp | |
| JPS5930216B2 (ja) * | 1977-12-27 | 1984-07-25 | 新日本製鐵株式会社 | 板材の表面疵検出方法 |
| JPH071237B2 (ja) * | 1989-03-31 | 1995-01-11 | 新日本製鐵株式会社 | 鋼板の欠陥疵識別用表示の検出装置 |
| JPH06324005A (ja) * | 1993-05-13 | 1994-11-25 | Nippon Steel Corp | 鋼板の圧延ロール疵検出方法 |
| JP2001281154A (ja) * | 2000-03-30 | 2001-10-10 | Nkk Corp | 欠陥検出方法及び欠陥検出装置 |
| US20070286472A1 (en) * | 2006-06-13 | 2007-12-13 | Abb Oy | Method and apparatus for identifying repeated patterns |
| JP2013522595A (ja) * | 2010-03-10 | 2013-06-13 | スリーエム イノベイティブ プロパティズ カンパニー | ウェブ製造プロセスにおける用途固有の繰り返し欠陥検出 |
| WO2021005818A1 (ja) * | 2019-07-11 | 2021-01-14 | Primetals Technologies Japan株式会社 | 圧延装置の運転方法並びに圧延装置の制御装置及び圧延設備 |
Also Published As
| Publication number | Publication date |
|---|---|
| JPWO2024161619A1 (https=) | 2024-08-08 |
Similar Documents
| Publication | Publication Date | Title |
|---|---|---|
| JP7116260B2 (ja) | 圧延装置の運転方法並びに圧延装置の制御装置及び圧延設備 | |
| JP3156764U (ja) | 表面疵検査装置 | |
| CN112154112B (zh) | 用于生产纸卷的复卷机 | |
| WO2001035050A1 (en) | Method for measuring quality of bandlike body, method for suppressing camber, instrument for measuring quality of bandlike body, rolling machine, and trimming device | |
| JP4994950B2 (ja) | 圧延材の表面疵検査方法及び表面疵検査装置 | |
| JP7143509B2 (ja) | コイルのテレスコープ測定装置 | |
| JP2011242318A (ja) | 帯状材料の周期性欠陥検査方法および装置 | |
| CN116462039A (zh) | 一种铜箔分切机 | |
| JP5558637B2 (ja) | ストリップ部分の表面検査のための方法及び装置 | |
| JP2014213952A (ja) | ツードラムワインダ | |
| WO2024161619A1 (ja) | 疵検出装置、圧延装置、疵検出方法及び圧延方法 | |
| JP5780118B2 (ja) | 熱間圧延鋼帯の巻取制御方法および巻取制御装置 | |
| JP6540644B2 (ja) | 巻取装置及び鋼板尾端停止位置の制御方法 | |
| JP5644238B2 (ja) | 鋼板の外観検査方法および装置 | |
| CN114007771B (zh) | 轧制装置的控制装置以及轧制设备及轧制装置的运转方法 | |
| JPH06154853A (ja) | ストリップの巻取機の回転数制御方法 | |
| JP2012030260A (ja) | ロール疵起因ロールの特定方法 | |
| JP2002148201A (ja) | 表面検査装置 | |
| JP7634343B2 (ja) | 検査方法、検査装置および圧延装置の制御方法 | |
| JP7222152B2 (ja) | 圧延装置の制御装置及び圧延設備並びに圧延装置の運転方法 | |
| CN116921452A (zh) | 一种两段式卷取张力控制方法 | |
| CN112967244B (zh) | 一种管材放料图像检测方法以及系统 | |
| JP2007125581A (ja) | 鋼板の欠陥マーキングと欠陥除去方法およびその装置 | |
| WO2025062607A1 (ja) | 圧延装置用の制御装置、圧延設備及び圧延装置の運転方法 | |
| JP2020157318A (ja) | 巻取装置の尾端停止位置制御方法、尾端停止位置制御装置及び巻取装置 |
Legal Events
| Date | Code | Title | Description |
|---|---|---|---|
| 121 | Ep: the epo has been informed by wipo that ep was designated in this application |
Ref document number: 23919756 Country of ref document: EP Kind code of ref document: A1 |
|
| ENP | Entry into the national phase |
Ref document number: 2024574204 Country of ref document: JP Kind code of ref document: A |
|
| WWE | Wipo information: entry into national phase |
Ref document number: 2024574204 Country of ref document: JP |
|
| NENP | Non-entry into the national phase |
Ref country code: DE |
|
| 122 | Ep: pct application non-entry in european phase |
Ref document number: 23919756 Country of ref document: EP Kind code of ref document: A1 |