WO2024150704A1 - コンピュータプログラム、分析方法及び分析装置 - Google Patents
コンピュータプログラム、分析方法及び分析装置 Download PDFInfo
- Publication number
- WO2024150704A1 WO2024150704A1 PCT/JP2023/047301 JP2023047301W WO2024150704A1 WO 2024150704 A1 WO2024150704 A1 WO 2024150704A1 JP 2023047301 W JP2023047301 W JP 2023047301W WO 2024150704 A1 WO2024150704 A1 WO 2024150704A1
- Authority
- WO
- WIPO (PCT)
- Prior art keywords
- processing
- substrates
- value
- substrate
- values
- Prior art date
- Legal status (The legal status is an assumption and is not a legal conclusion. Google has not performed a legal analysis and makes no representation as to the accuracy of the status listed.)
- Ceased
Links
Images









Classifications
-
- H—ELECTRICITY
- H10—SEMICONDUCTOR DEVICES; ELECTRIC SOLID-STATE DEVICES NOT OTHERWISE PROVIDED FOR
- H10P—GENERIC PROCESSES OR APPARATUS FOR THE MANUFACTURE OR TREATMENT OF DEVICES COVERED BY CLASS H10
- H10P72/00—Handling or holding of wafers, substrates or devices during manufacture or treatment thereof
- H10P72/06—Apparatus for monitoring, sorting, marking, testing or measuring
- H10P72/0612—Production flow monitoring, e.g. for increasing throughput
-
- H—ELECTRICITY
- H01—ELECTRIC ELEMENTS
- H01J—ELECTRIC DISCHARGE TUBES OR DISCHARGE LAMPS
- H01J37/00—Discharge tubes with provision for introducing objects or material to be exposed to the discharge, e.g. for the purpose of examination or processing thereof
- H01J37/32—Gas-filled discharge tubes
- H01J37/32917—Plasma diagnostics
- H01J37/32926—Software, data control or modelling
-
- H—ELECTRICITY
- H01—ELECTRIC ELEMENTS
- H01J—ELECTRIC DISCHARGE TUBES OR DISCHARGE LAMPS
- H01J37/00—Discharge tubes with provision for introducing objects or material to be exposed to the discharge, e.g. for the purpose of examination or processing thereof
- H01J37/32—Gas-filled discharge tubes
- H01J37/32917—Plasma diagnostics
- H01J37/32935—Monitoring and controlling tubes by information coming from the object and/or discharge
-
- H—ELECTRICITY
- H10—SEMICONDUCTOR DEVICES; ELECTRIC SOLID-STATE DEVICES NOT OTHERWISE PROVIDED FOR
- H10P—GENERIC PROCESSES OR APPARATUS FOR THE MANUFACTURE OR TREATMENT OF DEVICES COVERED BY CLASS H10
- H10P50/00—Etching of wafers, substrates or parts of devices
- H10P50/20—Dry etching; Plasma etching; Reactive-ion etching
- H10P50/24—Dry etching; Plasma etching; Reactive-ion etching of semiconductor materials
- H10P50/242—Dry etching; Plasma etching; Reactive-ion etching of semiconductor materials of Group IV materials
-
- H—ELECTRICITY
- H10—SEMICONDUCTOR DEVICES; ELECTRIC SOLID-STATE DEVICES NOT OTHERWISE PROVIDED FOR
- H10P—GENERIC PROCESSES OR APPARATUS FOR THE MANUFACTURE OR TREATMENT OF DEVICES COVERED BY CLASS H10
- H10P72/00—Handling or holding of wafers, substrates or devices during manufacture or treatment thereof
- H10P72/06—Apparatus for monitoring, sorting, marking, testing or measuring
- H10P72/0604—Process monitoring, e.g. flow or thickness monitoring
-
- H—ELECTRICITY
- H10—SEMICONDUCTOR DEVICES; ELECTRIC SOLID-STATE DEVICES NOT OTHERWISE PROVIDED FOR
- H10P—GENERIC PROCESSES OR APPARATUS FOR THE MANUFACTURE OR TREATMENT OF DEVICES COVERED BY CLASS H10
- H10P95/00—Generic processes or apparatus for manufacture or treatments not covered by the other groups of this subclass
-
- G—PHYSICS
- G06—COMPUTING OR CALCULATING; COUNTING
- G06F—ELECTRIC DIGITAL DATA PROCESSING
- G06F2123/00—Data types
- G06F2123/02—Data types in the time domain, e.g. time-series data
Definitions
- the present disclosure relates to a computer program, an analysis method, and an analysis device.
- Patent Document 1 discloses a technology that accumulates data related to the processing state, calculates a coefficient of variation of the data, and controls the accumulation of the data based on the value of the coefficient of variation.
- the processing of substrates is carried out according to a processing recipe that defines the processing contents.
- a processing recipe consists of multiple processing steps in a set order, and the processing contents are defined for each processing step.
- the processing contents differ for each processing step, so the processing status may differ depending on the processing step. For this reason, it is desirable to check the processing status for each processing step.
- the present disclosure provides a computer program, an analysis method, and an analysis device that enable checking the processing status of each processing step included in a processing recipe.
- a computer program causes a computer to execute a process of acquiring time series data consisting of multiple measurement values measured by a sensor provided in a processing device that processes substrates according to one or multiple processing steps, calculating an index value for each processing step that indicates the variation in measurement values between the multiple substrates during the period in which each processing step is performed based on the multiple time series data acquired when processing the multiple substrates, and outputting the relationship between each processing step and the index value.
- the present disclosure provides a computer program, an analysis method, and an analysis device that enable checking the processing status of each processing step included in a processing recipe.
- FIG. 1 is a conceptual diagram illustrating an example of the configuration of an analysis system according to a first embodiment.
- FIG. 2 is a conceptual diagram showing an example of the contents of a processing recipe.
- FIG. 2 is a block diagram showing an example of the internal configuration of an analysis device.
- 5 is a flowchart illustrating an example of a procedure of information processing executed by the analysis device according to the first embodiment.
- 11 is a schematic graph showing an example of standardization.
- 13 is a flowchart showing an example of a procedure for processing a subroutine of an average F-value calculation process.
- 1 is a schematic graph showing an example of a relationship between a first period and a second period.
- FIG. 13 is a schematic diagram showing a first example of a chart showing the relationship between processing steps and average F-scores.
- FIG. 13 is a schematic diagram showing a second example of a chart showing the relationship between processing steps and average F-scores.
- 11 is a graph showing an example of a change in F value over time.
- 13 is a flowchart showing an example of a procedure for processing a subroutine for substrate group processing.
- 11 is a graph showing an example of changes in the average F-value according to the order in which each group of substrates is processed.
- FIG. 11 is a conceptual diagram illustrating a configuration example of an analysis system according to a second embodiment.
- FIG. 2 is a conceptual diagram for explaining lots and slots.
- FIG. 2 is a conceptual diagram for explaining lots and slots.
- 13 is a flowchart illustrating an example of a procedure of information processing executed by an analysis device according to a third embodiment.
- FIG. 13 is a schematic diagram showing an example of a chart showing the relationship between the substrate set and the average F-value.
- FIG. 13 is a schematic diagram showing an example of a chart showing the relationship between the substrate set and the average F-value.
- 11 is a chart showing an example of the results of calculating the variation in values obtained by standardizing or normalizing the measured values for each substrate set.
- FIG. 13 is a conceptual diagram showing an example of data pre-processing.
- FIG. 13 is a conceptual diagram showing an example of a result of a principal component analysis.
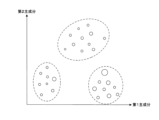
- FIG. 13 is a schematic diagram showing an example of an image representing a two-dimensional distribution of a plurality of substrate sets.
- FIG. 13 is a schematic diagram showing an example of a graph showing time changes in standardized or normalized measured values.
- the process of manufacturing substrates such as semiconductor wafers includes a treatment process in which a substrate is subjected to treatment such as etching.
- a device that performs treatment on a substrate is called a treatment device.
- the treatment device is a process chamber, and a substrate placed in the process chamber is subjected to treatment such as etching.
- the treatment device also performs treatment on multiple substrates in sequence.
- One substrate is placed in the treatment device, a treatment is performed on the substrate, the substrate is removed from the treatment device after the treatment is completed, and the next substrate is placed in the treatment device and the same treatment is performed, and the treatment on the substrate is repeated.
- the treatment state performed in the treatment device is analyzed.
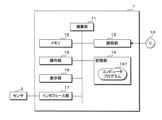
- the analysis system 100 includes a processing device 2, a sensor 3 provided in the processing device 2, and an analysis device 1 that analyzes the state of the processing performed in the processing device 2.
- the processing device 2 is, for example, one process chamber included in a semiconductor manufacturing device 20.
- the processing device 2 processes a plurality of substrates in sequence.
- the sensor 3 measures a physical quantity indicating the state of the processing performed in the processing device 2.
- the processing device 2 is a device that performs plasma etching
- the sensor 3 is a sensor that uses an OES (Optical Emission Spectrometer) that detects light generated from the plasma.
- OES Optical Emission Spectrometer
- the sensor 3 repeatedly performs measurements and inputs the measured values to the analysis device 1. For example, the sensor 3 performs measurements every predetermined unit time and inputs the measured values.
- the sensor 3 measures multiple types of physical quantities and inputs multiple types of measured values to the analysis device 1. For example, the sensor 3 measures the intensity of light of multiple wavelengths different from each other, and inputs multiple types of measured values indicating the intensity of light of the multiple wavelengths to the analysis device 1.
- the analysis device 1 executes the analysis method.
- the processing device 2 processes the substrate according to a predetermined processing recipe.
- the processing recipe is made up of multiple processing steps with a set order.
- the processing step is the smallest unit of the chronological processing procedure for the substrate.
- the processing content for the substrate is set.
- FIG. 2 is a conceptual diagram showing an example of the processing recipe content.
- the processing recipe includes multiple processing steps such as a first processing step and a second processing step.
- the processing content to be performed by the processing device 2 such as the temperature in the processing device 2 and the voltage to be applied, is set.
- the processing content includes processing conditions. In general, the processing content differs depending on the processing step.
- the processing recipe may include multiple processing steps with the same processing content.
- the processing according to each processing step is performed in the set order. For example, the processing according to the first processing step is performed first, then the processing according to the second processing step is performed, and then the processing according to the other processing steps is performed.
- the processing recipe may be made up of a single processing step.
- FIG. 3 is a block diagram showing an example of the internal configuration of the analysis device 1.
- the analysis device 1 is configured using a computer such as a personal computer or a server device.
- the analysis device 1 includes a calculation unit 11, a memory 12 that stores temporary data generated in association with the calculation, a reading unit 13, a storage unit 14, an operation unit 15, a display unit 16, and an interface unit 17.
- the calculation unit 11 is configured using, for example, a CPU (Central Processing Unit), a GPU (Graphics Processing Unit), or a multi-core CPU.
- the calculation unit 11 may be configured using a quantum computer.
- the memory 12 stores temporary data generated in association with the calculation.
- the memory 12 is, for example, a RAM (Random Access Memory).
- the reading unit 13 reads information from a recording medium 10 such as an optical disk or a portable memory.
- the storage unit 14 is non-volatile, for example, a hard disk or a non-volatile semiconductor memory.
- the operation unit 15 accepts input of information such as text by accepting operations from the user.
- the operation unit 15 is, for example, a keyboard, a pointing device, or a touch panel.
- the display unit 16 displays images.
- the display unit 16 is, for example, a liquid crystal display or an EL display (Electroluminescent Display).
- the operation unit 15 and the display unit 16 may be integrated.
- the interface unit 17 is connected to the sensor 3.
- the interface unit 17 accepts measurement values input by the sensor 3.
- the calculation unit 11 causes the reading unit 13 to read the computer program (program product) 141 recorded on the recording medium 10, and stores the read computer program 141 in the memory unit 14.
- the calculation unit 11 executes processing to realize the functions of the analysis device 1 in accordance with the computer program 141.
- the computer program 141 is a computer program that causes the analysis device 1 to execute information processing to analyze the state of processing performed by the processing device 2.
- the computer program 141 may be stored in advance in the memory unit 14, or may be downloaded from outside the analysis device 1. In this case, the analysis device 1 does not need to be equipped with the reading unit 13.
- the computer program 141 can be deployed to run on a single computer, or on multiple computers located at one site or distributed across multiple sites and interconnected by a communications network. That is, the analysis device 1 may be configured with multiple computers, and the computer program 141 may be executed on multiple computers connected via a communications network. The analysis device 1 may be configured using a cloud server.
- FIG. 4 is a flowchart showing an example of the procedure of information processing performed by the analysis device 1 according to the first embodiment.
- the steps of information processing performed by the analysis device 1 are abbreviated as S.
- the calculation unit 11 performs information processing according to the computer program 141, and the analysis device 1 executes the following processing.
- the processing device 2 processes multiple substrates. More specifically, the processing device 2 sequentially processes one substrate according to each processing step included in a predetermined processing recipe. After processing according to the processing recipe is completed, the processing device 2 executes processing according to the processing recipe from the beginning for the next substrate, and similarly repeats processing for multiple substrates.
- the sensor 3 repeats measurements and inputs multiple types of measurement values to the analysis device 1.
- the analysis device 1 accepts the multiple types of measurement values input from the sensor 3 in the interface unit 17, and the calculation unit 11 stores the accepted multiple types of measurement values in the memory unit 14.
- the analysis device 1 acquires time series data consisting of multiple measurement values measured by the sensor 3 in a chronological order in the memory unit 14 (S1).
- the calculation unit 11 stores the time series data in the storage unit 14 by type of measurement value. That is, multiple types of time series data are stored.
- One time series data includes the same type of measurement value.
- the time series data is associated with information indicating the type of measurement value. For example, information indicating the wavelength is associated with the time series data.
- the measurement values included in the time series data are in a predetermined order. The order of the measurement values included in the time series data is the order in which the sensor 3 measured them.
- each measurement value included in the time series data is associated with the time when the measurement value was measured or the time when the measurement value was input to the analysis device 1.
- each measurement value included in the time series data is associated with information indicating the period during which the measurement value was measured according to which processing step.
- the period during which the processing according to one processing step is performed is referred to as the first period. Since a processing recipe includes multiple processing steps, the period during which one substrate is processed includes multiple first periods. That is, each measurement value is associated with information indicating in which first period the measurement value was measured.
- time series data is acquired by type of measurement value, multiple types of time series data are acquired as one board is processed. Multiple types of time series data are acquired each time a board is processed. Information indicating the board is associated with the time series data.
- the input device that inputs the measurements from the sensor 3 may be a separate device from the analysis device 1.
- the analysis device 1 may execute the process of S1 by reading out the time series data from the input device.
- the analysis device 1 then standardizes the measurement values included in the time series data by processing step (S2).
- the calculation unit 11 standardizes a plurality of measurement values related to each processing step included in the time series data.
- the plurality of measurement values related to each processing step are a plurality of measurement values measured while the processing according to each processing step is being executed by the processing device 2, that is, a plurality of measurement values obtained in each first period.
- the calculation unit 11 performs standardization by calculating the average value and standard deviation of a plurality of measurement values obtained in one first period included in one time series data, and dividing the value obtained by subtracting the average value from each measurement value by the standard deviation.
- the measurement value obtained in one first period included in one time series data is x
- the average value is x bar (a symbol with a bar above x)
- the standard deviation is ⁇ .
- the standardized measurement value x st is expressed by the following formula (1).
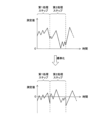
- FIG. 5 is a schematic graph showing an example of standardization.
- the horizontal axis of FIG. 5 indicates time, and the vertical axis indicates measured values.
- measured values may vary significantly over time.
- Multiple measured values related to one processing step are standardized so that the average value of the multiple measured values is 0 and the variance is 1.
- the calculation unit 11 standardizes multiple measured values related to multiple processing steps included in one time series data using equation (1).
- the calculation unit 11 similarly standardizes multiple types of time series data acquired for one board.
- the calculation unit 11 also similarly standardizes multiple types of time series data acquired for each of multiple boards. Thereafter, the analysis device 1 performs information processing using the standardized measured values.
- the measurements included in the time series data may be affected by an offset, which is an addition of a fixed value, or a gain, which is a multiplication of a fixed value. For this reason, it is difficult to compare raw time series data.
- Different processing steps have different processing contents, so the offset and gain may be different. Since multiple substrates are not processed simultaneously in the same processing device 2, the offset and gain may be different for different substrates. Standardization is performed for each processing step, so the effects of offset and gain are removed from the measurements related to each processing step. The average value and variance of the measurements related to each processing step become the same between time series data, making it easy to compare multiple measurements related to each processing step between time series data.
- the analysis device 1 may normalize the measurement values for each processing step instead of standardization.
- the calculation unit 11 identifies the maximum and minimum values of multiple measurement values obtained in one first period included in one time series data, and performs normalization by dividing the value obtained by subtracting the minimum value from each measurement value by the value obtained by subtracting the minimum value from the maximum value. Multiple measurement values related to one processing step are normalized so that the minimum value is 0 and the maximum value is 1. Thereafter, the analysis device 1 performs information processing using the normalized measurement values. Even when normalization is performed, the effects of offset and gain are removed from the measurement values related to each processing step, making it easy to compare multiple measurement values related to each processing step between time series data.
- the analysis device 1 may perform standardization so that the average value is a value other than 0 or the variance is a value other than 1, and may perform normalization so that the minimum value is a value other than 0 or the maximum value is a value other than 1.
- the analytical device 1 then performs an F-value average calculation process to calculate the average F-value of the analysis of variance for each processing step (S3).
- the average F-value of the analysis of variance is an index value that indicates the variation of the measured values among multiple substrates in the first period related to each processing step.
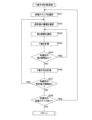
- FIG. 6 is a flowchart showing an example of the procedure of the subroutine of the F-value average calculation process.
- the analytical device 1 selects a processing step (S31). In S31, the calculation unit 11 selects one processing step from multiple processing steps included in the processing recipe. The analytical device 1 then selects a type of measured value (S32). In S32, the calculation unit 11 selects one type from multiple types of measured values measured by the sensor 3. The analytical device 1 then selects a second period included in the first period related to the selected processing step (S33).
- FIG. 7 is a schematic graph showing an example of the relationship between the first period and the second period.
- the horizontal axis of FIG. 7 indicates time, and the vertical axis indicates the measured value.
- the multiple line graphs shown in FIG. 7 indicate the time change of the measured value of the selected type in the first period related to the selected processing step when multiple substrates are processed by the processing device 2. Although the multiple substrates are not processed simultaneously, the first period related to the same processing step is the same first period.
- t is a natural number, and the time when t times the unit time has elapsed from the start of the first period is time t.
- the "time” here is a relative time in the first period, and is the same time for multiple substrates.
- T is a natural number
- the period from time (t-T) to time t is the second period.
- the length of the second period is T times the unit time, and if the unit time is 0.01 seconds, the length of the second period can be expressed as T x 0.01 seconds.
- the second period is a period shorter than the first period.
- the calculation unit 11 selects one second period from the multiple second periods.
- the sensor 3 performs one measurement per unit time (e.g., 0.01 seconds). Therefore, in the second period, T measurement values are obtained for all the substrates.
- the unit time is not limited to 0.01 seconds.
- the length of the unit time can be set appropriately based on the performance of the sensor 3 or the processing capacity of the analysis device 1.
- the analysis device 1 then calculates the F value of the analysis of variance for the multiple measurement values obtained during the selected second period (S34).
- the calculation unit 11 calculates the F value for the multiple measurement values of the selected type during the selected second period for the multiple substrates.
- the calculation unit 11 also calculates the F value using the measurement values that have been standardized or normalized by the processing of S2.
- a plurality of measured values of the selected type during the selected second period are collected into one group. Since T measured values are obtained during the second period, one group contains T measured values. Since one group is obtained corresponding to one substrate, multiple groups corresponding to multiple substrates are obtained. An F value is calculated for these multiple groups.
- the F value is the ratio of the variance in measured values between groups to the variance in measured values within a group. If the number of substrates processed by the processing device 2 is N, then the number of groups is N.
- the mean square between groups is the sum of squares between groups divided by the degree of freedom between groups.
- the sum of squares between groups is the square of the difference between the average of the measurements included in each group and the average of the measurements included in all groups multiplied by the number of measurements included in each group, and the sum is calculated across multiple groups.
- the number of measurements included in each group is T.
- the degree of freedom between groups is (N-1).
- the average of the measurements included in the i-th group is x i bar (a symbol with a bar above x i )
- the average of the measurements included in all groups is X bar (a symbol with a bar above X)
- the sum of squares between groups is MS a .
- the sum of squares between groups MS a is expressed by the following formula (3).
- the within-group mean square is the within-group sum of squares divided by the degree of freedom within the group.
- the within-group sum of squares is the sum of the squares of the differences between the measured values and the average value in each group, over multiple groups.
- the within-group degree of freedom is the value obtained by subtracting the number of groups from the number of measured values included in all groups, and is (NT-N).
- the j-th measured value included in the i-th group is x ij
- the within-group mean square is MS w .
- the within-group mean square MS w is expressed by the following formula (4).
- the calculation unit 11 calculates the between-group mean square using equation (3), the within-group mean square using equation (4), and the F-value using equation (2).
- the calculation unit 11 stores the calculated F-values in the memory unit 14.
- the between-group mean square indicates the variation in measurement values between substrates, and largely reflects the differences between substrates.
- the within-group mean square indicates the variation in measurement values when processing one substrate, and reflects the magnitude of noise. The larger the F-value, the greater the variation in measurement values between substrates compared to the magnitude of noise. Therefore, by calculating the F-value, the magnitude of variation in measurement values between multiple substrates becomes clear.
- the analysis device 1 determines whether there is an unselected second period (S35).
- S35 the calculation unit 11 determines whether there is a second period that has not yet been selected and for which an F value has not yet been calculated, among the multiple second periods included in the first period related to the selected processing step. If there is an unselected second period (S35: YES), the analysis device 1 returns the process to S33. In S33, the calculation unit 11 selects one second period from the unselected second periods. By repeating S33 to S35, the F value is calculated for each second period.
- the analysis device 1 calculates the average F-value (S36).
- the calculation unit 11 calculates the average F-value by averaging the multiple F-values calculated for the multiple second periods.
- the calculation unit 11 stores the calculated average F-value in the memory unit 14.
- the analysis device 1 determines whether there are any unselected measurement value types (S37).
- S37 the calculation unit 11 determines whether there are any measurement value types that have not yet been selected and for which the average F-value has not yet been calculated, among the multiple measurement value types. If there are any unselected measurement value types (S37: YES), the analysis device 1 returns the process to S32.
- S32 the calculation unit 11 selects one type from the measurement value types that have not yet been selected. By repeating S32 to S37, the average F-value is calculated for each type of measurement value.
- the analysis device 1 determines whether there are any unselected processing steps (S38). In S38, the calculation unit 11 determines whether there are any processing steps that have not yet been selected and for which the average F value has not yet been calculated among the multiple processing steps included in the processing recipe. If there are any unselected processing steps (S38: YES), the analysis device 1 returns the process to S31. In S31, the calculation unit 11 selects one processing step from the processing steps that have not yet been selected. By repeating S31 to S38, the average F value is calculated for each processing step and each type of measurement. If there are no unselected processing steps (S38: NO), the analysis device 1 ends the average F value calculation process of S3 and returns the process to the main.
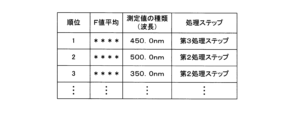
- FIG. 8 is a schematic diagram showing a first example of a chart showing the relationship between the processing steps and the average F-value.
- the "***" in the diagram indicates the average F-value value.
- the multiple average F-values created for multiple processing steps and multiple types of measurement values are arranged in descending order of numerical value.
- the calculation unit 11 creates a chart in which the average F-values are arranged in descending order of numerical value, associating the processing steps with the types of measurement values, and displays the created chart on the display unit 16.
- the average F-value is associated with a combination of a processing step and a type of measurement value.
- the type of measurement value is distinguished by the wavelength of the light being measured.
- FIG. 9 is a schematic diagram showing a second example of a chart showing the relationship between processing steps and average F-values.
- the "****" in the chart indicates the average F-value value.
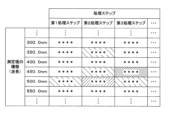
- the average F-value values associated with each processing step and each type of measurement value are listed.
- the average F-values are displayed in a two-dimensional array in association with each of the multiple processing steps arranged in one direction and each of the multiple types of measurement values arranged in a direction intersecting the one direction.
- the display color of the average F-value differs depending on the magnitude of the numerical value. The larger the numerical value, the more the display color emphasizes the average F-value. For this reason, the chart shown in FIG. 9 is a heat map. In FIG. 9, the display color is represented by the density of the fill.
- the calculation unit 11 creates a chart that lists the average F-values by associating them with the processing steps and the types of measurement values, determines the display color according to the numerical value of the average F-value, and displays the created chart on the display unit 16.
- a table associating the range of the average F-values with the display colors is stored in advance in the storage unit 14, and the calculation unit 11 determines the display color by referring to the table.
- the display form of the average F-value other than the display color may be different depending on the magnitude of the numerical value, so that the average F-value with a large numerical value is emphasized.
- the darkness of the display color, the size or thickness of the characters, the font of the characters, or the thickness of the frame may be different depending on the magnitude of the numerical value.
- the average F-values may be numbered in the order of the magnitude of the numerical value.
- each F-value average is associated with a processing step and a type of measurement value, and F-value averages with large numerical values are highlighted in the list of F-value averages.
- the processing step and type of measurement value associated with the highlighted F-value average By checking the processing step and type of measurement value associated with the highlighted F-value average, the processing step and type of measurement value that results in a large F-value average are clarified. Processing steps that result in a larger variation in measurement values between multiple substrates and a more unstable processing state are extracted. In addition, types of measurement values that result in a larger variation in measurement values are extracted. As with the case of using the diagram shown in FIG. 8, it is possible to identify relatively unstable processing steps.
- the analysis device 1 may perform processing to output a warning when the F-value average exceeds a predetermined threshold value.
- the analysis device 1 may output the time change of the F value.
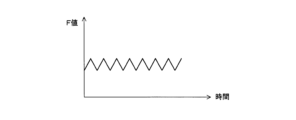
- FIG. 10 is a graph showing an example of the time change of the F value.
- the horizontal axis of FIG. 10 indicates time, and the vertical axis indicates the F value.
- the calculation unit 11 creates a graph showing the time change of the F value based on the F value calculated for each time in S3, and displays the graph on the display unit 16.
- the graph shown in FIG. 10 shows the time change of the F value related to one processing step and one type of measurement value.
- the analysis device 1 can change the type of processing step and measurement value for which the F value should be displayed.
- the analysis device 1 accepts the designation of the processing step and the type of measurement value by the user operating the operation unit 15, and outputs the time change of the F value related to the designated processing step and the designated type of measurement value.
- Graphs showing the time change of the F value related to multiple processing steps or multiple types of measurement values may be displayed in an overlapping manner.
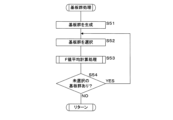
- FIG. 11 is a flowchart showing an example of the procedure of the processing subroutine for substrate group processing.
- the analysis device 1 generates a plurality of substrate groups into which the substrates processed by the processing device 2 are divided (S51).
- the calculation unit 11 divides the substrates processed by the processing device 2 into a plurality of substrate groups consisting of a plurality of substrates processed consecutively.
- the calculation unit 11 also generates a plurality of substrate groups so that some of the substrates included in the substrate groups overlap. It is desirable that the number of substrates included in each substrate group is the same.
- first substrate group consisting of the first to fourth substrates a second substrate group consisting of the second to fifth substrates, a third substrate group consisting of the third to sixth substrates, a fourth substrate group consisting of the fourth to seventh substrates, and a fifth substrate group consisting of the fifth to eighth substrates are generated.
- the analysis device 1 selects a group of substrates (S52).
- the calculation unit 11 selects one substrate group from the multiple substrate groups that have been generated.
- the analysis device 1 then performs an average F-value calculation process (S53).
- the calculation unit 11 performs a process similar to S3 to calculate the average F-value for the multiple substrates included in the selected substrate group.
- the analysis device 1 determines whether there is an unselected substrate group (S54).
- S54 the calculation unit 11 determines whether there is a substrate group among the multiple substrate groups that has not yet been selected and for which the average F-value has not yet been calculated.
- the analysis device 1 If there are unselected substrate groups (S54: YES), the analysis device 1 returns the process to S52. In S52, the calculation unit 11 selects one substrate group from the substrate groups that have not yet been selected. By repeating S52 to S54, the average F value is calculated for each substrate group. If there are no unselected substrate groups (S54: NO), the analysis device 1 ends the substrate group processing of S5 and returns the process to the main.
- the analysis device 1 After completing S5, the analysis device 1 outputs the change in the average F-value according to the order in which each substrate group was processed (S6).
- the calculation unit 11 generates a graph showing the change in the average F-value according to the order in which each substrate group was processed by the processing device 2 based on the processing results in S5, and displays the generated graph on the display unit 16.
- Figure 12 is a graph showing an example of the change in the average F-value according to the order in which each substrate group was processed.
- the horizontal axis of Figure 12 indicates the distinction between substrate groups, and the vertical axis indicates the average F-value.
- the graph shown in FIG. 12 shows the change in the average F-value for one processing step and one type of measurement value.
- the analysis device 1 is capable of changing the processing step and type of measurement value for which the average F-value is to be displayed. For example, the analysis device 1 accepts the designation of the processing step and type of measurement value by the user operating the operation unit 15, and outputs the change in the average F-value for the designated processing step and the designated type of measurement value. Graphs showing the change in the average F-value for multiple processing steps or multiple types of measurement values may be displayed overlapping each other.
- the times at which the multiple substrates in each substrate group are processed by processing equipment 2 are slightly different between substrate groups, with some overlap between them.
- the time at which the second substrate group is processed is later than the time at which the first substrate group is processed.
- the first substrate group is processed at the earliest time, and the other substrate groups are processed at later times.
- the change in the average F value according to the substrate group indicates the change in the average F value according to the time that processing continues in processing equipment 2.
- the average F value for the first substrate group is large, and the average F value for the second substrate group is smaller.
- the average F values for the third, fourth, and fifth substrate groups are smaller and barely fluctuate.
- the analysis device 1 may perform processing S5 to S6 so that the substrates included in the substrate groups do not overlap.
- the analysis device 1 executes processes S1 to S6 when a certain number of substrates have been processed by the processing device 2 and time series data relating to each substrate has been obtained. For example, the analysis device 1 executes processes S1 to S6 periodically, or each time a predetermined number of substrates are processed by the processing device 2.
- the analysis device 1 may execute S4 and S5 in the reverse order. Even if the processing recipe consists of a single processing step, the analysis device 1 similarly executes processes S1 to S6. Note that processes S5 to S6 may be omitted.
- the analysis device 1 acquires time series data related to multiple substrates processed by the processing device 2, calculates the average F value for each processing step, and outputs the relationship between each processing step and the index value.
- the average F value is an index value that represents the magnitude of non-instantaneous variation in the measurement value occurring during the period when processing according to the processing step is being performed, rather than the instantaneous variation in the measurement value between multiple substrates. For this reason, the average F value reflects the overall state of the processing performed according to the processing steps. It is possible to check the state of the processing performed according to the processing steps according to the calculated average F value.
- the average F value for each processing step it is possible to check the state of the processing performed according to the processing steps for each of the multiple processing steps included in the processing recipe. For example, the greater the magnitude of variation in the measurement value represented by the average F value, the more unstable the processing performed according to the processing steps is.
- the content of the processing steps so as to reduce the average F value, the stability of the processing performed according to the processing steps is improved, and the processing recipe is improved.
- the analysis apparatus 1 analyzes the processing of substrates performed in a plurality of processing devices 2.
- Fig. 13 is a conceptual diagram showing an example of the configuration of an analysis system 100 according to the second embodiment.
- the analysis system 100 includes a plurality of processing devices 2.
- the plurality of processing devices 2 are a plurality of process chambers included in one semiconductor manufacturing apparatus 20.
- the plurality of processing devices 2 are process chambers included in each of the plurality of semiconductor manufacturing apparatuses 20.
- the sensors 3 provided in each of the processing devices 2 are connected to the analysis apparatus 1.
- Each processing device 2 independently processes the substrate, and each sensor 3 inputs a measurement value to the analysis apparatus 1.
- the analytical device 1 receives measurement values input from multiple sensors 3 provided in multiple processing devices 2 at the interface unit 17, and the calculation unit 11 stores the received measurement values in the memory unit 14.
- the analytical device 1 executes the processes of S1 to S4.
- the analytical device 1 acquires time series data by storing multiple types of time series data consisting of multiple types of measurement values measured by each sensor 3 in each processing device 2 in the memory unit 14.
- Time series data relating to substrates processed in different processing devices 2 is acquired by the analytical device 1.
- the input device that receives the measurements from the sensor 3 may be a device separate from the analytical device 1, and the analytical device 1 may execute the process of S1 by reading out the time series data from the input device.
- the analytical device 1 may read out the time series data from multiple input devices.
- the analytical device 1 standardizes the measurement values included in the time series data by processing step. If the processing device 2 used to process the substrate is different, the offset and gain may differ. By standardizing by processing step, the effects of offset and gain are removed from the measurement values related to each processing step. Therefore, even if the time series data relates to multiple substrates processed by different processing device 2, it becomes easy to compare multiple measurement values related to each processing step between the time series data. Instead of standardization, the analytical device 1 may normalize the measurement values by processing step.
- the analysis device 1 calculates the average F value, which indicates the variation in the measured values between the substrates processed by the different processing devices 2, for each processing step.
- the analysis device 1 performs substrate group processing to calculate the average F value for a substrate group that is a group of substrates processed in parallel at the same time by the multiple processing devices 2.
- the substrate group in the second embodiment is different from the substrate group in the first embodiment.
- the analysis device 1 creates a substrate group that is a group of substrates processed in parallel at the same time by the multiple processing devices 2. At this time, the analysis device 1 creates a plurality of substrate groups that are processed at different times.
- a plurality of substrates that are processed continuously by the processing device 2 are regarded as one lot, and the multiple processing devices 2 process the multiple lots in sequence.
- a substrate group is created by grouping any substrate included in a specific lot across the multiple processing devices 2, and a substrate group is created for each lot, thereby creating a plurality of substrate groups.
- a substrate group is created by grouping a substrate included in a specific lot across the multiple processing devices 2, and a substrate group is created for each substrate, thereby creating a plurality of substrate groups.
- the analysis device 1 calculates the average F value for each group of substrates.
- the analysis device 1 outputs the change in the average F value according to the order in which each group of substrates was processed. After S6 is completed, the analysis device 1 ends the process. Note that the processes of S5 to S6 can be omitted.
- the analysis device 1 acquires time series data relating to multiple substrates processed by multiple processing devices 2, calculates the average F value for multiple substrates processed by different processing devices 2 for each processing step, and outputs the relationship between each processing step and the index value.
- the second embodiment it is also possible to examine the state of processing performed according to the processing steps according to the average F value. For example, since the average F value is calculated based on time series data relating to multiple substrates processed by different processing devices 2, the influence of the processing device 2 on the average F value is small, and the influence of the contents of the processing steps on the average F value is large. For this reason, in the second embodiment, the average F value better reflects the instability of the processing performed according to the processing steps. It is possible to reliably identify processing steps with low stability based on the average F value and effectively improve the processing recipe.
- FIG. 14 and 15 are conceptual diagrams for explaining lots and slots.
- a substrate to be processed is indicated by a circle.
- a plurality of substrates to be processed are arranged in the order of processing.
- a plurality of substrates to be processed in sequence by one or a plurality of processing devices 2 is referred to as a lot.
- the processing of the next lot is performed. For example, as shown in FIG. 14, after the processing of the first lot is performed, the processing of the second lot is performed, and then the processing of the third lot is performed.
- One lot may also include substrates to be processed by different processing devices 2.
- a slot is used as an index value assigned to each substrate within the lot.
- a slot is a number assigned to the multiple substrates that may be included in one lot in the order in which they are processed, regardless of whether any of the substrates have actually been processed.
- each lot includes a substrate with slot 1, a substrate with slot 2, a substrate with slot 3, and so on.
- FIG. 15 shows an example in which one lot includes m substrates.
- processing is performed to verify the stability of processing between multiple substrates of different lots and the same slot, or between multiple substrates of the same lot but different slots.
- a slot is also assigned to a virtual substrate that is not actually processed within a lot. For example, consider an example in which, in one lot, the first substrate is processed, the second substrate is not actually processed when it should be processed, and the third substrate is processed when it should be processed. Slot 1 is assigned to the first substrate, slot 2 is assigned to the virtual substrate that was not actually processed when the second substrate should be processed, and slot 3 is assigned to the substrate that was processed when the third substrate should be processed.
- the index value may be the actual processing order. In the above example, processing order 1 is assigned to the first substrate, and processing order 2 is assigned to the substrate that was processed when the third substrate should be processed.
- the processing order may be either the "processing order within a lot" or the "processing order within a chamber.”
- the processing order within a lot is a number assigned to each substrate in the order in which they were actually processed within the lot.
- the processing order within a chamber is a number assigned to each substrate in the order in which they were processed within the lot for each process chamber when substrate processing is performed within a lot using multiple process chambers (processing equipment 2). For example, consider an example in which the first substrate is processed in the first process chamber, the second and third substrates are processed in the second process chamber, and the fourth substrate is processed in the first process chamber.
- the "processing order within a lot" for the first, second, third, and fourth substrates is 1, 2, 3, and 4.
- the "processing order within a chamber" for the first substrate is 1, the "processing order within a chamber” for the second process chamber for the second substrate is 1 and 2, and the "processing order within a chamber” for the first substrate is 2.
- FIG. 16 is a flowchart showing an example of the procedure of information processing executed by the analysis device 1 according to the third embodiment.
- the analysis device 1 executes the following process after completing the processes of S1 to S6 or after completing the processes of S1 to S4.
- the analysis device 1 selects a processing step and a type of measurement value (S71).
- the calculation unit 11 receives a designation of a processing step and a type of measurement value by the user operating the operation unit 15, selects a designated processing step from among a plurality of processing steps, and selects a designated type of measurement value from among a plurality of types of measurement values.
- a chart showing the relationship between the processing steps and the average F-value as shown in FIG. 8 is displayed, and the designation of the processing step and the type of measurement value is input to the analysis device 1 by the user operating the operation unit 15.
- the analytical device 1 calculates the average F-value for the selected processing step and type of measurement value for each substrate set consisting of a specific number of substrates (S72).
- the calculation unit 11 identifies substrate sets consisting of substrates of different lots and the same slots, and substrate sets consisting of substrates of the same lot but different slots.
- a lot number is assigned to each lot in the order in which they are processed. For example, the lot number of the first lot is 1, and the lot number of the second lot is 2.
- the calculation unit 11 identifies a substrate set by selecting multiple substrates with the same slot from multiple lots with consecutive lot numbers.
- the calculation unit 11 also identifies a substrate set by selecting multiple substrates with consecutive slots within the same lot. For example, each substrate set includes two substrates.
- the calculation unit 11 may also identify a substrate set including three or more substrates.
- the calculation unit 11 identifies multiple substrate sets. For example, the calculation unit 11 identifies substrate sets for all combinations of consecutive lot numbers and slots, and all combinations of lot numbers and consecutive slots.
- the calculation unit 11 calculates the average F value for the multiple substrates included in the substrate set.
- the data used in the calculation is a standardized or normalized value of the selected type of measurement value obtained when the selected processing step is performed on each of the multiple substrates included in the substrate set.
- the calculation unit 11 calculates the average F value by performing processing similar to S3.
- the calculation unit 11 calculates the average F value for all substrate sets.
- the calculation unit 11 stores the average F value calculated for each substrate set in the memory unit 14.
- the calculation unit 11 may calculate the average F value for a substrate set consisting of multiple substrates from different lots and with the same processing order, and a substrate set consisting of multiple substrates from the same lot but with different processing orders.
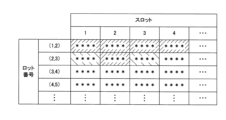
- FIGS. 17 and 18 are schematic diagrams showing examples of diagrams showing the relationship between the substrate set and the average F value.
- the "****" in the diagrams indicates the average F value.
- FIG. 17 is a table listing the average F value associated with each substrate set consisting of a plurality of substrates with different lots and the same slot.
- the average F value for the substrate set consisting of a plurality of substrates identified by the plurality of lot numbers and slots is displayed at the position where the combination of the plurality of lot numbers and the slot intersects.
- FIG. 18 is a table listing the average F value associated with each substrate set consisting of a plurality of substrates with the same lot but different slots.
- the average F value for the substrate set consisting of a plurality of substrates identified by the plurality of lot numbers and the slots is displayed at the position where the combination of the plurality of lot numbers and the slot intersects.
- the calculation unit 11 creates a table in which the average F-values are associated with each substrate set as shown in FIG. 17 and FIG. 18, and displays it on the display unit 16.
- the calculation unit 11 creates two types of charts.
- One chart is a chart showing the relationship between the average F-values and a substrate set consisting of multiple substrates from different lots and the same slots as shown in FIG. 17.
- the other chart is a chart showing the relationship between the average F-values and a substrate set consisting of multiple substrates from the same lot but different slots as shown in FIG. 18.
- the calculation unit 11 displays two types of charts simultaneously on the display unit 16.
- the calculation unit 11 may display one chart on the display unit 16, and change the displayed chart to the other chart in response to the user operating the operation unit 15 to input an instruction to change the chart.
- the display color of the average F-value varies depending on the magnitude of the numerical value.
- the display color is represented by the density of the fill.
- the calculation unit 11 determines the display color depending on the numerical value of the average F-value and adjusts the display color.
- the method of determining the display color is the same as in embodiment 1.
- the display form of the average F-value other than the display color may vary depending on the magnitude of the numerical value, such as varying the darkness of the display color, the size or thickness of the characters, the font of the characters, or the thickness of the frame depending on the magnitude of the numerical value.
- a table is displayed in which the board sets and the average F-value values are associated, and the display form of the average F-value varies depending on the magnitude of the numerical value, so that board sets with large average F-values and unstable processing can be easily identified.
- the average F value is shown, which indicates the variation in the measured values between multiple substrates of different lots and the same slot.
- the stability or instability of the process across multiple lots is visualized. Because the measured values are compared for the same slot, the effects of the difference in the slot do not appear, and the process instability caused by the difference in the lot becomes clear. Successive lot combinations that increase the average F value become clear, and the combination of lots that cause the substrate processing state to become unstable between the lots become clear. For example, if the average F value is large for a combination of lots with small lot numbers and the average F value is smaller for a combination of lots with larger lot numbers, it can be inferred that the processing state is stabilizing as the substrate processing continues. For example, if the average F value suddenly increases, it can be inferred that some kind of environmental change has occurred between the lots.
- the average F value which indicates the variation in the measured values between multiple substrates of the same lot but different slots.
- the stability or instability of the process across multiple slots within a lot is visualized. Since the measured values are compared for the same lot, the effects of the differences in the lots are not apparent, and the process instability caused by the differences in the slots becomes clear.
- the combination of consecutive slots in which the average F value increases within the lot becomes clear, and the combination of slots in which the substrate process state becomes unstable between the slots becomes clear. For example, if the average F value is large for a combination of small slots and the average F value is smaller for a combination of larger slots, it is inferred that the process state becomes stable as the substrate process continues within the lot. In addition, it is possible to identify the slot in which the process suddenly becomes unstable.
- the calculation unit 11 may display on the display unit 16 a table in which the average F value is arranged in association with each of a substrate set consisting of multiple substrates of different lots and the same process order, or a substrate set consisting of multiple substrates of the same lot but different process orders.
- the analysis device 1 calculates the variation in standardized or normalized values of the measurement values among the multiple substrates included in the substrate set for each substrate set (S74).
- the sensor 3 repeats measurements and obtains measurement values at predetermined intervals.
- Each of the multiple measurement values obtained during the first period is assigned a measurement number in the order in which they were measured.
- the measurement value with measurement number 1 is obtained first, then the measurement value with measurement number 2 is obtained, and so on.
- An increase in the measurement number corresponds to the passage of time within the first period.
- the calculation unit 11 calculates the variation in standardized or normalized values of the measurement values by calculating the difference between the standardized or normalized values of measurement values with the same measurement number among the multiple substrates.
- FIG. 19 is a chart showing an example of the results of calculating the variation in the standardized or normalized values of the measured values for each board set.
- the difference in the standardized or normalized values of the measured values is calculated for each measurement number, and the difference in the standardized or normalized values of the measured values is calculated for each board set.
- the "***" in the figure indicates the difference in the standardized or normalized values of the measured values.
- the difference value is shown in association with the lot number and slot that identify the board set, and the measurement number.
- the calculation unit 11 calculates the difference in the standardized or normalized values of the measured values for all board sets and all measurement numbers. The larger the absolute value of the difference, the greater the variation in the standardized or normalized values of the measured values between multiple boards.
- the calculation unit 11 stores data representing the calculated variation, as shown in FIG. 19, in the memory unit 14.
- the analytical device 1 then performs clustering of the multiple substrate sets based on the calculated variability (S75).
- the calculation unit 11 first pre-processes the data representing the variability so as to emphasize measurement value numbers with large measurement value variability.
- Figure 20 is a conceptual diagram showing an example of the contents of the data pre-processing.
- the calculation unit 11 sums up the difference values calculated for the multiple substrate sets for each measurement number. In the figure, the sums of the difference values calculated for measurement number 1, measurement number 2, ... across multiple substrate sets are shown as sum value 1, sum value 2, ....
- the calculation unit 11 standardizes the calculated total value so that the average is 0 and the standard deviation is 1. For example, the calculation unit 11 standardizes the total value by performing a calculation similar to that of formula (1) on the total values calculated for multiple measurement numbers.
- x in formula (1) is the total value
- x bar is the average of the total values
- ⁇ is the standard deviation of the total values
- x st is the standardized value of the total value.
- the standardized values of total value 1, total value 2, ... are shown as standardized value 1, standardized value 2, ....
- the calculation unit 11 converts the calculated standardized value into a weight. For example, the calculation unit 11 converts the standardized value into a weight using a softmax function.
- the calculation unit 11 calculates the weight W i according to the following formula (5), where M is the number of measurement values obtained during the first period, x i is the standardized value for measurement number i, and W i is the weight.
- the weights converted from standardized value 1, standardized value 2, ... are shown as weight 1, weight 2, ....
- the weights become positive values and the sum of the weights becomes 1.
- the calculation unit 11 multiplies the difference value of the standardized or normalized measurement values by the weight calculated for each measurement number. As shown in FIG. 20, each difference value calculated for measurement number 1 is multiplied by weight 1, each difference value calculated for measurement number 2 is multiplied by weight 2, and the same is true for measurement numbers 3 and onwards. By performing such preprocessing, values that indicate a large variation in the measurement values are converted into relatively larger values.
- the calculation unit 11 then extracts a predetermined number of substrate sets from the multiple substrate sets in descending order of the average F-value. For example, 100 substrate sets are extracted.
- the calculation unit 11 performs principal component analysis on the preprocessed data for the multiple extracted substrate sets.
- Figure 21 is a conceptual diagram showing an example of the results of performing principal component analysis. In the figure, the extracted substrate sets are shown as substrate set 1, substrate set 2, .... For each substrate set, the preprocessed values obtained for multiple measurement numbers are converted into multiple principal components. The "**" included in the figure indicates the principal component value (principal component score).
- the calculation unit 11 performs clustering of the substrate sets using the values of the principal components. For example, the calculation unit 11 performs clustering using the k-means method. At this time, the calculation unit 11 performs clustering using a predetermined number of principal components, such as using the first principal component, the second principal component, and the third principal component. In this way, the calculation unit 11 performs clustering after performing dimensionality reduction.
- the calculation unit 11 may perform clustering after dimensionality reduction using the UMAP (Uniform Manifold Approximation and Projection) method. Through clustering, the multiple substrate sets are classified into multiple clusters, each of which includes substrate sets with similar variations in measurement values.
- UMAP Uniform Manifold Approximation and Projection
- the calculation unit 11 displays the distribution of the clustered substrate sets (S76).
- the calculation unit 11 creates an image showing the two-dimensional distribution of the clustered substrate sets, and displays the created image on the display unit 16.
- FIG. 22 is a schematic diagram showing an example of an image showing the two-dimensional distribution of the substrate sets.
- the horizontal axis in the figure shows the value of the first principal component
- the vertical axis shows the value of the second principal component.
- the circles in the figure indicate substrate sets having values of the first principal component and values of the second principal component corresponding to the two-dimensional coordinates.
- the clusters are distinguished by surrounding the substrate sets included in the same cluster with dashed lines.
- the calculation unit 11 may cause the display colors of the substrate sets included in different clusters to differ from each other.
- the calculation unit 11 changes the display size of the board set according to the average F-value. For example, the larger the average F-value, the larger the display size.
- the display form of the board set may also be changed according to the average F-value. For example, the intensity of the display color may be changed according to the average F-value, and the shape of the mark indicating the board set may be changed according to the average F-value.
- the calculation unit 11 may display an image showing the three-dimensional distribution of the clustered multiple board sets on the display unit 16.
- the analysis device 1 may calculate the variation of the standardized or normalized values of the measurement values by a method other than calculating the difference.
- the calculation unit 11 may calculate the variation by calculating the variance of the standardized or normalized values of the measurement values for multiple substrates.
- Other methods may be used as a method of preprocessing the data.
- principal component analysis may be performed without preprocessing the data.
- a method other than principal component analysis may be used as a method of dimension reduction.
- the analysis device 1 selects one substrate set from among the multiple substrate sets (S77).
- the calculation unit 11 receives an instruction to select one substrate set by the user operating the operation unit 15, and selects the specified substrate set from among the multiple substrate sets. For example, in a state in which a table showing the average F-values associated with each substrate set as shown in FIG. 17 or FIG. 18 is displayed on the display unit 16 by the process of S73, the user operates the operation unit 15 to select one of the substrate sets. For example, a substrate set having a large average F-value is selected.
- a distribution of multiple substrate sets clustered as shown in FIG. 22 is displayed by the process of S76
- the user operates the operation unit 15 to select one of the substrate sets. For example, a substrate set included in a specific cluster is selected.
- the analytical device 1 displays the time variation of the standardized or normalized values of the measurement values obtained for the selected substrate set (S78).
- S78 a graph showing the time variation of the standardized or normalized values of the measurement values obtained during the first period for multiple substrates included in the multiple substrates included in the substrate set is displayed.
- the calculation unit 11 creates a graph and displays the created graph on the display unit 16.
- FIG. 23 is a schematic diagram showing an example of a graph showing the time change of standardized or normalized measured values.
- the horizontal axis in the figure shows the measurement number.
- the measurement number corresponds to the elapsed time within the first period.
- the vertical axis in the figure shows the standardized or normalized measured values.
- the standardized or normalized measured values are simply referred to as measured values.
- the standardized or normalized measured value for one of the multiple substrates included in the substrate set is shown with a white circle, and the standardized or normalized measured value for the other substrates is shown with a black circle.
- the time change of the measured values within the first period is specifically shown, and it becomes clear how the measured values vary specifically among the multiple substrates.
- the analysis device 1 may repeatedly execute the processes of S77 to S78. For example, various substrate sets may be selected, and a process may be performed in which the time change in the standardized or normalized measured values for each substrate set is displayed. It is not necessary that all of the processes of S71 to S78 are performed; a process may be performed in which S73 is omitted, a process may be performed in which S74 to S76 are omitted, or a process may be performed in which S71 to S78 are omitted.
- the analysis device 1 may be configured to perform processing that handles only one of the substrate sets.
- the average F value is used as an index value indicating the variation in measurement values among multiple substrates during the period in which processing according to each processing step is performed.
- the analysis device 1 may be configured to calculate an index value other than the average F value.
- the analysis device 1 may calculate the variance, standard deviation, or coefficient of variation at multiple time points included in the first period, and calculate the average of the variance, standard deviation, or coefficient of variation as the index value.
- the processing device 2 may be a device for processing substrates other than semiconductor wafers, such as glass substrates or flat panel substrates.
- a single sensor 3 is used to obtain multiple types of measured values.
- the analysis system 100 may be provided with multiple sensors 3 in the processing device 2 that measure different types of physical quantities, and may be provided with multiple sensors 3 to obtain multiple types of measured values.
- the sensor 3 measures the intensity of light, but the sensor 3 may be provided to measure a physical quantity other than the intensity of light, such as temperature or pressure.
- the analysis system 100 may be provided with multiple sensors 3 in the processing device 2 that measure the same type of physical quantity, and may obtain the measured values measured by the multiple sensors 3 as multiple types of measured values.
- the processing device 2 may be provided with multiple sensors 3 that measure temperatures at multiple locations inside the processing device 2, and the temperatures at the multiple locations may be obtained as multiple types of measured values.
- a multiple type of measured value is obtained, but the processing device 2 may be provided with a single sensor 3 that measures a single physical quantity, and the analysis device 1 may obtain a single type of measured value.
Landscapes
- Engineering & Computer Science (AREA)
- Physics & Mathematics (AREA)
- Plasma & Fusion (AREA)
- Chemical & Material Sciences (AREA)
- Analytical Chemistry (AREA)
- Testing Or Measuring Of Semiconductors Or The Like (AREA)
- Automation & Control Theory (AREA)
- Testing And Monitoring For Control Systems (AREA)
Priority Applications (4)
| Application Number | Priority Date | Filing Date | Title |
|---|---|---|---|
| KR1020257025766A KR20250136338A (ko) | 2023-01-12 | 2023-12-28 | 컴퓨터 프로그램, 분석 방법 및 분석 장치 |
| CN202380090325.0A CN120569802A (zh) | 2023-01-12 | 2023-12-28 | 计算机程序、分析方法以及分析装置 |
| JP2024570166A JPWO2024150704A1 (https=) | 2023-01-12 | 2023-12-28 | |
| US19/258,918 US20250329564A1 (en) | 2023-01-12 | 2025-07-03 | Computer program, analysis method, and analyzer |
Applications Claiming Priority (2)
| Application Number | Priority Date | Filing Date | Title |
|---|---|---|---|
| JP2023-003306 | 2023-01-12 | ||
| JP2023003306 | 2023-01-12 |
Related Child Applications (1)
| Application Number | Title | Priority Date | Filing Date |
|---|---|---|---|
| US19/258,918 Continuation US20250329564A1 (en) | 2023-01-12 | 2025-07-03 | Computer program, analysis method, and analyzer |
Publications (1)
| Publication Number | Publication Date |
|---|---|
| WO2024150704A1 true WO2024150704A1 (ja) | 2024-07-18 |
Family
ID=91897046
Family Applications (1)
| Application Number | Title | Priority Date | Filing Date |
|---|---|---|---|
| PCT/JP2023/047301 Ceased WO2024150704A1 (ja) | 2023-01-12 | 2023-12-28 | コンピュータプログラム、分析方法及び分析装置 |
Country Status (6)
| Country | Link |
|---|---|
| US (1) | US20250329564A1 (https=) |
| JP (1) | JPWO2024150704A1 (https=) |
| KR (1) | KR20250136338A (https=) |
| CN (1) | CN120569802A (https=) |
| TW (1) | TW202503443A (https=) |
| WO (1) | WO2024150704A1 (https=) |
Cited By (1)
| Publication number | Priority date | Publication date | Assignee | Title |
|---|---|---|---|---|
| WO2026023476A1 (ja) * | 2024-07-23 | 2026-01-29 | 東京エレクトロン株式会社 | 情報処理方法、コンピュータプログラム及び情報処理装置 |
Citations (4)
| Publication number | Priority date | Publication date | Assignee | Title |
|---|---|---|---|---|
| JP2005051269A (ja) * | 2004-10-12 | 2005-02-24 | Hitachi Ltd | 半導体処理装置 |
| WO2007129566A1 (ja) * | 2006-05-08 | 2007-11-15 | Tokyo Electron Limited | サーバ装置、およびプログラム |
| WO2008015881A1 (en) * | 2006-08-01 | 2008-02-07 | Tokyo Electron Limited | Server device and program |
| JP2017142634A (ja) * | 2016-02-10 | 2017-08-17 | 株式会社日立ハイテクノロジーズ | データ管理装置及びデータ管理装置の監視方法 |
Family Cites Families (1)
| Publication number | Priority date | Publication date | Assignee | Title |
|---|---|---|---|---|
| JP2014116453A (ja) | 2012-12-10 | 2014-06-26 | Hitachi Kokusai Electric Inc | データ取得方法及び基板処理装置の管理装置 |
-
2023
- 2023-12-28 CN CN202380090325.0A patent/CN120569802A/zh active Pending
- 2023-12-28 KR KR1020257025766A patent/KR20250136338A/ko active Pending
- 2023-12-28 JP JP2024570166A patent/JPWO2024150704A1/ja active Pending
- 2023-12-28 WO PCT/JP2023/047301 patent/WO2024150704A1/ja not_active Ceased
-
2024
- 2024-01-05 TW TW113100564A patent/TW202503443A/zh unknown
-
2025
- 2025-07-03 US US19/258,918 patent/US20250329564A1/en active Pending
Patent Citations (4)
| Publication number | Priority date | Publication date | Assignee | Title |
|---|---|---|---|---|
| JP2005051269A (ja) * | 2004-10-12 | 2005-02-24 | Hitachi Ltd | 半導体処理装置 |
| WO2007129566A1 (ja) * | 2006-05-08 | 2007-11-15 | Tokyo Electron Limited | サーバ装置、およびプログラム |
| WO2008015881A1 (en) * | 2006-08-01 | 2008-02-07 | Tokyo Electron Limited | Server device and program |
| JP2017142634A (ja) * | 2016-02-10 | 2017-08-17 | 株式会社日立ハイテクノロジーズ | データ管理装置及びデータ管理装置の監視方法 |
Cited By (1)
| Publication number | Priority date | Publication date | Assignee | Title |
|---|---|---|---|---|
| WO2026023476A1 (ja) * | 2024-07-23 | 2026-01-29 | 東京エレクトロン株式会社 | 情報処理方法、コンピュータプログラム及び情報処理装置 |
Also Published As
| Publication number | Publication date |
|---|---|
| KR20250136338A (ko) | 2025-09-16 |
| TW202503443A (zh) | 2025-01-16 |
| JPWO2024150704A1 (https=) | 2024-07-18 |
| CN120569802A (zh) | 2025-08-29 |
| US20250329564A1 (en) | 2025-10-23 |
Similar Documents
| Publication | Publication Date | Title |
|---|---|---|
| JP5383265B2 (ja) | エッチング装置、分析装置、エッチング処理方法、およびエッチング処理プログラム | |
| JP6002487B2 (ja) | 分析方法、分析装置、及びエッチング処理システム | |
| JP4645422B2 (ja) | 判定装置、判定装置の制御プログラム、および判定装置の制御プログラムを記録した記録媒体 | |
| WO2023069913A1 (en) | Intelligent detection of fiber composition of textiles through automated analysis by machine learning models | |
| US20220188307A1 (en) | Data analysis apparatus, method and system | |
| US7124054B2 (en) | System and method for mining model accuracy display | |
| CN113092981A (zh) | 晶圆数据检测方法及系统、存储介质及测试参数调整方法 | |
| US20220036223A1 (en) | Processing apparatus, processing method, and non-transitory storage medium | |
| CN114184599B (zh) | 单细胞拉曼光谱采集数目估计方法、数据处理方法及装置 | |
| WO2024150704A1 (ja) | コンピュータプログラム、分析方法及び分析装置 | |
| EP4202416A1 (en) | Spectrum analysis method, device and system | |
| TW201321739A (zh) | 訊號分析裝置、訊號分析方法及電腦程式產品 | |
| CN119862795B (zh) | 一种基于大数据的农药残留检测方法及系统 | |
| JP7143895B2 (ja) | 情報処理装置、情報処理方法、およびプログラム | |
| Tikkanen et al. | Multivariate outlier modeling for capturing customer returns—How simple it can be | |
| US11592807B2 (en) | Manufacturing defect factor searching method and manufacturing defect factor searching apparatus | |
| EP4692766A1 (en) | Spectrum analysis device, spectrum analysis system, and spectrum analysis method | |
| US12061467B2 (en) | Data processing apparatus, data processing method, and storage medium storing program for determining an abnormality based on manufacturing data | |
| US11469122B2 (en) | Semiconductor process analysis device, semiconductor process analysis method, and storage medium | |
| CN118435136A (zh) | 化工厂管理装置、化工厂管理系统和化工厂管理方法 | |
| US20120123753A1 (en) | Method for analyzing longitudinal data, corresponding computer and system | |
| JP2021103125A (ja) | 検査装置、及び検査方法 | |
| CN121499465A (zh) | 一种激光探针光谱特征的性能评估方法、系统及设备 | |
| Kunze et al. | Quality Activation Maps: Inline Efficiency Mapping of Solar Cells using Weakly‐Supervised Regression | |
| TW202603337A (zh) | 電腦程式、資訊處理方法及資訊處理裝置 |
Legal Events
| Date | Code | Title | Description |
|---|---|---|---|
| 121 | Ep: the epo has been informed by wipo that ep was designated in this application |
Ref document number: 23916317 Country of ref document: EP Kind code of ref document: A1 |
|
| ENP | Entry into the national phase |
Ref document number: 2024570166 Country of ref document: JP Kind code of ref document: A |
|
| WWE | Wipo information: entry into national phase |
Ref document number: 2024570166 Country of ref document: JP Ref document number: 202380090325.0 Country of ref document: CN |
|
| ENP | Entry into the national phase |
Ref document number: 1020257025766 Country of ref document: KR Free format text: ST27 STATUS EVENT CODE: A-0-1-A10-A15-NAP-PA0105 (AS PROVIDED BY THE NATIONAL OFFICE) |
|
| NENP | Non-entry into the national phase |
Ref country code: DE |
|
| WWP | Wipo information: published in national office |
Ref document number: 202380090325.0 Country of ref document: CN |
|
| 122 | Ep: pct application non-entry in european phase |
Ref document number: 23916317 Country of ref document: EP Kind code of ref document: A1 |