WO2022210072A1 - ロボット故障予兆検出装置及びロボット故障予兆検出方法 - Google Patents
ロボット故障予兆検出装置及びロボット故障予兆検出方法 Download PDFInfo
- Publication number
- WO2022210072A1 WO2022210072A1 PCT/JP2022/013021 JP2022013021W WO2022210072A1 WO 2022210072 A1 WO2022210072 A1 WO 2022210072A1 JP 2022013021 W JP2022013021 W JP 2022013021W WO 2022210072 A1 WO2022210072 A1 WO 2022210072A1
- Authority
- WO
- WIPO (PCT)
- Prior art keywords
- robot
- series
- determination
- detection device
- sign detection
- Prior art date
- Legal status (The legal status is an assumption and is not a legal conclusion. Google has not performed a legal analysis and makes no representation as to the accuracy of the status listed.)
- Ceased
Links
Images








Classifications
-
- B—PERFORMING OPERATIONS; TRANSPORTING
- B25—HAND TOOLS; PORTABLE POWER-DRIVEN TOOLS; MANIPULATORS
- B25J—MANIPULATORS; CHAMBERS PROVIDED WITH MANIPULATION DEVICES
- B25J19/00—Accessories fitted to manipulators, e.g. for monitoring, for viewing; Safety devices combined with or specially adapted for use in connection with manipulators
- B25J19/06—Safety devices
-
- G—PHYSICS
- G05—CONTROLLING; REGULATING
- G05B—CONTROL OR REGULATING SYSTEMS IN GENERAL; FUNCTIONAL ELEMENTS OF SUCH SYSTEMS; MONITORING OR TESTING ARRANGEMENTS FOR SUCH SYSTEMS OR ELEMENTS
- G05B23/00—Testing or monitoring of control systems or parts thereof
- G05B23/02—Electric testing or monitoring
- G05B23/0205—Electric testing or monitoring by means of a monitoring system capable of detecting and responding to faults
- G05B23/0218—Electric testing or monitoring by means of a monitoring system capable of detecting and responding to faults characterised by the fault detection method dealing with either existing or incipient faults
- G05B23/0243—Electric testing or monitoring by means of a monitoring system capable of detecting and responding to faults characterised by the fault detection method dealing with either existing or incipient faults model based detection method, e.g. first-principles knowledge model
- G05B23/0245—Electric testing or monitoring by means of a monitoring system capable of detecting and responding to faults characterised by the fault detection method dealing with either existing or incipient faults model based detection method, e.g. first-principles knowledge model based on a qualitative model, e.g. rule based; if-then decisions
- G05B23/0248—Causal models, e.g. fault tree; digraphs; qualitative physics
-
- B—PERFORMING OPERATIONS; TRANSPORTING
- B25—HAND TOOLS; PORTABLE POWER-DRIVEN TOOLS; MANIPULATORS
- B25J—MANIPULATORS; CHAMBERS PROVIDED WITH MANIPULATION DEVICES
- B25J19/00—Accessories fitted to manipulators, e.g. for monitoring, for viewing; Safety devices combined with or specially adapted for use in connection with manipulators
- B25J19/0095—Means or methods for testing manipulators
-
- B—PERFORMING OPERATIONS; TRANSPORTING
- B25—HAND TOOLS; PORTABLE POWER-DRIVEN TOOLS; MANIPULATORS
- B25J—MANIPULATORS; CHAMBERS PROVIDED WITH MANIPULATION DEVICES
- B25J9/00—Program-controlled manipulators
- B25J9/16—Program controls
- B25J9/1674—Program controls characterised by safety, monitoring, diagnostic
-
- G—PHYSICS
- G01—MEASURING; TESTING
- G01M—TESTING STATIC OR DYNAMIC BALANCE OF MACHINES OR STRUCTURES; TESTING OF STRUCTURES OR APPARATUS, NOT OTHERWISE PROVIDED FOR
- G01M13/00—Testing of machine parts
- G01M13/02—Gearings; Transmission mechanisms
- G01M13/021—Gearings
-
- G—PHYSICS
- G01—MEASURING; TESTING
- G01M—TESTING STATIC OR DYNAMIC BALANCE OF MACHINES OR STRUCTURES; TESTING OF STRUCTURES OR APPARATUS, NOT OTHERWISE PROVIDED FOR
- G01M13/00—Testing of machine parts
- G01M13/02—Gearings; Transmission mechanisms
- G01M13/028—Acoustic or vibration analysis
-
- G—PHYSICS
- G01—MEASURING; TESTING
- G01M—TESTING STATIC OR DYNAMIC BALANCE OF MACHINES OR STRUCTURES; TESTING OF STRUCTURES OR APPARATUS, NOT OTHERWISE PROVIDED FOR
- G01M13/00—Testing of machine parts
- G01M13/04—Bearings
-
- G—PHYSICS
- G01—MEASURING; TESTING
- G01M—TESTING STATIC OR DYNAMIC BALANCE OF MACHINES OR STRUCTURES; TESTING OF STRUCTURES OR APPARATUS, NOT OTHERWISE PROVIDED FOR
- G01M13/00—Testing of machine parts
- G01M13/04—Bearings
- G01M13/045—Acoustic or vibration analysis
-
- G—PHYSICS
- G01—MEASURING; TESTING
- G01M—TESTING STATIC OR DYNAMIC BALANCE OF MACHINES OR STRUCTURES; TESTING OF STRUCTURES OR APPARATUS, NOT OTHERWISE PROVIDED FOR
- G01M99/00—Subject matter not provided for in other groups of this subclass
-
- G—PHYSICS
- G05—CONTROLLING; REGULATING
- G05B—CONTROL OR REGULATING SYSTEMS IN GENERAL; FUNCTIONAL ELEMENTS OF SUCH SYSTEMS; MONITORING OR TESTING ARRANGEMENTS FOR SUCH SYSTEMS OR ELEMENTS
- G05B23/00—Testing or monitoring of control systems or parts thereof
- G05B23/02—Electric testing or monitoring
-
- G—PHYSICS
- G05—CONTROLLING; REGULATING
- G05B—CONTROL OR REGULATING SYSTEMS IN GENERAL; FUNCTIONAL ELEMENTS OF SUCH SYSTEMS; MONITORING OR TESTING ARRANGEMENTS FOR SUCH SYSTEMS OR ELEMENTS
- G05B2219/00—Program-control systems
- G05B2219/30—Nc systems
- G05B2219/39—Robotics, robotics to robotics hand
- G05B2219/39412—Diagnostic of robot, estimation of parameters
-
- G—PHYSICS
- G05—CONTROLLING; REGULATING
- G05B—CONTROL OR REGULATING SYSTEMS IN GENERAL; FUNCTIONAL ELEMENTS OF SUCH SYSTEMS; MONITORING OR TESTING ARRANGEMENTS FOR SUCH SYSTEMS OR ELEMENTS
- G05B2219/00—Program-control systems
- G05B2219/30—Nc systems
- G05B2219/42—Servomotor, servo controller kind till VSS
- G05B2219/42332—Detect failure of servo controller
Definitions
- This application relates to monitoring the state of robots.
- Patent Literature 1 discloses this type of robot maintenance support device.
- the robot maintenance support device of Patent Document 1 diagnoses the future change trend of the current command value based on the data of the current command value of the servo motors that constitute the robot drive system, and based on the diagnosed change trend, the current command value is determined. It is configured to determine the period until the value reaches a preset value.
- Patent Document 1 The configuration of Patent Document 1 above exemplifies the I2 monitor, duty, and peak current as diagnostic items for the current command value. Simply using these items may not always be effective in catching signs of failure of the robot. Therefore, there has been a demand for a new configuration that can accurately detect that the robot is approaching failure.
- this robot failure sign detection device includes a behavior time-series data acquisition unit, an evaluation value calculation unit, a representative evaluation value generation unit, a series processing unit, and a determination unit.
- the behavior time-series data acquisition unit performs a process of acquiring behavior time-series data relating to the motors of the joints of the robot from the motion of the robot for each data collection unit period.
- the evaluation value calculation unit calculates an evaluation value for the behavior time series data acquired by the behavior time series data acquisition unit.
- the representative evaluation value generation unit generates a representative evaluation value representing the evaluation values from the evaluation values obtained by the evaluation value calculation unit for each data collection unit period.
- the series processing unit generates a series of the representative evaluation values.
- the determination unit creates a determination model based on the initial sequence generated by the sequence processing unit at the beginning of operation of the robot. After the initial operation, the determination unit inputs determination data including data based on the robot motion after the initial operation to the created determination model, and determines the specificity of the determination data. get.
- this robot failure sign detection method includes a behavior time-series data acquisition process, an evaluation value calculation process, a representative evaluation value generation process, a series processing process, a model creation process, and a determination process.
- a process of acquiring behavior time-series data relating to the motors of the joints of the robot from the motion of the robot is performed for each data collection unit period.
- an evaluation value is calculated for the behavior time series data acquired in the behavior time series data acquisition step.
- the representative evaluation value generation step a representative evaluation value representing the evaluation values is generated from the evaluation values obtained in the evaluation value calculation step for each data collection unit period.
- a series of representative evaluation values is generated.
- a determination model is created based on the initial sequence that is the sequence generated in the sequence processing step.
- data for determination including data based on the robot motion after the initial operation is input to the created model for determination, and the specificity of the data for determination is determined. get.
- FIG. 1 is a block diagram schematically showing an electrical configuration of a robot failure sign detection device according to a first embodiment;
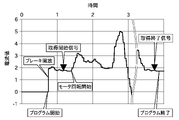
- FIG. Graph explaining the timing of the trigger signal for the acquisition of time-series data.
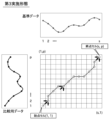
- FIG. 2 is a conceptual diagram showing an Ergodic Hidden Markov Model with two states. Schematic diagram for explaining an initial sequence and a determination sequence.
- the graph which shows the root mean square of a current value. 7 is a graph showing the logarithmic likelihood regarding the similarity of the root-mean-square series of current values.
- FIG. 1 is a block diagram schematically showing an electrical configuration of a robot failure sign detection device according to a first embodiment
- FIG. Graph explaining the timing of the trigger signal for the acquisition of time-series data.
- FIG. 2 is a conceptual diagram showing an Ergodic Hidden Markov Model with two states. Schematic diagram for explaining an initial sequence and a determination sequence.
- FIG. 2 is a block diagram schematically showing an electrical configuration of a robot failure sign detection device according to a second embodiment;
- the conceptual diagram which shows the DTW method used by 3rd Embodiment.
- Graph showing log-likelihood evaluated by inputting DTW-processed data into a hidden Markov model.
- FIG. 11 is a block diagram schematically showing an electrical configuration of a robot failure sign detection device according to a fourth embodiment; The schematic diagram explaining the initial series and the data for determination in 4th Embodiment.
- the block diagram which shows roughly the electric structure of the robot failure sign detection apparatus of 5th Embodiment.
- FIG. 11 is a block diagram schematically showing an electrical configuration of a robot failure sign detection device according to a sixth embodiment;
- 7 is a graph showing changes in the prediction line when reference days are changed in an example of predicting failure timing without using a judgment model;
- 4 is a graph showing frequency bands for calculating a frequency analysis partial integrated value;
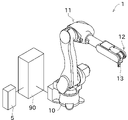
- FIG. 1 is a perspective view showing the configuration of a robot 1 according to one embodiment of the present application.
- FIG. 2 is a block diagram schematically showing the electrical configuration of the robot 1 and the robot failure sign detection device 5. As shown in FIG.
- the robot failure sign detection device 5 related to this application is used to monitor the state of an industrial robot capable of reproducing predetermined actions.
- the robot failure sign detection device 5 is applied to the robot 1 as shown in FIG. 1, for example.
- the robot 1 performs operations such as painting, cleaning, welding, and transportation on the work to be worked.
- the robot 1 is implemented by, for example, a vertically articulated robot.
- the robot 1 includes a base member 10, an articulated arm 11, and a wrist portion 12.
- the base member 10 is fixed to the ground (for example, the floor of a factory).
- the articulated arm 11 has multiple joints.
- the wrist part 12 is attached to the tip of the articulated arm 11 .
- An end effector 13 is attached to the wrist portion 12 to work on a work to be worked.
- the robot 1 has an arm driving device 21.
- the actuator is configured, for example, as a servomotor. However, the configuration of the driving device is not limited to the above.
- Each actuator is electrically connected to the controller 90 .
- the actuator operates to reflect command values input from the controller 90 .
- each servomotor that configures the arm driving device 21 is transmitted to each joint of the multi-joint arm 11, the base member 10, and the wrist portion 12 via a reduction gear.
- Each servomotor is attached with an unillustrated encoder for detecting its rotational position.
- the robot 1 works by reproducing the motions recorded by teaching.
- the controller 90 controls the actuators so that the robot 1 reproduces a series of actions taught in advance by the teacher.
- Teaching to the robot 1 can be performed by a teacher operating a teaching pendant (not shown).
- a program for moving the robot 1 is generated by teaching the robot 1 .
- the controller 90 is configured as a known computer including, for example, a CPU, ROM, RAM, auxiliary storage device, and the like.
- the auxiliary storage device is configured as, for example, an HDD, SSD, or the like.
- a program for moving the robot 1 and the like are stored in the auxiliary storage device.
- the robot failure sign detection device 5 is connected to the controller 90 as shown in FIG.
- the robot failure sign detection device 5 acquires, via the controller 90, transitions such as the current value of the current flowing through the actuator (servo motor).
- this current value reflects the state of the robot 1 .
- the transition of the current value can be expressed by repeatedly acquiring the current value at short time intervals and arranging many current values in time series.
- current value time series data be referred to as current value time series data (behavior time series data).
- the robot failure sign detection device 5 can determine whether or not there is an abnormality in the robot 1 by monitoring the acquired current value time-series data.
- the robot failure sign detection device 5 mainly targets the servomotors and speed reducers of the respective joints and determines whether or not there is an abnormality.
- abnormality includes a situation in which some kind of situation that is a sign of malfunction/impossibility does not occur in the servomotor, speed reducer, or bearing.
- the robot failure sign detection device 5 includes a storage unit 50, a current value time-series data acquisition unit (behavior time-series data acquisition unit) 51, an evaluation value calculation unit 52, and a representative evaluation value generation unit. 53 , a sequence processing unit 54 , a determination unit 55 , an alarm generating unit 62 , and a display unit 63 .
- the robot failure sign detection device 5 is configured as a known computer including a CPU, ROM, RAM, auxiliary storage device, and the like.
- the auxiliary storage device is configured as, for example, an HDD, SSD, or the like. Programs for evaluating the state of the robot 1 and the like are stored in the auxiliary storage device.
- the computer can be configured as a storage unit 50, a current value time series data acquisition unit 51, an evaluation value calculation unit 52, a representative evaluation value generation unit 53, a series processing unit 54, a determination unit 55, an alarm It can be operated as the generation unit 62, the display unit 63, and the like.
- the current value time series data acquisition unit 51 acquires the above-described current value time series data.
- the current value time-series data acquisition unit 51 acquires current value time-series data for all servo motors included in the arm driving device 21 of the robot 1 .
- Current value time-series data is obtained individually for each of the plurality of servo motors (in other words, the plurality of speed reducers) arranged in each part of the robot 1 .
- the current value means the measured value of the magnitude of the current flowing through the servomotor measured by a sensor.
- a signal from the sensor is digitized by an A/D converter (not shown).
- the sensor is provided in a servo driver (not shown) that controls the servo motor.
- a sensor may be provided for monitoring separately from the servo driver.
- a current command value given to the servomotor by the servo driver may be employed.
- the servo driver feedback-controls the servo motor so that the current current value approaches the current command value. Therefore, for the purpose of detecting an abnormality in the servomotor or speed reducer, there is almost no difference between the current value and the current command value.
- the magnitude of the torque of the servo motor is proportional to the magnitude of the current. Therefore, a torque value or torque command value may be used instead of the current value. Also, a deviation (rotational position deviation) between a target value for the rotational position of the servomotor and the actual rotational position obtained by the encoder may be used. Normally, the servo driver gives a current command value obtained by multiplying this deviation by a gain to the servo motor. Therefore, the transition of the rotational position deviation shows a tendency similar to the transition of the current command value.
- current value time-series data is used to detect signs of failure.
- a current command value, a torque value, a torque command value, or time-series data of rotational position deviation may be used instead of the current value.
- the current value time-series data acquisition unit 51 acquires current value time-series data for each servo motor when the robot 1 performs the instructed motion.
- the current value time-series data acquisition unit 51 acquires current value time-series data for each servo motor each time the robot 1 performs a taught motion. Since the robot 1 repeats the same motion, a large amount of current value time-series data is obtained every day.
- the period after the start of use of the robot failure sign detection device 5 can be divided into the period from the 1st day to the Nth day and the period after the N+1st day.
- the period from the 1st day to the Nth day may be referred to as the initial operation period
- the period after the N+1th day may be referred to as the monitoring period.
- the initial operation period may be started at the same time as the robot is installed and used, but for example, one month may be considered as a break-in period, and the initial operation period may be started after the break-in period. good.
- the monitoring period may be started after an appropriate interval period (for example, two months) has passed after the initial operation period.
- the current value time-series data is obtained for the number of servo motors.
- the timing at which the current value time-series data acquisition unit 51 starts and ends the acquisition of the time-series data of the current value can be appropriately determined based on the signal output from the controller 90 .
- the graph in FIG. 3 shows an example of current values flowing through the servo motors of certain joints when the robot 1 performs a regenerative motion. As shown in FIG. 3, the current value of the servomotor is zero before the reproduction operation program is executed. At this time, since an electromagnetic brake (not shown) operates at each joint, the attitude of the multi-joint arm 11 and the like is maintained.
- the program for the reproduction operation of the robot 1 is started.
- the brake is released, and almost at the same time, current begins to flow through the servomotor.
- the output shaft of the servomotor is controlled to stop.
- the rotation of the servomotor is started. Thereby, the motion of the robot 1 is substantially started.
- the controller 90 After the brake is released, the controller 90 outputs an acquisition start signal to the robot failure sign detection device 5 (and thus the current value time-series data acquisition unit 51) at a time point slightly before the rotation of the servomotor is started. .
- the controller 90 outputs an acquisition end signal to the current value time-series data acquiring section 51 after the servomotor stops rotating and before the program ends.
- the storage unit 50 is composed of, for example, the auxiliary storage device described above.
- the storage unit 50 stores the robot failure sign detection program, the current value time-series data acquired by the current value time-series data acquisition unit 51, and the like.
- the robot failure predictor detection program implements the robot failure predictor detection method of the present embodiment.
- the time-series data is a number of current values obtained by repeated detection at short, constant time intervals and arranged in chronological order.
- a time interval (sampling interval) for detecting the current value is, for example, several milliseconds.
- the time-series data corresponds to the transition of the current value from the timing of the acquisition start signal to the timing of the acquisition end signal in the graph of FIG.
- the storage unit 50 stores time information indicating when the data was acquired in association with the time-series data.
- the current value time-series data acquired by the current value time-series data acquisition unit 51 can be divided into data collected during the initial operation period of the robot 1 and data collected during the monitoring period. can.
- the current value time-series data obtained in the initial operation period is used to create learning data for constructing a judgment model, which will be described later.
- the current value time-series data collected during the monitoring period is used to create determination data to be input to the determination model.
- Appropriate filtering may be performed on the current value time-series data in order to remove noise and the like. Since the filtering process for data is well known, detailed description thereof will be omitted.
- the evaluation value calculation unit 52 inputs each of the current value time-series data acquired by the current value time-series data acquisition unit 51 into a predetermined function and calculates an evaluation value. This function extracts some features of the current value time-series data.
- the original current value time-series data consists of a plurality of scalar quantities (current values), whereas the evaluation value is one scalar quantity. Therefore, the processing performed by the evaluation value calculation unit 52 corresponds to compression of information.
- the function used by the evaluation value calculation unit 52 is arbitrary, but for example, the root mean square, maximum value, value range (maximum value - minimum value), and frequency analysis integrated value can be used.
- the root mean square of the current value changes when the efficiency decreases due to wear of the teeth of the speed reducer or when the torque constant decreases due to demagnetization of the magnet of the servomotor. . Therefore, it may be preferable to use the root mean square to determine whether there is a sign of failure.
- the frequency analysis integrated value is proposed as a method of frequency analysis.
- a frequency analysis yields an amplitude spectrum, power spectrum, or power spectral density.
- the amplitude spectrum, power spectrum, or power spectral density may be referred to as frequency spectrum or simply spectrum.
- the frequency analysis integrated value is, for example, the total value of the amplitude spectrum, power spectrum, or power spectrum density up to several tens of Hz obtained by frequency analysis.
- a frequency analysis integrated value may be obtained using an average value instead of the total value.
- the amplitude spectrum and power spectrum are obtained by a known method which will be described later.
- the natural frequency of the system of the robot 1 is 8 Hz
- the 8 Hz component increases due to resonance, but the above example of the frequency analysis integrated value does not stop at detecting the 8 Hz peak.
- Amplitude spectra, power spectra, or sums of power spectral densities up to several tens of Hz are evaluated.
- vibrations due to deterioration of various parts are often added. By observing a wide range of frequencies, it is possible to widen the detection range of signs of failure.
- the evaluation value calculator 52 obtains a Fourier spectrum (complex number) by performing FFT (Fast Fourier Transform) on the current value time-series data.
- a value obtained by squaring the Fourier spectrum is the power spectrum. Phase information is lost by converting to a power spectrum.
- a value obtained by taking the square root of the power spectrum is the amplitude spectrum.
- An amplitude spectrum has an effective value and a peak value, and either value can be used to determine the presence or absence of a sign of failure.
- the power spectral density function is also called a PSD function (Power Spectral Density Function).
- a power spectral density function is a spectral function that expresses a power value per unit frequency width (1 Hz width) so as not to depend on the frequency resolution of FFT.
- the upper limit frequency that can be detected by FFT is half the sampling frequency.
- a frequency that is half the sampling frequency is called the Nyquist frequency.
- the reciprocal of the longer one of the control cycle of the robot 1 and the control cycle of the robot failure sign detection device 5 corresponds to the sampling frequency.
- the FFT performed in this embodiment targets values below the Nyquist frequency.
- the behavior of the robot 1 is measured from the current value or current command value of the actuator and FFT is performed, there is an upper limit value based on the Nyquist frequency and the like.
- the software that executes the FFT may be regulated so as not to exceed the Nyquist frequency.
- vibrations caused by failures there are vibrations caused by failures.
- damage to the bearings of the motor damage to the teeth of the input shaft gear and the revolution gear, damage to the bearings of the eccentric shaft, and the like can cause vibrations other than the natural frequency.
- Damage to the bearings of the motor has a relatively high frequency among these, and for example, there is a possibility that vibrations of around 25 Hz will occur.
- the value of the vibration frequency also changes depending on whether the damage occurred in the inner ring, the outer ring, or the rolling element of the bearing, and the number of revolutions of the motor.
- it is preferable to set the upper limit to, for example, about 50 Hz.
- the Nyquist frequency may be set as the upper limit.
- the spectrum is searched in order from 0 Hz, and the first peak value is set to the primary natural frequency f0, and summed up to 4.5 x f0, which is 4.5 times that. Also good.
- the reference frequency to be searched may be registered as the initial frequency, and the search may be performed from 0.5 to 1.5 times the initial frequency. If the frequency-related characteristics are stable, the search may be performed from 0.2 times to 1.8 times. If the margins are described as ⁇ f1 and ⁇ f2, and the initial frequency of the natural frequency of the search is described as f01, the search is performed from f01- ⁇ f1 to f01+ ⁇ f2.
- the articulated robot 1 can rotate the entire articulated arm 11 with respect to the base member 10, for example, with the vertical direction as the center of rotation.
- This turning axis is referred to as a turning axis JT1.
- Inertia around the pivot axis JT1 changes greatly depending on the posture of the articulated arm 11 .
- the natural frequency f0 may vary between 10 Hz and 20 Hz.
- the "assumed" natural frequency f02 can be registered as, for example, 12 Hz, and summed up to 4.5 times that.
- the upper limit and lower limit of the integrated frequency can be summarized as follows. Also, any combination of the upper limit value and the lower limit value described below may be used.
- the following values can be used as the upper limit.
- the fixed value may be, for example, 50 Hz. However, the fixed value must be less than or equal to the Nyquist frequency. Also, the fixed value may be the Nyquist frequency or a value obtained by multiplying the Nyquist frequency by a margin factor.
- n is, for example, 4, the numerical value is arbitrary, and may be 1, 2, or 3, for example. Also, instead of 0.5, another numerical value of 0 or more and less than 1 can be applied.
- the lower limit for example, the following values can be used.
- the fixed value may be, for example, 6 Hz.
- 0 is also referred to as a DC component, which is a quantity that does not involve vibration and corresponds to the load torque of each axis of the robot 1 . Therefore, 0 can be used as the lower limit when evaluating including the load torque, and ⁇ times the natural frequency can be used as the lower limit when evaluating only the vibration component.
- ⁇ is, for example, 0.5
- ⁇ may be any value from 0.2 to 0.8.
- the lower limit ⁇ may be 0.5
- the upper limit may be 1.5 times the natural frequency.
- the judgment model As described above, different functions have different failure signs that are easier to detect. Since the output value of the function is substantially input to the judgment model, which will be described later, and machine learning or the like is performed, the judgment model also inherits the properties of the function. Therefore, the learning and evaluation of the judgment model may be performed for each evaluation value obtained from a plurality of different functions.
- the frequency analysis integrated value is divided into a plurality of frequency bands, and the total value is obtained for each range.
- the integrated value of the frequency spectrum for each frequency band is called a "frequency analysis partial integrated value”. It may be abbreviated and called a "partial integrated value”.
- a frequency analysis partial integration value may be obtained using an average value instead of the total value.
- the partial integrated value will be described with reference to FIG.
- the vertical axis of FIG. 18 is the amplitude of the spectrum, and the horizontal axis is the frequency.
- the lower limit of frequency is 0 Hz and the upper limit is 50 Hz.
- 10, 20, 30, and 40 are set as values for dividing 0 Hz to 50 Hz. Dividing the spectrum using these values yields the following frequency bands: Frequency band; 0-10, 10-20, 20-30, 30-40, 40-50
- Each frequency band may or may not include both end frequencies (lower and upper limits for determining the frequency band). Also, both end frequencies may be included in two adjacent frequency bands.
- the vibration generated in the robot 1 will be described using the 10-20 frequency band indicated by the thick frame in FIG. 18 and the smaller frequency band 0-10 as an example.
- the 0-10 frequency band includes a spectrum of approximately 8 Hz, which is the natural frequency of the robot arm system. There are other large amplitudes at 4, 2, and 1 Hz, but most of these frequencies are frequency components of the trajectory of the robot's movement. The frequency components of these trajectories hardly change when the robot program that determines the motion is the same.
- the 10-20 frequency band contains a second harmonic with a natural frequency of about 16 Hz. In the 10-20 frequency band, components other than harmonics of the natural frequency are also included.
- the spectrum of the natural frequency and its harmonics may increase.
- the spectrum other than the natural frequency and its harmonics may increase due to the deterioration of other parts (parts such as bearings attached to the motor shaft, etc.).
- the natural frequency may drop and may move to a lower frequency band if that frequency is near the divided frequency band.
- Even in the band exceeding 20 Hz there are harmonics of the natural frequency, but their intensity decreases, and the ratio of other vibration components increases.
- the partial integrated value obtained by dividing into multiple parts can be used in the judgment model described later.
- the partial integrated value can be used for life prediction and failure sign judgment system, in which a plurality of trend management devices are operated simultaneously.
- the division may not be continuous as in FIG. 18, and there may be intervals between frequency bands such as 0-10, 20-30, and 40-50.
- frequency bands may overlap, such as 0-10, 0-20, 0-30. Since the partial integrated value is used for trend management, the partial integrated value itself has no meaning, and changes in the partial integrated value are evaluated. Therefore, it is not necessary to include all frequencies without omission or overlap, and it is sufficient to select a frequency band that facilitates trend management. Of course, as shown in FIG. 18, all frequencies may be included without omission or overlap.
- the representative evaluation value generation unit 53 obtains a representative evaluation value from the multiple evaluation values obtained by the evaluation value calculation unit 52. As described above, one evaluation value corresponds to compressed information of current value time-series data, but the representative evaluation value can be considered to be information obtained by further compressing a plurality of evaluation values.
- the current value time-series data acquisition unit 51 obtains a large number of time-series current value data
- the evaluation value calculation unit 52 obtains an evaluation value for each time-series current value data.
- the representative evaluation value generation unit 53 generates one evaluation value representing the day as a representative evaluation value from many evaluation values.
- the room temperature in the factory may change due to the outside temperature.
- the grease added to the joints of the robot 1 has a low temperature at the beginning of operation, but the temperature rises as time passes from the start of operation, resulting in a decrease in viscosity.
- the representative evaluation value generation unit 53 may select the median value from a large number of evaluation values obtained from 9:00 to 17:00 and use it as the representative evaluation value. .
- the representative evaluation value generated by the representative evaluation value generation unit 53 is stored in the storage unit 50 .
- the representative evaluation value is not limited to the median value, and can be the average value, for example.
- one representative evaluation value represents the current value time-series data for one day, so the data collection unit period is one day.
- the data collection unit period may be one shift, but preferably one day including two shifts. By setting one day including day and night as the data collection unit period, it is possible to prevent deterioration in detection accuracy of failure sign due to the influence of the variation period of the outside air temperature.
- the data collection unit period may be multiple days (for example, 2 days, 3 days, or 1 week).
- the series processing unit 54 generates a series by arranging a plurality of representative evaluation values stored in the storage unit 50.
- the series of representative evaluation values generated by the series processing unit 54 is input to the determination unit 55 .
- the determination unit 55 uses the representative evaluation value generated by the representative evaluation value generation unit 53 to determine whether or not there is a sign of failure of the robot 1 .
- the determination unit 55 includes a learning unit 57 , a probability output unit 58 and a conversion unit 61 .
- the learning unit 57 creates a judgment model, which is a machine learning model, by learning N representative evaluation values generated in N data unit periods during the initial operation period of the robot 1 .
- the determination unit 55 of this embodiment uses a hidden Markov model as a model for determination.
- Hidden Markov Model is one of probabilistic models that implements statistical modeling for serial data. Hidden Markov Models can calculate the probability of occurrence of sequential data given sequential data.
- the Hidden Markov Model will be explained below. There are three types of parameters that define the Hidden Markov Model: transition probability A, output probability B, and initial probability ⁇ .
- transition probability A transition probability A
- output probability B initial probability ⁇
- initial probability ⁇ initial probability ⁇
- R the number of states.
- initial probability ⁇ is the same symbol as ⁇ representing the total power in Equation (1) described later, but has a different meaning.
- a ij represents the probability that state i at time (t ⁇ 1) becomes state j at time t.
- i and j are integers of 1 or more and R or less.
- b jk represents the probability distribution that the k-th observed signal v k is output in state j.
- a continuous value is assumed as the output, and the probability that the observed signal v k is output is represented by a normal distribution.
- a single normal distribution is used in this embodiment, a mixed normal distribution may be used instead.
- the states are hidden, but the initial values are arbitrarily tentative.
- Hidden Markov models are roughly divided into Ergodic Hidden Markov Models and Left-to-Right Hidden Markov Models.
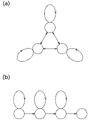
- FIG. 4(a) The Ergodic Hidden Markov Model is shown in Fig. 4(a).
- An Ergodic Hidden Markov Model contains multiple states.
- FIG. 4A shows an example in which there are three states. Each state can transition to any state including itself.
- Ergodicity is established in the Ergodic Hidden Markov Model. Ergodicity means that [A] any state can be reached from any state, [B] no periodicity, and [C] the number of states is finite. When the Hidden Markov Model has ergodicity, the ensemble mean and the time mean agree.
- FIG. 4(b) A Left-to-Right Hidden Markov Model contains multiple states.
- FIG. 4B shows an example in which there are four states.
- state transitions are always unidirectional, so once transitioned to another state, it is impossible to return to the state before the transition.
- Left-to-Right Hidden Markov Models have the constraint that backward transitions are not possible. Since the state transition is restricted in this way, the Left-to-Right Hidden Markov Model has the advantage of being able to reduce the amount of calculation, and is suitable for evaluating time-series data.
- both the Ergodic Hidden Markov Model and the Left-to-Right Hidden Markov Model can be used as the judgment model.
- the number of states of the Hidden Markov Model is arbitrary as long as it is two or more, and is determined as appropriate.
- the learning unit 57 inputs the series of N representative evaluation values described above to the determination model, and adjusts the transition probability and the output probability so that the probability that the determination model generates the series of representative evaluation values increases. , updating the parameters of the initial probability.
- EM Exectation Maximization
- Baum-Welch algorithm a known EM (Expectation Maximization) method and Baum-Welch algorithm are used.
- the order in which multiple representative evaluation values are input to the learning model may or may not be fixed.
- the input order of the plurality of representative evaluation values be fixed in chronological order.
- the series processing unit 54 generates a series of N representative evaluation values according to conditions and outputs the series to the determination unit 55 .
- the probability output unit 58 inputs the series containing the representative evaluation values obtained during the monitoring period into the created determination model, and acquires the probability that the series appears.
- the Hidden Markov Model can calculate the probability that this series will appear.
- the calculated probability can also be thought of as a quantification of the likelihood of the series input to the model (likelihood). If the probability of output from the model is low, it can be said that there is a high probability that the series of representative evaluation values input to the model is different from normal. This probability therefore reflects the specificity. The specificity can also be rephrased as the degree of abnormality.
- the Hidden Markov Model outputs a higher probability as the input sequence is more similar to the learned sequence. Therefore, obtaining the probability is substantially the same as obtaining the similarity of two sequences.
- the probability output section 58 outputs the obtained probability to the conversion section 61 .
- the transformation unit 61 logarithmically transforms the probabilities obtained from the probability output unit 58 .
- the obtained value (logarithmic likelihood) is output to the alarm generating section 62 and the display section 63 .
- the alarm generation unit 62 issues a failure sign alarm.
- the warning is realized by controlling the display of the display section 63 by the warning generation section 62 .
- the display unit 63 can display a graph corresponding to FIG. 8 and the like.
- the display unit 63 is composed of a display device such as a liquid crystal display. The operator monitors whether or not the logarithmic likelihood of the series of representative evaluation values deviates from the normal trend. Operators can utilize this information to properly plan future maintenance.
- the display unit 63 can switch the axes to be displayed and output an alarm in the form of a message, for example, according to a signal from the alarm generation unit 62 .
- the current value time-series data acquisition unit 51 of the robot failure sign detection device 5 obtains the current value time-series data for each of the multiple robot motions reproduced in one day. (behavior time-series data acquisition step).
- the evaluation value calculation unit 52 calculates evaluation values from each of the current value time-series data acquired by the current value time-series data acquisition unit 51 using a function such as the root mean square (evaluation value calculation step).
- the number of evaluation values obtained is equal to the number of current value time-series data.
- the representative evaluation value generation unit 53 generates a representative evaluation value representing a plurality of evaluation values obtained in one day (representative evaluation value generation step).
- the representative evaluation value can be the median value of a plurality of evaluation values obtained within one day.
- the series processing unit 54 When the 30 representative evaluation values are obtained, the series processing unit 54 generates a series by arranging the representative evaluation values from the 1st day to the 30th day in chronological order (series processing step). The series processing unit 54 outputs the generated series of representative evaluation values to the determination unit 55 .
- this series may be referred to as an initial series.
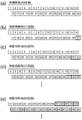
- An initial sequence is shown in FIG. 6(a). In FIG. 6, one square represents one representative evaluation value. The numbers in the squares indicate on what day the representative evaluation value was obtained.
- the learning unit 57 of the determination unit 55 inputs this initial series to the machine learning model and makes it learn (model creation process).
- a series of representative evaluation values is input to the judging model, and the parameters of the judging model are corrected so that the occurrence probability of the series is increased.
- the parameters of the judgment model are the transition probability A, the output probability B, and the initial probability ⁇ described above.
- This processing corresponds to one time of learning, and learning is repeated multiple times. This iteration of processing corresponds to the training phase of machine learning.
- the number of times of learning can be considered to be, for example, 100 times. However, even before 100 times of learning, if convergence of the parameters of the judgment model can be confirmed, learning can be terminated. After the learning is completed, the parameters of the determination model are stored in the determination model storage unit 59 included in the determination unit 55 .
- the period after the N+1 day is the monitoring period.
- the series processing unit 54 creates a series of representative evaluation values for which the determination unit 55 evaluates the specificity (series processing step).
- the series processing unit 54 outputs the generated series of representative evaluation values to the determination unit 55 .
- this series may be referred to as a judgment series.
- the determination series corresponds to determination data.
- the determination series generated by the series processing unit 54 changes each time the representative evaluation value generation unit 53 generates a new representative evaluation value, that is, every day.
- the series for judgment includes at least one representative evaluation value after the N+1 day.
- the series processing unit 54 initializes the judgment series with the initial series. This initialization process is performed only for the first time (31st day). Subsequently, the series processing unit 54 adds the obtained latest representative evaluation value to the end of the judgment series. Since this addition results in 31 representative evaluation values constituting the determination series, the series processing unit 54 deletes the oldest representative evaluation value positioned at the head of the series.
- the decision series on day 31 is shown in FIG. 6(b).
- This update process is performed in the same way for the 32nd day and beyond.
- the series processing unit 54 deletes the oldest representative evaluation value from the previous judgment series, moves the second and subsequent representative evaluation values to the head of the series by one, and adds the latest representative evaluation value to the end of the series.
- a series of representative evaluation values for each day is created.
- the series for determination on the 32nd day is shown in FIG. 6(c)
- the series for judgment on the 33rd day is shown in FIG. 6(d).
- the representative evaluation values of the determination series are replaced one by one for each update process.
- the probability output unit 58 inputs the determination sequence generated by the sequence processing unit 54 to the determination model stored in the determination model storage unit 59, and obtains the probability that the sequence appears. This process corresponds to the evaluation phase of machine learning.
- the probability output unit 58 outputs the obtained probability to the conversion unit 61 .
- the conversion unit 61 converts the probabilities output from the probability output unit 58 into logarithms to obtain logarithmic likelihoods.
- a logarithmic transformation facilitates the handling of numerical values.
- the alarm generation unit 62 determines whether or not there is a sign of failure by checking whether the obtained logarithmic likelihood is within a predetermined range (failure sign determination step). Specifically, the alarm generator 62 compares the logarithmic likelihood with a predetermined threshold. When the logarithmic likelihood falls below the predetermined threshold value, the alarm generation unit 62 issues an alarm by, for example, displaying on the display unit 63 that a failure sign has been detected (alarm generation step).
- the graph in FIG. 7 shows the transition from the start of robot operation with respect to the root mean square (sometimes called I2) of the current value of a certain servomotor.
- the horizontal axis is time, and the vertical axis is the root mean square.
- the thick line in FIG. 7 indicates the value obtained by calculating the average of the initial 30 days and multiplying the obtained value by 1.1. If this thick line is used as an abnormality determination threshold, there is only one point that is determined to be abnormal.
- the graph in FIG. 8 shows the result of evaluating the above root mean square using a hidden Markov model.
- the horizontal axis is time, and the vertical axis is logarithmic likelihood.
- the Ergodic hidden Markov model with two states shown in FIG. 5 is used.
- the robot failure sign detection device 5 of the present embodiment includes the current value time-series data acquisition unit 51, the evaluation value calculation unit 52, the representative evaluation value generation unit 53, the series processing unit 54, and a determination unit 55 .
- the current value time-series data acquisition unit 51 performs processing for acquiring current value time-series data of the drive current of the joints of the robot 1 from the robot motion for each data collection unit period.
- the evaluation value calculator 52 calculates an evaluation value for the current value time-series data acquired by the current value time-series data acquisition unit 51 .
- the representative evaluation value generator 53 generates a representative evaluation value representing the evaluation values from the evaluation values obtained by the evaluation value calculator 52 for each data collection unit period.
- the series processing unit 54 generates a series of representative evaluation values.
- the determination unit 55 creates a determination model based on the initial sequence, which is the sequence generated by the sequence processing unit 54, at the initial stage of operation of the robot 1.
- the determination unit 55 inputs the determination series including the representative evaluation value based on the robot motion after the initial operation to the created determination model, and acquires the specificity of the determination series. do.
- the determination unit 55 inputs a determination series composed of a plurality of representative evaluation values to the determination model as determination data for each data collection unit period, Get the specificity based on the output of the decision model.
- the series processing unit 54 initializes the judgment series with the initial series, and then updates the judgment series each time a representative evaluation value is generated.
- the update process includes a process of adding the representative evaluation value of the data collection unit period to the determination series before update.
- the determination model is a hidden Markov model that has learned an initial sequence.
- the hidden Markov model is an Ergodic hidden Markov model.
- the Ergodic Hidden Markov Model has two states.
- the hidden Markov model can be a Left-to-Right hidden Markov model learned from an initial series.
- the initial series and the judging series are configured as a series in which N representative evaluation values are arranged in chronological order.
- the root mean square is calculated as an evaluation value.
- the maximum value, price range, or frequency analysis integrated value may be calculated as the evaluation value.
- the evaluation value calculation unit 52 performs frequency analysis on each of the behavior time-series data acquired by the current value time-series data acquisition unit 51 to obtain a frequency spectrum. , a plurality of partial sums of frequency spectra are obtained as representative evaluation values for a plurality of predetermined frequency bands.
- the representative evaluation value generator 53 generates a plurality of representative evaluation values for each data collection unit period.
- the judging model is a model in which a multi-dimensional series can be input as an initial series.
- the data collection unit period is determined to be an integral multiple of the environmental temperature change cycle, for example, an integral multiple of one day.
- the data collection unit period is determined to be an integral multiple of the work cycle or the operation cycle of the robot 1 .
- the robot failure sign detection device 5 of this embodiment includes a display unit 63 that displays the specificity output by the determination unit 55 .
- the determining unit 55 outputs the specificity in the form of logarithmic transformation.
- the robot failure sign detection device 5 of this embodiment includes an alarm generation unit 62 .
- the alarm issuing unit 62 issues an alarm indicating a sign of failure when the specificity output by the determination unit 55 is out of a predetermined range.
- a model based on a normal distribution is used as the judgment model instead of the hidden Markov model.
- FIG. 9 is a block diagram of this embodiment.
- the determination unit 55 of this embodiment includes a determination model creation unit 67 instead of the learning unit 57 of the first embodiment. Other parts are substantially the same as in the first embodiment.
- the determination model used in this embodiment will be described below. Consider a case where an initial sequence C 1(1) , C 1 (2) , .
- the judgment model creating unit 67 calculates the average ⁇ and the standard deviation ⁇ of the N representative evaluation values forming the initial series.
- a judging model f is constructed.
- This judgment model f is represented by the following equation (1). However, C 2(1) , C 2(2) , .
- the above formula (1) contains the well-known normal distribution formula. That is, the judgment model f of the present embodiment is obtained by multiplying the normal distribution based on the average ⁇ and the standard deviation ⁇ of the N representative evaluation values of the initial series by the number Q of the representative evaluation values in the judgment series. Equivalent to.
- a model can be obtained by obtaining the mean ⁇ and standard deviation ⁇ of the initial series.
- the average ⁇ and standard deviation ⁇ calculated by the judgment model creation unit 67 are stored in the judgment model storage unit 59 as parameters defining the judgment model.
- the sum of normal distributions is used in the determination model f shown in Equation (1), the sum of logarithms or sums of logarithms of normal distributions may be used. Alternatively, the sum of normal distributions may be used. According to the inventor's experiments, when the summation is used (however, logarithmic transformation is not performed), the transition of the output of the judging model f tends to fluctuate more roughly than the summation, but there is no sign of failure. It is quite possible to capture
- the determination model is a normal distribution based on the standard deviation ⁇ and the average value obtained from the N representative evaluation values that make up the initial sequence. , Q times multiplied or summed. Also, logarithmization may be performed on the way or at the final value.
- the judgment model can be created with a small amount of calculation.
- FIG. 10 is a conceptual diagram showing the DTW method.
- the robot failure sign detection device 5 of this embodiment is characterized by the evaluation value calculation performed by the evaluation value calculation unit 52 .
- the evaluation value calculation unit 52 obtains the DTW distance based on the DTW method from the current value time-series data acquired by the current value time-series data acquisition unit 51, and uses this as an evaluation value.
- DTW is an abbreviation for Dynamic Time Warping.
- portions other than the processing performed by the evaluation value calculation unit 52 are substantially the same as those in the above-described first embodiment.
- the DTW method is used to calculate the degree of similarity between two time series data.
- a major feature of the DTW method is that it allows non-linear expansion and contraction of time-series data in the direction of the time axis when calculating the degree of similarity. As a result, the DTW method can obtain a result close to human intuition regarding the degree of similarity of time-series data.
- the evaluation value calculation unit 52 calculates a DTW distance (dissimilarity degree) is output as an evaluation value of the current value time-series data to be processed.
- reference current value time-series data for example, current value time-series data acquired by the current value time-series data acquisition unit 51 when the robot 1 is operated experimentally at the start of use of the robot failure sign detection device 5. is used.
- current value time-series data for comparison the current value time-series data acquired by the current value time-series data acquisition unit 51 after the first day when use of the robot failure sign detection device 5 is started is used.
- Baseline data may be obtained, for example, on day one.
- a plurality (s) of current values included in the reference data are arranged in chronological order along a first axis extending in the horizontal direction.
- a plurality (p) of current values included in the comparison data are arranged in chronological order along the second axis extending in the vertical direction.
- Each cell (l, m) represents correspondence between the l-th current value in the reference data and the m-th current value in the comparison data. However, 1 ⁇ l ⁇ s and 1 ⁇ m ⁇ p.
- Each cell (l, m) is associated with a numerical value representing the difference between the l-th current value in the reference data and the m-th current value in the comparison data.
- the absolute value of the difference between the l-th current value and the m-th current value is stored in association with each cell.
- the evaluation value calculator 52 obtains a warping path from the starting point cell located at the lower left corner of the matrix in FIG. 10 to the ending point cell located at the upper right corner.
- the starting point cell (1, 1) is the current value at the earliest timing (that is, the first) in the time series among the s current values in the reference data, and the p current values in the comparison data, This corresponds to associating the earliest timing (that is, the first) current value in the time series.
- the end point cell (s, p) is the current value at the last timing (that is, the sth) in the time series among the s current values in the reference data, and the current value in the p current values in the comparison data. This corresponds to associating the last timing (that is, the p-th) current value in the series.
- a route starting from the starting point cell and reaching the ending point cell is considered according to the following rules [1] and [2]. [1] You can only move to adjacent cells vertically, horizontally, or diagonally. [2] The reference data cannot be moved back in time, and the comparison data cannot be moved back in time either.
- a series of such cells is called a route or warping path.
- a warping path indicates how s current values in the reference data are associated with p current values in the comparison data. From another point of view, the warping path represents how the two pieces of time-series data are expanded or contracted along the time axis.
- the evaluation value calculation unit 52 calculates the sum of the numerical values representing the differences associated with the passing cells in the possible warping paths (in this embodiment, the absolute value of the difference between the l-th current value and the m-th current value). Find the warping path that minimizes . In the following, this warping pass may be called an optimal warping pass. Also, the total value of the values in each square in this optimal warping path is sometimes called the DTW distance.
- the DTW distance average value By dividing the DTW distance by the number of squares passed through, the DTW distance average value can be obtained.
- the DTW distance average value may be obtained by dividing the DTW distance by the number of elements s or p of any time-series data. Instead of the DTW distance, the DTW distance average value can also be used as the evaluation value.
- the evaluation value calculator 52 of this embodiment obtains the optimum warping path using a DP matching method (dynamic programming).
- DP is an abbreviation for Dynamic Programming. Since the DP matching method is well known, the explanation is omitted.
- the DTW distance or DTW distance average value is calculated by the evaluation value calculation unit 52 for each of the current value time-series data acquired by the current value time-series data acquisition unit 51 .
- the representative evaluation value generated by the representative evaluation value generation unit 53 is, for example, the median value of the DTW distances obtained many times in one day or the DTW distance average value.
- a series of representative evaluation values is generated by the series processing section 54 and input to the determination section 55 as an initial series or a series for determination.
- the graph in FIG. 11 shows the transition of the logarithmic likelihood obtained in this embodiment. As shown in this graph, in this embodiment, as in the first embodiment, a sign of failure clearly begins to appear around December 16th.
- the evaluation value calculation unit 52 calculates the current value time-series data acquired by the current value time-series data acquisition unit 51 using a predetermined reference Either the DTW distance to the current value time-series data or the DTW distance average value is calculated as the evaluation value.
- FIG. 12 is a block diagram schematically showing the electrical configuration of the robot failure sign detection device 5 of the fourth embodiment.
- the robot failure sign detection device 5 of this embodiment corresponds to a modification of the first embodiment shown in FIG.
- the determination unit 55 of this embodiment includes a learning unit 57, a probability output unit 58, a determination model storage unit 59, and a conversion unit 61, as in the first embodiment.
- the determination unit 55 further includes a probability storage unit 68 and a total product value output unit 69 .
- the learning unit 57 of this embodiment causes the hidden Markov model to learn the initial sequence.
- the obtained parameters of the hidden Markov model are stored in the determination model storage unit 59 .
- a series of Q representative evaluation values is sent from the series processing unit 54 to the judgment model of the judgment unit 55. Entered every day.
- only one representative evaluation value obtained on that day is input as determination data from the storage unit 50 to the determination model of the determination unit 55 every day. In this embodiment, this one representative evaluation value corresponds to determination data.
- Hidden Markov Models are often used to evaluate series data.
- the Ergodic Hidden Markov Model trained with the initial series can output a value that can be treated as a probability even when the representative evaluation value is input in the evaluation phase in a single form instead of a series.
- the probability output unit 58 outputs the output result (that is, the probability) of the determination model when one representative evaluation value is input to the determination model.
- the probability output by the probability output unit 58 is stored in the probability storage unit 68 .
- the probability storage unit 68 can store the probabilities output by the judgment model after day N+1 for the most recent U days.
- the learning unit 57 causes the hidden Markov model to learn a series of 30 representative evaluation values shown in FIG. 13(a). Thus, a judgment model is created.
- one representative evaluation value for the 31st day is input to the determination model, and the probability output by the determination model is stored.
- FIG. 13C on the 32nd day, one representative evaluation value for the 32nd day is input to the determination model, and the probability output by the determination model is stored.
- one circle represents one probability output by the judgment model. The number inside the circle indicates what day the probability corresponds to the representative evaluation value. A dashed circle indicates that the probability was previously stored.
- the determination unit 55 performs a process of inputting one representative evaluation value obtained on that day into the determination model and storing the probability output by the determination model every day. As a result, on the 45th day, the probabilities for 15 days are stored in the probability storage unit 68, as shown in FIG. 13(d).
- the total product value output unit 69 multiplies all the probabilities for 15 days from the 31st day to the 45th day stored in the probability storage unit 68 as shown in FIG. 13(d). In this embodiment, the sum value thus obtained corresponds to the specificity.
- the total power value output by the total power value output unit 69 is logarithmically transformed by the transforming unit 61 and output from the determination unit 55 .
- the probability storage unit 68 deletes the oldest 31st day probability and stores the 46th day probability.
- the total multiplication value output unit 69 multiplies all the probabilities for 15 days from the 32nd day to the 46th day stored in the probability storage unit 68 as shown in FIG. 13(e).
- the total power value thus obtained is logarithmically transformed by the transformation unit 61 and output from the determination unit 55 .
- the output from the determination unit 55 substantially starts on the 45th day. According to the configuration of this embodiment, as in the first and second embodiments, signs of failure can be well captured.
- the determination unit 55 outputs the logarithmically transformed total value, but it may output the total sum value, which is the value obtained by adding all the probabilities for the most recent 15 days, as the specificity. In this case, the logarithmic transformation can be omitted.
- the probability storage unit 68 can also be omitted. In this case, the model output values from the 31st day to the 45th day should be calculated at once on the 45th day.
- the determination unit 55 inputs only one representative evaluation value as determination data into the determination model for each data collection unit period. Get the output of the model. The determination unit 55 acquires the specificity based on the sum or multiplication of outputs of the determination model over a plurality of recent data collection unit periods.
- FIG. 14 is a block diagram schematically showing the electrical configuration of the robot failure sign detection device 5 of the fifth embodiment.
- the robot failure sign detection device 5 of this embodiment further includes a normalization unit 71 .
- the normalization unit 71 is used to normalize the representative evaluation value input to the hidden Markov model (determination model).
- normalization is to convert the numerical values contained in a data group so that the minimum value is 0, the maximum value is 1, and the numerical values in between are proportionally distributed between 0 and 1.
- the normalization unit 71 of the present embodiment obtains the minimum and maximum values of, for example, 30 representative evaluation values in the initial operation period, and normalizes each representative evaluation value based on these values.
- the normalized values are stored in the storage unit 50 and used by the sequence processing unit 54 to create an initial sequence and a judgment sequence.
- the data group may be transformed so that it has a normal distribution with a mean of 0 and a variance of 1.
- the current value time-series data is obtained for each axis motor of the robot 1 .
- the average current value of the wrist axis motor is about 3A, while the average current value of the main axis motor is about 20A.
- the magnitude of the current value naturally affects the representative evaluation value.
- the representative evaluation values may differ greatly among the axes, but it is complicated to determine the thresholds, which are the conditions for issuing an alarm, for each axis.
- the payload, speed, etc. differ, and the current value varies accordingly.
- the representative evaluation values input to the judgment model are normalized.
- FIG. 15 is a block diagram schematically showing the electrical configuration of the robot failure sign detection device 5 of the sixth embodiment.
- the robot failure sign detection device 5 of this embodiment includes two evaluation value calculation units 52, two representative evaluation value generation units 53, and two normalization units 71.
- FIG. Otherwise, this embodiment is substantially the same as the first embodiment described above.
- the two evaluation value calculation units 52 use different functions to calculate the evaluation value of the current value time series data. For example, one evaluation value calculator 52 may calculate the root mean square, and the remaining evaluation value calculators 52 may calculate the maximum value.
- the Hidden Markov Model used in the determination unit 55 is configured to calculate the probability by inputting a series of two-dimensional vectors consisting of two types of evaluation values. As a result, a sign of failure can be detected by considering multiple evaluation values in combination.
- a representative evaluation value representing each evaluation value is normalized by the normalization unit 71 . This makes it possible to equalize the influence of each of the plurality of evaluation values.
- Each representative evaluation value after normalization may be multiplied by a scaling factor determined for weighting. As a result, for example, the root mean square value can be emphasized more than the maximum value to determine the sign of failure.
- the normalization unit 71 can also be omitted.
- FIG. 15 shows a case where two types of evaluation values are calculated for current value time-series data.
- the robot failure sign detection device 5 can also be configured to acquire three or more types of evaluation values.
- the Hidden Markov Model is input with a series of vectors of three or more dimensions.
- the model f that is, formula (1)
- the model f is a one-dimensional model, but in order to deal with multiple dimensions, a plurality of models f, that is, formula (1), are prepared for each evaluation value. By multiplying or adding together, it is possible to correspond to multi-dimensional inputs in the same way as the Hidden Markov Model.
- the evaluation value calculation unit 52 obtains the current value time-series data acquired by the current value time-series data acquisition unit 51 using different methods. to calculate multiple types of evaluation values.
- the representative evaluation value generation unit 53 generates a plurality of types of representative evaluation values for each data collection unit period.
- the judging model is a model capable of inputting a series of multiple dimensions.
- the evaluation value calculation unit 52 calculates the root mean square and maximum value of the current value time series data.
- the root mean square and maximum value any one of the price range, frequency analysis integrated value, DTW distance, and DTW distance average value may be calculated.
- the evaluation value calculation unit 52 calculates the root mean square and maximum value of the current value time series data.
- two frequency analysis partial integration values may be calculated. It can also be configured to acquire three or more types of evaluation values.
- the Hidden Markov Model is input with a series of vectors of three or more dimensions. Also, as shown in FIG. 18, five partial integrated values may be calculated.
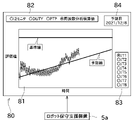
- FIG. 16 is a display example of a tendency management screen displayed on the display 80.
- FIG. 17 is a graph showing changes in prediction lines when reference days are changed.
- a graph display portion 81, an evaluation value selection portion 82, a diagnostic point selection portion 83, and a predicted date display portion 84 are displayed on the trend management screen of FIG.
- the horizontal axis of the graph displayed on the graph display unit 81 is time, and the vertical axis is the evaluation value.
- the method for obtaining the evaluation value is the same as in the above embodiment.
- the current value time-series data for obtaining the evaluation value may be acquired while the robot 1 is performing actual work such as painting, but You can get to A diagnostic operation is an operation performed for the purpose of diagnosing the state of the robot 1 . Note that the reference line and the prediction line will be described later.
- the evaluation value selection section 82 is a box for selecting the evaluation value of the graph displayed in the graph display section 81.
- the evaluation value selection section 82 displays the I2 monitor, DUTY, PTP, and frequency analysis integrated value, and the operator selects any one of them.
- I2 is the root mean square of the current value. Root mean square is sometimes referred to as root mean square or RMS. The root mean square of the current value represents the net effect of the AC component. Therefore, I2 is a value that suppresses fine whisker components. Therefore, it is possible to stably detect an increase in reduction gear loss, that is, a decrease in efficiency, a decrease in torque constant due to demagnetization of the motor, and the like.
- DUTY is the ratio of the motor stall current and I2.
- PTP is an abbreviation for Peak to Peak, and indicates the "price range" described above. That is, the PTP is a value obtained by subtracting the current value of the low peak from the current value of the high peak of the current waveform. PTP is often used because it is easy to obtain and can accurately estimate the state.
- the frequency analysis integrated value is the value as described above. In the graphs of FIGS. 16 and 17, the frequency analysis integrated value is selected and displayed as the evaluation value.
- the diagnosis point selection section 83 is a box for selecting a movable axis to be diagnosed among the movable axes of the robot 1 .
- a plurality of movable axes of the robot 1 are displayed in the diagnosis location selection portion 83 .
- the predicted failure date of the robot 1 is displayed in the predicted date display section 84.
- the failure prediction date is obtained based on the baseline and prediction lines below.
- the reference line indicates the threshold of the evaluation value.
- the threshold is set to, for example, an effective value at the beginning of operation of the robot 1 or a value that is 120% of the initial value after the robot 1 has been preliminarily run.
- the value of 120% of the initial value after running-in is an example, and values other than 120% may be used.
- the threshold may be empirically determined and registered. Also, the threshold can be changed. Moreover, although any initial value may be set from one data, a value obtained by averaging a plurality of data may be set as a threshold value.
- the prediction line is obtained by applying the method of least squares to the evaluation values obtained in the past.
- the failure prediction date is the time when the prediction line intersects the reference line. The operator can intuitively grasp the state of the robot 1 by looking at the prediction line. The operator can grasp the specific date and time regarding the failure prediction of the robot 1 by looking at the failure prediction date.
- a warning may be displayed on the display 80 when the number of days until the failure prediction date is closer than a preset number of days (for example, 30 days). Further, in this example, the prediction line is displayed for the selected evaluation value and movable axis, but the failure prediction date is also obtained for the combination of the evaluation value and movable axis that are not selected, and if the conditions are satisfied, the display 80 may display a warning.
- a preset number of days for example, 30 days.
- one end of the horizontal axis of the graph display portion 81 is the drawing start date
- the other end of the horizontal axis is the drawing end date.
- the period from the drawing start date to the drawing end date corresponds to the display period of the evaluation value, the prediction line, and the like.
- the drawing start date and the drawing end date can be changed. For example, if the drawing start date is the first number of days before the current date and the drawing end date is the number two days after the current date, these first and second days can be changed independently. . This allows the operator to grasp the evaluation value within the desired range.
- the reference number of days can also be changed.
- the reference number of days is the number of days that defines the range of evaluation values used to calculate the prediction line. For example, if the reference number of days is 10 days, the prediction line is obtained based on the evaluation values acquired from 10 days ago to the present.
- the number of reference days can be changed independently of the first number of days and the second number of days described above.
- FIG. 19 shows a trend management screen displayed in an example corresponding to partial integrated values. Note that in FIG. 19, explanations of parts having the same functions as in FIG. 16 may be omitted.
- the I2 monitor, DUTY, PTP, and partial integration value are displayed in the evaluation value selection portion 82A of FIG.
- a pull-down menu for selecting a frequency band is displayed next to the partial integration value.
- the frequency bands that can be selected using the evaluation value selection section 82A are 0-10, 10-20, 20-30, 30-40, 40-50 and ALL.
- ALL is the sum of all partial integrated values, and results in the same display as the frequency analysis integrated value.
- the display method of FIG. 19 is an example, and can be changed. For example, the frequency analysis integrated value may be added to the evaluation value selection unit 82A, and ALL may be omitted from the menu for selecting the frequency band.
- the reference line indicates the threshold of the evaluation value.
- the threshold may be changed according to the frequency band.
- the threshold when the frequency band is ALL or 0-10 is 120% of the initial value
- the threshold when the frequency band is 20-30, 30-40, 40-50 is 200% of the initial value, etc. Also good.
- the prediction line is obtained by applying the method of least squares to the evaluation values obtained in the past for the reference period.
- the failure prediction date is calculated for any combination including the frequency band in addition to the evaluation value and movable axis.
- the predicted date display portion 84A displays the comprehensive predicted date in addition to the above-described predicted date.
- the comprehensive prediction date may be the earliest combination of a plurality of prediction dates calculated based on a plurality of partial integrated values, or may be the earliest including other types of evaluation values and movable axes.
- the screen of the combination of evaluation value, frequency band and movable axis corresponding to the date described in the general forecast date will be displayed. It may be switched automatically. In this case, by adding a display such as "switch to the condition where the warning was displayed", the operator can easily understand the reason why the screen has changed.
- the robot maintenance support device 5a performs the process of acquiring the current value time-series data of the driving current for each movable axis of the robot 1 from the robot operation for each data collection unit period.
- the robot maintenance support device 5a performs frequency analysis on each of the current time-series data to obtain a frequency spectrum, and obtains a partial integrated value that is a partial sum of the frequency spectrum for a plurality of predetermined frequency bands. .
- the robot maintenance support device 5a estimates the future change tendency of each movable axis based on a plurality of partial integrated values within a preset reference period.
- the robot maintenance support device 5a estimates the predicted life of each movable axis based on the predicted time until the partial integrated value reaches a predetermined threshold value.
- the robot maintenance support device 5a can also issue a warning based on the time (days) until the predicted service life.
- the warning function is not an essential component and can be omitted.
- the number of representative evaluation values may differ between the initial series and the judging series.
- the number of representative evaluation values in the initial series is 30, the number of representative evaluation values in the judgment series can be 50.
- the latest representative evaluation value is added in the updating process of the determination series performed by the series processing unit 54 every day.
- the oldest representative evaluation value is deleted as the latest representative evaluation value is added.
- Input of the decision series into the decision model can begin on day 50. If it is acceptable for the decision series to be shorter than usual, the decision series can be entered into the decision model starting at day 31.
- the judgment model based on the normal distribution of the second embodiment can also be combined with the fifth and sixth embodiments.
- the DTW method of the third embodiment may be combined with the fourth, fifth and sixth embodiments.
- the logarithmic likelihood graph displayed on the display unit 63 may be displayed vertically inverted. For example, by multiplying the logarithmic likelihood output by the transforming unit 61 by -1 and outputting the sign-inverted value to the display unit 63, vertical inversion can be substantially realized. Since this value increases as the similarity between the two series decreases, it is intuitively easy to understand as a value representing the degree of abnormality.
- the conversion unit 61 can be omitted. That is, the probability output by the determination unit 55 can be compared with the threshold or displayed on the display unit 63 without being logarithmically transformed.
- the robot failure sign detection device 5 can also be realized by the same hardware as the controller 90.
- a processor is considered a processing circuit or circuit because it includes transistors and other circuits.
- a circuit, unit, or means is hardware that performs or is programmed to perform the recited functions.
- the hardware may be the hardware disclosed herein, or other known hardware programmed or configured to perform the functions recited.
- a circuit, means or unit is a combination of hardware and software, where the hardware is a processor which is considered a type of circuit, the software being used to configure the hardware and/or the processor.
Landscapes
- Engineering & Computer Science (AREA)
- Physics & Mathematics (AREA)
- General Physics & Mathematics (AREA)
- Robotics (AREA)
- Mechanical Engineering (AREA)
- Automation & Control Theory (AREA)
- Acoustics & Sound (AREA)
- Manipulator (AREA)
- Testing Of Devices, Machine Parts, Or Other Structures Thereof (AREA)
- Numerical Control (AREA)
- Management, Administration, Business Operations System, And Electronic Commerce (AREA)
Priority Applications (7)
| Application Number | Priority Date | Filing Date | Title |
|---|---|---|---|
| CN202610009698.6A CN121733628A (zh) | 2021-03-29 | 2022-03-22 | 机器人维护支援装置以及机器人维护支援方法 |
| US18/552,955 US20240192674A1 (en) | 2021-03-29 | 2022-03-22 | Robot failure symptom detection apparatus and robot failure symptom detection method |
| KR1020237036366A KR20230159880A (ko) | 2021-03-29 | 2022-03-22 | 로봇 고장 전조 검출 장치 및 로봇 고장 전조 검출 방법 |
| EP22780287.3A EP4316755A4 (en) | 2021-03-29 | 2022-03-22 | ROBOT MALFUNCTION SIGN DETECTION DEVICE AND ROBOT MALFUNCTION SIGN DETECTION METHOD |
| CN202280026060.3A CN117222878A (zh) | 2021-03-29 | 2022-03-22 | 机器人故障预兆检测装置以及机器人故障预兆检测方法 |
| JP2023511002A JP7811936B2 (ja) | 2021-03-29 | 2022-03-22 | ロボット故障予兆検出装置及びロボット故障予兆検出方法 |
| JP2023120550A JP7500839B2 (ja) | 2021-03-29 | 2023-07-25 | ロボット保守支援装置、ロボット保守支援方法、及びロボット保守支援プログラム |
Applications Claiming Priority (2)
| Application Number | Priority Date | Filing Date | Title |
|---|---|---|---|
| JP2021-054667 | 2021-03-29 | ||
| JP2021054667 | 2021-03-29 |
Publications (1)
| Publication Number | Publication Date |
|---|---|
| WO2022210072A1 true WO2022210072A1 (ja) | 2022-10-06 |
Family
ID=83456112
Family Applications (1)
| Application Number | Title | Priority Date | Filing Date |
|---|---|---|---|
| PCT/JP2022/013021 Ceased WO2022210072A1 (ja) | 2021-03-29 | 2022-03-22 | ロボット故障予兆検出装置及びロボット故障予兆検出方法 |
Country Status (6)
| Country | Link |
|---|---|
| US (1) | US20240192674A1 (https=) |
| EP (1) | EP4316755A4 (https=) |
| JP (2) | JP7811936B2 (https=) |
| KR (1) | KR20230159880A (https=) |
| CN (2) | CN121733628A (https=) |
| WO (1) | WO2022210072A1 (https=) |
Cited By (3)
| Publication number | Priority date | Publication date | Assignee | Title |
|---|---|---|---|---|
| CN117894491A (zh) * | 2024-03-15 | 2024-04-16 | 济南宝林信息技术有限公司 | 一种用于评估精神活动的生理监测数据处理方法 |
| JP7637825B1 (ja) | 2024-03-28 | 2025-02-28 | 川崎重工業株式会社 | 状態監視装置、状態監視方法及び状態監視プログラム |
| WO2025203925A1 (ja) * | 2024-03-28 | 2025-10-02 | 川崎重工業株式会社 | 状態監視装置、状態監視方法及び状態監視プログラム |
Families Citing this family (8)
| Publication number | Priority date | Publication date | Assignee | Title |
|---|---|---|---|---|
| CN117713630B (zh) * | 2024-02-06 | 2024-06-07 | 深圳威洛博机器人有限公司 | 一种机器人传动电机速度波动的控制系统 |
| CN118857730B (zh) * | 2024-07-31 | 2026-02-06 | 东风商用车有限公司 | 机器人操作耐久试验监控方法、装置、设备及存储介质 |
| CN118585831B (zh) * | 2024-08-02 | 2024-10-22 | 成都赛力斯科技有限公司 | 电机轴承剩余寿命预测方法、系统及模型训练方法 |
| KR102756498B1 (ko) * | 2024-10-15 | 2025-01-21 | 한화시스템 주식회사 | 이동형 로봇의 상태이상 감지 시스템 및 방법 |
| CN119067640B (zh) * | 2024-11-04 | 2025-01-03 | 杭州优服云科技有限公司 | 数控机床智能运维管理方法及系统 |
| CN119723945B (zh) * | 2024-12-12 | 2025-10-21 | 长沙理工大学 | 基于交通事故要素匹配的车辆预碰撞预警方法与系统 |
| CN121061944B (zh) * | 2025-11-06 | 2026-02-27 | 四川三思德科技有限公司 | 一种机器人紧急自救系统 |
| CN121281061B (zh) * | 2025-12-08 | 2026-03-24 | 重庆大学建筑规划设计研究总院有限公司 | 基于热红外成像的石质文物修复用表层劣化程度评价方法 |
Citations (4)
| Publication number | Priority date | Publication date | Assignee | Title |
|---|---|---|---|---|
| JP2011059790A (ja) * | 2009-09-07 | 2011-03-24 | Hitachi Ltd | 異常検知・診断方法、異常検知・診断システム、及び異常検知・診断プログラム |
| WO2020031225A1 (ja) * | 2018-08-06 | 2020-02-13 | 日産自動車株式会社 | 異常診断装置及び異常診断方法 |
| JP2020102001A (ja) * | 2018-12-21 | 2020-07-02 | ファナック株式会社 | 学習用データ確認支援装置、機械学習装置、故障予知装置 |
| JP2021022290A (ja) * | 2019-07-30 | 2021-02-18 | 双葉電機工業株式会社 | 制御状態監視システムおよびプログラム |
Family Cites Families (16)
| Publication number | Priority date | Publication date | Assignee | Title |
|---|---|---|---|---|
| JP3108798B2 (ja) * | 1994-03-31 | 2000-11-13 | 株式会社椿本チエイン | 負荷監視装置 |
| JPH09311715A (ja) * | 1996-05-22 | 1997-12-02 | Fanuc Ltd | ロボットの異常発生履歴表示方法 |
| JP3295753B2 (ja) | 1997-08-01 | 2002-06-24 | 株式会社椿本チエイン | 負荷監視装置 |
| JP4492573B2 (ja) | 2006-03-27 | 2010-06-30 | トヨタ自動車株式会社 | ロボットとロボットの動作制御方法 |
| EP1955830B1 (en) * | 2007-02-06 | 2014-04-09 | Abb Research Ltd. | A method and a control system for monitoring the condition of an industrial robot |
| WO2011036809A1 (ja) * | 2009-09-28 | 2011-03-31 | 株式会社 東芝 | 異常判定システムおよびその方法 |
| JP5269262B1 (ja) | 2012-08-03 | 2013-08-21 | 三菱電機株式会社 | 数値制御装置 |
| JP6418782B2 (ja) * | 2014-05-16 | 2018-11-07 | キヤノン株式会社 | ロボットシステムの制御方法、プログラム、記録媒体、ロボットシステム、及び診断装置 |
| JP6664893B2 (ja) * | 2014-12-19 | 2020-03-13 | 川崎重工業株式会社 | ロボット保守支援装置および方法 |
| WO2019103091A1 (ja) * | 2017-11-22 | 2019-05-31 | 川崎重工業株式会社 | 機械装置の劣化診断装置、劣化診断装置において実行される機械装置の劣化診断方法、及び、機械装置の劣化診断方法 |
| JP6909410B2 (ja) * | 2018-05-08 | 2021-07-28 | オムロン株式会社 | ロボット制御装置、保守管理方法、及び保守管理プログラム |
| CN109357353A (zh) * | 2018-09-14 | 2019-02-19 | 珠海格力电器股份有限公司 | 电器安全状态的判断方法、系统和空调 |
| CN113167680A (zh) * | 2018-12-24 | 2021-07-23 | Abb瑞士股份有限公司 | 用于诊断机器人的方法和设备 |
| JP7110991B2 (ja) * | 2019-01-07 | 2022-08-02 | トヨタ自動車株式会社 | 設備点検システム、設備点検方法及びプログラム |
| JP2021160031A (ja) * | 2020-03-31 | 2021-10-11 | セイコーエプソン株式会社 | 故障予測方法および故障予測装置 |
| JP7577476B2 (ja) * | 2020-07-31 | 2024-11-05 | 川崎重工業株式会社 | ロボットシステムおよび回生抵抗の寿命予測方法 |
-
2022
- 2022-03-22 JP JP2023511002A patent/JP7811936B2/ja active Active
- 2022-03-22 KR KR1020237036366A patent/KR20230159880A/ko not_active Ceased
- 2022-03-22 US US18/552,955 patent/US20240192674A1/en active Pending
- 2022-03-22 CN CN202610009698.6A patent/CN121733628A/zh active Pending
- 2022-03-22 WO PCT/JP2022/013021 patent/WO2022210072A1/ja not_active Ceased
- 2022-03-22 EP EP22780287.3A patent/EP4316755A4/en active Pending
- 2022-03-22 CN CN202280026060.3A patent/CN117222878A/zh active Pending
-
2023
- 2023-07-25 JP JP2023120550A patent/JP7500839B2/ja active Active
Patent Citations (4)
| Publication number | Priority date | Publication date | Assignee | Title |
|---|---|---|---|---|
| JP2011059790A (ja) * | 2009-09-07 | 2011-03-24 | Hitachi Ltd | 異常検知・診断方法、異常検知・診断システム、及び異常検知・診断プログラム |
| WO2020031225A1 (ja) * | 2018-08-06 | 2020-02-13 | 日産自動車株式会社 | 異常診断装置及び異常診断方法 |
| JP2020102001A (ja) * | 2018-12-21 | 2020-07-02 | ファナック株式会社 | 学習用データ確認支援装置、機械学習装置、故障予知装置 |
| JP2021022290A (ja) * | 2019-07-30 | 2021-02-18 | 双葉電機工業株式会社 | 制御状態監視システムおよびプログラム |
Non-Patent Citations (1)
| Title |
|---|
| See also references of EP4316755A4 * |
Cited By (6)
| Publication number | Priority date | Publication date | Assignee | Title |
|---|---|---|---|---|
| CN117894491A (zh) * | 2024-03-15 | 2024-04-16 | 济南宝林信息技术有限公司 | 一种用于评估精神活动的生理监测数据处理方法 |
| CN117894491B (zh) * | 2024-03-15 | 2024-06-11 | 济南宝林信息技术有限公司 | 一种用于评估精神活动的生理监测数据处理方法 |
| JP7637825B1 (ja) | 2024-03-28 | 2025-02-28 | 川崎重工業株式会社 | 状態監視装置、状態監視方法及び状態監視プログラム |
| JP7637836B1 (ja) * | 2024-03-28 | 2025-02-28 | 川崎重工業株式会社 | 状態監視装置、状態監視方法及び状態監視プログラム |
| WO2025203925A1 (ja) * | 2024-03-28 | 2025-10-02 | 川崎重工業株式会社 | 状態監視装置、状態監視方法及び状態監視プログラム |
| JP2025155804A (ja) * | 2024-03-28 | 2025-10-14 | 川崎重工業株式会社 | 状態監視装置、状態監視方法及び状態監視プログラム |
Also Published As
| Publication number | Publication date |
|---|---|
| EP4316755A1 (en) | 2024-02-07 |
| EP4316755A4 (en) | 2025-04-09 |
| CN121733628A (zh) | 2026-03-27 |
| KR20230159880A (ko) | 2023-11-22 |
| JP7811936B2 (ja) | 2026-02-06 |
| JPWO2022210072A1 (https=) | 2022-10-06 |
| JP7500839B2 (ja) | 2024-06-17 |
| US20240192674A1 (en) | 2024-06-13 |
| JP2024002993A (ja) | 2024-01-11 |
| CN117222878A (zh) | 2023-12-12 |
Similar Documents
| Publication | Publication Date | Title |
|---|---|---|
| WO2022210072A1 (ja) | ロボット故障予兆検出装置及びロボット故障予兆検出方法 | |
| Wang et al. | Fault prognostics using dynamic wavelet neural networks | |
| US11527984B2 (en) | Abnormality determination system, motor control apparatus, and abnormality determination apparatus | |
| JP7466652B2 (ja) | 状態監視装置、状態異常判別方法及び状態異常判別プログラム | |
| JP2022125288A (ja) | 異常予知装置、異常予知システム、異常予知方法及び異常予知プログラム | |
| Raouf et al. | Prognostic health management of the robotic strain wave gear reducer based on variable speed of operation: A data-driven via deep learning approach | |
| US11144032B2 (en) | Time to failure analysis of robotic arm cabling | |
| US20170031329A1 (en) | Machine learning method and machine learning device for learning fault conditions, and fault prediction device and fault prediction system including the machine learning device | |
| JP2021160031A (ja) | 故障予測方法および故障予測装置 | |
| JP2008186472A (ja) | 予測的状態監視のための診断システムおよび方法 | |
| WO2022130611A1 (ja) | 情報処理装置及び情報処理方法 | |
| WO2022072358A1 (en) | Assembly monitoring system | |
| Sahu et al. | Real-time fault diagnosis of HEMM using Bayesian Network: A case study on drag system of dragline | |
| JP7850175B2 (ja) | 状態監視装置及び状態監視方法 | |
| JP2005216213A (ja) | 故障診断システム及び故障診断方法 | |
| JP7516013B2 (ja) | 処理装置、生産システム、ロボット装置、物品の製造方法、処理方法、プログラム及び記録媒体 | |
| JP7407784B2 (ja) | 生産システムの情報収集装置、情報収集方法及びプログラム | |
| Morettini | Machine learning in predictive maintenance of industrial robots | |
| CN110774318B (zh) | 处理装置及处理部分的处理方法 | |
| Li et al. | Self-data-driven modeling for fault diagnosis of RV reducers in industrial robots | |
| WO2022123876A1 (ja) | 異常判定モデル生成装置、異常判定装置、異常判定モデル生成方法および異常判定方法 | |
| Di Maio et al. | Naive Bayesian classifier for on-line remaining useful life prediction of degrading bearings | |
| Shivam et al. | The Performance Prediction of HD Gear Reducer in Industrial Robots using Machine Learning Approach | |
| Supeni et al. | NARMAX identification of DC motor model using repulsive particle swarm optimization | |
| Wang et al. | Predictive Maintenance of Industrial Robots Based on Digital Twin: A Case Study of an Automated Production Line |
Legal Events
| Date | Code | Title | Description |
|---|---|---|---|
| 121 | Ep: the epo has been informed by wipo that ep was designated in this application |
Ref document number: 22780287 Country of ref document: EP Kind code of ref document: A1 |
|
| ENP | Entry into the national phase |
Ref document number: 2023511002 Country of ref document: JP Kind code of ref document: A |
|
| WWE | Wipo information: entry into national phase |
Ref document number: 202280026060.3 Country of ref document: CN Ref document number: 18552955 Country of ref document: US |
|
| ENP | Entry into the national phase |
Ref document number: 20237036366 Country of ref document: KR Kind code of ref document: A |
|
| WWE | Wipo information: entry into national phase |
Ref document number: 1020237036366 Country of ref document: KR |
|
| WWE | Wipo information: entry into national phase |
Ref document number: 2022780287 Country of ref document: EP |
|
| NENP | Non-entry into the national phase |
Ref country code: DE |
|
| ENP | Entry into the national phase |
Ref document number: 2022780287 Country of ref document: EP Effective date: 20231030 |
|
| WWR | Wipo information: refused in national office |
Ref document number: 1020237036366 Country of ref document: KR |