WO2021132603A1 - 情報処理装置、情報処理方法およびプログラム - Google Patents
情報処理装置、情報処理方法およびプログラム Download PDFInfo
- Publication number
- WO2021132603A1 WO2021132603A1 PCT/JP2020/048847 JP2020048847W WO2021132603A1 WO 2021132603 A1 WO2021132603 A1 WO 2021132603A1 JP 2020048847 W JP2020048847 W JP 2020048847W WO 2021132603 A1 WO2021132603 A1 WO 2021132603A1
- Authority
- WO
- WIPO (PCT)
- Prior art keywords
- screen
- displayed
- data
- cash
- sales
- Prior art date
- Legal status (The legal status is an assumption and is not a legal conclusion. Google has not performed a legal analysis and makes no representation as to the accuracy of the status listed.)
- Ceased
Links
Images














Classifications
-
- G—PHYSICS
- G06—COMPUTING OR CALCULATING; COUNTING
- G06Q—INFORMATION AND COMMUNICATION TECHNOLOGY [ICT] SPECIALLY ADAPTED FOR ADMINISTRATIVE, COMMERCIAL, FINANCIAL, MANAGERIAL OR SUPERVISORY PURPOSES; SYSTEMS OR METHODS SPECIALLY ADAPTED FOR ADMINISTRATIVE, COMMERCIAL, FINANCIAL, MANAGERIAL OR SUPERVISORY PURPOSES, NOT OTHERWISE PROVIDED FOR
- G06Q10/00—Administration; Management
-
- G—PHYSICS
- G06—COMPUTING OR CALCULATING; COUNTING
- G06Q—INFORMATION AND COMMUNICATION TECHNOLOGY [ICT] SPECIALLY ADAPTED FOR ADMINISTRATIVE, COMMERCIAL, FINANCIAL, MANAGERIAL OR SUPERVISORY PURPOSES; SYSTEMS OR METHODS SPECIALLY ADAPTED FOR ADMINISTRATIVE, COMMERCIAL, FINANCIAL, MANAGERIAL OR SUPERVISORY PURPOSES, NOT OTHERWISE PROVIDED FOR
- G06Q40/00—Finance; Insurance; Tax strategies; Processing of corporate or income taxes
-
- Y—GENERAL TAGGING OF NEW TECHNOLOGICAL DEVELOPMENTS; GENERAL TAGGING OF CROSS-SECTIONAL TECHNOLOGIES SPANNING OVER SEVERAL SECTIONS OF THE IPC; TECHNICAL SUBJECTS COVERED BY FORMER USPC CROSS-REFERENCE ART COLLECTIONS [XRACs] AND DIGESTS
- Y02—TECHNOLOGIES OR APPLICATIONS FOR MITIGATION OR ADAPTATION AGAINST CLIMATE CHANGE
- Y02P—CLIMATE CHANGE MITIGATION TECHNOLOGIES IN THE PRODUCTION OR PROCESSING OF GOODS
- Y02P90/00—Enabling technologies with a potential contribution to greenhouse gas [GHG] emissions mitigation
- Y02P90/30—Computing systems specially adapted for manufacturing
Definitions
- the present invention relates to an information processing device.
- the conventional table calculation device has a function and data type for acquiring accounting data such as accounting software data, tax calculation software data, bank data, card company data, mail order company data, time card data, cash register data, and company-created data.
- accounting data such as accounting software data, tax calculation software data, bank data, card company data, mail order company data, time card data, cash register data, and company-created data.
- a function for determining what kind of graph (circle graph, line graph, bar graph, etc.) is suitable and graphing it is implemented.
- the present invention has been made in view of such a situation, and not only displays monthly calculation tables, accounting-related charts, business management materials, etc. in an easy-to-read manner, but also concretely describes the strategy formulation process and tactics that are the basis of management.
- the process of formulating a business plan that is becoming more and more popular we will organize the thoughts about a series of flows for strategic management development and add story to the causal relationship between numerical values and results so that the flow of thoughts can be easily understood.
- the purpose is to make it possible to utilize it for strategic management development by devising the display of graphs and charts.
- the information processing device of one aspect of the present invention is A presentation means for presenting the numerical group in an order based on the causal relationship of each of the plurality of numerical groups. To be equipped.
- the information processing method and program corresponding to the information processing apparatus according to one aspect of the present invention are also provided as the information processing method and program according to one aspect of the present invention.
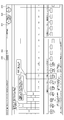
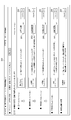
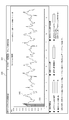
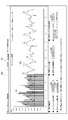
- FIG. 1 shows the management strategy development support system of one Embodiment including the server which concerns on the information processing apparatus of this invention. It is a figure which shows the hardware configuration of the server of the management strategy development support system of FIG. It is a functional block diagram which shows an example of the functional configuration of the server of the management strategy development support system of FIG. It is a flowchart which shows the operation of the server of the management strategy development support system of FIG. It is a figure which shows the accounting firm comment screen. It is a figure which shows the tax amount simulation screen. It is a figure which shows the animation display screen of the annual graph. It is a figure which shows the screen of the expense transition graph of salary allowance.
- the management strategy development support system of this embodiment is intended to create business management materials, etc. that are useful for business and are fully conscious of being utilized for management, and understand what the manager usually thinks. , It is a system that organizes the flow of thought, expresses the causal relationship between numerical values and results by adding story, and makes it possible to create graphs and charts that are easy to see and understand and can be used for management.
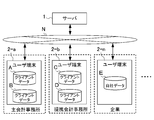
- FIG. 1 is a diagram showing a configuration example of a management strategy development support system including a server, an office terminal, and a corporate terminal according to an embodiment of the present invention.
- FIG. 2 is a block diagram showing a server hardware configuration in the management strategy development support system of FIG.
- FIG. 3 is a functional block diagram showing an example of the functional configuration of the server among the management strategy development support systems of FIGS. 1 and 2.
- the management strategy development support system shown in FIG. 1 is configured such that the server 1 and the user terminals 2-a, 2-b, 2-n, etc. are connected to each other via a network N such as the Internet and communicate with each other. There is. That is, it can be said that the management strategy development support system of this embodiment is a cloud-type information processing system.
- the user terminal 2-a is located in, for example, the main accounting office.
- the user terminal 2-b is arranged in, for example, an affiliated accounting office.
- the user terminal 2-n is arranged in, for example, a company.
- various data including accounting data, financial data, labor data, etc. of each company in charge of each accounting office are client data. It is stored as A, B, C, D.
- Various data E (hereinafter referred to as "company data E") including accounting data, financial data, labor data, etc. of the company are stored in the user terminal 2-n of the company.
- the server 1 is provided with the system main body.
- the user terminal 2-a of the main accounting office Log in to the server 1, store the client data A or B held in the user terminal 2-a in the server 1 (system main body), and log out.
- the material generated by the server 1 from the main accounting office log in to the server 1 from the user terminal 2-a and access the material generated based on the client data A or B to view the material. You can browse.
- log in to the server 1 from the user terminal 2-a access the generated material, and perform the output operation (download operation).
- the material generated from the server 1 (system main body) can be output (downloaded).
- This management strategy development support system acquires various numerical values and results related to companies such as companies, adds storylines to the causal relationship between the numerical values and results, and displays the results in sequence according to the flow of thought. It is something to build.
- display form results
- this management strategy development support system stimulates the right brain by displaying easy-to-read graphs and charts in sequence along the story, making it easy to generate new ideas and ideas, and for Japanese companies, especially small and medium-sized enterprises. It can help the next generation of AI and IT. It can revitalize many wasted meeting places and contribute to increasing labor productivity. Furthermore, in this management strategy development support system, most of the data collection, conversion, aggregation, and graphing related to the above process are automated, and the business management material creation work can be greatly streamlined. With this management strategy development support system, it is possible to prepare for the next generation in line with the flow of work style reform and digitization by RPA (Robotic Process Automation: efforts to improve productivity by business automation) promoted by the government. ..
- RPA Robot Process Automation: efforts to improve productivity by business automation
- FIG. 2 is a block diagram showing the hardware configuration of the server in the management strategy development support system of FIG.
- the server 1 includes a CPU (Central Processing Unit) 11, a ROM (Read Only Memory) 12, a RAM (Random Access Memory) 13, a bus 14, an input / output interface 15, an output unit 16, and an input unit 17. , A storage unit 18, a communication unit 19, and a drive 20.
- CPU Central Processing Unit
- ROM Read Only Memory
- RAM Random Access Memory
- the CPU 11 executes various processes according to the program recorded in the ROM 12 or the program loaded from the storage unit 18 into the RAM 13. Data and the like necessary for the CPU 11 to execute various processes are also appropriately stored in the RAM 13.
- the CPU 11, ROM 12 and RAM 13 are connected to each other via the bus 14.
- An input / output interface 15 is also connected to the bus 14.
- An output unit 16, an input unit 17, a storage unit 18, a communication unit 19, and a drive 20 are connected to the input / output interface 15.
- the output unit 16 is composed of a display, a speaker, and the like, and outputs various information as images and sounds.
- the input unit 17 is composed of a keyboard, a mouse, and the like, and inputs various information.
- the storage unit 18 is composed of a hard disk, a DRAM (Dynamic Random Access Memory), or the like, and stores various data.
- the communication unit 19 communicates with another device (user terminal 2 or the like in the example of FIG. 1) via a network N including the Internet.
- a removable media 21 made of a magnetic disk, an optical disk, a magneto-optical disk, a semiconductor memory, or the like is appropriately mounted on the drive 20.
- the program read from the removable media 21 by the drive 20 is installed in the storage unit 18 as needed. Further, the removable media 21 can also store various data stored in the storage unit 18 in the same manner as the storage unit 18.
- the user terminal 2 has basically the same configuration as the hardware configuration of the server 1 shown in FIG.
- FIG. 3 is a functional block diagram showing an example of the functional configuration of the server of FIG.
- a database 30 (hereinafter referred to as “DB30”) is held (stored) in one area of the storage unit 18 of the server 1 shown in FIG.
- the data acquired from the user terminals 2-a, 2-b, ... 2-n in the DB 30 includes, for example, accounting software data (accounting data), tax calculation software data (tax data), and bank system data. (Deposit data), card company card data, mail order company data, labor management software time card data (working hours, etc. data), POS system registration data, company-managed in-house data (company management status) One or more of the data (including financial data, manufacturing data, sales data, work management data, etc.) indicating
- the data acquisition unit 41 In the CPU 11 (see FIG. 2) of the server 1, when the process is executed, the data acquisition unit 41, the key index presentation unit 42, the numerical value group presentation unit 43, the print control unit 44, the notification control unit 45, the communication unit 46, etc. works.
- the data acquisition unit 41 acquires data from the user terminal 2 and stores it in the DB 30 for each user.
- data (numerical value group) related to accounting processing such as accounting data is obtained as business processing data in the company.
- the data acquisition unit 41 acquires a plurality of numerical values including accounting data including sales data of a company such as a retail business, financial data of the company, and the like from the user terminal 2 and stores them in the DB 30.
- the data acquisition unit 41 records accounting data including sales data obtained by selling goods from the user terminal 2 of the company in sales business and data related to the work of employees of the company (for example, working hours are recorded). (Time card data, etc.) is acquired and stored in the DB 30.
- the key index presenting unit 42 displays various screens related to the processing of the key index, reads data from the DB 30 by operating various buttons provided on the screen, and responds to the business based on the read data.
- Present key indicators Specifically, when displaying a key index in a company engaged in sales business, the key index presentation unit 42 displays time card data (working hours) of employees engaged in sales business from DB30 and a cash register that sells goods in sales business. Data (sales) is read out in any unit such as daily, weekly, monthly, etc., and the sales per unit time of one employee is presented as a key index using these data (for example). See the broken line graph 414 and its values on the screen 410 of the hourly sales graph of FIG. 41). That is, the key index presenting unit 42 presents the key index (for example, man-hour sales) according to the sales business to the user terminal 2 based on the sales data of the DB 30 and the time card data of the employee.
- the key index presentation unit 42 includes a key index calculation unit 51 and a display control unit 52.
- the key index calculation unit 51 obtains the sales per unit time of one employee by dividing the sales obtained as a whole business in a predetermined period by the working hours of all the employees in the predetermined period.
- the key index calculation unit 51 obtains the man-hour sales by dividing the sales obtained as a whole business in one day by the working hours of all the employees in one day, and uses it as the value of the key index in that day. , The calculated one month's worth is output.
- the display control unit 52 animates, for example, key indexes such as man-hour sales calculated by the key index calculation unit 51 in the order of time series or the flow of calculation (processing). Specifically, for example, a line graph 414 of the screen 410 of the man-hour sales graph shown in FIG. 41 is displayed.
- the display control unit 52 displays information indicating the sales per unit time of one employee for at least one of the sales obtained as a whole business in a predetermined period and the working hours of all the employees engaged in the business. For example, it is displayed in correspondence with the sales per person.
- the numerical group presentation unit 43 presents numerical groups in an order based on the causal relationship of each of the plurality of numerical groups. Specifically, the numerical group presentation unit 43 displays various screens related to the processing of the numerical group, and by operating various buttons provided on the screen, data is read from the DB 30 and the read data is used as a base. The numerical group obtained in is presented.
- the numerical value group presenting unit 43 includes data (numerical value group) required as data to be displayed on a predetermined screen among data (accounting data) related to accounting processing stored in DB 30 as business processing data in a company. Is read out, calculated as necessary, and output to the display control unit 69, and the display control unit 69 displays the animation in the order of the causal relationship or the period caused by the causal relationship.
- An example of the display form is, for example, a graph, a table, or the like, but the display form is not limited to this.
- the order of the causal relationship is, for example, as shown in screens 120 of FIGS.
- the order of the period due to the causal relationship indicates, for example, June, July, and August if the accounting period of the company is from June to May. It should be noted that these orders are examples, and other than this, display in an order based on a causal relationship can be considered, and therefore, the present invention is not limited to the above example.
- the numerical group presentation unit 43 includes a budget actual calculation unit 61, a past cash calculation unit 62, a current cash calculation unit 63, a business plan generation unit 64, a daily data aggregation unit 65, a tax amount calculation unit 66, a transition calculation unit 67, and a breakdown calculation unit. 68, has a display control unit 69.
- the budget performance calculation unit 61 obtains a numerical group as a result of calculating the difference between the budget and the performance for each predetermined period (monthly, etc.) in the business or the difference between the performance for the two periods (difference between the current period and the previous period, etc.). ..
- One of the monthly financial statement budget actual difference analysis functions is realized by the budget actual calculation unit 61 and the display control unit 69.
- the past cash calculation unit 62 calculates the cash increase / decrease amount for the past predetermined period (1 year) for the full year (1 year) based on the accounting data for the past 2 periods (the previous period and the period before the previous period, etc.). Let it be a numerical group.
- the cache BEFORE function is realized by the past cache calculation unit 62 and the display control unit 69.
- the past cash calculation unit 62 aggregates the balance sheet item balances of the specified period (end of each month, etc.) of the previous period, etc., based on the accounting data of the previous period, etc., to form a numerical group.
- the past cash calculation unit 62 and the display control unit 69 generate a past cash flow balance sheet in the monthly financial statement budget actual difference analysis function.
- the current term cash calculation unit 63 calculates the required cash amount for each account item to achieve the specified current term target cash acquisition amount based on the cash increase / decrease amount for each past account item, and sets it as a numerical group.
- the cache AFTER function is realized by the cache calculation unit 63 and the display control unit 69 in this term.
- This term cash calculation unit 63 calculates the cash increase / decrease amount for the specified period (1 year) for the current term (1 month, etc.) based on the accounting data for 2 terms (current term and the previous term, etc.). Make a group.
- the cash flow statement in the monthly financial statement budget actual difference analysis function is generated by the cash calculation unit 63 and the display control unit 69 for this term.
- the cash calculation unit 63 for this term aggregates the balance sheet item balances for the specified period (end of each month, etc.) of this term based on the accounting data for this term to form a numerical group.
- the cash flow balance sheet in the monthly financial statement budget actual difference analysis function is generated by the cash calculation unit 63 and the display control unit 69 for this term.
- the business plan generation unit 64 divides the predetermined period (1 year) into unit periods (every month) based on the business target amount to be achieved in the predetermined period (1 year) registered by the cash AFTER function. Generate detailed data of the business plan divided into the elapsed period and the unexpired period.
- the business target amount includes, for example, the target sales amount, the target cash amount, and the like of the data of the business plan. Target sales, target cash amount, etc. of the data of the business plan for one year are divided by month, the actual values are aggregated for the elapsed period, and the simulation is repeated for the unexpired period.
- the business plan can be reviewed at any time during the period so that the high amount, target cash amount, etc. can be achieved.
- the business plan generation unit 64 and the display control unit 69 realize the business plan formulation simulation function.
- the daily data aggregation unit 65 aggregates numerical groups such as cash deposit balance, accounts receivable balance, borrowing balance, utility bill generation amount, etc., including factors that fluctuate in a unit period while the company is active, for each unit period. ..
- the daily data aggregation unit 65 and the display control unit 69 generate a cash balance transition table in the monthly financial statement budget actual difference analysis function.
- the tax amount calculation unit 66 displays the summary tax simulation screen 108 (see FIG. 6) on the user terminal 2-n, and executes the summary tax simulation function. Specifically, the tax amount calculation unit 66 reads accounting data such as profit amount and taxable income amount required for tax amount simulation, and tax data from DB30, calculates an annual forecast tax amount, and sets it as a numerical group, and displays control unit 69. Output to.
- the transition calculation unit 67 displays the company-wide annual graph screen 109 (see FIG. 7) on the user terminal 2-n and executes the company-wide annual graph animation display function. Specifically, the transition calculation unit 67 reads out accounting data such as the monthly transition amount of sales and profits in the previous period, the previous period, and the current period necessary for calculating the annual total amount from DB30, and calculates the annual total amount. It is calculated as a numerical group and output to the display control unit 69.
- the transition calculation unit 67 displays the screen 112 (see FIG. 8) of the cost transition graph on the user terminal 2-n and executes the cost transition graph animation display function. Specifically, the transition calculation unit 67 reads the accounting data such as the monthly transition amount of the cost items of the previous term and the current term necessary for the calculation of the cost transition from the DB 30, and calculates the numerical value of the previous term, the numerical value of the current term, and the difference amount. Then, it is converted into a numerical value group and output to the display control unit 69.
- the accounting data such as the monthly transition amount of the cost items of the previous term and the current term necessary for the calculation of the cost transition from the DB 30, and calculates the numerical value of the previous term, the numerical value of the current term, and the difference amount. Then, it is converted into a numerical value group and output to the display control unit 69.
- the transition calculation unit 67 displays the screen 116 (see FIG. 9) of the monthly transition table (SG & A expenses) on the user terminal 2-n, and executes the animation display function of the monthly transition table (SG & A expenses). Specifically, the transition calculation unit 67 reads accounting data such as monthly transitions of SG & A items for the previous term and the current term necessary for calculating monthly SG & A expenses from DB30, and calculates monthly SG & A expenses. Is converted into a numerical group and output to the display control unit 69.
- the breakdown calculation unit 68 displays the STRAC table screen 120 (see FIG. 11) on the user terminal 2-n and executes the STRAC table animation display function. Specifically, the breakdown calculation unit 68 reads accounting data such as revenue, variable costs, fixed costs, etc. for the current term necessary for creating the STRAC table from DB30, creates the data of the STRAC table to form a numerical group, and displays the display control unit. Output to 69.
- the display control unit 69 includes the budget actual calculation unit 61, the past cash calculation unit 62, the current cash calculation unit 63, the business plan generation unit 64, the daily data aggregation unit 65, the tax amount calculation unit 66, the transition calculation unit 67, and the breakdown calculation unit.
- the display control unit 69 displays the numerical value group obtained by the budget performance calculation unit 61 in the order of periods such as monthly (if the display start month is June, June, July, 8). Animate in the form of a graph or table (such as month ).
- the animation display refers to an operation of continuously displaying a plurality of numerical values, image positions, patterns, etc. at a constant tempo while shifting them little by little.
- the display control unit 69 sets a specified numerical group (for example, cash increase / decrease amount) among the cash increase / decrease amount for each past account item or the target cash acquisition amount for the current period, for example, account items such as sales, variable cost, fixed cost, etc. Animation is displayed in the order of.
- a specified numerical group for example, cash increase / decrease amount
- the display control unit 69 sets the numerical value group generated by the past cash calculation unit 62 or the current cash calculation unit 63, for example, in the order of cash items (accumulated profits, fixed funds, sales purchase funds, liquid funds, etc.). ) Is displayed as an animation in the form of a graph or table.
- the display control unit 69 displays the detailed data of the business plan generated by the business plan generation unit 64 in the order of account items (such as total sales, store sales, external sales, etc.) and the period (such as total sales, store sales, external sales, etc.). Animate in at least one order (monthly, etc.).
- the display control unit 69 sets the numerical value group aggregated for each unit period (for example, daily) by the daily data aggregation unit 65 in the order of the unit period (for example, if the display start date is June 1, June 1). Animation is displayed for a predetermined period (for example, 365 days or until the display end date) on June 2, June 3, etc.).
- the display control unit 69 animates the numerical value group generated by the tax amount calculation unit 66 in the order of items (current income, loss carried forward, taxable income, etc.) according to the flow of the tax amount calculation basis, for example.
- the display control unit 69 arranges the numerical values generated by the transition calculation unit 67 in the order of the months of the annual graph and displays them in animation, arranges them in the order of the months of the cost transition graph and displays them in animation, or displays the months. Animation is displayed in the order of each monthly item in the next transition table (SG & A expenses).
- the display control unit 69 animates the numerical value group generated by the breakdown calculation unit 68 in the form of a graph or a table, for example, in the order of cache items (sales, variable costs, fixed costs, etc.).
- the display control units 52 and 69 scroll right (or scroll down, etc.) in a well-separated manner according to the size of the display screen according to the progress of numerical values, graphs, etc., so that attention is moved to the right (or down). (Downward, etc.) It will move with the passage of time, emphasizing the story.
- the display control units 52 and 69 pop up another window (or move to another sheet, etc.) of the breakdown details by timely mouse operation or click operation (or automatically according to the condition for the numerical value) at the necessary place. Display or display a frame with a message of commentary or comment balloon explanation. That is, the display control units 52 and 69 have a display function in line with the normal flow of consciousness of wanting to confirm the breakdown of numerical values.
- the display control units 52 and 69 change the display in various ways by clicking a predetermined part of the animation display screen in a timely manner (or automatically according to the conditions for the numerical value) or according to the progress of the numerical value or the graph. You can make new displays appear, overwrite handwritten characters, attach sticky notes, and move to another window of another system. There is a function to generate (display or voice) an alarm for the item for which an abnormal value is displayed.
- the range of outliers can be determined by AI if sufficient data are available. Change, enlarge, and rotate the display format of logos and colors of characters and numerical values, make explanations in virtual space using avatars and virtual reality appear, and display explanation videos and sounds. All of these emphasize the story between the numerical value and the result, and are effective in further deepening the understanding of the flow.
- the display control units 52 and 69 pop-up display another window for simulation by appropriately clicking (or automatically according to the condition for the numerical value) at a necessary place. Simulations and plan updates are possible at all times during the fiscal year. Regarding the automatic change of the display according to the condition for the numerical value, if sufficient data can be accumulated, the condition can be determined by utilizing AI.
- the print control unit 44 displays the print menu screen 190 (see FIG. 19), which is a dialog box for printing, by operating the print button [Print] on each screen.
- the information on the original screen can be printed according to the button or parameter instruction operation of the print menu screen 190.
- the notification control unit 45 When the notification control unit 45 provides the monthly material to the user terminal 2, the notification control unit 45 notifies the completion of the monthly material at a predetermined timing set in advance. This function is called the automatic notification function.
- the notification control unit 45 is provided with an automatic transmission function, and is one of (1) a predetermined date and time, (2) after a predetermined time has elapsed, (3) a transmission request from the other party, and (4) data update. By setting the timing, the notification will be sent at that timing.
- the liaison unit 46 displays the accounting firm comment screen 100 (see FIG. 5).
- the accounting office comment screen 100 is a screen that functions as a contact point between a corporate user registered as a user and a main accounting office or another affiliated office.
- the contact unit 46 supports the functions of two-way live video via the Internet (or telephone line), voice communication, and message communication by chat, and communicates with the user by video, voice, text message, or the like. Can be done. Specifically, it can respond to inquiries from user companies regarding management consulting, accounting, taxation, labor, legal affairs, insurance, and the like. It is also possible to respond to inquiries from an external unspecified number of people via the homepage or SNS.
- FIG. 4 is a flowchart showing the operation of the server in the management strategy development support system.
- the data acquisition unit 41 includes accounting data including sales data of a company such as a retail business, attendance data of the company, and the like from the user terminal 2.
- the numerical value group of is acquired and stored in DB30.
- the numerical group presenting unit 43 presents the numerical groups in an order based on the causal relationship of each of the plurality of numerical groups in the DB 30. Specifically, the numerical group presentation unit 43 has a story (calculation procedure, calculation basis, etc.) accompanied by a predetermined calculation, and displays the numerical group calculated according to the story (calculation procedure, calculation basis, etc.).
- the corporate user can confirm the numerical groups while understanding the calculation basis more clearly. For example, when applied to a company's business plan, the difference between the budget and the actual result becomes clear, and future changes to the business plan can be considered even during the period of the business plan, so the business plan can be revised at an appropriate time. Will be. Further, for example, when applied to the cash flow data of a company, it becomes easier to understand the current cash flow situation of the company, and an effective cash flow strategy can be formulated based on specific figures.
- FIG. 21 is a diagram showing a function screen of the management strategy development support system.
- a menu of four functions such as A, B, C, and D, that is, a menu of (A: What is the current status confirmation "bank rating”? Bank rating ranking display function), (B: Menu of cash BEFORE & AFTER function, which is a tool for formulating a global "business strategy”, menu of (C: detailed "business plan” formulation simulation function), (D: monthly financial statement budget performance difference analysis function) Menus and the like are provided, and each function can be operated by clicking and operating the START button of each menu.
- the accounting office comment screen is shown. 5. Overview You can move to Fig. 6 of the tax simulation function screen and other function screens.
- the optional function selection screen (submenu screen) of the key index display function is shown in FIG. 36, from which the sales operating profit margin graph is shown in FIG. 37, the color distribution analysis table by product and sales office is shown in FIG. 38, and other graphs. You can make a transition.
- FIG. 5 is a diagram showing an accounting firm comment screen.
- FIG. 35 is a diagram showing a common function selection screen (main menu screen) related to the monthly financial statement budget actual difference analysis function.
- FIG. 36 is a diagram showing an option function selection screen (submenu screen) displayed by transitioning from the common function selection screen of FIG. 35.
- a corporate user, a certified accountant of an affiliated accounting firm, or the like is registered as a user on a server 1 operated by a main accounting firm, which is a service provider. Then, for example, when a corporate user inputs a predetermined address on the browser screen of the user terminal 2-n, a login page (not shown) that the server 1 exposes to the user is displayed. By entering the user ID and password on this login page and logging in, the common function selection screen 350 shown in FIG. 35 is displayed on the user terminal 2-n. On the common function selection screen 350 of FIG.
- the contact unit 46 When, for example, the accounting office comment icon on the common function selection screen 350 of FIG. 35 is clicked, the contact unit 46 is activated and the accounting office comment screen 100 shown in FIG. 5 is displayed.
- the accounting office comment screen 100 " ⁇ Inquiry>” Pip, Pa "Call Center” specialized field / expert button group 101, "live camera” button, "hello” button, “image deletion” button, etc.
- Live video communication section 102 including, live video display field 103, “chat” button, “hello” button, chat communication field 104 including “delete chat” button, progress list 105, contact and confirmation item table 106, comment Column 107 and the like are provided.
- the user selects one button in each specialized field / expert button group of " ⁇ Inquiry>" Pip, Pa "Call Center” (on the screen, select "Accounting Manager OOOO".
- live video communication with the accounting office staff or each expert who is affiliated with the outside is possible, and two-way live performance is possible.
- Video / voice communication allows experts and users to communicate with each other through conversation.
- live video communication with any location, factory or branch office, head office accounting department, corporate planning office, etc. is possible depending on the setting.
- live video communication such as inquiries and applications may be conducted in cooperation with financial institutions, settlement periods, securities companies, government agencies related to certificate applications, government agencies related to subsidy applications, etc. ..
- the live video and audio communication can be stopped by clicking the "Delete image" button of the live video communication unit 102.
- the "Hello" button of the live video communication unit 102 is clicked. Triggered by this click operation, the connection request is sent to the user terminal 2-a of the main accounting office, so that the user terminal 2-a generates a ringing tone such as a "ping-pong sound" and "is an inquiry". Since comments such as etc. are displayed on the screen of the user terminal 2-a, the staff of the main accounting office can operate the communication start button to communicate with the user and respond to inquiries from an external unspecified number of people. Communication is started. In addition, this click operation can be used as a trigger to send a connection request to a terminal such as a certified accountant of an external affiliated accounting firm.
- a ringing tone such as "ping-pong sound” is generated, and a comment such as "inquiry” is displayed on the screen of the terminal, so a certified accountant of an external affiliated accounting firm operates the communication start button.
- a certified accountant of an external affiliated accounting firm operates the communication start button.
- Information related to accounting, taxation, management, etc. is displayed in the comment column 107.
- the information in the comment field 107 is provided to the user who browses this page.
- various comments prepared and saved in advance can be presented at any time.
- it has a news providing function, a notification function from accounting firms and financial institutions, holding online video seminars, uploading and downloading various data, a whiteboard function, and an e-commerce function.
- the contents of the chat communication column 104, the contact and confirmation item table 106, and the comment column 107 are separately stored in the DB 30 of the server 1 as a communication history.
- the saved communication history can be read out on the monthly report progress list screen (see FIG. 20) and the past history can be browsed by performing the operation of reading the past history.
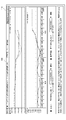
- FIG. 6 is a diagram showing a tax amount simulation screen.
- the tax amount calculation unit 66 is activated, and the summary tax simulation screen 108 shown in FIG. 6 is displayed on the user terminal 2-n.
- DB30 of server 1 corporate tax, consumption tax, etc. of the company are exported in advance from the accounting data of the previous term and the current term, and as needed (annual, monthly, weekly, daily) tax filing software, etc. Tax data, etc. related to the previous term and the previous term are stored.
- the tax amount calculation unit 66 reads data necessary for the tax amount simulation from the DB 30, calculates an annual forecast tax amount and the like, and outputs the data to the display control unit 69.
- the display control unit 69 is programmed with a display order according to the flow of the tax amount calculation basis, and displays the annual forecast tax amount and the like input from the tax amount calculation unit 66 according to the flow of the tax amount calculation basis. Animate while inserting numerical values in sequence. On the summary tax simulation screen 108, it is possible to confirm the annual forecast tax amount, etc. for the current period after recognizing the annual tax amount, etc. for the previous period.
- the animation display of the tax amount will be described below.
- the taxable income is calculated by starting from the value of the profit of the previous year and deducting the value of the carry-forward loss that can be deducted in the tax calculation.
- the annual forecast corporate tax, etc. calculated by multiplying the taxable income by the set tax rate is calculated, and the amount already paid in the middle, the amount expected to be paid at the end of the term, the annual forecast corporate tax, etc. are displayed in that order.
- the numerical value of the amount already paid in the middle read from accounting data and tax data is displayed, and the estimated payment amount at the end of the period (simplified taxation) calculated from the temporary payment consumption tax, etc. and the temporary receipt consumption tax, etc.
- the estimated payment amount at the end of the period (simplified taxation) calculated from the temporary payment consumption tax, etc. and the temporary receipt consumption tax, etc. In the case of, calculated from taxable sales and purchase deduction tax amount, etc.) and the annual forecast consumption tax, etc. are displayed in sequence.
- the tax amount of this year is displayed in the flow of intention to compare with them.
- items and numerical values are sequentially animated and displayed according to the flow of the tax amount calculation basis.
- the tax amount is calculated by adding or subtracting the values in each attached table, and by displaying animation for each attached table item in sequence, it is possible to confirm the tax amount while understanding the calculation basis more clearly. It will be possible. The same applies to corporate tax, consumption tax, income tax, inheritance tax, gift tax, inhabitant tax, etc. It is also possible to pop out and display financial statements, tax returns, etc. of previous years.
- FIG. 7 is a diagram showing an animation display screen of the annual graph.
- the transition calculation unit 67 displays the company-wide annual graph screen 109 shown in FIG. 7 on the user terminal 2-n.
- the transition calculation unit 67 reads data necessary for calculating the annual total amount from the accounting data of the previous period, the previous period, and the current period of the DB 30, calculates the annual total amount, and outputs it to the display control unit 69.
- the display control unit 69 arranges the input annual total amount in the order of the months of the annual total graph, and displays an animation so that the line graph extends in the horizontal axis direction.
- simulation means performing animation display after modifying the data.
- simulation data that is the basis of the animation display
- the calculated data is read out from the saved planned numerical values by clicking the "Register" button 326, the simulation values are calculated, and the simulation values are sequentially displayed.
- the transition calculation unit 67 calculates the annual total value for each month by adding the sales value for the current month to the annual total value for the previous month and subtracting the sales value for the previous month. ..
- the annual figure is the total amount for the last 12 months. That is, the process of calculating the value of the current month by adding or subtracting the value of the previous month based on the value of the previous month can be understood more clearly by the graph progressing sequentially by the animation function.
- the graph of the actual annual sales progresses one month at a time in chronological order and is displayed until the elapsed month.
- the annual graph progresses to the right, and conversely, when the company is sluggish and sales are decreasing, the annual graph progresses to the right.
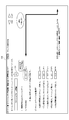
- FIG. 8 is a diagram showing a transition graph of salary allowance.
- the transition calculation unit 67 displays the screen 112 of the cost transition graph shown in FIG. 8 on the user terminal 2-n.
- the transition calculation unit 67 reads data necessary for calculating the cost transition from the accounting data of the previous term and the current term of the DB 30, calculates the previous term numerical value, the current term numerical value, and the difference amount, and outputs the difference amount to the display control unit 69.
- the display control unit 69 arranges the input previous term numerical value, current term numerical value, and difference amount in the order of the month of the cost transition graph, and displays an animation so that the line graph extends in the horizontal axis direction.
- the SG & A account to be displayed is selected from the pull-down list 113 displayed on the screen 112 of FIG.
- the salary allowance is selected on the screen.
- the SG & A account items selected and recorded in the setting sheet for each client are read out and displayed.
- the unit change button 114 displayed on the screen 112 is a button for designating a unit, and a numerical value and a graph are displayed in the selected unit.
- the unit of 1,000 yen is selected on the screen.
- the unit can be converted into dollar-denominated display, euro-denominated display, etc. based on exchange rate data (given data or at-time data obtained from the Internet).
- the actual numerical values are sequentially displayed one month at a time according to the elapsed months, and the budget difference and the previous year difference are displayed in sequence. After confirming the budget and the figures for the previous term, the figures for this year's results are displayed in the flow of intention to compare them.
- the advantageous difference is displayed with a blue background color
- the disadvantageous difference is displayed with a red background color.
- the advantageous difference by displaying the numerical value for each month in the order of budget, previous term, actual result, or in the order of previous term, budget, actual result, etc. It is possible to visually and impressively recognize the tendency that a month with a disadvantageous difference (red background color) suddenly occurs while there are many blue background colors, or that the disadvantageous difference reverses to an advantageous difference during the period.
- a disadvantageous difference red background color
- the budget graph first progresses one month at a time in chronological order and is displayed until the final month.
- the graph of the previous term progresses one month at a time in chronological order and is displayed until the final month.
- the actual graph progresses one month at a time in chronological order and is displayed until the elapsed month.
- the animation display function allows the graph to be checked in comparison with the graphs up to the previous month by visually following the progress of the graph, and the costs incurred by the company ( It becomes possible to clearly recognize how the salary allowance) has increased or decreased over time.
- the transition graphs such as sales are displayed in parallel, it becomes easier to analyze the cause of the cost increase / decrease.
- the degree of overlap between the budget displayed earlier on the screen 112 and the graph of the previous period can be tracked monthly and monthly, and as time goes by, the difference between the plan and the actual result can be observed. Understand the tendency of differences between the previous term and the current term.
- the display order is arranged and the graphs are intentionally displayed in sequence, so you can see information such as changes and transitions that are difficult to obtain from the fixedly displayed graph. You can get it later with. That is, the numerical value of the current month can be confirmed while sequentially comparing with the numerical value of the previous month. In addition, by following the shape of the progress of the graph with the eyes, it becomes possible to grasp the tendency even more impressively.
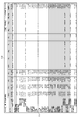
- FIG. 9 is a diagram showing a screen of a monthly transition table (SG & A expenses) in which the monthly income statement is described in the screen name.
- FIG. 10 is a diagram showing how the line of the clicked item “rental fee” is colored on the screen of the monthly transition table (SG & A expenses).
- the transition calculation unit 67 displays the screen 116 of the monthly transition table (SG & A) shown in FIG. 9 on the user terminal 2. Displayed at -n.
- the transition calculation unit 67 reads out the monthly transition data for each account required for calculating the monthly SG & A expenses from the accounting data of the previous term and the current term of the DB30, calculates the monthly SG & A expenses, and causes the display control unit 69. Output.
- the display control unit 69 displays the input monthly SG & A expenses in each item column of the monthly transition table (SG & A expenses), and the numerical value is vertical for the display target month (September on the screen). Animate to insert sequentially in the direction of the account.
- the transition calculation unit 67 reads out and displays the 23 item data of the display target account selected and stored in the setting sheet for each user.
- the animation display starts at the same time as the screen 116 of the monthly transition table (SG & A expenses) in Fig. 9 is displayed, and the total sales for the month to be displayed (September on the screen), the current product purchase amount, the cost of goods sold, and so on. Numerical values are displayed in the order of product cost of goods sold and cost of goods sold. In the column of total sales profit / loss amount, the value obtained by subtracting the cost of sales from the total sales is displayed.
- FIG. 11 is a diagram showing a screen immediately after the start of displaying the STRAC table as an animation.
- FIG. 12 is a diagram showing the final screen of the STRAC table animated and displayed by the cumulative buttons.
- the breakdown calculation unit 68 displays the STRAC table screen 120 shown in FIG. 11 on the user terminal 2-n.
- the column 123 of "Sales”, the column 124 of "Your company's variable costs”, the column 125 of "The gross profit is obtained by subtracting the variable costs from the sales", " Columns 126 for "gross profit margin”, 127 for "your company's fixed costs”, and 128 for "operating profit (+ interest expense) are profits from the main business" are provided.
- a bar graph display area is provided below each column.
- the breakdown calculation unit 68 reads the data necessary for creating the STRAC table from the accounting data of the current period of the DB 30, creates the data of the STRAC table, and outputs the data to the display control unit 69.
- the display control unit 69 sequentially arranges the input STRAC table data on the STRAC table screen 120 and displays the animation.
- the data of the variable cost / fixed cost classification and the labor cost item stored in the "setting sheet" for each user is read out, the data of the STRAC table is calculated, and the animation is displayed in sequence.
- the animation display is started by pressing the monthly button 121 or the cumulative button 122, the data is read from the accounting data, and the numerical value is displayed in the column 123 of "Sales is".
- the bar graph 123a is displayed in the graph area below the column 123.
- the final state in which the animation display is further advanced from the state of the STRAC front screen 120 shown in FIG. 11 is the state of the STRAC front screen 120 shown in FIG.
- a numerical value is displayed in the column 123 of "Sales is”
- a bar graph 123a is displayed in the graph area below the column 123, and then "Your company's variable cost is”.
- the numerical value, the bar graph 124a, and the balloon 124b are sequentially displayed in the column 124.
- the gross profit is the value obtained by subtracting the variable cost value from the sales value
- the value is displayed in the column 125 of "The gross profit is obtained by subtracting the variable cost from the sales amount" and below the column 125.
- a bar graph 125a is displayed in the graph area.
- the gross profit margin is calculated and the numerical value is displayed in the gross profit margin column 126.
- the breakdown calculation unit 68 reads the fixed cost data from the accounting data of the DB 30 and passes it to the display control unit 69.
- the display control unit 69 displays the numerical value of the fixed cost in the column 127 of "Your company's fixed cost” and displays the bar graph 127a and the balloon 127b in the area below it.
- the breakdown calculation unit 68 executes this calculation and "operating profit (+ interest expense)".
- a bar graph 128a is displayed in the area below column 128.
- break-even point analysis the fixed cost value is calculated by dividing it by the gross profit margin value, and the break-even point sales value is displayed. , Will be in the black "is displayed. Calculate the difference between the sales value and the break-even point sales value and display the value in the safety margin ratio column, and display "If sales increase by 1.9%, it will be in the black".
- variable cost rate for this month and the cumulative variable cost rate are displayed in sequence.
- fixed cost data is read from accounting data and calculated, and "people (personnel costs)", “things (expenses)”, “money (interest rates)”, “ Divide into “Strategy / Advertising / Education / Research / Development Expenses”, etc., and display the figures for this month and the cumulative total in sequence.
- FIG. 13 is a diagram showing a screen immediately after the start of the cash flow statement.
- FIG. 14 is a diagram showing a screen of a cash flow statement in which animation is started by an automatic expansion function by the GO button 131.
- FIG. 15 is a diagram showing a screen of a cash flow statement that is side-scrolled by the automatic expansion function by the GO button 131 or by the operation of the “NEXT (>)” button.
- FIG. 16 is a diagram showing the final screen of the cash flow statement that is side-scrolled by the automatic expansion function by the GO button 131 or by the further operation of the “NEXT (>)” button.
- the cash flow statement screen 130 shown in FIG. Displayed at -n the cash flow statement screen 130 shown in FIG. Displayed at -n.
- the screen 130 of the cash flow statement is provided with a column for profits for this month, a column for adjustment items on a cash basis, a GO button 131, and the like.
- the cash flow calculation unit When the GO button 131 on the screen 130 of the cash flow statement is clicked, the numerical values, comments, etc. of each item are displayed in animation at a good tempo one by one.
- the cash flow calculation unit first reads the data of this month's "net profit” from the accounting data of DB30, and displays the value in the column of "1. Cash flow from operating activities this month's profit”. , Display highlighted circle marks and callouts.
- the cash flow calculation unit reads data from the accounting data of DB30 at any time and calculates it, and displays numerical values, comments, etc. in animation up to the full screen 130 of the cash flow statement.
- the state in which the animation display is advanced in this way is the cash flow statement screen 130 of FIG.
- the numerical value is displayed in the column of "Increase in cash flow due to investment activities", and the numerical value, emphasized circle mark, and balloon are displayed in the column of "3. Increase in cash flow due to operating activities / investment activities”. ..
- the cash flow calculation unit calculates the balance at the end of the month by adding the values of "5. Increase / decrease in cash and deposits this month” and "6. Balance of" beginning of the month “of cash and deposits” and calculates the value in "7. Display in the "Month-end” balance of cash and deposits. In addition, as a breakdown, the numerical value is displayed in the “Cash (cash and deposit)” column, and the numerical value is also displayed in the “Periodic reserve fund and others (non-liquid)” column.
- FIG. 17 is a diagram showing a screen of a cash flow balance sheet in which animation display of numerical values, comments, etc. has progressed to the full screen by the automatic expansion function by the GO button 141.
- FIG. 18 is a diagram showing the final screen of the cash flow balance sheet side-scrolled by the automatic expansion function by the GO button or the operation of the “NEXT (>)” button.
- the cash calculation unit 63 of this term displays the screen 140 of the cash flow balance sheet shown in FIG. 17 as the user terminal. It is displayed in 2-n.
- the past cash calculation unit 62 displays the screen 140 of the cash flow balance sheet shown in FIG. 17 on the user terminal 2-n.
- the cash flow balance sheet screen 140 is provided with a cash deposit table, a fixed fund table, a GO button 141, and the like at present, for example, as of the end of September.
- the cash flow calculation unit reads data from the accounting data of the DB 30 at any time, calculates the data, and passes the value to the display control unit 69.
- the display control unit 69 animates the numerical values, comments, etc. of each item on each table of the cash flow balance sheet screen 140 at a good tempo one by one.
- the display order of the numerical values will be described below. First, the data such as retained earnings for this month is read from the accounting data of DB30 and the numerical values such as retained earnings are displayed, and the numerical value of the carry-forward profit / loss and the cumulative numerical value of the past profit are displayed.
- this cash flow balance sheet animation display function by displaying numerical values, comments, etc. one by one with the animation display function, it is possible to check the financial condition of the company as of the end of this month. Can be understood sequentially by personality.
- the screen 140 After calculating and displaying the cumulative value of past profits from the cash flow balance sheet, the capital and the like, which are the funds that the company can completely freely use, are calculated and displayed. Next, the figures such as long-term debt are also added up, and the funds that the company can use stably in the long term are displayed in the total credit column.
- the total amount of fixed asset items, etc., whose funds are fixed in the long term is displayed in the column of total debits, and it is confirmed whether or not the funds can be used stably in the long term. be able to.
- sales purchase funds which is the difference between the sales receivables and the trade payables, calculated and displayed on the screen 140, and the funds are invested in the external trader in the normal circulation of sales purchases ("Sales"). It is possible to confirm whether “purchased funds” is negative) or whether it is generated from an external trader (when “sales purchased funds” is positive).
- the "fixed funds” that form the framework of the company and the “sales purchase funds” generated from sales purchases are displayed in order according to personality, and the total of both is calculated to calculate the total stable funds and displayed on the screen 140. To do. Finally, the short-term fund balance item, "funds used in a liquid (temporary) manner,” is calculated and displayed. The total amount of cash deposits of the company as of the end of this month is the sum of stable funds plus or subtracted "funds used in a liquid (temporary) manner".
- FIG. 19 is a diagram showing a menu screen of the print function.
- the Print button on each screen is clicked, the screen transitions to the print menu screen 190 shown in FIG.
- the print menu screen 190 is prepared with an individual print menu, a batch print menu, and a print setting menu.
- the name of the page to be printed is displayed for confirmation in the individual print ⁇ print page>.
- the print menu screen 190 shows an example in which "Cache BEFORE What happens if this is left as it is?" Is printed.
- the print menu screen 190 is provided with various print setting fields, and for example, "color or black and white”, “number of sheets”, “copy unit printing”, “printer” and the like can be set.
- "Printer” field the name of the connected printable printer is displayed in a pull-down list, so select the printer to use.
- the print history recording function records the print history.
- the print history recording function records the print history for each user for the past 10 times (arbitrary number of times), redisplays the print history at the next print, and sets the check box for each user from zero. Eliminates the inconvenience of doing. It has recording functions such as selection of print target, color black-and-white printing, number of prints, with or without copy printing, and selection of available printers.
- FIG. 20 is a diagram showing a screen of a monthly report progress list.
- A Check the current status What is the "bank rating”? Bank rating ranking display function menu
- B Strategy is formulated regularly by the cash BEFORE & AFTER function menu, which is a global "business strategy" formulation tool.
- C Formulate and update the business plan as a tactic at any time by using the menu of the detailed "business plan” formulation simulation function.
- D Monthly financial statements A monthly financial statement is created from the menu of the budget performance difference analysis function and provided to users and certified accountants of affiliated accounting firms.
- the monthly financial statement is created by operating the D: monthly financial statement budget actual difference analysis function.
- the created monthly financial statement data is stored in the storage area of each user of the DB 30 together with the data of the monthly financial statements of other months. At this time, the data of the monthly financial statements is flagged as created, saved, provided, etc., and the history is stored.
- the data of the plurality of monthly financial statements of the DB 30 is managed for each user, and the screen 200 of the monthly report progress list shown in FIG. 20 can be displayed by an instruction operation from the user.
- the screen 200 of the monthly report progress list of FIG. 20 it is possible to list up to how many months the monthly financial statements have been provided.
- the screen 200 of the monthly report progress list when the corresponding month portion of the corresponding user is clicked, the data of the corresponding monthly financial statement is read and displayed.
- the communication history with the corresponding user can be displayed.
- the communication history such as chat, contact and confirmation item table, and comment saved on the accounting office comment screen 100 shown in FIG. 5 can be read out and viewed on the screen 200 of the monthly report progress list.
- the list can be sorted by the "ascending order (descending order)" of the company code.
- the list can be sorted by "ascending order (descending order)” of the staff member in charge.
- the list can be sorted by "ascending order (descending order)" of "client name” and "last processing date”. Also, when the "client name” is clicked, the basic information about the corresponding client is read and displayed.
- FIG. 21 is a diagram showing a function screen of the management strategy development support system.
- FIG. 22 is a screen of the bank rating ranking function.
- the management strategy development support system has four functions: a bank rating ranking function, a cash BEFORE & AFTER function, a business plan formulation simulation function, and a monthly financial statement budget performance difference analysis function. Each function can be executed.
- the accounting data of the current period, the previous period, and the period before the previous period which are exported from the accounting software or the like at any time (annual, monthly, weekly, daily) and stored in the DB 30, are read from the DB 30. Is done.
- the animation display makes it easier to understand the flow of the calculation basis of the numerical value by sequentially displaying the numerical value in the order according to the relationship between each item. You can get a clearer idea of what you mean.
- the cache BEFORE & AFTER function (Cash BEFORE & AFTER function)
- the cache BEFORE & AFTER function will be described with reference to FIGS. 23 to 28.
- the cash BEFORE & AFTER function is a function that animates the annual cash increase / decrease amount of the previous term based on the accounting data of the previous term and the previous term (cash BEFORE function), and a function that performs a simulation to achieve the current term target cash amount (cash). It has an AFTER function).
- FIG. 23 is a diagram showing “during animation” by the animation display screen “GO” button of the cache BEFORE function or by the automatic expansion function of the “fast forward (>>)” button.
- FIG. 24 is a diagram showing “horizontal scrolling” by the animation display screen “NEXT (>)” button of the cache BEFORE function or by the automatic expansion function of the “fast forward (>>)” button.
- FIG. 25 is a diagram showing the animation display screen “side-scrolling end” of the cache BEFORE function.
- the cash BEFORE function calculates how much the actual cash has increased or decreased in one year based on the accounting data of the previous period and the period before the previous period, and then items in the order of income item, expenditure item, balance sheet item increase / decrease, etc. Animate in sequence.
- the cache BEFORE function uses the following data among the company data stored in the DB 30. For example, the annual and monthly accounting data for the current term and the previous term, the year before the previous term, and the setting contents for each company (industry classification, settlement month, SG & A items, variable costs) that are exported from the accounting software of the company as needed and stored in DB30 -A setting sheet, etc. that stores fixed cost categories, personnel cost items, tax calculation settings, etc.) is used.
- the GO button 231 and the "NEXT” (>) button 232, the “BACK” button 233, the “fast forward” (>>) button 234, and the like are provided on the upper part of the screen 230 shown in FIG.
- a numerical input field for operating cash flow a numerical input field for investment cash flow, a numerical input field for free cash flow, etc. are provided.
- an area for displaying a bar graph by animation is provided at a position corresponding to each of the above numerical input fields.
- the animation display can be advanced one item at a time.
- data is read from the accounting data according to the reading rule programmed in advance, and the numerical value is input and displayed in the numerical value input field of the data, and a bar graph of the height corresponding to the numerical value is displayed.
- the screen can be scrolled horizontally by one page width.
- the "fast forward" (>>) button 234 on the screen 230 displays the animation and scrolls in the horizontal direction by the automatic expansion function.
- Horizontal scrolling by the automatic expansion function always keeps scrolling the screen horizontally little by little, scrolls the screen horizontally by the display width of one item as the display progresses one item at a time, and the page display is full. At that point, the screen for one page width can be scrolled horizontally.
- the result of subtracting the fixed cost from the gross profit is calculated, and the numerical value is displayed in the "profit before tax” column and the graph is sequentially displayed. Furthermore, when the GO button 231 is pressed, one piece of corporate tax rate data set in the setting sheet is read out, the corporate tax amount is calculated, the numerical value is displayed in the corporate tax column, and the graph is sequentially displayed. To. In addition, the numerical value of the corporate tax rate is displayed.
- the GO button 231 when the GO button 231 is pressed, the result of deducting corporate tax from the profit before tax is calculated, and the numerical value of the result is displayed in the "Profit after tax" column, and graphs, balloons, etc. are displayed in sequence. Is displayed. Further, when the GO button 231 is pressed, one piece of depreciation cost data is read out, a numerical value is displayed in the depreciation cost column, and a graph is displayed.
- the sales receivable data is read from the accounting data of the previous period and the previous period, the increase (decrease amount) of the sales receivable is calculated, and the numerical value of the calculation result is displayed.
- the graphs are displayed in sequence.
- the GO button 231 when the GO button 231 is pressed, the corresponding data for the year before and the previous period (other selected arbitrary period) is read out one by one from the accounting data, and the numerical value is displayed in the corresponding item column. Graphs, balloons, etc. are displayed.
- the increase / decrease amount is calculated, and the numerical value of the calculation result is displayed in the increase / decrease amount column of the screen 230, and a graph, a balloon, or the like is displayed.
- the deduction amount of the items already mentioned is calculated, and the numerical value of the deduction amount is displayed in the deduction amount column, and the graph, the balloon, and the like are sequentially displayed.
- each display item can be displayed on a cash basis.
- the screen scrolls horizontally by one page width by clicking the "NEXT" (>) button 232, and the display progresses further by operating the GO button 231.
- FIG. 24 shows a state in which "horizontal scrolling" of the screen by the automatic expansion function is executed by the "fast forward (>>)" button 234, and the animation display is further advanced.
- the screen scrolls horizontally.
- the screen always scrolls horizontally little by little, scrolls horizontally by the display width of one item as the display progresses one item at a time, and when the page display is full, the screen becomes horizontal by one page width. Scroll.
- the "BACK" button 233 is clicked, all numerical values, graphs, balloons, etc. are deleted, and scrolling is returned to the original start position.
- this screen 230 shows the final state in which the animation display and the horizontal scrolling by the automatic expansion function are executed by the click operation of the "fast forward (>>)" button 234, and the animation display is further advanced. Further, this screen 230 shows a state in which the amount of increase / decrease in cash for the previous year and the comment selected according to the magnitude of the amount are displayed.
- the numerical value of the increase / decrease in cash indicates the actual amount of increase / decrease in the previous year, and irregular increase / decrease items such as the item of increase (decrease) in trade receivables are included.
- the management strategy development support system is a system that incorporates it into management practice and accounting processing based on the idea that "thinking strategically, that is, calculating back from the ideal vision.” There are various ways of thinking about the ideal vision from various perspectives, but the most important thing about the numerical values that support management is the ideal of "cash, that is, cash and deposits” that incorporates financial balance other than profit and loss. The amount of money earned.
- FIG. 26 is a diagram showing a first screen “target value input” of the cache AFTER function.
- FIG. 27 is a diagram showing “horizontal scrolling” with the “PRE ( ⁇ )” button on the second screen of the cache AFTER function.
- FIG. 28 is a diagram showing a second screen “horizontal reverse scroll end” of the cache AFTER function.
- the sales required to achieve the target is calculated by starting from the target minimum required cash amount and tracing the flow of the cache BEFORE function in reverse. To do.
- the cash AFTER function is a function that clarifies the path to achieve the target (required sales and the amount of each item) by calculating back from the ideal (minimum required cash amount).
- the screen 260 is provided with substantially the same buttons as the screen 230. Further, since the screen 260 is functionally back-calculated, a screen similar to the screen 230 (FIG. 25) at the end of the cache BEFORE function is displayed at the top.
- the screen 260 On this screen 260, first of all, "What is the minimum required” cash "amount? The user enters a numerical value in the "" field.
- the input value is the company's target annual cash increase. For example, enter a numerical value such as "0" to eliminate the minimum cash out.
- the screen 260 is provided with a target setting column 266.
- an achievement simulation button 267 is provided under the character string of the explanation "1) What should I do to pay off the loan within 5 years?".
- an achievement simulation button 268 is provided under the character string of the explanation "2) What should be done to enable the hiring of one person every period?".
- the cash AFTER function displays a numerical value (value of cash BEFORE) in the "Increase / decrease due to repayment of borrowing" column, a graph, a balloon, and then "Accounts”. Display the numerical value (value of cash BEFORE) and the graph in the column of "Depreciation expense”.
- the cash AFTER function subtracts the value in the "Increase / decrease due to repayment of debt” column from the value in the "What is the minimum required cash amount?" Column, and further subtracts the value in the "Depreciation expense” column. Is subtracted to calculate the amount of net income after tax, and the numerical value of the calculation result is displayed in the column of "This amount of net income is required after tax".
- the balloon of the selected improvement measure hint is displayed according to the magnitude of the numerical value in the column of "Increase / decrease due to repayment of borrowing".
- the screen is scrolled horizontally by one page width by clicking the "PRE ( ⁇ )" button 261. Then, the display is further advanced by the click operation of the GO button 262, and the state of the screen 260 shown in FIG. 27 is reached.
- the "horizontal reverse scroll” by the automatic expansion function always keeps “horizontal reverse scroll” little by little, or “horizontal reverse scroll” by the display width of one item as the display progresses one item at a time, or when the page display is full. You can “scroll horizontally and backward” by the width of one page.
- the state of the screen 260 of FIG. 28 is obtained. That is, the state of the screen 260 in FIG. 28 indicates the final state in which the screen is scrolled horizontally by pressing the "PRE ( ⁇ )" button 261 and the display is further advanced by pressing the GO button 262.
- Simulations often calculate unrealizable levels of required sales.
- "NEXT (>)” button 264 by clicking the "NEXT (>)” button 264, "horizontal scrolling" is performed to the display screen of each item to return the screen, and the numerical value of each item is corrected and overwritten.
- the numerical value in the "required sales" column, the graph, the numerical value of the gap (insufficient sales), the comment, etc. are updated based on the overwritten numerical value.
- the revision of the numerical values of each item the items that can be improvement points are revised while assuming specific improvement actions that can be derived in the practice of company management.
- the "required sales" level of the simulation can be lowered, and the path (required sales and the amount of each item) for achieving the target with higher feasibility can be confirmed.
- the path for each numerical value of "fixed cost amount” and “variable ratio”, it is conceivable to overwrite the reduced numerical value by promoting efficiency improvement through internal improvement actions. You can also check the path to achieve another goal (required sales and the amount of each item).
- the screen 260 of FIG. 28 is provided with a simulation pattern data save button 271 and a read button 272, and by operating these buttons, up to 10 patterns of executed simulation data can be saved in the DB 30, respectively.
- the pattern simulation data can be read from the DB 30 to execute and display the simulation.
- the registration button 273 is provided on the screen 260. By clicking the registration button 273, the simulation is confirmed and saved in the DB 30 as a planned numerical value. As a result, the figures and graphs of the budget on the monthly financial statement budget actual difference analysis function will be displayed.
- FIG. 29 is a diagram showing a second screen (detailed function selection screen) of the business plan formulation simulation function.
- FIG. 30 is a diagram showing a simulation screen (actual screen up to now) of the sales simulation function.
- FIG. 31 is a diagram showing a simulation screen (simulation screen for achieving the target sales) of the sales simulation function.
- FIG. 32 is a diagram showing a simulation screen (simulation screen for achieving the target profit amount) of the profit amount simulation function.
- the tactics formulation function based on the business plan simulation executes the business plan simulation based on the strategy simulated by the cache AFTER function described above. This makes it possible to formulate a specific detailed breakdown of the business plan.
- the screen 290 of the simulation function list shown in FIG. 29 is displayed.
- a "sales breakdown simulation” column for executing a sales simulation
- a "variable cost simulation” column for executing a variable cost simulation
- a "fixed cost simulation” for executing a fixed cost simulation.
- Column, "Profit simulation” column for executing profit simulation, "Improvement of financial indicators” column, etc. are provided.
- a numerical display frame 291 for the required sales and a START button 292 as a trigger button for executing the sales breakdown simulation are provided.
- the numerical display frame 291 the numerical value of the required sales registered by the cache AFTER function is displayed.
- the START button 292 is clicked, the screen 300 of the "sales breakdown simulation" shown in FIG. 30 is displayed.
- variable cost simulation a numerical display frame 293 of the budget variable cost rate and a START button 294 as a trigger button for executing the simulation of the budget variable cost rate are provided.
- the numerical display frame 293 the numerical value of the variable cost rate registered by the cache AFTER function is displayed.
- the START button 294 is clicked, the variable cost simulation screen (not shown) is displayed, and the variable cost rate simulation is executed.
- a numerical display frame 295 for the fixed budget cost amount and a START button 296 as a trigger button for executing the simulation of the fixed budget cost amount are provided.
- the numerical display frame 295 the numerical value of the budget fixed cost registered by the cache AFTER function is displayed.
- the START button 296 is clicked, the budget fixed cost simulation screen (not shown) is displayed, and the budget fixed cost simulation is executed.
- a numerical display frame 297 of the required profit amount and a START button 298 as a trigger button for repeating the above simulation and clarifying the path to the required profit amount are provided.
- the numerical display frame 297 a numerical value obtained by deducting the variable cost amount and the fixed cost amount from the required sales registered by the cash AFTER function is displayed.
- the START button 298 is clicked, the screen 320 of the "profit amount simulation" shown in FIG. 32 is displayed.
- a START button 299 is provided as a trigger button for displaying the improvement effect of financial indicators that financial institutions place importance on by the above simulation.
- the screen 220 of "[Bank rating] What is your company's rating ranking?" Shown in FIG. 22 is displayed.
- the numerical value of the debt required to be redeemed, the number of years of debt redemption and the numerical value of the repayment financial resources are displayed by simulation.
- the actual value of sales for this term (monthly figures from June to September and graphs 301 and 302) is displayed as it is.
- Graph 301 shows the monthly sales for this term.
- Graph 302 shows the cumulative sales for this term.
- the data of the unexpired period (October to May) of this term is the target of planning as the planning period, and by simulating, it is displayed as an animation with monthly numerical values and graphs.
- Monthly figures are displayed for each sub-item (store sales, external sales, mail-order sales, etc.) in addition to total sales.
- each sales sub-item column of "sub-subject" on the screen 300 the numerical values of each monthly data of the elapsed months of the current term included in the sales sub-item data read from the accounting data of DB30 are sequentially displayed. Will be done.
- the state shown in FIG. 31 is the time when the sales breakdown simulation for all months is executed and the animation display is completed.
- the batch button 305 of the same month of the previous year next to the message "Simulate with the numerical value of the same month of the previous year" is clicked, the numerical value of the same month of the previous year is read from the accounting data of the previous period of DB30. Then, the numerical value is sequentially displayed in each item of the unexpired month by one line every month by the animation function.
- the animation function will be used to sequentially add one line each month, and the total amount for the year will be displayed in the unexpired month column. Is displayed so that the amount is the same as last year.
- the animation function sequentially increases the sales of each item to the value of the same month of the previous year in the unexpired month column, one line per month. The value increased by the up rate entered as the rate is displayed.
- the clear button 311 When the clear button 311 is clicked, the numerical value in the unexpired month column is deleted only for the line of the clicked item.
- the retotal button 312 When the retotal button 312 is clicked, the simulation results are re-aggregated and the annual sales value is displayed in the simulation value column.
- the graphs of sales for this term and sales for the previous term are displayed as animations for each month and cumulative total.
- those with a check mark in the square ( ⁇ ) column indicate that the simulation was executed.
- the simulation numerical value column the numerical value of sales for the current term by simulation is displayed.
- the numerical value of the required sales registered in advance by the cash AFTER function is displayed.
- the user of the user terminal 2 (such as a person in charge of the company) can confirm whether or not the result of the simulation of this term satisfies the required sales determined by the cache AFTER function.
- the simulation calculation of the profit amount is executed, and the animation display is started in the screen 320.
- An animation is sequentially displayed one line per month in the columns of total sales, variable cost rate, total variable cost, total fixed cost, and operating profit provided on the screen 320 for "single month”.
- the "Monthly” graph is displayed as an animation.
- the numerical values are sequentially displayed in animation one line per month in each column of "cumulative" total sales, variable cost ratio, total variable cost, total fixed cost, and operating profit.
- the "cumulative" graph is displayed as an animation.
- the numerical value simulated at the time of the sales breakdown simulation is read out from the DB 30 and displayed.
- the values simulated during the variable cost simulation are read out and displayed.
- the numerical value of the total fixed cost the numerical value simulated at the time of the fixed cost simulation is read from the DB 30 and displayed.
- the numerical value obtained by subtracting the total variable cost and the total fixed cost from the total sales is calculated and displayed.
- variable cost simulation button 322 provided in the "Confirm” variable cost "simulation” column When clicked, the screen transitions to the variable cost simulation screen (not shown), so the displayed variable cost simulation You can update the profit amount simulation by modifying the contents of the variable cost simulation from the screen of.
- the screen transitions to the fixed cost simulation screen (not shown), so that the displayed fixed cost simulation can be displayed. You can update the profit amount simulation by modifying the contents of the fixed cost simulation from the screen.
- the numerical value of the previous term operating profit included in the accounting data of the previous term read from the DB 30 is displayed.
- the simulation numerical value on the screen 320 the numerical value of the operating profit for the current term by the simulation is displayed.
- the simulation can be confirmed and registered as a business plan. It is also possible to perform automatic simulation on a regular basis, or to perform automatic simulation based on some mechanism, such as when profits decrease significantly. According to the registered simulation, the numerical value of "debt redemption required", the numerical value of "years of debt redemption", and the numerical value of "repayment financial resources" of "according to the simulation [plan]" on the screen 220 of FIG. 22 are updated.
- FIG. 33 is a diagram showing a screen of a cash balance transition table in which animation is started by pressing the START button.
- FIG. 34 is a diagram showing the screen “animation end” of the cache balance transition table displayed in animation.
- the screen 330 of FIG. 33 is a screen displayed by the daily data aggregation unit 65 and the display control unit 69, and animates the graph of the daily cash deposit balance for 365 days.
- the daily data aggregation unit 65 is a group of numerical values such as cash deposit balances of one or more financial institutions received daily from user terminal 2 while the company is active, or journals related to cash and deposits of accounting data of the previous term and the current term. Numerical values such as the cash deposit balance calculated from the transaction are aggregated for each day and output to the display control unit 69, and the display control unit 69 animates and displays the cash deposit balance aggregated for each day in the order of days for 365 days.
- data such as the cash deposit balance of one or more financial institutions or data such as the cash deposit balance read from the accounting data is transmitted from the user terminal 2.
- the server 1 stores data such as a cash deposit balance received from the user terminal 2 in the DB 30.
- the daily data aggregation unit 65 aggregates the daily balance such as the cash deposit balance read from the data such as the cash deposit balance of the financial institution stored in the DB 30 or from the accounting data of the DB 30, and outputs it to the display control unit 69. Therefore, the display control unit 69 displays the numerical value of the cash deposit balance and the bar graph aggregated for each day in the order of the days (from June at the beginning of the period to September of the elapsed month, June 1, 2, 3, ... , September 29th, 30th, etc.). By setting the display period to one year, it is possible to animate the numerical value of the cash deposit balance and the bar graph for up to 365 days.
- the daily data aggregation unit 65 aggregates the cash deposit data read from the DB 30 and outputs it to the display control unit 69. By doing so, the animation display of the numerical value and the bar graph is started.
- the daily transition graph 332 of the cash deposit balance of the previous period which is the target for comparison, is displayed in animation from the beginning to the end of the period according to the time series.
- the daily transition graph 333 of the cash deposit balance of the current period is displayed in animation from the beginning of the period to the elapsed month in chronological order.
- the animation display is further advanced from the state of the screen 330 of FIG. 33, and the state shown in the screen 330 of FIG. 34, that is, the animation display of numerical values and graphs is advanced until the end of September (the end of the elapsed month).
- the daily transition graph of the cash deposit balance for this term is displayed as an animation in chronological order, and the display is advanced until the elapsed month.
- the numerical values are displayed in animation in each column provided at the bottom of the screen 330 in FIG. 34. Specifically, at the bottom of the screen 330, a column for the maximum cash increase amount 334, a column for the maximum cache decrease amount 335, a column for the surplus cash amount 336, and a column for the monthly cash safety margin rate 337 are provided. In each column, as the graph progresses, each numerical value related to the graph display period is displayed in animation so as to be updated sequentially.
- the daily data aggregation unit 65 calculates the maximum cash deposit increase amount for one day during the display period, displays the value in the maximum cash increase amount column 334, and displays the maximum cash for one day during the display period.
- the deposit reduction amount is calculated and the value is displayed in the maximum cash reduction amount column 335.
- the daily data aggregation unit 66 calculates the minimum amount of the cash deposit balance during the display period and displays the value in the surplus cash amount column 336 in which the character string "there is always a balance during the period" is described. To do.
- the daily data aggregation unit 66 calculates the monthly cash safety margin rate by dividing the value of the surplus cash amount by the value of the decrease amount of the maximum cache, and calculates the value as "It is okay when the maximum payment comes. It is displayed in the column 337 of the monthly cache safety margin rate in which the character string "safety level" is described.
- the monthly cash safety margin rate is less than 100%, it warns that there is a risk of cash shortage if payment precedes depending on the timing of income and expenditure.
- the monthly cash margin rate is an indicator that every company should keep in mind.
- the increase / decrease detail window (or another sheet, etc.) for the relevant day will open.
- the one with the largest cash increase and the one with the largest cash decrease on the relevant day are selected and displayed in order of amount.
- the offsetting account and the description items of the journal are also displayed, and the reason for the increase / decrease can be more clearly recognized by determining the classification of operating cash flow, investment cash flow, and financial cash flow and noting them separately. .. If a sufficiently large amount of data is accumulated regarding the increase / decrease in the company's cache, it is possible to analyze the reason for the increase / decrease using AI and automatically select display items such as details and explanations.
- the transitional tendency of the cash balance can be predicted, and a future simulation can be carried out. As a result, it becomes possible to analyze the difference between the actual budget and the profit and loss regarding the cash transition.
- the balance can be changed by creating a daily balance transition table, analyzing the reasons for increase / decrease, selecting display items such as details and explanations, and performing future simulations. It will be possible to grasp the daily transition trend firmly.
- the daily transition trend of expenses incurred by creating a daily transition table of the amount incurred analyzing the reasons for increase / decrease, selecting display items such as details and explanations, and conducting future simulations. It becomes possible to grasp the information firmly and to re-recognize a lot of information useful for management.
- the daily transition table of sales which is one of the profit and loss items, is often used, but most of the analysis of daily transitions related to personnel expenses, utilities expenses, freight charges, vehicle expenses, etc. is carried out. Instead, creating a daily transition table is effective in re-recognizing daily trends (effects of days of the week, weather, festivals, etc.). Instead of the conventional judgment based on the experience and intuition of managers and managers, it is possible to make strategic judgments based on objective (big) data.
- the daily transition graph of the cash deposit balance of the previous term is displayed first, and the daily transition graph of the cash deposit balance of the current term is confirmed while comparing with the previous term. This makes it easier to judge the cash flow situation for this term.
- the animation one day at a time in chronological order, it is possible to impressively recognize the increasing / decreasing tendency of the cash deposit balance for one year by visually following the movement of the graph progressing.
- the cash balance is one of the most important points in managing a company. Even if the profit is positive, if the cash becomes negative, it may cause a surplus bankruptcy of "there is an account and there is not enough money”. Graphs and charts that display only the balance at the end of the month are not useful materials for cash flow management. The cash increases and decreases every day, and even if the balance happens to be at the end of each month, it cannot be used as a management material to prevent the possibility of a cash shortage during the month.
- the cash balance transition table showing the 365-day transition of the cash deposit balance makes it possible to visualize and manage the 365-day cash balance transition including the month.
- FIG. 35 is a diagram showing a common function selection screen (main menu screen) related to the monthly financial statement budget actual difference analysis function.
- FIG. 36 is a diagram showing a key index selection screen (submenu screen) related to the monthly financial statement budget actual difference analysis function.
- FIG. 37 is a diagram showing an animation screen “state before starting animation” of a key index (selected operating profit margin on sales).
- FIG. 38 is a diagram showing an animation screen “state in which animation is completed” of a key index (selected operating profit margin on sales).
- FIG. 39 is a diagram showing (a state in which animation display is started) of a key index (color distribution analysis table for each selected product and sales office).
- FIG. 40 is a diagram showing (a state in which the animation display is finished) of the key index (color distribution analysis table for each sales office for each selected product).
- FIG. 41 is a diagram showing a screen of a key index (selected personnel sales graph).
- the management indicators and graphs that should be noted differ depending on the characteristics of the type of industry to which the company belongs, as well as the size of the company and the situation in which it is located. Therefore, this key index display function is effective for users according to the company's industry, strategy, and situation, which should be used as a guideline when recognizing differences in budget performance difference analysis in the PDCA cycle and launching improvement activities. Present key indicators numerically or in graphs.
- a setting sheet for each company is stored in advance in the DB 30 of the server 1.
- the industry classification of the company is recorded on the setting sheet.
- the key index presentation unit 42 reads out the setting sheet for each company stored in the DB 30, and based on the industry classification recorded in the setting sheet, numerically or graphs the key index according to the characteristics of the corresponding industry prepared in advance. Is displayed on the user terminal 2 of the corporate user.
- the key index display operation will be specifically described with reference to the drawings.
- the icon of the key index for example, of the common function selection screen 350 of FIG. 35 is clicked, the submenu screen 360 shown in FIG. 36 is displayed.
- the submenu screen 360 of FIG. 36 is provided with icons 361 to 363 such as a sales operating profit margin graph, color distribution analysis, and man-hour sales.
- icons 361 to 363 such as a sales operating profit margin graph, color distribution analysis, and man-hour sales.
- other key indicators such as a loss / defect rate graph that analyzes the occurrence status of losses and defective products are directly linked to profits in the case of manufacturing companies.
- There is also an icon for selecting is also an icon for selecting.
- this key index presentation unit 42 an index that should be paid particular attention to is prepared in advance according to the characteristics of the type of industry to which the company belongs, and also according to the size of the company and the situation in which the company is located. It is possible to judge the display flow (story), select and display an appropriate icon, and display the numerical values and graphs of key indicators in animation along the display flow (story).
- the user of the clothing retailer company analyzes the transition of the profit margin selected and displayed for the clothing retailer on the submenu screen 360 shown in FIG. 36, and the icon 361 of the sales operating profit margin graph and the product. You can browse the necessary key indicators by selecting the icon 362 of the color distribution analysis graph that analyzes by different sales offices.
- the sales operating profit margin graph is displayed by the key index presentation unit 42.
- the key index presentation unit 42 is triggered by a click operation of the icon 361 on the screen 360 of FIG. 36, and is required data (for example, store registration data, daily business report data, etc.) from the accounting data of the previous term and the current term of each company in the DB 30. ) Is read out, the budget operating profit margin for the current term, the actual results for the previous term, and the operating profit margin for sales for the current term are calculated, and the screen 370 for presenting the graph shown in FIG. 37 is displayed.
- data for example, store registration data, daily business report data, etc.
- the graph presentation screen 370 of FIG. 37 is provided with a pull-down list 371 and a start button 373 for selecting the key index to be presented.
- the pull-down list 371 is provided with selection items for presenting not only the operating profit margin on sales but also a more detailed operating profit margin on sales by person in charge, operating profit margin on sales by business division, and the like.
- the contents of the pull-down list are prepared in advance so that necessary indicators can be confirmed according to the characteristics of the type of industry to which the company belongs, and also according to the size of the company and the situation in which the company is located.
- the screen 370 of FIG. 37 shows a state in which a selection item of, for example, the operating profit margin on sales is selected in the pull-down list.
- the start button 373 provided on the screen 370 of FIG. 37 When the start button 373 provided on the screen 370 of FIG. 37 is clicked, the actual results and differences of this month, the differences of last year, the cumulative results and differences, and the numerical values of the differences of last year, which are totaled by the key index presentation unit 42, are displayed. Is sequentially displayed as an animation as shown in the screen 370 shown in FIG. 38. Advantageous differences are displayed with a blue background color, and disadvantageous differences are displayed with a red background color. At the same time as checking the current situation in a single month, the cumulative total is displayed with the intention of knowing the general trend of this term. Since the budget is saved in the DB 30 by clicking the registration button 326 after executing the profit amount simulation on the screen 320 of FIG. 32, the key index presenting unit 42 starts from the planned numerical value saved in the DB 30. Read the required data and calculate the budget.
- the budget graph 375 and the graph 376 of the previous term are sequentially displayed as animations. Finally, the graph 377 of this term will be displayed as an animation until this month.
- the graph 377 of this term By displaying the graph 377 of this term in chronological order on the graph 375 and 376 of the previous term displayed earlier, the graph 377 grows month by month with appealing power. , It becomes easier to recognize the tendency while comparing and referring to the results of the past months.
- the degree of overlap between the budget graph 375 displayed earlier and the graph 376 of the previous term's actual results can be tracked monthly and monthly, and the plan and actual results can be sequentially tracked over time. It is possible to understand the divergence and the tendency of the difference between the previous term results and the current term results.
- the display order is arranged and displayed in order intentionally, and it is possible to realize the transition tendency more than can be obtained from the fixedly displayed graph.
- the screen of FIG. 38 shows a state in which the graph 377 of the current term results up to the elapsed month has been sequentially animated and displayed.
- the graphs 375 and 376 of the previous term / budget can be displayed in animation at the same time as the graph 377 of the current term results.
- the key index presentation unit 42 displays the color distribution analysis table 390 by product and sales office shown in FIG. 39. Is displayed as an animation along the display flow (story).
- a START (store order) button 391 and a START (category order) button 392 are provided in the color distribution analysis table 390 by product and sales office.
- the vertical axis represents the product type and the horizontal axis represents the sales office.
- the key index calculation unit 51 reads the cash register data, daily business report data, etc. from the DB 30, calculates the sales of each product, and outputs the sales to the display control unit 69. Then, from the column of the Nagoya sales office in the color distribution analysis table 390 by product and sales office, the numerical value of the target achievement rate is displayed in animation in a vertical order with a good tempo.
- cash register data, daily business report data, etc. not only daily total sales required for accounting journals, but also detailed data such as daily product, sales office, and person in charge are read out.
- the key index calculation unit 51 reads out data such as cash register data and daily business report data, respectively.
- the display control unit 69 By calculating the sales amount of the product and outputting it to the display control unit 69, the numerical value of the target achievement rate is displayed in animation in the column of the woman's slacks section etc.
- the background color of each column (cell) is displayed in blue as if the sales are "high”, and the numerical value of the target achievement rate is 90%. If it is less than 100%, the background color of each column (cell) is displayed in yellow as if the sales are "medium”. In addition, when the numerical value of the target achievement rate is less than 90%, the background color of each column (cell) is displayed in red as if the sales are "lower".
- the color distribution analysis table 390 by product and sales office shows the animation of "gentleman's slacks” and “gentleman's sweater” from the “Nagoya” sales office to the "Matsuyama” sales office, and then "Gentleman T”. About “shirts” The numbers are displayed in animation from the "Nagoya” sales office to the "Tokyo” sales office.
- the color distribution analysis table 390 by product and sales office in FIG. 39 is an animation display in which the START (category order) button 392 is clicked and numerical values are displayed in order in the row direction in each item column (cell). Shows the state in which is started and progressed halfway.
- the color distribution analysis table 390 by product and sales office in FIG. 40 is a diagram showing a state in which the animation display has progressed thereafter and all the display has been completed.
- the START (store order) button 391 displays the numerical values vertically in sequence at a good tempo
- the START (category order) button 392 displays one row. Numerical values are displayed in animation at a good tempo next to each other.
- the START (category order) button 392 is used to display the numerical values in the order of the categories next to each line, the numerical values of the corresponding sales office and category are compared with the total numerical values of the corresponding categories. If the value is higher than%, the "ellipse mark” is displayed. That is, it emphasizes that the relevant "sales office” is relatively good in the relevant category. On the contrary, when the value is 50% or more low, an “arrow” is displayed. In other words, it emphasizes that the relevant "sales office” is relatively defective among the relevant “categories”.
- the color distribution analysis table 390 for each product and sales office in FIG. 40 shows a case where the START (category order) button 392 is operated and the lines are displayed horizontally one by one in the order of category.
- START category order
- the total value of the "Men's coat” category is 101.9%, but the value of the "Yokohama" sales office in the "Men's coat” category is 173. Since it is .2%, which is more than 50% higher, it is highlighted with an "ellipse mark".
- the color distribution analysis table 390 by product and sales office is displayed in animation, and the numerical values are sequentially displayed in the order of stores or categories, so that the store and its own store can be displayed. Comparison with other stores can be made even clearer. In addition, it becomes easier to understand the comparison between the category in charge of oneself and the category in charge of another person.
- the key index presenting unit 42 animates the screen 410 of the man-hour sales graph shown in FIG. 41 along the display flow (story).
- the key index calculation unit 51 reads necessary data (accounting data for this month, time card data, etc.) from the DB 30, calculates the man-hour sales, and outputs it to the display control unit 69. By doing so, the display control unit 69 sequentially displays the man-hour sales graph in animation.
- time card data not only the total monthly working hours for each employee required for payroll calculation, but also detailed data such as daily working hours for each employee shall be read out.
- the key index presentation unit 42 starts the animation display and the daily sales line is broken.
- the graph 412 and the bar graph 413 of the working hours are animated and displayed day by day, and then the line graph 414 of the man-hour sales (sales / working hours) is displayed by the animation.
- the screen 410 of the man-hour sales graph of FIG. 41 shows a state in which the graph and the balloon are appropriately displayed while the animation display progresses one day at a time in chronological order, and the display up to the elapsed date is completed. ..
- the profit is calculated by subtracting the cost from the profit, and further, the non-business item and the special item are added or subtracted to calculate the profit.
- Numerical animation is displayed along the flow of the profit and loss structure, and gross profit is calculated by subtracting variable costs from profits as shown in the display examples of the STRAC tables in FIGS. 11 and 12, and fixed costs are further deducted.
- the numerical values are displayed in animation along the flow of the profit and loss structure of calculating the operating profit, but these display examples are just examples, and other methods of displaying the numerical value group based on various causal relationships can be considered. In any case, it is sufficient to present the numerical groups in the order based on the causal relationship of each of the plurality of numerical groups.
- the existing technology is used for the function of the data acquisition department that captures accounting data such as accounting software data, tax calculation software data, bank data, card company data, mail order company data, time card data, cash register data, and company-created data. You may. In addition, data and forms may be obtained directly in cooperation with financial institutions, settlement periods, securities companies, government agencies related to certificate applications, government agencies related to subsidy applications, etc.
- a key index called the operating profit margin based on the relationship between sales and operating profit is displayed in animation in chronological order, and as shown in FIGS. 39 and 40.
- the transition of data may be displayed in an easy-to-understand order by combining the order of time series and the order of flow of explanation (story). That is, the key index according to the business may be presented.
- the key index may be displayed in the form of a table, and the table may be displayed.
- the color of the cell in which the numerical value is inserted may be changed to display the animation.
- a numerical group is animated and displayed in the form of a graph or a table in the order of, for example, January, February, March, etc. (in order of period).
- an image of turning a paper page, a flip book-like display, and an animation display using a video or the like can be considered.
- the graphs and tables displayed in animation were all displayed in two dimensions, but they may be displayed in three dimensions in a three-dimensional space such as a virtual reality space.
- a sound such as BGM music may be played to arouse the story. That is, the present invention is not limited to the display environment, and it is sufficient that the numerical value group can be displayed in animation.
- the man-hour sales transition graph 410 the sales obtained as a whole work in a predetermined period, the working hours of all the employees engaged in the work, and the man-hour sales are displayed on the same screen. Although they are displayed side by side (corresponding), it is not essential to display both sales and working hours, and one of them may be displayed corresponding to the man-hour sales. Further, the three line graphs may be displayed on separate screens. That is, it is sufficient to display the line graph 414 of the man-hour sales as a key index.
- the series of processes described above can be executed by hardware or software.
- the functional configuration of FIG. 3 is merely an example and is not particularly limited. That is, it suffices if the information processing system is provided with a function capable of executing the above-mentioned series of processes as a whole, and what kind of functional block and database is used to realize this function is particularly limited to the example of FIG. Not done.
- the location of the functional block is not particularly limited to FIG. 3, and may be arbitrary.
- the functional block and database of the server 2 may be transferred to the administrator terminal 3.
- one functional block and database may be configured by a single piece of hardware, a single piece of software, or a combination thereof.
- a program constituting the software is installed on a computer or the like from a network or a recording medium.
- the computer may be a computer embedded in dedicated hardware.
- the computer may be a computer capable of executing various functions by installing various programs, for example, a management server, a general-purpose smartphone or a personal computer.
- the computer may be not only a smartphone or a personal computer, but also a tablet, a television, or a device that performs projection mapping. Further, it may be an IoT device or the like that is used by being attached to a household electric appliance or a vehicle.
- a recording medium containing such a program is not only composed of a removable medium (not shown) distributed separately from the device main body to provide the program, but is also provided in a state of being preliminarily incorporated in the device main body. It may be a recording medium or the like.
- the steps for describing a program to be recorded on a recording medium are not necessarily processed in chronological order, but also in parallel or individually, even if they are not necessarily processed in chronological order. It also includes the processing to be executed.
- the term of the system means an overall device composed of a plurality of devices, a plurality of means, and the like.
- the information processing device to which the present invention is applied is A presentation means for presenting the numerical group in an order based on the causal relationship of each of the plurality of numerical groups (for example, the numerical group presenting unit 43 in FIG. 3).
- a presentation means for presenting the numerical group in an order based on the causal relationship of each of the plurality of numerical groups for example, the numerical group presenting unit 43 in FIG. 3.
- an information processing device for example, server 1 in FIG. 3
- organizing the flow of thought, and expressing the causal relationship between numerical values and results by adding storylines, for example, the manager of a company. Etc. will make it easier to set out the activity policy and direction of the company in the future.
- the presentation means A means to output a numerical group related to accounting processing as data of business processing in a company,
- a display control means that animates the numerical group in the order of the causal relationship or the period caused by the causal relationship. To be equipped. In this way, by animating a group of numerical values related to accounting processing in the order of causal relationships, for example, it becomes possible to better understand the actual business conditions of a company and to easily set out future activity policies and directions of the company.
- the presentation means for example, the numerical group presentation unit 43 in FIG.
- Budget performance calculation means for example, to obtain the above numerical group as a result of calculating the difference between the budget and the actual result for each predetermined period (monthly, etc.) in the business or the difference between the actual results for two periods (difference between the current period and the previous period, etc.) Budget performance calculation unit 61, etc. in Fig. 3) and A display control means (display control means) that animates the numerical value group obtained by the budget actual calculation means in the form of a graph or a table in the order of a period such as monthly (June, July, August, etc.).
- the presentation means (for example, the numerical group presentation unit 43 in FIG. 3) is Based on the accounting data for the past two periods (the previous period and the period before the previous period, etc.), the cash increase / decrease amount for the past predetermined period (1 year) is calculated for the full period (1 year) and used as the above numerical group.
- Calculation means for example, past cache calculation unit 62 in FIG.
- the cash amount required for each account item to achieve the specified target cash acquisition amount for the current period is calculated and used as the numerical group for the current period cash calculation means (for example).
- This term cache calculation unit 63 etc. in Fig. 3) and The specified numerical group (cash increase / decrease amount) of the cash increase / decrease amount for each past account item or the target cash acquisition amount for the current period is animated and displayed in the order of the account items (item order arranged vertically in the table).
- Display control means for example, display control unit 69 in FIG. 3) and To be equipped.
- the presentation means (for example, the numerical group presentation unit 43 in FIG. 3) is Based on the business target amount (including, for example, target sales, target cash amount, etc.) to be achieved in the predetermined period (1 year), the predetermined period (1 year) is divided into unit periods (every month).
- a business plan generation means (for example, the business plan generation unit 65 in FIG. 3) that generates detailed data of a business plan divided into an elapsed period and an unexpired period.
- At least one of the elapsed period and the unexpired period is displayed in the order of account items and the period (January, February, March ...
- Display control means for example, display control unit 69 in FIG. 3 that displays animation in the order of at least one of To be equipped.
- the business can be carried out as planned in the predetermined period. It is possible to formulate future business plans after devising business tactics to achieve them.
- the presentation means for example, the numerical group presentation unit 43 in FIG.
- Aggregation means for aggregating numerical groups such as cash deposit balance, accounts receivable balance, borrowing balance, utility bill generation amount, etc., including factors that fluctuate in a unit period (daily unit) while a company is active.
- a display control means for example, a display control unit 69 in FIG. 3 that animates the numerical group aggregated for each unit period (daily unit) by the aggregation means in the order of the unit period. To be equipped.
- numerical groups including fluctuation factors are aggregated for each unit period (daily unit) for a predetermined period, for example, 365 days.
- a predetermined period for example, 365 days.
- By animating the cash balance transition table that shows the transition of it is possible to grasp the daily changes (transitions) of the bank's cash balance, accounts receivable balance, borrowing balance, utility bills, etc., after a few days, etc. It is possible to take measures such as increasing the cash deposit balance of the bank or increasing the deposit balance of the financial institution to which the utility bill is withdrawn before the bank runs out of funds or the water supply is stopped.
- the presentation means for example, the numerical group presentation unit 43 in FIG.
- a tax amount calculation means (for example, the tax amount calculation unit 66 in FIG. 3) that obtains the numerical value group as a result of calculating the annual forecast tax amount from accounting data such as profit amount and taxable income amount, and tax data.
- a display control means (for example, a display control unit 69 in FIG. 3) that animates the numerical value group obtained by the tax amount calculation means in the order of items according to the flow of the tax amount calculation basis. To be equipped. This makes it possible to confirm the estimated annual tax amount, etc. while understanding the basis for calculating the tax amount, and to formulate a tax payment strategy for this term while comparing it with the annual tax amount, etc. of the previous term.
- the presentation means (for example, the numerical group presentation unit 43 in FIG.
- Annual total amount calculation means for example, transition calculation unit 67 in FIG. 3 that obtains the numerical value group as a result of calculating the annual total amount from accounting data such as the monthly transition amount of sales and profit amount in the previous period, the previous period, and the current period. Etc.
- a display control means for example, the display control unit of FIG. 3) in which the numerical values obtained by the annual total amount calculation means are arranged in the order of the months of the annual total graph and an animation is displayed so that the line graph extends in the horizontal axis direction. 69 etc.) and To be equipped.
- the presentation means for example, the numerical group presentation unit 43 in FIG.
- the information processing device to which the present invention is applied is A second presenting means (for example, the key index presenting unit 42 in FIG. 3) for presenting the key index according to the business is provided.
- the second presenting means for example, the key index presenting unit 42 in FIG. 3) is A display control means for displaying the key index in the form of a graph (for example, the hourly sales transition graph 410 in FIG. 41) or a table (for example, the display control unit 52 in FIG. 3). To be equipped.
- the display control means (for example, the display control unit 52 in FIG. 3) is The key index is displayed in animation in the order of time series or the flow of calculation (explanation) (for example, the man-hour sales transition graph 410 (line graph, bar graph, etc.) in FIG. 41 is animated).
- the key index becomes meaningful information rather than a mere numerical value, etc., and by presenting it, the information called the key index can be taken seriously.
- the display control means for example, the display control unit 52 in FIG.
- the display control unit 52 determines at least one of the sales obtained as a whole business in a predetermined period and the working hours of all the employees engaged in the business per unit time of the employee. Display according to sales (for example, man-hour sales, etc.). In this way, by displaying the sales obtained as a whole business, the working hours of all employees, and the sales per unit time of one employee (for example, sales per person), it is a key index. As a result, the relationship between changes in hourly sales and working hours and sales can be clearly understood.
- the second presenting means (for example, the key index presenting unit 42 in FIG. 3) is The sales per unit time of one employee (for example, the line graph 414 of the hourly sales transition graph 410 in FIG. 41 and its value, etc.) are presented as the key index.
- the changes in the sales per unit time of one employee for example, the value in the line graph 414 of the line graph 414 of the hourly sales transition graph 410 in FIG. 41, is the sales of the work commensurate with the labor force? Can be judged.
- the second presenting means (for example, the key index presenting unit 42 in FIG. 3) is
- the sales per unit time of one employee (for example, the line graph 414 of the line graph 410 of the man-hour sales transition graph 410 in FIG. 41 and its value, etc.) can be obtained as the entire business in a predetermined period (the value of the line 411). ) Divided by the working hours (value of bar graph 412) of all employees in the predetermined period (for example, the key index calculation unit 51 in FIG. 4), To be equipped. In this way, the sales per unit time of one employee obtained by dividing the sales (value of line 411) obtained as a whole business in a predetermined period by the working hours (value of bar graph 412) of all employees in a predetermined period.
- By using high as a key index it is possible to judge whether or not appropriate sales are being made for the labor force, which can be used for future business improvement.
Landscapes
- Engineering & Computer Science (AREA)
- Business, Economics & Management (AREA)
- Physics & Mathematics (AREA)
- Theoretical Computer Science (AREA)
- General Physics & Mathematics (AREA)
- Economics (AREA)
- Marketing (AREA)
- Strategic Management (AREA)
- General Business, Economics & Management (AREA)
- Finance (AREA)
- Technology Law (AREA)
- Development Economics (AREA)
- Accounting & Taxation (AREA)
- Entrepreneurship & Innovation (AREA)
- Human Resources & Organizations (AREA)
- Operations Research (AREA)
- Quality & Reliability (AREA)
- Tourism & Hospitality (AREA)
- Management, Administration, Business Operations System, And Electronic Commerce (AREA)
- Financial Or Insurance-Related Operations Such As Payment And Settlement (AREA)
- User Interface Of Digital Computer (AREA)
Priority Applications (6)
| Application Number | Priority Date | Filing Date | Title |
|---|---|---|---|
| JP2021567694A JP7180050B2 (ja) | 2019-12-27 | 2020-12-25 | 情報処理装置、情報処理方法およびプログラム |
| JP2022169646A JP7329282B2 (ja) | 2019-12-27 | 2022-10-24 | 情報処理方法 |
| JP2023124918A JP7539184B2 (ja) | 2019-12-27 | 2023-07-31 | 情報処理方法 |
| JP2024128998A JP7638040B2 (ja) | 2019-12-27 | 2024-08-05 | 情報処理方法 |
| JP2025019909A JP7812166B2 (ja) | 2019-12-27 | 2025-02-10 | 情報処理方法 |
| JP2026008428A JP2026063314A (ja) | 2019-12-27 | 2026-01-21 | 情報処理装置、情報処理方法およびプログラム |
Applications Claiming Priority (2)
| Application Number | Priority Date | Filing Date | Title |
|---|---|---|---|
| JP2019-239608 | 2019-12-27 | ||
| JP2019239608 | 2019-12-27 |
Publications (1)
| Publication Number | Publication Date |
|---|---|
| WO2021132603A1 true WO2021132603A1 (ja) | 2021-07-01 |
Family
ID=76574773
Family Applications (1)
| Application Number | Title | Priority Date | Filing Date |
|---|---|---|---|
| PCT/JP2020/048847 Ceased WO2021132603A1 (ja) | 2019-12-27 | 2020-12-25 | 情報処理装置、情報処理方法およびプログラム |
Country Status (2)
| Country | Link |
|---|---|
| JP (6) | JP7180050B2 (https=) |
| WO (1) | WO2021132603A1 (https=) |
Cited By (4)
| Publication number | Priority date | Publication date | Assignee | Title |
|---|---|---|---|---|
| JP2023115800A (ja) * | 2022-02-08 | 2023-08-21 | 株式会社オービック | 着地予想値管理装置、着地予想値管理方法、及び、着地予想値管理プログラム |
| JP2023132878A (ja) * | 2022-03-11 | 2023-09-22 | パナソニックIpマネジメント株式会社 | 店舗管理システム、店舗管理装置、および店舗管理方法 |
| JP2023132879A (ja) * | 2022-03-11 | 2023-09-22 | パナソニックIpマネジメント株式会社 | 店舗管理システム、店舗管理装置、および店舗管理方法 |
| JP7481780B1 (ja) | 2024-01-01 | 2024-05-13 | ミライ人事株式会社 | 財務分析装置、及び財務分析プログラム |
Families Citing this family (2)
| Publication number | Priority date | Publication date | Assignee | Title |
|---|---|---|---|---|
| DE102019211921A1 (de) * | 2019-08-08 | 2021-02-11 | Schmid Silicon Technology Gmbh | Verfahren und Vorrichtung zur Erzeugung siliziumhaltiger Materialien |
| JP7653494B1 (ja) | 2023-11-09 | 2025-03-28 | 株式会社マネーフォワード | 情報処理システム及びプログラム |
Citations (3)
| Publication number | Priority date | Publication date | Assignee | Title |
|---|---|---|---|---|
| JP2007323680A (ja) * | 2007-09-10 | 2007-12-13 | Hitachi Ltd | 経営意思決定支援システム |
| JP2019028501A (ja) * | 2017-07-25 | 2019-02-21 | 株式会社ルーツ・コーポレーション | 不動産投資シミュレーションシステム、不動産投資シミュレーションプログラムおよび不動産投資シミュレーション方法 |
| US20190251731A1 (en) * | 2016-10-19 | 2019-08-15 | Alibaba Group Holding Limited | Method and apparatus for animating images on mobile devices |
Family Cites Families (7)
| Publication number | Priority date | Publication date | Assignee | Title |
|---|---|---|---|---|
| JP2003141321A (ja) * | 2001-10-31 | 2003-05-16 | Kiyoshi Iiizumi | 経済付加価値計算のための税引後営業利益及び投下資本簿価の算出システム及びそのプログラム |
| JP2004078800A (ja) | 2002-08-22 | 2004-03-11 | Lead Computer:Kk | 経営管理用データ作成方法 |
| JP2006123396A (ja) | 2004-10-29 | 2006-05-18 | Power Zaimu Kk | 財務成績表、資金別貸借対照表、資金格付表及び資金格付方法 |
| JP2008071105A (ja) | 2006-09-14 | 2008-03-27 | Masuken Kaikeijin Net Kk | 経営計画指導システム及び経営計画指導用プログラム |
| JP2013114533A (ja) * | 2011-11-30 | 2013-06-10 | Nobuyoshi Kurami | プロセス営業損益・キャッシュフロー計算書用プログラム |
| JP6134107B2 (ja) * | 2012-08-28 | 2017-05-24 | 株式会社オービックビジネスコンサルタント | 情報処理装置、情報処理方法、およびプログラム |
| JP6023375B1 (ja) | 2016-03-30 | 2016-11-09 | 株式会社日本デジタル研究所 | 図表生成システム、図表処理システム、図表生成方法及びプログラム |
-
2020
- 2020-12-25 JP JP2021567694A patent/JP7180050B2/ja active Active
- 2020-12-25 WO PCT/JP2020/048847 patent/WO2021132603A1/ja not_active Ceased
-
2022
- 2022-10-24 JP JP2022169646A patent/JP7329282B2/ja active Active
-
2023
- 2023-07-31 JP JP2023124918A patent/JP7539184B2/ja active Active
-
2024
- 2024-08-05 JP JP2024128998A patent/JP7638040B2/ja active Active
-
2025
- 2025-02-10 JP JP2025019909A patent/JP7812166B2/ja active Active
-
2026
- 2026-01-21 JP JP2026008428A patent/JP2026063314A/ja active Pending
Patent Citations (3)
| Publication number | Priority date | Publication date | Assignee | Title |
|---|---|---|---|---|
| JP2007323680A (ja) * | 2007-09-10 | 2007-12-13 | Hitachi Ltd | 経営意思決定支援システム |
| US20190251731A1 (en) * | 2016-10-19 | 2019-08-15 | Alibaba Group Holding Limited | Method and apparatus for animating images on mobile devices |
| JP2019028501A (ja) * | 2017-07-25 | 2019-02-21 | 株式会社ルーツ・コーポレーション | 不動産投資シミュレーションシステム、不動産投資シミュレーションプログラムおよび不動産投資シミュレーション方法 |
Non-Patent Citations (1)
| Title |
|---|
| HIRAI, AKIO ET AL.: "Immediately usable at work site! Business Data Analysis with Excel", EXCEL, 2010, Tokyo, pages 298 - 301, ISBN: 978-4-7741-4401-6 * |
Cited By (8)
| Publication number | Priority date | Publication date | Assignee | Title |
|---|---|---|---|---|
| JP2023115800A (ja) * | 2022-02-08 | 2023-08-21 | 株式会社オービック | 着地予想値管理装置、着地予想値管理方法、及び、着地予想値管理プログラム |
| JP7644038B2 (ja) | 2022-02-08 | 2025-03-11 | 株式会社オービック | 着地予想値管理装置、着地予想値管理方法、及び、着地予想値管理プログラム |
| JP2023132878A (ja) * | 2022-03-11 | 2023-09-22 | パナソニックIpマネジメント株式会社 | 店舗管理システム、店舗管理装置、および店舗管理方法 |
| JP2023132879A (ja) * | 2022-03-11 | 2023-09-22 | パナソニックIpマネジメント株式会社 | 店舗管理システム、店舗管理装置、および店舗管理方法 |
| JP7481381B2 (ja) | 2022-03-11 | 2024-05-10 | パナソニックIpマネジメント株式会社 | 店舗管理システム、店舗管理装置、サーバ装置および店舗管理方法 |
| JP7829162B2 (ja) | 2022-03-11 | 2026-03-13 | パナソニックIpマネジメント株式会社 | 店舗管理システム、店舗管理装置、および店舗管理方法 |
| JP7481780B1 (ja) | 2024-01-01 | 2024-05-13 | ミライ人事株式会社 | 財務分析装置、及び財務分析プログラム |
| JP2025106068A (ja) * | 2024-01-01 | 2025-07-11 | ミライ人事株式会社 | 財務分析装置、及び財務分析プログラム |
Also Published As
| Publication number | Publication date |
|---|---|
| JP7638040B2 (ja) | 2025-03-03 |
| JP2022183369A (ja) | 2022-12-08 |
| JP2025069445A (ja) | 2025-04-30 |
| JP7539184B2 (ja) | 2024-08-23 |
| JP2026063314A (ja) | 2026-04-10 |
| JPWO2021132603A1 (https=) | 2021-07-01 |
| JP2023129730A (ja) | 2023-09-14 |
| JP7329282B2 (ja) | 2023-08-18 |
| JP2024149684A (ja) | 2024-10-18 |
| JP7180050B2 (ja) | 2022-11-30 |
| JP7812166B2 (ja) | 2026-02-09 |
Similar Documents
| Publication | Publication Date | Title |
|---|---|---|
| JP7812166B2 (ja) | 情報処理方法 | |
| Narayanaswamy | Financial accounting: a managerial perspective | |
| JP3247356B2 (ja) | 資産運用助言システム及びそのプログラムを収録した記録媒体 | |
| US20020095363A1 (en) | Financial planning and counseling system projecting user cash flow | |
| Mella | Performance indicators in business value-creating organizations | |
| Carlon et al. | Financial accounting: Reporting, analysis and decision making | |
| WO2011109576A1 (en) | System and methods for management of real property and for comparing real properties for purchase | |
| JP6849963B2 (ja) | 経営計画生成装置、経営計画生成方法、コンピュータ読み取り可能な記録媒体 | |
| JP7791594B2 (ja) | ビジネスマネジメント学習システム | |
| KR20110014059A (ko) | 개선된 형태의 변액보험설계용 스프래드쉬트 | |
| JP6882971B2 (ja) | 経時的世帯キャッシュフローシミュレーション装置 | |
| CA2390010A1 (en) | A financial planning and counseling system projecting | |
| Brookson | DK Essential Managers: Understanding Accounts | |
| Asamoah | Developing an Accounting Information System for a Restaurant and Understanding Its Potential Impact on the Business | |
| Plowman | The cost of the customer | |
| JP2011227791A (ja) | 資金繰り予測コンピュータ・プログラム | |
| Hill et al. | Decision support in a guaranteed student loan program: Design and implementation of a model-based system | |
| Cannon et al. | Accounting for company reputation: Variations on the Gold standard | |
| US20220108392A1 (en) | Platform for accessible, crowdfunded property ownership | |
| BIN | FINANCIAL ACCOUNTING UNDER THE NETWORK ECONOMY--A CASE STUDY OF INSPUR ELECTRONIC INFORMATION INDUSTRY CO., LTD | |
| Dogbe | Adoption and effectiveness of Computerized Accounting Systems in public senior high schools in Asante Akim Dstrict, Ghana. | |
| Glenn et al. | Intermediate Financial Accounting | |
| Nguyen | Modeling tax competition in developing countries: a theoretical and empirical analysis | |
| KR101070602B1 (ko) | 재무 설계 시뮬레이션 정보 제공 시스템, 그 정보 제공 방법 및 상기 방법이 실행되는 기록매체 | |
| CN117993873A (zh) | 一种基于链股的人力资本数智化系统 |
Legal Events
| Date | Code | Title | Description |
|---|---|---|---|
| 121 | Ep: the epo has been informed by wipo that ep was designated in this application |
Ref document number: 20905212 Country of ref document: EP Kind code of ref document: A1 |
|
| ENP | Entry into the national phase |
Ref document number: 2021567694 Country of ref document: JP Kind code of ref document: A |
|
| NENP | Non-entry into the national phase |
Ref country code: DE |
|
| 122 | Ep: pct application non-entry in european phase |
Ref document number: 20905212 Country of ref document: EP Kind code of ref document: A1 |