WO2021048984A1 - 絞り発生予測システム - Google Patents
絞り発生予測システム Download PDFInfo
- Publication number
- WO2021048984A1 WO2021048984A1 PCT/JP2019/035971 JP2019035971W WO2021048984A1 WO 2021048984 A1 WO2021048984 A1 WO 2021048984A1 JP 2019035971 W JP2019035971 W JP 2019035971W WO 2021048984 A1 WO2021048984 A1 WO 2021048984A1
- Authority
- WO
- WIPO (PCT)
- Prior art keywords
- data
- rolling
- adaptive model
- occurrence
- rolling path
- Prior art date
Links
Images


Classifications
-
- B—PERFORMING OPERATIONS; TRANSPORTING
- B21—MECHANICAL METAL-WORKING WITHOUT ESSENTIALLY REMOVING MATERIAL; PUNCHING METAL
- B21B—ROLLING OF METAL
- B21B37/00—Control devices or methods specially adapted for metal-rolling mills or the work produced thereby
- B21B37/58—Roll-force control; Roll-gap control
-
- B—PERFORMING OPERATIONS; TRANSPORTING
- B21—MECHANICAL METAL-WORKING WITHOUT ESSENTIALLY REMOVING MATERIAL; PUNCHING METAL
- B21B—ROLLING OF METAL
- B21B37/00—Control devices or methods specially adapted for metal-rolling mills or the work produced thereby
- B21B37/68—Camber or steering control for strip, sheets or plates, e.g. preventing meandering
-
- B—PERFORMING OPERATIONS; TRANSPORTING
- B21—MECHANICAL METAL-WORKING WITHOUT ESSENTIALLY REMOVING MATERIAL; PUNCHING METAL
- B21B—ROLLING OF METAL
- B21B1/00—Metal-rolling methods or mills for making semi-finished products of solid or profiled cross-section; Sequence of operations in milling trains; Layout of rolling-mill plant, e.g. grouping of stands; Succession of passes or of sectional pass alternations
- B21B1/22—Metal-rolling methods or mills for making semi-finished products of solid or profiled cross-section; Sequence of operations in milling trains; Layout of rolling-mill plant, e.g. grouping of stands; Succession of passes or of sectional pass alternations for rolling plates, strips, bands or sheets of indefinite length
- B21B1/24—Metal-rolling methods or mills for making semi-finished products of solid or profiled cross-section; Sequence of operations in milling trains; Layout of rolling-mill plant, e.g. grouping of stands; Succession of passes or of sectional pass alternations for rolling plates, strips, bands or sheets of indefinite length in a continuous or semi-continuous process
- B21B1/26—Metal-rolling methods or mills for making semi-finished products of solid or profiled cross-section; Sequence of operations in milling trains; Layout of rolling-mill plant, e.g. grouping of stands; Succession of passes or of sectional pass alternations for rolling plates, strips, bands or sheets of indefinite length in a continuous or semi-continuous process by hot-rolling, e.g. Steckel hot mill
-
- G—PHYSICS
- G05—CONTROLLING; REGULATING
- G05B—CONTROL OR REGULATING SYSTEMS IN GENERAL; FUNCTIONAL ELEMENTS OF SUCH SYSTEMS; MONITORING OR TESTING ARRANGEMENTS FOR SUCH SYSTEMS OR ELEMENTS
- G05B13/00—Adaptive control systems, i.e. systems automatically adjusting themselves to have a performance which is optimum according to some preassigned criterion
- G05B13/02—Adaptive control systems, i.e. systems automatically adjusting themselves to have a performance which is optimum according to some preassigned criterion electric
- G05B13/0265—Adaptive control systems, i.e. systems automatically adjusting themselves to have a performance which is optimum according to some preassigned criterion electric the criterion being a learning criterion
-
- G—PHYSICS
- G05—CONTROLLING; REGULATING
- G05B—CONTROL OR REGULATING SYSTEMS IN GENERAL; FUNCTIONAL ELEMENTS OF SUCH SYSTEMS; MONITORING OR TESTING ARRANGEMENTS FOR SUCH SYSTEMS OR ELEMENTS
- G05B13/00—Adaptive control systems, i.e. systems automatically adjusting themselves to have a performance which is optimum according to some preassigned criterion
- G05B13/02—Adaptive control systems, i.e. systems automatically adjusting themselves to have a performance which is optimum according to some preassigned criterion electric
- G05B13/04—Adaptive control systems, i.e. systems automatically adjusting themselves to have a performance which is optimum according to some preassigned criterion electric involving the use of models or simulators
- G05B13/048—Adaptive control systems, i.e. systems automatically adjusting themselves to have a performance which is optimum according to some preassigned criterion electric involving the use of models or simulators using a predictor
-
- G—PHYSICS
- G05—CONTROLLING; REGULATING
- G05B—CONTROL OR REGULATING SYSTEMS IN GENERAL; FUNCTIONAL ELEMENTS OF SUCH SYSTEMS; MONITORING OR TESTING ARRANGEMENTS FOR SUCH SYSTEMS OR ELEMENTS
- G05B19/00—Programme-control systems
- G05B19/02—Programme-control systems electric
- G05B19/418—Total factory control, i.e. centrally controlling a plurality of machines, e.g. direct or distributed numerical control [DNC], flexible manufacturing systems [FMS], integrated manufacturing systems [IMS], computer integrated manufacturing [CIM]
- G05B19/41875—Total factory control, i.e. centrally controlling a plurality of machines, e.g. direct or distributed numerical control [DNC], flexible manufacturing systems [FMS], integrated manufacturing systems [IMS], computer integrated manufacturing [CIM] characterised by quality surveillance of production
-
- G—PHYSICS
- G05—CONTROLLING; REGULATING
- G05B—CONTROL OR REGULATING SYSTEMS IN GENERAL; FUNCTIONAL ELEMENTS OF SUCH SYSTEMS; MONITORING OR TESTING ARRANGEMENTS FOR SUCH SYSTEMS OR ELEMENTS
- G05B2219/00—Program-control systems
- G05B2219/30—Nc systems
- G05B2219/32—Operator till task planning
- G05B2219/32182—If state of tool, product deviates from standard, adjust system, feedback
-
- G—PHYSICS
- G05—CONTROLLING; REGULATING
- G05B—CONTROL OR REGULATING SYSTEMS IN GENERAL; FUNCTIONAL ELEMENTS OF SUCH SYSTEMS; MONITORING OR TESTING ARRANGEMENTS FOR SUCH SYSTEMS OR ELEMENTS
- G05B2219/00—Program-control systems
- G05B2219/30—Nc systems
- G05B2219/32—Operator till task planning
- G05B2219/32193—Ann, neural base quality management
-
- G—PHYSICS
- G05—CONTROLLING; REGULATING
- G05B—CONTROL OR REGULATING SYSTEMS IN GENERAL; FUNCTIONAL ELEMENTS OF SUCH SYSTEMS; MONITORING OR TESTING ARRANGEMENTS FOR SUCH SYSTEMS OR ELEMENTS
- G05B2219/00—Program-control systems
- G05B2219/30—Nc systems
- G05B2219/32—Operator till task planning
- G05B2219/32194—Quality prediction
Definitions
- the present invention relates to a system for predicting in advance that drawing will occur in a rolled material in hot rolling in which a plate-shaped metal material is heated to a high temperature and rolled in a plurality of rolling passes.
- the rolling mill rolls and thins lumps of steel materials and non-ferrous materials such as aluminum and copper, making it easier to process them into automobiles and electrical products.
- rolling mills such as a hot sheet rolling mill for rolling sheet materials, a thick sheet rolling mill, a cold rolling mill, and a rolling mill for rolling bar and wire rods.
- a hot sheet rolling mill that rolls rolled materials one by one at high speed in batch.
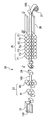
- FIG. 12 is a diagram showing an example of the configuration of a rolling mill in a conventional hot sheet rolling process.
- the rolling mill 20 shown in FIG. 12 includes various devices such as a heating furnace 21, a rough rolling mill 22, a bar heater 24, a finishing rolling mill 25, a runout table 26, and a winder 27.
- the rolled material 100 heated in the heating furnace 21 is rolled by the rough rolling mill 22.
- the rolled material 100 rolled by the rough rolling mill 22 is conveyed to the finishing rolling mill 25 via the bar heater 24.
- the rolled material 100 rolled by the finish rolling mill 25 is cooled by the runout table 26 and then wound into a coil by the winder 27.
- the final product is a coiled thin plate made by thinly rolling the rolled material 100.
- the rough rolling mill 22 shown in FIG. 12 has a rolling stand R1 having one upper and lower work roll, and a rolling stand R2 having a total of four rolls of the upper and lower work rolls and the upper and lower backup rolls having a larger diameter. ..
- the finishing rolling mill 25 shown in FIG. 12 has seven rolling stands F1 to F7 arranged in series. Each rolling stand F1 to F7 of the finishing rolling mill 25 is composed of four upper and lower rolls in the example shown in FIG. 12, but is composed of six upper and lower rolls including an intermediate roll inserted between the work roll and the backup roll. It may be configured. Although detailed specifications such as a large-capacity electric motor for driving the upper and lower rolling rolls and a shaft connecting the rolls and the electric motor are different, the configurations of the devices are often similar.
- Side guides (not shown) are installed on the entrance side of each rolling stand of the rough rolling mill 22 and the finishing rolling mill 25.
- the rolled material is often stopped before rolling the material, the opening degree of the side guide is narrowed, the rolled material is sandwiched, centered, and then rolled.
- the opening degree of the side guide is often set in advance with a width obtained by adding a margin to the width of the rolled material.
- the drawing of the rolled material is a phenomenon that occurs at the tip or the tail end of the rolled material when the rolled material meanders directly under the rolling stand, that is, moves in the roll width direction or bends in the width direction.
- the drawing includes a tip drawing generated at the tip of the rolled material and a tail end drawing generated at the tail end of the rolled material.
- the tip drawing is such that due to the meandering of the rolled material and the bending of the tip of the rolled material, the tip of the rolled material catches on the entry side guide before it enters the rolling stand, and the tip is bent while entering the rolling stand. appear.
- the tail end drawing is such that the tail end of the rolled material meanders before passing through the rolling stand, so that the tail end collides with the entry side guide, or the tail end is rolled while being folded into two pieces. It occurs when the load is concentrated on the folded part and that part is torn off.
- the roll surface When squeezing occurs, the roll surface may be scratched. In order to prevent the flaws from being transferred to the surface of the next rolled material, the operation may be temporarily stopped and the roll may be removed for inspection. Also, torn pieces of material may remain in the rolling mill. In this case as well, inspection is required because the scraps may hinder the plate-passability of the material to be rolled next. These operations reduce productivity and thus roll intensity.
- Countermeasure A The operator takes measures in advance for rolled materials that are prone to drawing.
- Countermeasure B The operator responds immediately to the occurrence of aperture.
- Countermeasure C Apply automatic meandering control that suppresses meandering at the tail end.
- Rolled materials that are prone to drawing include those with a thin product thickness, those with a small plate crown, and specific steel types. Especially in the latter stage of the finishing rolling mill where the plate thickness is thin and the rolling speed is high, drawing is likely to occur.
- the operator takes measures against such a rolled material and the situation while observing the meandering state of the rolled material on the upstream side.
- the operator must deal with various situations such as reduction and speed, and the degree of skill varies from operator to operator, so that it is not always possible to deal with the situation accurately.
- measure B the operator tries to correct the meandering when it starts.
- meandering is a phenomenon that progresses rapidly, it is not always possible for the operator to respond appropriately.
- Countermeasure C is effective in suppressing meandering, but it is controlled after the meandering has started, and it does not predict the occurrence of meandering in advance. Further, for example, as disclosed in Patent Document 1 and Patent Document 2, meandering control has been tackled for some time. Although the specific method of the prior art disclosed in Patent Documents 1 and 2 is different, the meandering amount of the rolled material is calculated and controlled by using the calculation to suppress the meandering amount and prevent drawing. To do. However, it is also a fact that the target of meandering control is an unstable system, which is difficult to control, and there is no effective control means.
- the present invention has been made in view of such a problem, and an object of the present invention is to provide a diaphragm generation prediction system capable of predicting the presence / absence and location of diaphragm generation.
- the drawing generation prediction system is used in hot rolling in which a plate-shaped metal material is heated to a high temperature and rolled in a plurality of rolling passes.
- a system that predicts the occurrence of rolling which is a phenomenon that occurs, and includes one or more computers.
- One or more computers collect and store adaptive model construction data used to build an adaptive model for predicting the occurrence of aperture, and construct an adaptive model using the adaptive model construction data.
- the process of saving the adaptation complete model, which is the adaptive model for which construction has been completed, the process of collecting the prediction data used for predicting the occurrence of the aperture, and the process of inputting the prediction data into the adaptation completion model predicts the occurrence of the aperture. It is programmed to perform the processing to be performed.
- one or more computers provided in the throttle generation prediction system generate the throttle in the target rolling path to be the target of the throttle generation prediction as the adaptive model construction data. Same as the first data indicating the presence / absence and the location of occurrence, and the information on the preceding rolling path when the rolled material associated with the first data is rolled in the preceding rolling path that precedes the target rolling path in the rolling order. Collect a plurality of sets of the second data including the attributes related to the rolled material.
- prediction data information on the same leading rolling path when the rolled material to be predicted is rolled in the preceding rolling pass that precedes the target rolling pass in the rolling order and the same rolled material. Collect data including attributes related to.
- the presence or absence of drawing and all or part of the occurrence of drawing in the target rolling path are predicted before the rolling material to be predicted reaches the target rolling path.
- One or more computers included in the aperture generation prediction system may be programmed to execute a process of displaying the prediction result of the aperture occurrence on the display device.
- One or more computers included in the drawing generation prediction system may be programmed to execute a process of operating the entry side guide of the target rolling path when it is predicted that drawing will occur in the target rolling path.
- the process of operating the entry side guide it is specified at which end of the rolled material to be predicted, the tip end or the tail end, where the drawing occurs, and the entry side side is matched with the passage of the end where the drawing occurs. You may open the guide. Further, it is possible to specify which side of the target rolling path, the driver's cab side or the electric motor side, the drawing is generated, and open the entry side guide on the side where the drawing is generated. If it is not possible to specify which side of the target rolling path, the cab side or the motor side, the throttle is generated, the entry side guides on both the cab side and the motor side may be opened.
- an adaptive model may be constructed by machine learning or a statistical method that falls into the category of artificial intelligence, and the adaptive model may be updated every time a certain number of new adaptive model construction data are obtained.
- the drawing In the process of collecting and storing the data for constructing the adaptive model, it may be determined whether or not the drawing is generated in the target rolling path and the location where the drawing is generated by analyzing the image data of the rolled material that has passed through the target rolling path.
- the presence / absence and location of the drawing in the target rolling pass may be determined based on the load applied to the entry side guide of the target rolling pass. Further, the presence / absence and the location of the drawing in the target rolling path input by the operator via the HMI may be accepted.
- the drawing generation prediction system According to the drawing generation prediction system according to the present invention, data including information on the presence or absence of drawing occurrence prediction of the rolled material is collected, an adaptive model is constructed by machine learning or a statistical method, and the upstream side of the rolling path to be predicted.
- an adaptive model is constructed by machine learning or a statistical method, and the upstream side of the rolling path to be predicted.
- the presence or absence of drawing and the location of drawing in the material to be rolled next are predicted in advance.
- the prediction is made based on the actual machine data, there is an advantage that it can follow the change of the actual machine situation.
- FIG. 1 is a block diagram showing a configuration of an aperture generation prediction system according to the first embodiment of the present invention.
- the drawing generation prediction system of the present embodiment is applied to a hot sheet rolling process having the configuration shown in FIG.
- the aperture generation prediction system includes a prediction device 10 that collects and stores data related to prediction and performs calculations using the data.
- the prediction device 10 may be composed of a single computer or a plurality of computers connected to a network.
- the prediction device 10 includes an adaptive model construction data collection / storage unit 1, an adaptive model construction unit 2, a prediction data collection unit 3, a prediction unit 4, and a result display unit 5.
- the adaptive model construction data collection and storage unit 1, the adaptive model construction unit 2, the prediction data collection unit 3, and the prediction unit 4 are such that the program read from the memory of the computer is executed by the processor. It is realized by the processor as software.
- Various programs and various data used for aperture generation prediction are stored in the memory.
- the memory referred to here includes both a main storage device and an auxiliary storage device.
- the result display unit 5 is a display device connected to a computer.
- the adaptive model construction data collection and storage unit 1 collects and stores the adaptive model construction data for constructing the adaptive model described later.
- the adaptive model construction data includes the first data and the second data.
- the first data is data indicating the presence / absence and location of the occurrence of the drawing at the rolling stand (rolling path) for which the occurrence of the drawing is predicted.
- the locations where the drawing occurs are classified into the tip and the tail in the flow direction (length direction) of the rolled material, and the driver's cab side (Work Side: hereinafter referred to as WS) and the electric motor side (hereinafter referred to as WS) in the width direction of the rolled material.
- Drive Side hereinafter referred to as DS).
- the first data is associated with the identification number (ID) of the rolled material rolled at the target rolling stand and the product information such as the plate thickness and the plate width, and is stored together with the first data.
- ID identification number
- the second data is process data including information on the preceding rolling stand when the rolled material is rolled on the preceding rolling stand that precedes the target rolling stand in the rolling order, and attributes related to the same rolled material.
- Information about the pre-rolling stand includes, for example, information about data items such as roll gap, roll shift amount, rolling load, gauge meter thickness, etc., which can be obtained by sensors.
- the target rolling path for predicting the occurrence of drawing, that is, the target rolling stand is, for example, a stand from the mth stand to the final nth stand (m ⁇ n). Can be done.
- the attributes related to the rolled material are the attributes of the rolled material rolled by the preceding rolling stand, and the identification number of the rolled material, the steel type, the target plate thickness, the target plate width, the target plate crown, the target flatness, and the target temperature. And so on.
- the first data and the second data are linked via the identification number of the rolled material.
- the adaptive model construction data collection and storage unit 1 is connected to an HMI (Human-Machine Interface) (not shown).
- the first data of the adaptive model construction data includes the presence / absence and the location of the occurrence of the diaphragm. These can be entered by the operator via the HMI.
- the location of the iris is generally WS or DS at the tip or tail. However, it is not always easy for the operator to visually judge whether it is WS or DS. Therefore, in order to absorb the ambiguity of the visual measurement, in addition to WS and DS, a location near the center of the plate width (Center of width: hereinafter referred to as CW) may be provided.
- Center of width hereinafter referred to as CW
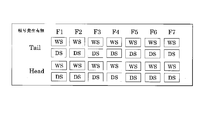
- FIG. 2 is a diagram showing an example of an HMI for the operator to input the presence / absence of aperture generation and the occurrence location.
- the WS and DS shown in the figure are buttons, and are provided for each of the seven rolling stands F1-F7, and for each of the tip side (Head) and the tail end side (Tail). For example, when the third rolling stand F3 visually observes that the drawing has occurred at the WS at the tail end, the operator presses the WS button in the F3 column Tail row.
- a CW button for absorbing the ambiguity of eye measurement may be added.
- instead of adding the CW button if there is an aperture but either WS or DS is unknown, pressing both the WS button and the DS button makes the same judgment as pressing the CW button. You may do so.
- a method of determining whether or not the aperture is generated and the location where the aperture is generated can be used in addition to inputting by the operator based on the image data.
- many TV cameras are installed in rolling mills. Whether or not the tip or tail of the rolled material is drawn by imaging the rolled material that has passed through the rolling stand with a TV camera installed between the rolling stands of the finishing rolling mill and analyzing the obtained image data. , Can be easily determined. When drawing occurs, the rolled material is torn off, and the hot part inside the material looks like streaks. Since the surface temperature of the rolled material is lower than the inside and it is blackish, the high temperature part inside is clearly visible as orange in the torn part. Further, according to the image data, it is easy to determine whether the location where the side guide collides is WS or DS.
- a method of judging by the load applied to the side guide of the rolling stand can also be used.
- the side guide can perform position control or force control, and the force applied to the side guide can be detected by a sensor.
- the drawing is often generated by the meandering of the rolled material, and if the force applied to the side guide is equal to or higher than a certain threshold value, it can be determined that the drawing has occurred. Further, since the force applied to the side guide can be detected independently on the left and right sides, it is possible to determine whether the aperture is generated in WS or DS.
- the adaptive model construction data collection and storage unit 1 inputs the collected and stored data to the adaptive model construction unit 2.
- the adaptation model construction unit 2 constructs the adaptation model 2a using the input data.
- the adaptive model is a model in which the degree of relationship between internal components changes and the output changes when data is input.
- Examples of adaptive models suitable for predicting throttle occurrence include neural networks (hereinafter referred to as NN) and self-organizing maps (hereinafter referred to as SOM) that fall into the category of machine learning. Etc., and adaptive control charts (hereinafter referred to as ACC) using statistical methods can be mentioned.
- NN neural networks
- SOM self-organizing maps
- ACC adaptive control charts
- NN is supervised learning
- SOM unsupervised learning.
- These can also be applied to problems of classifying into two values, such as the presence or absence of an aperture.
- the methods NN, SOM, and ACC are widely known methods. The outline of these methods will be explained later.
- FIG. 3 is a diagram conceptually showing the processing performed by the adaptive model construction unit 2.
- the adaptive model construction unit 2 inputs the second data 301 for constructing the adaptive model into the adaptive model 302 (adaptive model 2a shown in FIG. 1). As a result, the degree of relationship between the internal components changes, and the construction of the adaptive model 302 proceeds. Further, the adaptive model construction unit 2 inputs the first data 303 for constructing the adaptive model into the adaptive model 302 as training data or verification data. When the first data 303 is used as teacher data, the difference between the output of the adaptive model 302 obtained from the second data and the first data 303 is returned to the adaptive model 302 as backpropagation.
- the adaptation model construction unit 2 saves the construction-completed adaptation model 2a as the adaptation completion model 4a separately from the adaptation model 2a.
- the saved adaptation completion model 4a is used in the prediction unit 4 to predict the occurrence of the diaphragm.
- the adaptation completion model 4a is stored separately from the adaptation model 2a because the internal state of the adaptation completion model must not change while predicting the occurrence of the aperture.
- the prediction data collected by the prediction data collection unit 3 is used for predicting the occurrence of the diaphragm using the adaptation completion model 4a.
- the prediction data collection unit 3 collects the same type of data as the second data for constructing the adaptive model as the prediction data. That is, the prediction data collection unit 3 changes the rolling stand to be predicted from the mth stand to the final nth stand in order, and the rolling material to be predicted precedes the rolling stand to be predicted in the rolling order. Collect data including information about the pre-rolling stand when rolled at the stand and attributes about the rolled material to be predicted.
- the prediction data collection unit 3 inputs the collected prediction data into the adaptation completion model 4a.
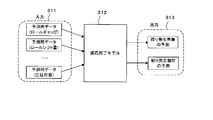
- FIG. 4 is a diagram conceptually showing the processing performed by the prediction unit 4.
- the prediction unit 4 inputs the prediction data 311 into the adaptation completion model 312 (adaptation completion model 4a shown in FIG. 1), and obtains the prediction result of the presence or absence of the aperture as the output 313 of the adaptation completion model 4a. Further, when there is a diaphragm, the prediction result of the occurrence location is also obtained as the output 313 of the adaptation completion model 4a.
- the locations where the diaphragm is generated as a prediction result do not necessarily have to be all the locations, but may be some locations.
- the prediction using the adaptation completion model 312 is performed so that the prediction result can be obtained before the rolled material to be predicted reaches the target rolling stand.
- the prediction unit 4 outputs the prediction result obtained by the adaptation completion model 312 to the result display unit 5.
- the result display unit 5 displays the prediction result to the operator in an easy-to-understand manner. By referring to the prediction result displayed on the result display unit 5, the operator can perform an intervention operation for suppressing the occurrence of the drawing on the rolling stand to be predicted.
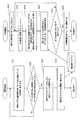
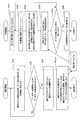
- FIG. 5 is a flowchart showing in detail the processing flow by the aperture generation prediction system of the present embodiment.
- the flowchart on the left side shows the processing flow at the stage of constructing the adaptive model
- the flowchart on the right side shows the processing flow at the prediction stage.
- step 101 is first executed.
- step 101 the first data and the second data for constructing the adaptive model are collected and stored.
- the method of collecting the second data will be described in detail. For example, if data is collected to predict the occurrence of drawing at the sixth stand F6 of the finishing rolling mill, data near the tail end is collected for each of the stands F1, F2, and F3 on the upstream side of the stand F6. ..
- the data items of the collected data are roll gap, roll shift amount, rolling load, gauge meter thickness and the like. However, WS, DS, and central data are collected for the roll gap, and WS and DS data are collected for the rolling load.
- Collecting data near the tail end is a time that allows sufficient time to perform the prediction process and inform the operator, for example, going back 30 seconds from the tail end to the tip of the rolled material. It means collecting data for 10 seconds upstream from there. In other words, of the 40 seconds of data near the tail end, the first 10 seconds of data are collected. In this case, an adaptive model is constructed using the collected 10-second data.
- the time of 30 seconds is an example of a time that is approximately equal to the sum of the time for the prediction process and the time for notifying the operator and preparing for the operator to avoid narrowing down.
- the aperture generation prediction system of the present embodiment is configured so that necessary data can be appropriately and selectively used from the data collected as the second data.
- step 102 it is determined whether the first predetermined number or more of data has been accumulated or the second predetermined number or more of data has been added.
- the first predetermined number is an absolute number of data sufficient for applying machine learning or statistical methods. In the case of machine learning, although it depends on the method, generally 3,000 to 10,000 or more data are required. Since the data of the second predetermined number increases as the rolling progresses, it is necessary to make a judgment for updating the adaptive model with the newly added data. This can be selected arbitrarily, and if the number is set small, it will be updated frequently, but the calculation load will also increase. If you set a lot, the update frequency will decrease, but there is a risk that you will not be able to keep up with the new rolling situation.
- Step 103 is the main process for building an adaptive model. Adaptation models realized by methods such as NN, SOM, and ACC update their internal states with input data, enabling more accurate predictions.
- step 104 the adaptation model for which construction has been completed is saved as the adaptation completion model. If there is an existing adaptation completion model constructed using old data, the adaptation completion model constructed this time updates the existing adaptation completion model and saves the updated adaptation completion model.
- step 201 is first executed.
- step 201 the stand number (k) of the aperture prediction target stand is set. Since drawing is likely to occur at the stand at the subsequent stage of the finishing rolling mill, the stand numbers (k) may be only 4, 5, 6 and 7.
- step 202 the stand number (k) is updated and reset one by one each time it is executed.
- the prediction data is collected by the same collection method as the second data for constructing the adaptive model described in step 101.
- the leading rolling stand for acquiring the prediction data is determined in consideration of the time required for the prediction process, the time required to notify the operator via the display of the display device, and the time required for the operator to prepare for the throttle avoidance operation. There is a need to.
- the table below shows the rolling stand to be predicted (in the table, it is described as the stand to be predicted) and the preceding rolling stand to collect the prediction data (in the table, it is described as the prediction data collection stand). An example of the correspondence of is shown.
- step 204 the adaptation completion model saved in step 104 is read, and the prediction data is input to the adaptation completion model. From the adaptation completion model, the prediction result of whether or not the aperture is generated and the prediction result of the occurrence location when the aperture is generated are output for each prediction target stand.
- step 205 it is confirmed whether the prediction has been carried out at all the prediction target stands.
- the process from step 202 to step 204 is repeated until the prediction at all the prediction target stands is completed.
- the process proceeds to step 206, and the prediction result is notified to the operator.
- the operator in the driver's cab is often either looking at the actual rolled state behind the glass or watching the TV monitor installed in the driver's cab. Therefore, it is desirable to display the notification of the prediction result in the two easy-to-see places.
- the operator is notified of the prediction result after predicting all the target stands, but the operator may be notified each time it is predicted that the aperture will occur. That is, when the prediction is started from the m-th stand, if it is predicted that the aperture will occur at the m-th stand, that fact may be immediately notified, and then the prediction may be performed for the m + 1-th stand.
- the NN has a three-layer structure consisting of an input layer, an intermediate layer, and an output layer, and the number of intermediate layers can be increased. If the intermediate layer is composed of many layers, deep learning can also be performed. Each layer is composed of one or more neurons, and the neurons in each layer are connected by weighted lines. The output state of one neuron changes depending on the level of the input value. In the case of supervised learning, a method called backpropagation is generally used, in which the output of the NN and the teacher signal are compared and the weight of the coupling line is updated in the opposite direction.
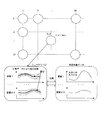
- FIG. 6 is a diagram for explaining a configuration example of SOM and an outline of a prediction method using the same. In the SOM configuration example shown in FIG. 6, the SOM is composed of 10 ⁇ 10 neurons.
- planes for the number of variables are prepared.
- the number of data items such as roll gap and rolling load included in the second data is set to 20.
- Each neuron is prepared with a plane for 20 variables, specifically, a plane having an axis of the value of the variable and an axis of time.
- Each of the 20 variables has data for 10 seconds corresponding to the vicinity of the tail end of the rolled material, as described in step 101 of the processing flow shown in FIG.
- a curve for 10 seconds in the initial plane in each neuron is randomly given.
- normal data of 20 variables is saved as one set for 10 seconds. The data is taken out one set at a time, and which neuron curve is closest to the curve of the set of data as a whole is determined. Then, it is considered to belong to the neuron determined to be the closest. The same process is performed for all sets of normal data, and finally the curve that becomes the center of gravity is determined for each variable in each neuron. This completes the construction of the adaptive model, that is, the learning.
- the value of each variable of the prediction data, which is the judgment target data, and the value of the center of gravity of each variable value in 100 neurons are compared. Then, which neuron the determination target data is close to as a whole is calculated, and the neuron determined to be the closest is selected. Next, the distance between the curve of the center of gravity of each variable in the selected neuron and the value of each variable in the judgment target data is calculated, and if there is a variable whose distance is significantly different from the others (in the above example, the figure). Variable 1) in 6 and the data containing it are considered abnormal. That is, it is determined that the aperture is generated.
- the table below shows an example of verification of the learning effect when an adaptation model is constructed using normal data by SOM and abnormal data is detected using the adaptation completion model.
- anomalous data having 136 tail end diaphragms was included in the data of all 7650 of the same steel type, and 100% of these anomalous data could be detected.
- ACC ACC is basically a method that applies well-known control charts.
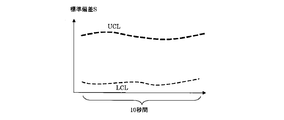
- the control chart fixes the upper control limit (hereinafter referred to as UCL) and the lower control limit (hereinafter referred to as LCL), but ACC adjusts them according to the transition of data.
- UCL upper control limit
- LCL lower control limit
- the normal data for 10 seconds near the tail ends of the 20 selected variables is used as the data for constructing the adaptive model.
- 10 seconds near the tail end means 10 seconds near the tip, excluding 30 seconds near the tail end. In other words, it means the first 10 seconds of the 40 seconds near the tail end.
- the data was collected as shown in the table shown in FIG.
- the columns of the table are the coil numbers and the rows are the data numbers.
- the number of coils is P.
- J is the first number of the data for 10 seconds
- each frame shows a window for calculating the standard deviation.
- the standard deviation of the data is calculated while shifting the window every 0.1 seconds, with the window for calculating the standard deviation as the interval of 1 second.
- P standard deviations can be created in each time zone such as 0-1 seconds and 0.1-1.1 seconds, and the standard deviations can be distributed.
- the standard deviation in time zone 1 is obtained as S [1,1], S [2,1], ..., S [P, 1].
- UCL is taken to be, for example, 3 times or 4 times the + side of ⁇ [i]
- LCL is ⁇ . It can be taken, for example, three times or four times as much as the minus side of [i].
- UCL and LCL as shown in FIG. 8 are obtained.
- FIG. 8 shows UCL and LCL for one variable, and UCL and LCL are calculated for each variable.
- determining UCL and LCL in this way corresponds to the construction of an adaptive model.
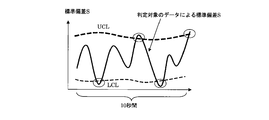
- the data to be judged and the UCL and LCL determined at the stage of constructing the adaptive model are compared. Then, using the score of the data exceeding UCL or LCL and the sum of the distances from UCL or LCL as the evaluation value, how far the data to be determined is from UCL or LCL is evaluated, and whether it is normal or abnormal is determined. To.
- the model is constructed by the NN by inputting both the abnormal data with the aperture occurrence and the normal data without the aperture occurrence.
- SOM and ACC a model is constructed by inputting only normal data without aperture generation, and it is determined that aperture generation occurs when the model deviates significantly.
- the number of rolled materials that are drawn is much smaller than the number of rolled materials that are not drawn.
- the time during normal operation is much longer than the time during abnormal condition. Therefore, the data indicating abnormality is usually much less than the data indicating normality. In such a situation, it is often more advantageous to build a model with data in the normal state by SOM or ACC and determine that the non-normal state is abnormal.
- An adaptive model is defined as a model in which the degree of relationship between internal components changes and the output changes when data is input.
- An example is an adaptive model constructed by the NN, SOM and ACC methods. More specifically, the fit model suitable for predicting the occurrence of aperture includes the fit models defined in the following definitions A, B, and C.
- A When data is input, the degree of relationship between internal components changes and the output changes. After learning from a plurality of inputs and sets of outputs, the target input is evaluated and the evaluation value is evaluated. What to output (B) When data is input, the degree of relationship between internal components changes and the output changes. After learning from a set of multiple inputs, the target input is evaluated and the evaluation value is evaluated.
- C When data is input, the degree of relationship between internal components changes and the output changes. After determining a statistical index from a set of multiple inputs, a set of inputs To evaluate and output the evaluation value
- NN is an example of an adaptive model defined in Definition A.
- SOM is an example of an adaptive model defined in Definition B.
- ACC is an example of an adaptive model defined in Definition C. The table below shows the relationship with the definition of the adaptive model for each of NN, SOM and ACC.
- FIG. 10 is a flowchart showing a modification of the processing flow by the diaphragm generation prediction system of the present embodiment.
- the difference between the processing flow shown in FIG. 5 and the processing flow shown in FIG. 10 lies in the processing flow at the stage of constructing the adaptive model.
- the process of step 104 in the process flow shown in FIG. 5 is replaced with the process of step 104a in the process flow shown in FIG.
- the adaptation model is updated in the adaptation model construction stage, and step 104a is a step for confirming whether the prediction accuracy based on the update result is ensured. If the newly constructed adaptation model is accurate enough, the adaptation completion model will be updated and saved, otherwise it will not be saved.
- the method for verifying the constructed adaptive model is slightly different from the above three methods.
- NN learning data and verification data are separated. For example, assuming that there are 10,000 data, 500 or 1,000 data are randomly selected as verification data, and the rest is used as learning data.
- the verification data is input to the model by the NN trained by the training data, and it is verified whether or not the occurrence of the diaphragm can be predicted accurately.
- SOM or ACC since the model is constructed with normal data without aperture generation, only abnormal data is used for verification. If abnormal data is input to the model constructed by SOM or ACC and it can be determined that the aperture is generated, it can be determined that the model is highly accurate.
- the drawing generation prediction system of the present embodiment includes a control device that operates an entry side guide of the rolling stand to be predicted when the prediction device predicts that drawing will occur at the rolling stand to be predicted.
- the computer that functions as a control device may be a computer different from the computer that functions as a predictor. Further, one computer may be made to function as a prediction device by software and also as a control device.
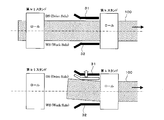
- FIG. 11 is a diagram showing an example of control of the entry side guides 31 and 32 using the aperture prediction result.
- a control example will be described when a tail end diaphragm occurs at the k-th stand and the location is predicted to be DS.
- the rolled material 100 is rolled at the k-1st stand. At this time, meandering has not yet occurred. It is assumed that the rolled material 100 meanders after the tail end of the k-1 stand has passed through the k-1 stand in the state shown in the lower row after a lapse of time.
- One example in which tail end drawing is predicted to occur is when the rolled material 100 is in such a state.
- the control device (not shown) performs an operation of opening the entry side guide 31 of the DS in accordance with the passage of the tail end in order to prevent the tail end from hitting the entry side guide and being torn off. If it is not possible to specify on which side the WS or DS the aperture is generated, the control device (not shown) opens the entry side guides 31 and 32 on both sides of the WS and DS as the tail ends pass. Do.
- the control device (not shown) performs an operation of opening the entry side side guide in accordance with the passage of the tip.
- the entry side guide that performs the opening operation is that of the side where the aperture is generated, but when it is not possible to specify whether the location where the aperture is generated is WS or DS, the side guides on both sides of WS and DS are opened.
- the present invention can also be applied to a rough rolling mill.
- so-called reverse rolling in which rolling in the forward direction and the reverse direction is repeated, is performed a plurality of times.
- the rolling pass means each rolling, and the preceding rolling pass that precedes in the rolling order means the rolling performed before the previous time.
- the tail end diaphragm has been mainly described, but the present invention can be applied not only to the tail end diaphragm but also to the tip diaphragm.
- NN As the method of constructing the adaptive model, NN, SOM, and ACC have been described as examples, but the method of constructing the adaptive model that can be applied to the present invention is not limited to these.
- Random Forest RF
- Extra Trees which is an advanced form of RF, xgboost, etc. can also be applied.
- Adaptation model construction data collection and storage unit 2 Adaptation model construction unit 2a
- 302 Adaptation model 3: Prediction data collection unit 4: Prediction unit 4a, 312: Adaptation completion model 5: Result display unit 10: Prediction device 31, 32: Entry side guide 100: Rolled material
Abstract
Description
対策A:絞りが発生しやすい圧延材に対し、オペレータが事前に対処する。
対策B:絞りが発生することに反応して、オペレータが即座に対応する。
対策C:尾端の蛇行を抑える自動蛇行制御を適用する。
1.絞り発生予測システムの構成
図1は、本発明の第1の実施の形態の絞り発生予測システムの構成を示すブロック図である。本実施の形態の絞り発生予測システムは図12に示す構成を有する熱間薄板圧延プロセスに適用されている。絞り発生予測システムは、予測に係るデータの採取及び保存とそのデータを用いた演算とを行う予測装置10を備える。予測装置10は、単一のコンピュータで構成されてもよいし、ネットワークに接続された複数のコンピュータから構成されてもよい。
図5は、本実施の形態の絞り発生予測システムによる処理フローを詳細に示すフローチャートである。図5において、左右に並んだ二つのフローチャートのうち左側のフローチャートは適応モデルの構築段階の処理フローを示し、右側のフローチャートは予測段階の処理フローを示す。

3-1.NN
NNは最も単純な構成では、入力層、中間層、出力層という3層構造であり、中間層を増やしていくこともできる。中間層が多数の層で構成される場合は、深層学習をすることもできる。各層は1つまたは複数のニューロンから構成され、各層のニューロンが重みをもった線で結合されている。1つのニューロンは入力値のレベルにより出力状態が変わる。教師あり学習の場合は、NNの出力と教師信号を比較し、逆方向に結合線の重みを更新していく、バックプロパゲーションという方法が一般的に用いられる。
SOMは教師データが不要であり、正常データ、つまり、絞りが発生しなかったときに採取されたデータのみが用いられる。SOMの区分を5×5、10×10、25×25などと定義すると、各区分が1つのニューロンとなる。各ニューロンには使用する変数の数だけの平面が用意される。図6は、SOMの構成例とそれ用いた予測方法の概要とを説明する図である。図6に示すSOMの構成例では、SOMは10×10のニューロンから構成されている。

ACCは基本的には周知の管理図(Control Charts)を応用した手法である。管理図は上方管理限界(Upper Control Limit:以下、UCLと表記する)と、下方管理限界(Lower Control Limit:以下、LCLと表記する)とを固定するが、ACCはデータの推移に合わせてそれらを変更する。ある時系列データがあり、その期間が10秒間推移を示すとすると、例えば0.1秒ごとに照準をずらし、そこから1秒間を1区間として、それぞれの区間における標準偏差からそれぞれの区間におけるUCL及びLCLを決めていく。このときデータに歪度があれば、それによるUCL及びLCLの補正も行う。その補正の方法については、「Betul Kan, and Berna Yazici” The Individuals Control Chart in Case of Non-Normality”, Journal of Modern Applied Statistical Methods, Vol.5, Issues 2, Article 28, Digital Commons @WayneState (2005)」に記載されている。
適応モデルとは、データが入力されると内部の構成要素間の関係度が変化し出力が変化するものと定義される。その例が、NN、SOM及びACCの各手法により構築される適応モデルである。より詳しくは、絞り発生の予測に適した適合モデルには、以下の定義A、定義B、及び定義Cで定義される適合モデルが含まれる。
(A)データが入力されると内部の構成要素間の関係度が変化し出力が変化するものであって、複数の入力および出力のセットにより学習した後、対象入力を評価して評価値を出力するもの
(B)データが入力されると内部の構成要素間の関係度が変化し出力が変化するものであって、複数の入力のセットにより学習した後、対象入力を評価して評価値を出力するもの
(C)データが入力されると内部の構成要素間の関係度が変化し出力が変化するものであって、複数の入力のセットにより統計的指標を決定した後、入力のセットを評価して評価値を出力するもの

図10は、本実施の形態の絞り発生予測システムによる処理フローの変形例を示すフローチャートである。図5に示す処理フローと図10に示す処理フローとの違いは、適応モデルの構築段階の処理フローにある。詳しくは、図5に示す処理フローにおけるステップ104の処理が、図10示す処理フローではステップ104aの処理に置き換えられている。ステップ104aは、適応モデル構築段階で適応モデルが更新されるが、更新した結果による予想精度が確保できているか確認するためのステップである。新たに構築された適応モデルの精度が十分であれば、適応完了モデルが更新されて保存されるが、そうでなければ保存されない。
次に、本発明の第2の実施の形態の絞り発生予測システムについて説明する。本実施の形態では、絞りの発生の有無を予測した後、その予測結果をオペレータに通知するのみならず、入側サイドガイドの制御にも利用する。本実施の形態の絞り発生予測システムは、予測装置により予測対象の圧延スタンドにおいて絞りが発生すると予測された場合、予測対象の圧延スタンドの入側サイドガイドを操作する制御装置を備えている。制御装置として機能するコンピュータは、予測装置として機能するコンピュータとは別のコンピュータでもよい。また、一つのコンピュータを、ソフトフェアにより予測装置として機能させるとともに、制御装置として機能させてもよい。
上述の実施の形態では、仕上圧延機を対象として説明したが、本発明は粗圧延機にも適用可能である。粗圧延機では順方向、逆方向の圧延を繰り返すいわゆるリバース圧延が複数回行われる。本発明を粗圧延機に適用した場合、圧延パスとは各回の圧延を意味し、圧延順序で先行する先行圧延パスとは前回以前に行われた圧延を意味する。
2:適応モデル構築部
2a,302:適応モデル
3:予測用データ採取部
4:予測部
4a,312:適応完了モデル
5:結果表示部
10:予測装置
31,32:入側サイドガイド
100:圧延材
Claims (10)
- 板状の金属材料を高温に熱し複数の圧延パスで圧延する熱間圧延において、圧延材が蛇行或いは幅方向に折れ曲がることにより前記圧延材の先端または尾端に発生する現象である絞りの発生を予測するシステムであって、
前記システムは、1又は複数のコンピュータを備え、
前記1又は複数のコンピュータは、
絞りの発生を予測するための適応モデルの構築に用いる適応モデル構築用データを採取し保存する処理と、
前記適応モデル構築用データを用いて前記適応モデルを構築する処理と、
構築が完了した前記適応モデルである適応完了モデルを保存する処理と、
絞りの発生の予測に用いる予測用データを採取する処理と、
前記予測用データを前記適応完了モデルに入力することによって絞りの発生を予測する処理と、を実行し、
前記適応モデル構築用データを採取し保存する処理では、前記適応モデル構築用データとして、絞り発生予測の対象となる対象圧延パスにおける絞りの発生の有無及び発生個所を示す第1データと、前記第1データに紐づけられた圧延材が前記対象圧延パスよりも圧延順序で先行する先行圧延パスで圧延された際の同先行圧延パスに関する情報と同圧延材に関する属性とを含む第2データと、を複数セット採取し、
前記予測用データを採取する処理では、前記予測用データとして、予測対象の圧延材が前記対象圧延パスよりも圧延順序で先行する先行圧延パスで圧延された際の同先行圧延パスに関する情報と同圧延材に関する属性とを含むデータを採取し、
前記絞りの発生を予測する処理では、前記予測対象の圧延材が前記対象圧延パスに到達するよりも前に、前記対象圧延パスにおける絞りの発生の有無及び発生個所の全部又は一部を予測する、
ことを特徴とする絞り発生予測システム。 - 前記システムは、表示装置を備え、
前記1又は複数のコンピュータは、
絞りの発生の予測結果を前記表示装置に表示する処理を実行する
ことを特徴とする請求項1に記載の絞り発生予測システム。 - 前記1又は複数のコンピュータは、
前記対象圧延パスにおいて絞りが発生すると予測された場合、前記対象圧延パスの入側サイドガイドを操作する処理を実行する
ことを特徴とする請求項1又は2に記載の絞り発生予測システム。 - 前記1又は複数のコンピュータは、
前記入側サイドガイドを操作する処理では、前記予測対象の圧延材の先端と尾端のどちらの端部で絞りが発生するのか特定し、絞りが発生する方の端部の通過に合わせて前記入側サイドガイドを開く
ことを特徴とする請求項3に記載の絞り発生予測システム。 - 前記1又は複数のコンピュータは、
前記入側サイドガイドを操作する処理では、前記対象圧延パスの運転室側と電動機側のどちらの側で絞りが発生するのか特定し、絞りが発生する側の前記入側サイドガイドを開く
ことを特徴とする請求項3又は4に記載の絞り発生予測システム。 - 前記1又は複数のコンピュータは、
前記入側サイドガイドを操作する処理では、前記対象圧延パスの運転室側と電動機側のどちらの側で絞りが発生するのか特定できない場合、前記運転室側と前記電動機側の両側の前記入側サイドガイドを開く
ことを特徴とする請求項3乃至5の何れか1項に記載の絞り発生予測システム。 - 前記1又は複数のコンピュータは、
前記適応モデルを構築する処理では、人工知能の範疇に入る機械学習又は統計的手法により前記適応モデルを構築し、前記適応モデル構築用データが新たに一定数得られるたびに前記適応モデルを更新する
ことを特徴とする請求項1乃至6の何れか1項に記載の絞り発生予測システム。 - 前記1又は複数のコンピュータは、
前記適応モデル構築用データを採取し保存する処理では、前記対象圧延パスを通過した圧延材の画像データの解析により前記対象圧延パスにおける絞りの発生の有無及び発生個所を判定する
ことを特徴とする請求項1乃至7の何れか1項に記載の絞り発生予測システム。 - 前記1又は複数のコンピュータは、
前記適応モデル構築用データを採取し保存する処理では、前記対象圧延パスの入側サイドガイドにかかる荷重に基づき前記対象圧延パスにおける絞りの発生の有無及び発生個所を判定する
ことを特徴とする請求項1乃至7の何れか1項に記載の絞り発生予測システム。 - 前記1又は複数のコンピュータは、
前記適応モデル構築用データを採取し保存する処理では、オペレータがHMIを介して入力した前記対象圧延パスにおける絞りの発生の有無及び発生個所を受け付ける
ことを特徴とする請求項1乃至7の何れか1項に記載の絞り発生予測システム。
Priority Applications (7)
| Application Number | Priority Date | Filing Date | Title |
|---|---|---|---|
| US17/275,205 US20220008976A1 (en) | 2019-09-12 | 2019-09-12 | Prediction system of strip chew in hot rolling mill |
| PCT/JP2019/035971 WO2021048984A1 (ja) | 2019-09-12 | 2019-09-12 | 絞り発生予測システム |
| CN201980065244.9A CN112839746B (zh) | 2019-09-12 | 2019-09-12 | 折叠产生预测系统 |
| KR1020217008497A KR102426172B1 (ko) | 2019-09-12 | 2019-09-12 | 조임 발생 예측 시스템 |
| JP2021519916A JP7070796B2 (ja) | 2019-09-12 | 2019-09-12 | 絞り発生予測システム |
| EP19944643.6A EP3838432B1 (en) | 2019-09-12 | 2019-09-12 | System for predicting contraction |
| TW109129538A TWI749735B (zh) | 2019-09-12 | 2020-08-28 | 收縮產生預測系統 |
Applications Claiming Priority (1)
| Application Number | Priority Date | Filing Date | Title |
|---|---|---|---|
| PCT/JP2019/035971 WO2021048984A1 (ja) | 2019-09-12 | 2019-09-12 | 絞り発生予測システム |
Publications (1)
| Publication Number | Publication Date |
|---|---|
| WO2021048984A1 true WO2021048984A1 (ja) | 2021-03-18 |
Family
ID=74866315
Family Applications (1)
| Application Number | Title | Priority Date | Filing Date |
|---|---|---|---|
| PCT/JP2019/035971 WO2021048984A1 (ja) | 2019-09-12 | 2019-09-12 | 絞り発生予測システム |
Country Status (7)
| Country | Link |
|---|---|
| US (1) | US20220008976A1 (ja) |
| EP (1) | EP3838432B1 (ja) |
| JP (1) | JP7070796B2 (ja) |
| KR (1) | KR102426172B1 (ja) |
| CN (1) | CN112839746B (ja) |
| TW (1) | TWI749735B (ja) |
| WO (1) | WO2021048984A1 (ja) |
Families Citing this family (3)
| Publication number | Priority date | Publication date | Assignee | Title |
|---|---|---|---|---|
| CN114640753B (zh) * | 2022-04-01 | 2023-10-27 | 北京市疾病预防控制中心 | 基于实验视频处理的线虫咽泵运动频率自动识别方法 |
| CN114833202B (zh) * | 2022-04-07 | 2024-04-12 | 中冶赛迪信息技术(重庆)有限公司 | 提高直轧平均温度的剔坯方法、系统、介质及电子终端 |
| CN114682634B (zh) * | 2022-04-21 | 2024-05-07 | 重庆钢铁股份有限公司 | 一种预防折叠带尾进入轧机的方法 |
Citations (4)
| Publication number | Priority date | Publication date | Assignee | Title |
|---|---|---|---|---|
| JPH01205808A (ja) * | 1988-02-12 | 1989-08-18 | Nippon Steel Corp | 連続式圧延機の尻絞り防止方法 |
| JPH04118108A (ja) | 1990-09-04 | 1992-04-20 | Toshiba Corp | 圧延材の蛇行制御装置 |
| WO2012086043A1 (ja) * | 2010-12-24 | 2012-06-28 | 三菱日立製鉄機械株式会社 | 熱間圧延設備及び熱間圧延方法 |
| JP2018043255A (ja) | 2016-09-13 | 2018-03-22 | 株式会社神戸製鋼所 | 蛇行予測システム及び蛇行予測方法 |
Family Cites Families (20)
| Publication number | Priority date | Publication date | Assignee | Title |
|---|---|---|---|---|
| BR9603035A (pt) * | 1995-07-10 | 1998-05-05 | Kawasaki Steel Co | Método e aparelho para laminação a quente de acabamento contínua de tiras de aço |
| KR100363432B1 (ko) * | 1998-12-15 | 2003-02-19 | 주식회사 포스코 | 사상압연시의 스트립꼬임을 방지하기 위한 방법 및 장치 |
| JP2000246325A (ja) * | 1999-02-24 | 2000-09-12 | Mitsubishi Heavy Ind Ltd | 熱間圧延におけるスケール疵防止装置及び防止方法 |
| AUPQ779900A0 (en) * | 2000-05-26 | 2000-06-22 | Bhp Steel (Jla) Pty Limited | Hot rolling thin strip |
| KR100675061B1 (ko) * | 2005-08-10 | 2007-01-29 | 제이에프이 스틸 가부시키가이샤 | 강대 또는 표면 처리 강대의 제조 방법 |
| KR100660216B1 (ko) * | 2005-12-23 | 2006-12-21 | 주식회사 포스코 | 판 꼬임 방지를 위한 열간 압연 제어 방법 |
| EP2145703B1 (en) * | 2008-03-14 | 2015-01-07 | Nippon Steel & Sumitomo Metal Corporation | Rolling load prediction learning method for hot plate rolling |
| CN102989839B (zh) * | 2011-09-16 | 2014-12-24 | 宝山钢铁股份有限公司 | 热连轧卷取机平行侧导板控制方法 |
| JP5790636B2 (ja) * | 2012-12-19 | 2015-10-07 | Jfeスチール株式会社 | 圧延材の蛇行制御方法、圧延材の蛇行制御装置、圧延材の蛇行制御プログラム、及び圧延材の製造方法 |
| TWI541081B (zh) * | 2013-09-14 | 2016-07-11 | 中國鋼鐵股份有限公司 | 鋼胚之熱軋方法 |
| KR101972635B1 (ko) * | 2013-11-08 | 2019-04-25 | 도시바 미쓰비시덴키 산교시스템 가부시키가이샤 | 생산 라인의 시뮬레이션 장치 |
| KR101951583B1 (ko) * | 2015-02-02 | 2019-02-22 | 도시바 미쓰비시덴키 산교시스템 가부시키가이샤 | 압연 라인의 사행 제어 장치 |
| JP6330734B2 (ja) * | 2015-06-09 | 2018-05-30 | Jfeスチール株式会社 | 鋼板切断位置設定装置及び鋼板製造方法 |
| EP3330013A4 (en) * | 2015-07-29 | 2019-02-20 | Nippon Steel & Sumitomo Metal Corporation | TITANIUM RAW MATERIAL FOR HOT ROLLED |
| EP3202502A1 (de) * | 2016-02-04 | 2017-08-09 | Primetals Technologies Germany GmbH | Bandlageregelung |
| JP2018015766A (ja) * | 2016-07-25 | 2018-02-01 | Jfeスチール株式会社 | 熱間仕上圧延における鋼板尾端蛇行制御方法 |
| EP3293594A1 (de) * | 2016-09-13 | 2018-03-14 | Primetals Technologies Germany GmbH | Verwendung umfassender künstlicher intelligenz bei anlagen der grundstoffindustrie |
| TWI625174B (zh) * | 2017-07-27 | 2018-06-01 | 中國鋼鐵股份有限公司 | 鋼帶尾端破損的偵測方法 |
| JP6953990B2 (ja) * | 2017-10-17 | 2021-10-27 | 日本製鉄株式会社 | 品質予測装置及び品質予測方法 |
| CN108655190B (zh) * | 2018-04-17 | 2020-02-04 | 北京首钢股份有限公司 | 一种侧导板的控制方法及系统 |
-
2019
- 2019-09-12 EP EP19944643.6A patent/EP3838432B1/en active Active
- 2019-09-12 JP JP2021519916A patent/JP7070796B2/ja active Active
- 2019-09-12 WO PCT/JP2019/035971 patent/WO2021048984A1/ja unknown
- 2019-09-12 US US17/275,205 patent/US20220008976A1/en active Pending
- 2019-09-12 CN CN201980065244.9A patent/CN112839746B/zh active Active
- 2019-09-12 KR KR1020217008497A patent/KR102426172B1/ko active IP Right Grant
-
2020
- 2020-08-28 TW TW109129538A patent/TWI749735B/zh active
Patent Citations (4)
| Publication number | Priority date | Publication date | Assignee | Title |
|---|---|---|---|---|
| JPH01205808A (ja) * | 1988-02-12 | 1989-08-18 | Nippon Steel Corp | 連続式圧延機の尻絞り防止方法 |
| JPH04118108A (ja) | 1990-09-04 | 1992-04-20 | Toshiba Corp | 圧延材の蛇行制御装置 |
| WO2012086043A1 (ja) * | 2010-12-24 | 2012-06-28 | 三菱日立製鉄機械株式会社 | 熱間圧延設備及び熱間圧延方法 |
| JP2018043255A (ja) | 2016-09-13 | 2018-03-22 | 株式会社神戸製鋼所 | 蛇行予測システム及び蛇行予測方法 |
Non-Patent Citations (2)
| Title |
|---|
| BETUL KANBERNA YAZICI: "Journal of Modern Applied Statistical Methods", vol. 5, 2005, DIGITAL COMMONS @WAYNESTATE, article "The Individuals Control Chart in Case of Non-Normality" |
| See also references of EP3838432A4 |
Also Published As
| Publication number | Publication date |
|---|---|
| TW202126401A (zh) | 2021-07-16 |
| KR102426172B1 (ko) | 2022-07-27 |
| CN112839746B (zh) | 2022-10-11 |
| CN112839746A (zh) | 2021-05-25 |
| TWI749735B (zh) | 2021-12-11 |
| JP7070796B2 (ja) | 2022-05-18 |
| EP3838432B1 (en) | 2023-01-04 |
| US20220008976A1 (en) | 2022-01-13 |
| EP3838432A4 (en) | 2021-10-06 |
| JPWO2021048984A1 (ja) | 2021-10-28 |
| EP3838432A1 (en) | 2021-06-23 |
| KR20210046738A (ko) | 2021-04-28 |
Similar Documents
| Publication | Publication Date | Title |
|---|---|---|
| JP7070796B2 (ja) | 絞り発生予測システム | |
| TWI649133B (zh) | 壓延設備的異常診斷之方法及裝置 | |
| Lieber et al. | Quality prediction in interlinked manufacturing processes based on supervised & unsupervised machine learning | |
| CN107949813B (zh) | 制造设备诊断辅助装置及制造设备诊断辅助方法 | |
| JP7158569B2 (ja) | 金属製品の製造をモニタリングするための方法および電子デバイス、関連するコンピュータプログラムならびに設備 | |
| JP7135962B2 (ja) | 鋼板の仕上出側温度制御方法、鋼板の仕上出側温度制御装置、及び鋼板の製造方法 | |
| JP4696775B2 (ja) | 板幅制御方法および装置 | |
| KR102338546B1 (ko) | 철강 플랜트의 메인터넌스 지원 장치 | |
| Sikdar et al. | Neural network model of the profile of hot-rolled strip | |
| WO2020229541A1 (en) | Method for controlling a metal rolling process for producing intermediate castings, a related computer system, and a method for producing intermediate castings | |
| JP2017225989A (ja) | 圧下レベリング制御装置および圧下レベリング制御方法 | |
| JP2022108117A (ja) | 予測装置、学習装置、予測プログラム、及び学習プログラム | |
| WO2023218619A1 (ja) | 圧延生産性向上支援装置 | |
| JP7156318B2 (ja) | 圧延装置の制御方法、圧延装置の制御装置、および鋼板の製造方法 | |
| CN113111452B (zh) | 一种面向热轧带钢的极限规格轧制建议的分析方法 | |
| JP7461798B2 (ja) | 設備監視支援装置、方法及びプログラム | |
| US20220236725A1 (en) | Physical model identification system | |
| JP5423524B2 (ja) | 熱延コイルの製造条件決定装置および方法ならびに熱延コイルの製造方法 | |
| WO2024018665A1 (ja) | 冷間圧延機の圧延条件設定方法、冷間圧延方法、鋼板の製造方法、冷間圧延機の圧延条件設定装置および冷間圧延機 | |
| JP2564710B2 (ja) | 圧延工程における圧下制御装置の異常診断装置 | |
| JP2023070052A (ja) | 鋼板の板プロフィル判定方法、処置工程設定方法、製造方法、及び板プロフィル判定モデルの生成方法 | |
| JP6822390B2 (ja) | 厚鋼板の粗圧延時間算出方法、厚鋼板の粗圧延時間算出装置、及び厚鋼板の製造方法 | |
| JPH07185620A (ja) | 圧延装置 | |
| JP4669727B2 (ja) | リバース式圧延機のパス数学習装置 | |
| KR20220161169A (ko) | 플랜트 제어 장치, 플랜트 제어 방법 및 프로그램 |
Legal Events
| Date | Code | Title | Description |
|---|---|---|---|
| ENP | Entry into the national phase |
Ref document number: 20217008497 Country of ref document: KR Kind code of ref document: A |
|
| ENP | Entry into the national phase |
Ref document number: 2019944643 Country of ref document: EP Effective date: 20210315 |
|
| ENP | Entry into the national phase |
Ref document number: 2021519916 Country of ref document: JP Kind code of ref document: A |
|
| 121 | Ep: the epo has been informed by wipo that ep was designated in this application |
Ref document number: 19944643 Country of ref document: EP Kind code of ref document: A1 |
|
| NENP | Non-entry into the national phase |
Ref country code: DE |