WO2020054466A1 - 微粒子観察装置及び微粒子観察方法 - Google Patents
微粒子観察装置及び微粒子観察方法 Download PDFInfo
- Publication number
- WO2020054466A1 WO2020054466A1 PCT/JP2019/034228 JP2019034228W WO2020054466A1 WO 2020054466 A1 WO2020054466 A1 WO 2020054466A1 JP 2019034228 W JP2019034228 W JP 2019034228W WO 2020054466 A1 WO2020054466 A1 WO 2020054466A1
- Authority
- WO
- WIPO (PCT)
- Prior art keywords
- particle
- particles
- dimensional
- scattered light
- dimensional image
- Prior art date
- Legal status (The legal status is an assumption and is not a legal conclusion. Google has not performed a legal analysis and makes no representation as to the accuracy of the status listed.)
- Ceased
Links
Images




Classifications
-
- G—PHYSICS
- G01—MEASURING; TESTING
- G01N—INVESTIGATING OR ANALYSING MATERIALS BY DETERMINING THEIR CHEMICAL OR PHYSICAL PROPERTIES
- G01N15/00—Investigating characteristics of particles; Investigating permeability, pore-volume or surface-area of porous materials
- G01N15/02—Investigating particle size or size distribution
- G01N15/0205—Investigating particle size or size distribution by optical means
- G01N15/0227—Investigating particle size or size distribution by optical means using imaging; using holography
-
- G—PHYSICS
- G01—MEASURING; TESTING
- G01N—INVESTIGATING OR ANALYSING MATERIALS BY DETERMINING THEIR CHEMICAL OR PHYSICAL PROPERTIES
- G01N15/00—Investigating characteristics of particles; Investigating permeability, pore-volume or surface-area of porous materials
- G01N15/02—Investigating particle size or size distribution
-
- G—PHYSICS
- G01—MEASURING; TESTING
- G01B—MEASURING LENGTH, THICKNESS OR SIMILAR LINEAR DIMENSIONS; MEASURING ANGLES; MEASURING AREAS; MEASURING IRREGULARITIES OF SURFACES OR CONTOURS
- G01B11/00—Measuring arrangements characterised by the use of optical techniques
-
- G—PHYSICS
- G01—MEASURING; TESTING
- G01N—INVESTIGATING OR ANALYSING MATERIALS BY DETERMINING THEIR CHEMICAL OR PHYSICAL PROPERTIES
- G01N15/00—Investigating characteristics of particles; Investigating permeability, pore-volume or surface-area of porous materials
- G01N15/02—Investigating particle size or size distribution
- G01N15/0205—Investigating particle size or size distribution by optical means
- G01N15/0211—Investigating a scatter or diffraction pattern
-
- G—PHYSICS
- G06—COMPUTING OR CALCULATING; COUNTING
- G06T—IMAGE DATA PROCESSING OR GENERATION, IN GENERAL
- G06T7/00—Image analysis
- G06T7/50—Depth or shape recovery
- G06T7/55—Depth or shape recovery from multiple images
-
- G—PHYSICS
- G01—MEASURING; TESTING
- G01N—INVESTIGATING OR ANALYSING MATERIALS BY DETERMINING THEIR CHEMICAL OR PHYSICAL PROPERTIES
- G01N15/00—Investigating characteristics of particles; Investigating permeability, pore-volume or surface-area of porous materials
- G01N2015/0042—Investigating dispersion of solids
- G01N2015/0053—Investigating dispersion of solids in liquids, e.g. trouble
-
- G—PHYSICS
- G01—MEASURING; TESTING
- G01N—INVESTIGATING OR ANALYSING MATERIALS BY DETERMINING THEIR CHEMICAL OR PHYSICAL PROPERTIES
- G01N15/00—Investigating characteristics of particles; Investigating permeability, pore-volume or surface-area of porous materials
- G01N15/02—Investigating particle size or size distribution
- G01N15/0205—Investigating particle size or size distribution by optical means
- G01N2015/0238—Single particle scatter
Definitions
- the present invention relates to an apparatus and a method for observing fine particles in a dispersion medium in an optical cell, and in particular, includes means for determining the three-dimensional position of each particle from a two-dimensional image and information such as particle diameter and material.
- the present invention relates to a fine particle observation device and a fine particle observation method that can also provide the following.
- Patent Literatures 1 and 2 as a method of measuring the particle diameter of fine particles in a dispersion medium, a laser beam is applied to the dispersion medium in an optical cell, and the motion of the particles is continuously imaged by a video camera. There is known a method of capturing movement and obtaining a particle diameter.
- a particle tracking method PTA method, Particle Tracking Analysis
- the movement of individual particles is captured from a plurality of two-dimensional images
- the self-diffusion coefficient D is determined as the magnitude of Brownian motion
- the individual particle diameter d is determined from the following Stokes-Einstein equation. . Since the self-diffusion coefficient D of the particles depends only on the particle diameter d, the particle diameter can be determined regardless of the material of the particles. Here, when the particle diameter is sufficiently small, scattered light from the particles is captured as a bright spot on the two-dimensional image.
- the intensity of scattered light from individual particles depends not only on the particle size but also on other material properties, for example, the refractive index reflecting the material of the particles.
- This refractive index can be determined using the particle diameter measured from the movement. For example, for particles having a diameter sufficiently smaller than the wavelength of the laser light, the light scattering is Rayleigh scattering, and the scattered light intensity I is represented by the following proportional relational expression. If this proportionality coefficient is determined in advance using calibration particles, the relative refractive index m of the particles with respect to the dispersion medium can be determined.
- Non-Patent Document 1 scattered light of individual particles in a dispersion medium is imaged for a submicron-sized particle using a commercially available PTA device, and the scattered light intensity is calculated from a bright spot image captured by image analysis.
- the refractive index is obtained.
- Accurate determination of particle size by the PTA method requires capturing movement at three-dimensional particle positions. Further, as described above, in the method of measuring the intensity ratio of scattered light to incident light (I / I 0 ) to obtain various physical properties of particles, a light source such as laser light having a spatially non-uniform intensity distribution is used. When used, accurate measurement cannot be performed unless the light intensity of the incident light at the particle position is corrected. For that purpose, it is necessary to know the position of the particle in the laser beam, that is, the three-dimensional particle position.
- Patent Document 2 regarding the three-dimensional particle position, the position of the particle in the front-back direction (depth direction) with respect to the image along with the position on the two-dimensional image at the focal plane of the camera is defined as the optical axis direction of the camera. It is stated that the vertical flow can be obtained by using an analytical solution for the flow velocity of Navier-Stokes equation.
- the present invention has been made in view of the above circumstances, and an object of the present invention is to provide a fine particle observation apparatus and a fine particle observation method capable of accurately measuring a particle diameter and providing information on various physical properties thereof. It is in.
- the fine particle observation device is a fine particle observation device using light scattering, and is obtained by an optical microscope unit that images scattered light from particles in a dispersion medium irradiated with laser light, and the optical microscope unit.
- a processing unit that determines a three-dimensional position of each of the particles from a two-dimensional image, wherein the optical microscope unit provides the two-dimensional image as a bright spot having diffraction fringes for the particles, the processing unit includes: The two-dimensional coordinates along the two-dimensional image are obtained from the bright spot position of the particles, and the depth position along a coordinate axis perpendicular to the two-dimensional image is determined from the diameter of the diffraction fringe of the bright spot.
- the three-dimensional position of the particle can be accurately determined from the two-dimensional image by the position determining means, and accurate measurement of the particle diameter and information on various physical properties of the particle can be provided.
- the fine particle observation method according to the present invention is a fine particle observation method using light scattering, wherein the two-dimensional image obtained by an optical microscope for imaging scattered light from particles in a dispersion medium irradiated with laser light is used. Including a position determination step of determining a three-dimensional position of each of the particles, the position determination step determines two-dimensional coordinates along the two-dimensional image from the bright spot position of the particle, and is perpendicular to the two-dimensional image. The depth position along the coordinate axis is determined from the diameter of the diffraction fringe of the luminescent spot.
- the three-dimensional position of the particle can be accurately determined from the two-dimensional image by the position determining step, and the physical properties of the particle can be obtained.
- FIG. 1 is a block diagram of a particle observation device according to the present invention. It is a perspective view which shows an optical cell. It is a perspective view showing other examples of an optical cell.
- FIG. 2 is a flowchart showing a method for observing fine particles according to the present invention.
- FIG. 7 is a diagram illustrating an example of a method of obtaining an intensity ratio between incident light and scattered light.
- FIG. 9 is a diagram illustrating another example of a method of obtaining an intensity ratio between incident light and scattered light.
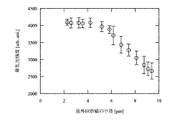
- 5 is a graph showing the relationship between the radius of the outermost diffraction fringe and the scattered light intensity. 5 is a graph showing a relationship between a position of a particle in a depth direction and a radius of an outermost diffraction fringe.
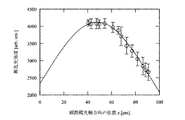
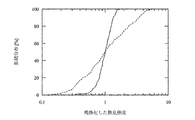
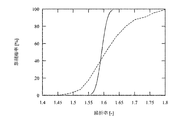
- 4 is a graph showing a relationship between a position of a particle in a depth direction and a scattered light intensity. It is a graph which shows the cumulative distribution of the scattered light intensity by a fine particle observation device and a commercially available PTA device. 4 is a graph showing a measurement result of a refractive index of a group of polystyrene particles. 4 is a graph showing a measurement result of a refractive index of a group of silica particles.
- FIG. 1 is a block diagram showing a fine particle observation apparatus 1 capable of obtaining a particle diameter and calculating a scattered light intensity ratio of particles.
- the fine particle observation apparatus 1 includes an optical cell 5 having an optical window 4 through which a dispersion medium 3 in which particles 2 are dispersed and which can be circulated therein, and a laser beam 6a having a wavelength ⁇ .
- a laser beam irradiating section 6 capable of irradiating the laser beam toward the target, an image capturing apparatus 7 capable of capturing an image of scattered light due to scattered light generated from the particles 2, and an analyzer 8 for analyzing the scattered light image.
- the laser beam irradiating section 6 is arranged so that the image pickup device 7 can easily image the scattered light from the particles 2 by the laser beam 6a.
- the imaging device 7 includes an optical microscope system having a magnification of M including an objective lens having a numerical aperture of NA, and a camera such as a CCD camera or a CMOS camera capable of storing a scattered light image as a moving image.
- the optical axis of the laser light 6 a is arranged parallel to the longitudinal direction of the optical cell 5 and perpendicular to the optical axis of the camera of the imaging device 7, and further toward the thickness direction of the optical cell 5.
- the direction of the optical axis of the imaging device 7 is defined as the z-axis, and directions perpendicular to the optical axis are defined as the x-axis and the y-axis.
- the optical axis direction of the laser beam 6a and the optical axis direction of the imaging device 7 do not necessarily need to be perpendicular to each other, and it is only necessary to be able to image the scattered light from the particles 2. Therefore, the present invention is not limited to the above-described device configuration example. .
- FIG. 2 is a perspective view of the optical cell 5.
- the dispersion medium 3 injected from the inflow port 10 provided on the upper surface of the optical cell 5 maintains a flow velocity vector parallel to the optical axis of the laser light 6a by a flow path having a rectangular cross section having an aspect ratio sufficiently larger than 1. It flows and is discharged from an outlet 11 provided on the upper surface of the optical cell.
- the direction of the flow velocity vector and the direction of the optical axis of the laser beam 6a are not necessarily parallel to each other.
- an optical cell 20 having an inlet 21 and an outlet 22 on the side is used. 6a may be irradiated perpendicular to the flow direction.
- the scattered light from the particles 2 generated by the irradiation of the laser light 6a is captured by the imaging device 7 and stored as a two-dimensional image moving image in the analysis device 8 (S1).
- particles are tracked by comparing the two-dimensional coordinates (xy coordinates) of the luminescent spots in adjacent frames and associating the closest luminescent spots with each other as being made of the same particle, thereby tracking the particles.
- the trajectory of the two-dimensional motion in the xy plane is obtained (S2). If no nearby bright spot exists, it is determined that the particle has deviated from the laser irradiation area, and tracking of the particle is stopped.
- the diffusion coefficient of each particle is calculated from the obtained motion trajectory by the PTA method, and the particle diameter is calculated by the Stokes-Einstein equation (S3). Since the PTA method is known, it will not be described in detail.
- the scattered light intensity of each particle is determined (S4). That is, a bright point B1 in which bright points due to scattered light from other particles do not overlap is extracted from the captured moving image M1, and the sum of the pixel values inside the area D1 that completely surrounds the bright point B1 is calculated as the bright point.
- the scattered light intensity I (B1) is obtained by correcting the effects of the exposure time and the sensitivity of the imaging device 7 with the brightness of B1.
- the depth position of the particle in the z-axis direction is specified by analyzing the shape of the diffraction fringe of the bright spot B1, for example, the distribution of pixel values in the radial direction of the diffraction fringe, and the two-dimensional brightness point on the two-dimensional image is determined.
- the three-dimensional position of the particle is determined together with the coordinates.
- the intensity of the incident light I 0 (B1) incident on the particle corresponding to the luminescent spot B1 is obtained by comparing the measured intensity with the three-dimensional intensity distribution of the incident light by the known laser light 6a.
- the procedure described above is executed by the analyzer 8 as a processing unit, and the result can be output as appropriate.
- the incident light intensity can be obtained using only the depth position among the three-dimensional positions. That is, the distribution of the incident light intensity may be regarded as a distribution only in the depth direction (z-axis direction), and the incident light intensity may be simply obtained.
- the material constituting the particles is estimated (S5).
- the value obtained by dividing the intensity ratio by the sixth power of the particle diameter is compared with particles of a known material to obtain the incident light intensity and scattered light intensity described in Equation 2. It is possible to obtain the refractive index of the particles of the unknown material from the relational expression between the refractive index of the material constituting the particles and the particle diameter. Based on the refractive index thus obtained, the material constituting the particles can be estimated.
- the intensity distribution of the incident light by the laser beam 6a may be obtained from the pattern (shape) of the diffraction fringes of the captured moving image (M1). This method will be described in detail with reference to FIG.
- FIG. 6 shows a state in which the pattern of diffraction fringes of a luminescent spot by a single particle changes to B2-1, B2-2, and B2-3.
- the scattered light intensity I (B2-1), I (B2-2), I (B2-3) and the distribution of pixel values in the radial direction of the diffraction fringes are calculated by the above-described method.
- the incident light intensity and the scattered light intensity are proportional, which corresponds to the fact that the relationship between the outermost diffraction fringe radius and the incident light intensity has been obtained.
- the bright spot of the other particles relates (B3), calculated from the radius of the outermost diffractive fringes incident light intensity I 0 (B3), by measuring the scattered light intensity I (B3) of the scattered light and incident light the intensity ratio I (B3) / I 0 ( B3) can be obtained.
- the scattered light intensity analysis (S4) is performed in the same procedure as described above to determine the scattered light / incident light intensity ratio of each particle.
- the material constituting the particle group is estimated by determining the relative refractive index of the particle group according to the following procedure.
- the relationship between the scattered light / incident light intensity ratio, the particle diameter, and the relative refractive index the relationship between the scattered light / incident light intensity ratio and the relative refractive index when the value of the particle diameter is fixed to the average value is determined. deep. This relationship is obtained, for example, by the relational expression described in Expression 2 if the particle is sufficiently smaller than the wavelength ⁇ of the laser beam 6a, and is obtained by the Mie scattering theory if the particle diameter is substantially the same as the wavelength ⁇ .
- the scattered light / incident light intensity ratio obtained from the scattered light intensity analysis (S4) for each particle is calculated. Convert to relative refractive index. Due to the influence of the distribution of the scattered light intensity generated by the particle size distribution, the relative refractive index of each converted individual particle has a distribution. Then, the relative refractive index of the particle group is determined by correcting the apparent refractive index distribution caused by the particle diameter distribution. This correction process will be described in detail below.
- the standard deviation of the particle size distribution is ⁇ (d)
- the standard deviation ⁇ d (I / I 0 ) of the distribution of the scattered light / incident light intensity ratio caused by the particle size distribution is expressed as follows.
- ⁇ average particle size of the group obtained particles with respect to average relative refractive index (I / I 0) / ⁇ d calculates the ⁇ (I / I 0) / ⁇ m.
- This calculation can be performed, for example, by the relational expression described in Expression 2 if the particle is sufficiently smaller than the wavelength ⁇ of the laser beam 6a, and can be performed by Mie scattering theory if the particle diameter is approximately the same as the wavelength.
- ⁇ d (m) is calculated using the standard deviation of the particle size distribution determined in the calculation of the particle size (S3).
- the standard deviation of the relative refractive index distribution of the particle group obtained from the scattered light / incident light intensity ratio of each particle is ⁇ observed (m)
- the standard deviation of the corrected refractive index distribution ⁇ corrected (m) is determined by the following equation.
- the flow path of the optical cell 5 was 10 mm in width and 0.8 mm in thickness.
- a solid laser capable of irradiating a laser beam 6a having a wavelength of 532 nm is used for the laser beam irradiating section 6, and a convex lens is used so as to form a Gaussian beam having a beam waist spot size of 190 ⁇ m at a position observed by the imaging device 7. Focused.
- the imaging device 7 includes an optical microscope arranged so as to have an optical axis perpendicular to the optical axis of the laser light 6a, and an sCMOS camera for imaging scattered light from the particles 2.
- Scattered light can be imaged with a spatial resolution of 648 ⁇ m / pixel.
- the height of the microscope was adjusted so that the center of the channel was the focal plane of the microscope.
- the scattered light from the particles 2 passes through the dispersion medium having a thickness of 0.4 mm, the optical window 4 made of quartz glass having a thickness of 1.6 mm on the upper surface of the optical cell 5 and the objective lens, and is collected on the sCMOS image sensor. Be lighted. An image of the scattered light obtained thereby was captured at a frame rate of 30 fps and an exposure time of 33.2 ms, and a moving image M1 of a series of two-dimensional images was obtained.
- FIG. 7 shows the result of examining the relationship between the outermost diffraction fringe radius and the scattered light intensity for the bright spot due to scattered light from a single particle in the moving image M1.
- the horizontal axis represents the outermost diffraction fringe radius calibrated as 0.648 ⁇ m / pixel
- the vertical axis represents the measured scattered light intensity.
- the error bar repeatedly represents the standard deviation. Then, the result was obtained that the scattered light intensity decreased as the particles moved away from the focal plane of the microscope and the outermost diffraction fringe radius increased.
- the fitting equation at this time is as follows, and is shown by a solid line in FIG.
- the relationship between the outermost diffraction fringe radius and the scattered light intensity obtained in FIG. 7 can be converted into the relationship between z and the scattered light intensity using the above equation.
- the result of fitting with the Gaussian function in consideration of the fact that the laser beam 6a is a Gaussian beam is the solid line in FIG.
- the width ⁇ z at which the scattered light intensity becomes 1 / e 2 was 180 ⁇ m, which almost coincided with the spot size of the incident light beam waist of 190 ⁇ m.
- FIG. 7 also shows that in the fine particle observation apparatus 1 used, the incident light intensity of particles having an outermost diffraction fringe radius of 5 ⁇ m or less can be regarded as constant.
- the dispersion medium 3 was injected from the inlet 10 of the optical cell 5 at a flow rate of 0.01 mL / min, and scattered light from the particles 2 flowing together with the dispersion medium 3 was imaged by the imaging device 7. Then, about 300 bright spots having an outermost diffraction fringe radius of 5 ⁇ m or less were extracted, the scattered light intensity was calculated, and the cumulative distribution was obtained.
- FIG. 10 shows the results of the above two types of experiments.
- the solid line represents the cumulative distribution of the scattered light intensity obtained by the fine particle observation device 1
- the broken line represents the result obtained by a commercially available PTA device.
- the scattered light intensity was normalized by the median of each distribution.
- the relative standard deviation of the distribution was 26%. That is, it has been shown that the measurement accuracy of the scattered light intensity of the particles is improved when the incident light intensity distribution is considered by the particle observation device 1.
- the fine particle observation device 1 and the dispersion medium 3 are the same as those described above, and as the particles 2, in addition to the above-mentioned polystyrene latex particles having a diameter of 100 nm, polystyrene latex particles having a diameter of 60 nm and silica particles having a diameter of 80 nm are used. did.
- the dispersion medium 3 was injected at a flow rate of 0.01 mL / min from the inflow port 10 (see FIG. 2) of the optical cell 5, and the scattered light from the particles 2 flowing together with the dispersion medium 3 was imaged by the imaging device 7.
- the scattered light intensity analysis of each particle was performed under the following two conditions. (1) Scattered light intensity data of individual particles is obtained by using all the imaged bright points. (2) Only bright spots having an outermost diffraction fringe radius of 5 ⁇ m or less, which is a condition under which the incident light intensity is constant, were extracted and used as scattered light intensity data of individual particles.
- the flow field particle tracking method (FPT method, Flow Particle Tracking) described in the literature (Y Matsuura et al., Analytical Chemistry 90 4182) was used to evaluate the individual particle size, and the particle size distribution was determined by correcting the broadening due to Brownian motion.
- the refractive index was calculated from the scattered light intensity using the proportional relational expression described in Expression 2.
- a proportional constant was set so that the median value of the scattered light intensity measured in the polystyrene latex particles having a diameter of 100 nm coincides with the right side of the proportional relationship described in Expression 2. It was determined.
- the average particle diameter determined by the FPT method was used as the value of the particle diameter.
- relative refractive indices of polystyrene latex particles having a diameter of 60 nm and silica particles having a diameter of 80 nm were determined from the scattered light intensities of the individual particles based on Equation 2.
- the refractive index of the particle group was determined by correcting the effect of the broadening of the particle diameter distribution due to Brownian motion.
- FIG. 11 shows the measurement results of the refractive index of the particle group for polystyrene particles having a diameter of 60 nm.
- the horizontal axis was converted to an absolute refractive index.
- the solid line in the figure indicates that only the bright spots whose outermost diffraction fringe radius is 5 ⁇ m or less, which is the condition for keeping the incident light intensity constant, are extracted to obtain the scattered light intensity data of the individual particles. It is a refractive index distribution obtained by correcting the influence of the diameter distribution.
- the broken line shows the refractive index distribution obtained without using the effect of the particle diameter distribution after making the scattered light intensity data of each particle using all the imaged bright points.
- the refractive index of the polystyrene particles was considered to be a single value, but the refractive index distribution obtained without correction indicated by the broken line was wide.
- the corrected refractive index distribution indicated by the solid line was 1.593 ⁇ 0.015, which was a distribution in a narrow range that could be said to be almost a single value. This value was in good agreement with the refractive index (1.598) of the polystyrene latex at the wavelength of the laser beam 6a.
- FIG. 12 shows the measurement results of the refractive index of the particle group for the silica particles having a diameter of 80 nm.
- the solid line and the broken line show the refractive index distribution obtained by performing correction in the same manner as in the case of FIG. 11, and the refractive index distribution obtained without performing correction.
- the refractive index distribution obtained without correction indicated by the broken line was wide.
- the corrected refractive index distribution shown by the solid line was 1.459 ⁇ 0.006, which was a distribution in a narrow range that could be said to be almost a single refractive index value. This value was in good agreement with the refractive index of silica (1.461) at the wavelength of the laser beam 6a.
- the refractive index of the particle group can be evaluated with high accuracy by considering the incident light intensity distribution and correcting the influence of the particle size distribution by the fine particle observation device 1.
Landscapes
- Chemical & Material Sciences (AREA)
- General Physics & Mathematics (AREA)
- Physics & Mathematics (AREA)
- Immunology (AREA)
- Dispersion Chemistry (AREA)
- Health & Medical Sciences (AREA)
- Life Sciences & Earth Sciences (AREA)
- Analytical Chemistry (AREA)
- Biochemistry (AREA)
- General Health & Medical Sciences (AREA)
- Pathology (AREA)
- Engineering & Computer Science (AREA)
- Theoretical Computer Science (AREA)
- Computer Vision & Pattern Recognition (AREA)
- Investigating Or Analysing Materials By Optical Means (AREA)
- Length Measuring Devices By Optical Means (AREA)
Abstract
Description






2 粒子
3 分散媒
4 光学窓
5 光学セル
6 レーザー照射部
6a レーザー光
7 撮像装置
8 解析装置
10 流入口
11 流出口
Claims (12)
- 光散乱を用いた微粒子観察装置であって、
レーザー光を照射した分散媒中の粒子からの散乱光を撮像する光学顕微鏡部と、前記光学顕微鏡部で得られた二次元画像から前記粒子のそれぞれの三次元位置を決定する処理部と、を含み、
前記光学顕微鏡部は、前記粒子について回折縞を有する輝点として前記二次元画像を与え、
前記処理部は、前記二次元画像に沿った二次元座標を前記粒子の輝点位置から求めるとともに、前記二次元画像に垂直な座標軸に沿った奥行き位置を前記輝点の前記回折縞の径から決定することを特徴とする微粒子観察装置。 - 前記処理部は、前記三次元位置から前記粒子のブラウン運動の大きさを決定し、前記大きさから粒子径を与えることを特徴とする請求項1記載の微粒子観察装置。
- 前記処理部は、予め得た入射光の強度分布に対応させて前記三次元位置での入射光強度を決定し、前記粒子について、前記入射光に対する前記散乱光の強度比と前記粒子径との関係から相対屈折率を得ることを特徴とする請求項2記載の微粒子観察装置。
- 前記粒子の粒子径分布によって生じる前記強度比の分布を補正した上で前記相対屈折率を得ることを特徴とする請求項3記載の微粒子観察装置。
- 前記光学顕微鏡部は、前記レーザー光の光軸に沿った平面を前記二次元画像として与えることを特徴とする請求項1記載の微粒子観察装置。
- 前記奥行き位置は、前記光学顕微鏡の焦点位置からのずれ量と前記回折縞の前記径との比例関係に基づいて決定することを特徴とする請求項1記載の微粒子観察装置。
- 光散乱を用いた微粒子観察方法であって、
レーザー光を照射した分散媒中の粒子からの散乱光を撮像する光学顕微鏡で得られた二次元画像から前記粒子のそれぞれの三次元位置を決定する位置決定ステップを含み、
前記位置決定ステップは、前記二次元画像に沿った二次元座標を前記粒子の輝点位置から求めるとともに、前記二次元画像に垂直な座標軸に沿った奥行き位置を前記輝点の回折縞の径から決定することを特徴とする微粒子観察方法。 - 前記三次元位置から前記粒子のブラウン運動の大きさを決定し、前記大きさから粒子径を算出する粒子径算出ステップをさらに含むことを特徴とする請求項7記載の微粒子観察方法。
- 予め得た入射光の強度分布に対応させて前記三次元位置での入射光強度を決定し、前記粒子について、前記入射光に対する前記散乱光の強度比と前記粒子径との関係から前記粒子の相対屈折率を得ることを特徴とする請求項8記載の微粒子観察方法。
- 前記粒子の粒子径分布によって生じる前記強度比の分布を補正した上で前記相対屈折率を得ること特徴とする請求項9記載の微粒子観察方法。
- 前記二次元画像は、前記レーザー光の光軸に沿った平面に対応することを特徴とする請求項7記載の微粒子観察方法。
- 前記奥行き位置は、前記光学顕微鏡の焦点位置からのずれ量と前記回折縞の前記径との比例関係に基づいて決定することを特徴とする請求項7記載の微粒子観察方法。
Priority Applications (3)
| Application Number | Priority Date | Filing Date | Title |
|---|---|---|---|
| GB2017461.1A GB2589012B (en) | 2018-09-12 | 2019-08-30 | Particulate observation device and particulate observation method |
| US17/051,835 US11415500B2 (en) | 2018-09-12 | 2019-08-30 | Particulate observation device and particulate observation method |
| JP2020545916A JP6867731B2 (ja) | 2018-09-12 | 2019-08-30 | 微粒子観察装置及び微粒子観察方法 |
Applications Claiming Priority (4)
| Application Number | Priority Date | Filing Date | Title |
|---|---|---|---|
| JP2018170407 | 2018-09-12 | ||
| JP2018-170407 | 2018-09-12 | ||
| JP2019085230 | 2019-04-26 | ||
| JP2019-085230 | 2019-04-26 |
Publications (1)
| Publication Number | Publication Date |
|---|---|
| WO2020054466A1 true WO2020054466A1 (ja) | 2020-03-19 |
Family
ID=69777608
Family Applications (1)
| Application Number | Title | Priority Date | Filing Date |
|---|---|---|---|
| PCT/JP2019/034228 Ceased WO2020054466A1 (ja) | 2018-09-12 | 2019-08-30 | 微粒子観察装置及び微粒子観察方法 |
Country Status (4)
| Country | Link |
|---|---|
| US (1) | US11415500B2 (ja) |
| JP (1) | JP6867731B2 (ja) |
| GB (1) | GB2589012B (ja) |
| WO (1) | WO2020054466A1 (ja) |
Cited By (4)
| Publication number | Priority date | Publication date | Assignee | Title |
|---|---|---|---|---|
| JPWO2022153633A1 (ja) * | 2021-01-18 | 2022-07-21 | ||
| WO2022163230A1 (ja) * | 2021-01-26 | 2022-08-04 | 株式会社堀場製作所 | 粒子径推定方法、学習モデル生成方法、粒子径推定装置、及びコンピュータプログラム |
| JP7152622B1 (ja) * | 2022-03-30 | 2022-10-12 | ポーラ化成工業株式会社 | ウルトラファインバブルの気泡濃度測定方法 |
| KR20230105666A (ko) * | 2022-01-04 | 2023-07-11 | 주식회사 토모큐브 | 물질에 존재하는 잔류 응력을 탐지하는 방법 및 시스템 |
Families Citing this family (3)
| Publication number | Priority date | Publication date | Assignee | Title |
|---|---|---|---|---|
| CN116593358A (zh) * | 2023-05-17 | 2023-08-15 | 新乡医学院 | 一种单细胞水平的生物颗粒折射率鉴别装置及方法 |
| CN117192661A (zh) * | 2023-09-22 | 2023-12-08 | 深圳先进技术研究院 | 微透镜芯片在颗粒追踪中的用途 |
| WO2025060045A1 (zh) * | 2023-09-22 | 2025-03-27 | 深圳先进技术研究院 | 微透镜芯片在颗粒追踪中的用途 |
Citations (6)
| Publication number | Priority date | Publication date | Assignee | Title |
|---|---|---|---|---|
| JP2006113462A (ja) * | 2004-10-18 | 2006-04-27 | Tohoku Univ | 単粒子三次元位置追跡方法 |
| JP2008261737A (ja) * | 2007-04-12 | 2008-10-30 | Univ Of Electro-Communications | 粒径計測装置 |
| JP2012515351A (ja) * | 2009-01-16 | 2012-07-05 | ニューヨーク ユニバーシティー | ホログラフィビデオ顕微鏡観察を伴う自動的リアルタイム粒子特徴付け及び三次元速度測定 |
| WO2016159131A1 (ja) * | 2015-03-30 | 2016-10-06 | 国立研究開発法人産業技術総合研究所 | 粒子径計測方法及びその装置 |
| JP2017534886A (ja) * | 2014-10-09 | 2017-11-24 | エコール シュペリュール ドゥ フィジーク エ ドゥ シミ アンドゥストゥリエール ドゥ ラ ヴィーユ ドゥ パリ − ウーエスペーセーイー パリテック | 流体試料中のナノ粒子を光学的に検出する方法および装置 |
| JP2018049019A (ja) * | 2014-01-28 | 2018-03-29 | 国立大学法人大阪大学 | デバイス、デバイス製造方法、粒径測定方法、耐性観察方法、化学的反応方法、粒子保存方法、及び自動観察装置 |
Family Cites Families (3)
| Publication number | Priority date | Publication date | Assignee | Title |
|---|---|---|---|---|
| WO2008132995A1 (ja) | 2007-04-12 | 2008-11-06 | The University Of Electro-Communications | 粒子計測装置、及び粒径計測装置 |
| WO2010046946A1 (ja) * | 2008-10-21 | 2010-04-29 | 北斗電子工業株式会社 | 液体中の粒子のサイズの検出方法および装置 |
| CN214666649U (zh) * | 2021-05-17 | 2021-11-09 | 成都西普达科技有限公司 | 激光衍射测径仪 |
-
2019
- 2019-08-30 JP JP2020545916A patent/JP6867731B2/ja active Active
- 2019-08-30 WO PCT/JP2019/034228 patent/WO2020054466A1/ja not_active Ceased
- 2019-08-30 US US17/051,835 patent/US11415500B2/en active Active
- 2019-08-30 GB GB2017461.1A patent/GB2589012B/en active Active
Patent Citations (6)
| Publication number | Priority date | Publication date | Assignee | Title |
|---|---|---|---|---|
| JP2006113462A (ja) * | 2004-10-18 | 2006-04-27 | Tohoku Univ | 単粒子三次元位置追跡方法 |
| JP2008261737A (ja) * | 2007-04-12 | 2008-10-30 | Univ Of Electro-Communications | 粒径計測装置 |
| JP2012515351A (ja) * | 2009-01-16 | 2012-07-05 | ニューヨーク ユニバーシティー | ホログラフィビデオ顕微鏡観察を伴う自動的リアルタイム粒子特徴付け及び三次元速度測定 |
| JP2018049019A (ja) * | 2014-01-28 | 2018-03-29 | 国立大学法人大阪大学 | デバイス、デバイス製造方法、粒径測定方法、耐性観察方法、化学的反応方法、粒子保存方法、及び自動観察装置 |
| JP2017534886A (ja) * | 2014-10-09 | 2017-11-24 | エコール シュペリュール ドゥ フィジーク エ ドゥ シミ アンドゥストゥリエール ドゥ ラ ヴィーユ ドゥ パリ − ウーエスペーセーイー パリテック | 流体試料中のナノ粒子を光学的に検出する方法および装置 |
| WO2016159131A1 (ja) * | 2015-03-30 | 2016-10-06 | 国立研究開発法人産業技術総合研究所 | 粒子径計測方法及びその装置 |
Non-Patent Citations (1)
| Title |
|---|
| GIBSON SARAH FRISKEN: "Experimental test of an analytical model of aberration in an oil-immersion objective lens used in three-dimensional light microscopy", JOURNAL OF THE OPTICAL SOCIETY OF AMERICA. A. OPTICS, IMAGE SCIENCE, AND VISION, vol. 9, no. 1, January 1992 (1992-01-01), pages 154 - 166, XP055693598 * |
Cited By (6)
| Publication number | Priority date | Publication date | Assignee | Title |
|---|---|---|---|---|
| JPWO2022153633A1 (ja) * | 2021-01-18 | 2022-07-21 | ||
| WO2022153633A1 (ja) * | 2021-01-18 | 2022-07-21 | 国立研究開発法人産業技術総合研究所 | 粒子密度計測方法及びその装置 |
| WO2022163230A1 (ja) * | 2021-01-26 | 2022-08-04 | 株式会社堀場製作所 | 粒子径推定方法、学習モデル生成方法、粒子径推定装置、及びコンピュータプログラム |
| KR20230105666A (ko) * | 2022-01-04 | 2023-07-11 | 주식회사 토모큐브 | 물질에 존재하는 잔류 응력을 탐지하는 방법 및 시스템 |
| KR102868171B1 (ko) * | 2022-01-04 | 2025-10-01 | 주식회사 토모큐브 | 물질에 존재하는 잔류 응력을 탐지하는 방법 및 시스템 |
| JP7152622B1 (ja) * | 2022-03-30 | 2022-10-12 | ポーラ化成工業株式会社 | ウルトラファインバブルの気泡濃度測定方法 |
Also Published As
| Publication number | Publication date |
|---|---|
| US11415500B2 (en) | 2022-08-16 |
| US20210055197A1 (en) | 2021-02-25 |
| JP6867731B2 (ja) | 2021-05-12 |
| GB2589012B (en) | 2022-06-01 |
| GB2589012A (en) | 2021-05-19 |
| JPWO2020054466A1 (ja) | 2021-02-25 |
| GB202017461D0 (en) | 2020-12-16 |
Similar Documents
| Publication | Publication Date | Title |
|---|---|---|
| JP6867731B2 (ja) | 微粒子観察装置及び微粒子観察方法 | |
| JP6976605B2 (ja) | 粒子径計測方法及びその装置 | |
| TWI674401B (zh) | 粒子測量裝置和粒子測量方法 | |
| JP6030131B2 (ja) | 粒子の光学的な検出および解析 | |
| US12130418B2 (en) | Microscope system | |
| JP6985558B2 (ja) | ライトシートに基づくナノ粒子トラッキング・カウント装置の調査済体積を校正する方法 | |
| CN102207443B (zh) | 一种颗粒粒度测量仪 | |
| CN102095672B (zh) | 一种多方法融合的颗粒粒度仪 | |
| US20170074768A1 (en) | Common Radiation Path for Acquiring Particle Information by Means of Direct Image Evaluation and Differential Image Analysis | |
| CN106895780B (zh) | 用于测量对象的位置的光学装置 | |
| JP7421968B2 (ja) | 粒子測定装置及び粒子測定方法 | |
| JPWO2018105605A1 (ja) | 流速分布計測方法及び粒径計測方法 | |
| WO2018190162A1 (ja) | 粒子測定装置および粒子測定方法 | |
| JP5300516B2 (ja) | 噴霧粒子撮像解析システムおよび解析方法 | |
| Brockmann et al. | Utilizing the ball lens effect for astigmatism particle tracking velocimetry | |
| JP7446008B2 (ja) | 粒子の屈折率計測方法 | |
| CN108593528A (zh) | 基于激光干涉的非球形粗糙粒子形状和尺寸测量方法 | |
| CN109100272B (zh) | 一种透明椭球粒子朝向和尺寸的测量方法 | |
| JP2007292704A (ja) | ラマン分光測定法による注射液剤中の異物自動測定方法及びその装置 | |
| CN201984011U (zh) | 一种颗粒粒度测量仪 | |
| JP7837041B2 (ja) | 光計測システムおよび光計測方法 | |
| Blattler et al. | Study on On-Machine Visualization of Surface Processing Phenomena in Nanoscale 5th report: Investigation on 3D motion of standard nanoparticle | |
| JP5418383B2 (ja) | 粒度分布測定装置及びプログラム | |
| JP2021525896A (ja) | 映像基盤の大面積試料分析装置、媒質の特性差を用いた映像基盤の試料分析装置及びこれを用いて試料を測定して分析する方法 | |
| WO2022153633A1 (ja) | 粒子密度計測方法及びその装置 |
Legal Events
| Date | Code | Title | Description |
|---|---|---|---|
| 121 | Ep: the epo has been informed by wipo that ep was designated in this application |
Ref document number: 19859950 Country of ref document: EP Kind code of ref document: A1 |
|
| ENP | Entry into the national phase |
Ref document number: 2020545916 Country of ref document: JP Kind code of ref document: A |
|
| ENP | Entry into the national phase |
Ref document number: 202017461 Country of ref document: GB Kind code of ref document: A Free format text: PCT FILING DATE = 20190830 |
|
| NENP | Non-entry into the national phase |
Ref country code: DE |
|
| 122 | Ep: pct application non-entry in european phase |
Ref document number: 19859950 Country of ref document: EP Kind code of ref document: A1 |