WO2019224906A1 - 産業プラント用画像解析装置および産業プラント監視制御システム - Google Patents
産業プラント用画像解析装置および産業プラント監視制御システム Download PDFInfo
- Publication number
- WO2019224906A1 WO2019224906A1 PCT/JP2018/019648 JP2018019648W WO2019224906A1 WO 2019224906 A1 WO2019224906 A1 WO 2019224906A1 JP 2018019648 W JP2018019648 W JP 2018019648W WO 2019224906 A1 WO2019224906 A1 WO 2019224906A1
- Authority
- WO
- WIPO (PCT)
- Prior art keywords
- image
- color
- region
- industrial plant
- rolled
- Prior art date
- Legal status (The legal status is an assumption and is not a legal conclusion. Google has not performed a legal analysis and makes no representation as to the accuracy of the status listed.)
- Ceased
Links
Images




Classifications
-
- B—PERFORMING OPERATIONS; TRANSPORTING
- B21—MECHANICAL METAL-WORKING WITHOUT ESSENTIALLY REMOVING MATERIAL; PUNCHING METAL
- B21B—ROLLING OF METAL
- B21B37/00—Control devices or methods specially adapted for metal-rolling mills or the work produced thereby
- B21B37/28—Control of flatness or profile during rolling of strip, sheets or plates
-
- B—PERFORMING OPERATIONS; TRANSPORTING
- B21—MECHANICAL METAL-WORKING WITHOUT ESSENTIALLY REMOVING MATERIAL; PUNCHING METAL
- B21B—ROLLING OF METAL
- B21B37/00—Control devices or methods specially adapted for metal-rolling mills or the work produced thereby
- B21B37/46—Roll speed or drive motor control
-
- G—PHYSICS
- G01—MEASURING; TESTING
- G01B—MEASURING LENGTH, THICKNESS OR SIMILAR LINEAR DIMENSIONS; MEASURING ANGLES; MEASURING AREAS; MEASURING IRREGULARITIES OF SURFACES OR CONTOURS
- G01B11/00—Measuring arrangements characterised by the use of optical techniques
Definitions
- the present invention relates to an industrial plant data reproduction apparatus and an industrial plant monitoring control system.
- the plant monitoring and control system of an industrial plant includes input / output devices (I / O) to which a large number of field devices (including actuators and sensors) constituting the plant are connected via a control network, and a large number of field devices.
- I / O input / output devices
- PLC programmable logic controller
- process data that are input / output signals of the PLC and the input / output device are collected by a data collection device having a data collection function and a data reproduction function.
- the data collection device displays collected process data and is used by an operator to grasp the state of the industrial plant.
- Patent Document 1 discloses an HMD (Hot Metal Detector) arranged in a steel plant.
- This HMD is installed at a position of a predetermined height immediately above the table roller downstream of the rolling roll, and the detection direction is set to a direction in which the rolling roll is desired in a substantially orthogonal direction and a horizontal direction.
- the HMD is a laser sensor having a narrow visual field, and outputs an ON signal if a hot mass is detected in the visual field, and an OFF signal if not detected.
- the sensor By disposing the sensor as in Patent Document 1, it is possible to detect the warping of the hot mass (rolled material). However, the sensor is expensive and its installation location is limited. Further, the sensor only outputs an ON signal or an OFF signal, and the state (shape, position, etc.) of the material to be rolled cannot be grasped in detail.
- the present inventor has intensively studied and, as a result, has decided to use moving image data to be photographed with a general camera like a sensor.
- a camera By using a camera, there are advantages such as cost reduction, a wide shooting range compared to the above-described sensor, a high degree of freedom of installation location, and a larger amount of information than sensor output.
- the present invention has been made to solve the above-described problems, and is an industry capable of supporting an operator who quantitatively analyzes the state of an imaging target in real time using moving image data and confirms the operating state of an industrial plant. It aims at providing the image-analysis apparatus for plants. It is another object of the present invention to provide an industrial plant monitoring and control system capable of realizing appropriate control according to the state of an object to be photographed using data quantified by an image analysis apparatus for an industrial plant.
- the industrial plant image analysis apparatus includes a moving image data collection unit, an image processing unit, an image quantification unit, and a numerical value output unit.
- the moving image data collection unit collects moving image data taken in real time by photographing the equipment constituting the industrial plant and the material processed into the equipment. Real-time does not necessarily indicate the moment when the image is taken, but includes data collection with a delay due to a communication path and data processing, and data collection at regular intervals.
- the image processing processing unit extracts an image from the moving image data at regular intervals, binarizes the image by converting the designated color to the first color and the other color to the second color.
- the constant period is preferably as short as possible, and real time is preferable.
- An image means one frame image extracted from moving image data.
- the designated color means not only a single color but also a designated color range.
- the image quantification unit quantifies the binarized image based on the number of pixels converted into the first color.
- an image quantification part calculates the ratio which the said 1st color occupies for each strip
- the image quantification unit calculates a ratio of the first color to each grid area obtained by dividing the binarized image into a grid pattern.
- the numerical value output unit outputs the quantified data.
- the industrial plant monitoring and control system includes the above-described industrial plant image analysis apparatus and a programmable logic controller that controls the device.
- the equipment includes a pair of rolling rolls for rolling the material to be rolled which is the material.
- the image processing unit binarizes the image of the material to be rolled viewed from the width direction.
- the image quantification unit and the programmable logic controller are configured as follows.
- the image quantification unit divides the binarized image into at least a first region and a second region adjacent to the first region in parallel with the conveyance direction of the material to be rolled, Calculate the percentage occupied by the first color.
- the programmable logic controller may generate an alarm signal when a difference between an increase in the proportion occupied by the first color in the second region and a decrease in the proportion occupied by the first color in the first region is greater than a threshold.
- At least one of control signals for changing the rotation speed of the pair of rolling rolls so as to suppress the warpage of the material to be rolled is output.
- the control signal is a signal for stopping the pair of rolling rolls, or a signal for making the rotational speed of the lower rolling roll slower than the rotational speed of the upper rolling roll.
- the image quantification unit and the programmable logic controller are configured as follows.
- the image quantification unit grids the binarized image, at least a first region, a second region adjacent to the first region, a third region adjacent to the first region, It divides
- the programmable logic controller increases the proportion of the first color in the order of the first region and the second region, and decreases the proportion of the first color in the third region according to the decrease in the proportion of the first color.
- the control signal is a signal for stopping the pair of rolling rolls, or a signal for making the rotational speed of the lower rolling roll slower than the rotational speed of the upper rolling roll.
- the industrial plant image analysis apparatus of the present invention it is possible to quantitatively analyze the state of the object to be photographed in real time using moving image data and to assist an operator who confirms the operation state of the industrial plant. Moreover, according to the industrial plant monitoring control system which concerns on this invention, appropriate control is realizable using the data quantified by the image analyzer for industrial plants.
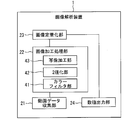
- FIG. 1 is a block diagram of an image analysis device according to Embodiment 1.
- FIG. 3 is a screen display example of the image analysis apparatus according to the first embodiment. It is a block diagram which shows the hardware structural example of the processing circuit which an image analysis apparatus has.
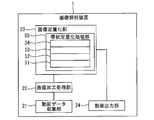
- 6 is a block diagram of an image analysis device according to Embodiment 2.
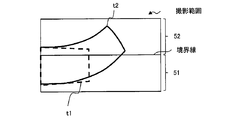
- FIG. 6 is an analysis example in the image analysis apparatus according to the second embodiment.
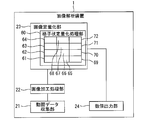
- 6 is a block diagram of an image analysis apparatus according to Embodiment 3.
- FIG. 12 is an analysis example in the image analysis apparatus according to the third embodiment.
- FIG. (System configuration) 1 is a schematic diagram showing a configuration of a plant monitoring control system for an industrial plant according to Embodiment 1.
- FIG. (System configuration) 1 is a schematic diagram showing a configuration of a plant monitoring control system for an industrial plant according to Embodiment 1.
- Steel plants are one of the industrial plants that produce materials and resources necessary for industrial activities.
- a high-temperature slab (rolled material) heated in a heating furnace is transported by a transport roll, and is thinly stretched to a desired thickness by a roughing mill and a finishing mill, and simultaneously processed to a desired width. Finally, it is wound up with a coiler.
- the plant monitoring control system is configured by connecting an image analysis device 1, a first monitoring camera 2, a second monitoring camera 3, a data collection device 7, an HMI 8, a PLC 9, and equipment (not shown) constituting an industrial plant. ing.
- the first monitoring camera 2 and the second monitoring camera 3 are arranged so that the equipment constituting the industrial plant and the material processed into the equipment are included in the imaging range.
- the first monitoring camera 2 is connected to the image data converter 4 via the image signal line 5.
- the video output of the first monitoring camera 2 is converted into a signal capable of network communication by the image data converter 4 and transmitted to the image analysis device 1 via the moving image network 6.
- the second monitoring camera 3 is a network camera, and the captured moving image data is transmitted to the image analysis device 1 via the moving image network 6.
- the image analysis apparatus 1 includes a programmable logic controller (PLC) 9 that controls equipment (including actuators and sensors) constituting an industrial plant via a control network 10 and an operator uses it for continuous operation and monitoring of the industrial plant. It is connected to a human machine interface (HMI) 8 and a data collection device 7 which are monitoring and control devices. Note that the image analysis device 1 may be incorporated in the data collection device 7.
- PLC programmable logic controller
- the control network 10 has a plurality of nodes having a common memory, and synchronizes data on the common memory by periodic broadcast transmission between the plurality of nodes. Thereby, the same memory space is virtually shared among the image analysis apparatus 1, the PLC 9, and the HMI 8. A storage area (address) for each data is allocated to the common memory. A device connected to each node can transmit and receive data by writing to and reading from the common memory.
- the image analysis apparatus 1 includes a moving image data collection unit 21, an image processing unit 22, an image quantification unit 23, and a numerical value output unit 24.
- the moving image data collection unit 21 collects moving image data obtained by photographing the equipment constituting the industrial plant and the material processed into the equipment in real time. Real-time does not necessarily indicate the moment when the image is taken, but includes data collection with a delay due to a communication path and data processing, and data collection at regular intervals. Specifically, the moving image data collection unit 21 collects moving image data from the first monitoring camera 2 and the second monitoring camera 3 via the moving image network 6 at regular intervals. The moving image data collection unit 21 outputs the moving image data to the image processing unit 22. The moving image data collection unit 21 accumulates the collected moving image data in the data storage unit 113b of the storage 113.
- the image processing unit 22 extracts an image from the moving image data at regular intervals, converts the designated color into the first color, and converts the color other than the designated color into the second color to binarize the image.
- the constant period is preferably as short as possible, and real time is preferable.
- An image means one frame image extracted from moving image data.
- the designated color means not only a single color but also a designated color range.
- the image processing unit 22 processes the image using the color filter unit 41, the binarization unit 42, and the mapping processing unit 43 shown in FIG. 2, and outputs the processed image to the image quantification unit 23. To do.
- the color filter unit 41 extracts designated colors related to devices and materials in the image.
- the designated color for example, a color of a red-hot material, a color indicating an abnormal temperature of a device or a material, or the like is set in advance.
- the binarization unit 42 binarizes the image by converting the designated color to the first color (for example, white) and the other color to the second color (for example, black). According to this, the amount of data can be reduced, and the calculation load of image processing processing and quantification processing can be reduced, and real-time performance can be ensured.
- the mapping processing unit 43 When the first monitoring camera 2 or the second monitoring camera 3 shoots an object to be photographed from an oblique direction, the mapping processing unit 43 performs mapping conversion to convert the image to be viewed from the side or directly above. According to this, since the degree of freedom of camera placement is high, it is possible to deal with not only the case where the camera cannot be placed directly above or next to the shooting target but also the environment where it is difficult to place the sensor near the shooting target. Note that if the camera can be placed directly above or next to the object to be imaged, the processing by the mapping processing unit 43 does not necessarily have to be executed.
- the image quantification unit 23 quantifies the binarized image based on the number of pixels converted to the first color. For example, the proportion of the first color in the image is calculated based on the number of pixels converted to the first color (for example, white) by the image processing unit 22.
- the image quantification unit 23 outputs the quantified data to the numerical value output unit 24.
- the numerical value output unit 24 outputs the quantified data to the data collection device 7, the HMI 8, and the PLC 9 via the control network 10.
- FIG. 3 is a diagram illustrating a display example displayed on the monitor 117 (FIG. 4) by the image analysis apparatus 1.
- the image analysis apparatus 1 displays the collected moving image data in real time on the left window 31.
- a pair of rolling rolls 312 (rough rolling mill or finish rolling mill) that rolls a material to be rolled 311 that is a material and a conveying roll 313 are included in the imaging range, and the material to be rolled 311 is The state of being rolled from a pair of rolling rolls 312 while being conveyed from left to right is displayed.
- the image analysis apparatus 1 displays an image obtained by binarizing the image being displayed in the left window 31 in the central window 32.
- a portion 321 indicating the material to be rolled is displayed in white, and the other portion 322 is displayed in black.
- the image analysis apparatus 1 displays a graph representing a change over time in the proportion of white in the binarized image in the right window 33.
- a graph representing a change over time of the ratio of white to each region divided in the horizontal direction is displayed.
- the data collection device 7 collects process data from the PLC 9 and the HMI 8.
- the process data includes various data related to equipment constituting the industrial plant and materials processed into the equipment. For example, an actuator control value, a sensor detection value, a material specification, and the like are included. In large-scale plants such as steel plants, there are thousands of input and output points, and a wide variety of process data exists. These process data are collected by a data collection device 7 having a data collection function and a data reproduction function, and are used for data analysis during testing, adjustment, operation, and failure.
- the data collection device 7 receives the quantified data from the image analysis device 1 and collects and accumulates it in synchronization with the process data. Note that the data collection device 7 can also receive the necessary data from the image analysis device 1 and realize the same display as in FIG.
- the HMI 8 displays the process data received from the PLC 9 with numerical values, characters and lamps.
- the HMI 8 includes an operation button that transmits a button input signal or a numerical value input signal, and outputs a signal for controlling the PLC 9 in response to pressing of the operation button. Further, the HMI 8 can receive quantified data from the image analysis apparatus 1 and display the numerical value, or can issue an alarm when the numerical value exceeds a predetermined threshold. .
- the PLC 9 controls the industrial plant by performing calculations based on inputs from sensors of the industrial plant and outputting signals to actuators such as valves and motors. Moreover, the industrial plant is controlled by receiving the data output from the image analysis apparatus 1 in the same manner as the input from the sensor, performing calculations, and outputting signals to actuators such as valves and motors. An alarm is issued when the calculation result exceeds the threshold value.
- the moving image data collected in real time from the monitoring camera is quantified to grasp how much the shooting target is in the shooting range. be able to. Therefore, the image analysis apparatus 1 can quantitatively analyze the positions and shapes of the devices and materials in real time, and can assist the operator in confirming the operation state. Further, since no special sensor is used, the cost is low. For example, it is possible to reduce the cost of installing a sensor when detecting a warp of a hot strip or a thick plate. In addition, since the shooting range is wider than the sensor and the degree of freedom of the installation location is high, it is possible to grasp the state of the shooting target in various environments.
- the number of pixels converted to the first color is counted for the entire image, but the present invention is not limited to this.
- a partial region of the image may be specified, and the number of pixels converted into the first color for the region may be counted.
- the image analysis device 1 and the data collection device 7 of the first embodiment described above it is possible to display moving image data on the data collection device 7 in real time, and stored in the data collection device 7. It is also possible to reproduce the moving image data on the data collection device 7 from any specified time. It is possible to easily grasp the position and size with respect to past events, and to increase the accuracy of confirming the position and size. It is also possible to stop, fast forward, and fast reverse the moving image. These points are the same in the following embodiments.
- the image analysis apparatus 1 does not include the monitor 117, the keyboard 118, and the mouse 119 shown in FIG. 4 to be described later, but these may be included in the image analysis apparatus 1. This point is the same in the following embodiments.
- the steel plant is described as an example of the industrial system, but the present invention is not limited to this.
- Industrial systems also include power plants, petroleum plants, chemical plants and the like.
- FIG. 4 is a block diagram illustrating a hardware configuration example of a processing circuit included in the image analysis apparatus 1.
- the processing circuit includes a CPU 111, a memory 112, a storage 113 such as an HDD or a large-capacity memory, an external device I / F (interface) unit 114, a control network I / F unit 115a, and a moving image network I. / F unit 115b is connected via an internal bus 116.
- the data collection device 7 is configured in the same manner.
- the CPU 111 implements the functions of each unit of the image analysis device 1 by executing various programs stored in the program storage unit 113a of the storage 113.
- the memory 112 is used as a calculation area unit that temporarily stores and expands data when the CPU 111 executes various programs.
- the storage 113 includes a program storage unit 113a and a data storage unit 113b.
- the program storage unit 113a stores an OS (operating system) and various programs.
- the data storage unit 113b stores the collected process data and moving image data at each time.
- the program storage unit 113a and the data storage unit 113b are provided in one storage 113, but the program storage unit 113a and the data storage unit 113b are separately arranged in a plurality of storages. May be.
- the external device I / F unit 114 is an interface for connecting the external device such as the monitor 117, the keyboard 118, and the mouse 119 to the image analysis apparatus 1.
- the control network I / F unit 115 a is an interface for connecting the control network 10 and the image analysis apparatus 1.
- the moving image network I / F unit 115 b is an interface for connecting the moving image network 6 and the image analysis apparatus 1.
- Embodiment 2 will be described with reference to FIGS.
- the ratio of the first color to the entire image is calculated.
- the ratio occupied by the first color is calculated for each band-shaped area obtained by dividing the image into bands, and the change in the ratio occupied by the first color in each band-shaped area is compared to obtain the subject to be imaged It was decided to analyze the state of.
- FIG. 5 is a block diagram of the image analysis apparatus 1 according to the second embodiment.
- the configuration shown in FIG. 5 is the same as that shown in FIG. 2 except that the image quantification unit 23 includes the strip quantification processing unit 50, and therefore, the description of the common configuration is omitted or simplified.
- the image processing unit 22 binarizes the image of the material viewed from the width direction.
- the strip quantification processing unit 50 calculates the ratio of the first color (for example, white) to each strip region obtained by dividing the image binarized by the image processing processing unit 22 in parallel with the material conveyance direction. In the example of FIG. 5, the binarized image is divided into four in the horizontal direction. The four divided areas are referred to as a band-shaped area A51, a band-shaped area B52, a band-shaped area C53, and a band-shaped area D54 from the bottom.
- the strip quantification processing unit 50 calculates the ratio of the number of white pixels for each strip region.
- the position and shape of the object to be photographed are calculated in real time by calculating in real time the ratio of the first color in each band-shaped area obtained by dividing the image into layers (hereinafter also referred to as the first color ratio). Can be quantitatively grasped.
- the material to be rolled 311 (FIG. 3), which is a material, may jump on the transport roll 313 (FIG. 3) of the steel plant.
- the object to be imaged (rolled material) moves in parallel from the strip region A51 to the strip region B52. Therefore, it can be confirmed that the object to be imaged has been translated by confirming that the increase amount of the first color ratio of the band-like region B52 is equal to the decrease amount of the first color ratio of the band-like region A51.
- the shape of the subject to be photographed may be deformed.
- the material to be rolled 311 (FIG. 3) may warp due to rolling.
- FIG. t1 is the shape of the material to be rolled in the previous period
- t2 is the shape of the material to be rolled in the current period.
- the strip quantification processing unit 50 divides the binarized image into at least a strip region A51 and a strip region B52 adjacent to the strip region in parallel with the conveyance direction of the material to be rolled. Calculate the color percentage.
- the boundary between the strip region A51 and the strip region B52 is set between the upper surface and the lower surface of the material to be rolled.
- the operator confirms the change in the first color ratio in each belt-like region accompanying the change from t1 to t2.
- the operator confirms the magnitude of the difference between the increase amount of the first color ratio in the band-like region B52 and the decrease amount of the first color ratio in the band-like region A51, it is possible to quantitatively grasp the warpage of the material to be rolled. .
- the image analysis apparatus 1 can support the confirmation work by the operator by displaying a graph showing the temporal change of the first color ratio in each band-like area as exemplified in the right window 33 of FIG.
- the PLC 9 receives the data output from the numerical value output unit 24 (first color ratio in each belt-like region).
- the PLC 9 performs control according to the position of the shooting target, control according to the change movement amount of the shooting target, control according to the shape of the shooting target (for example, according to the amount of warping) from the first color ratio in each band-like region. Control).
- the PLC 9 suppresses the alarm signal and the warping of the material to be rolled.
- the control signal is a signal for stopping the pair of rolling rolls 312 or a signal for making the rotation speed of the lower rolling roll slower than the rotation speed of the upper rolling roll.
- the PLC 9 Outputting a signal to make the rotation speed slower than the rotation speed of the upper rolling roll, and outputting a signal to stop the pair of rolling rolls 312 when the difference is larger than the second threshold (greater than the first threshold). Also good.
- the PLC 9 may output an alarm signal that is more urgent as the difference is larger.
- the operator can confirm the position and size of the machine and the material with higher accuracy than in the first embodiment. Can support. Further, using the data quantified by the strip quantification processing unit 50, the PLC 9 can realize appropriate control according to the state of the imaging target. For example, it is possible to change the control value so that the device that is the subject of photographing can move to an appropriate position, or to change the control value in order to prevent the material to be photographed from colliding with the sensor or machine. .
- the band-like quantification processing unit 50 sets the band-like area in the horizontal direction
- the band-like area may be set in the vertical direction or in the oblique direction.
- band-like quantification processing unit 50 according to Embodiment 2 described above divides the screen into four, it may be divided into two, three, or five or more.
- Embodiment 3 will be described with reference to FIGS.
- the ratio of the first color to the entire image is calculated.
- the ratio occupied by the first color is calculated for each grid area obtained by dividing the image into a grid pattern, and the change of the ratio occupied by the first color in each grid area is compared. Therefore, it was decided to analyze the state of the shooting target in more detail.
- FIG. 7 is a block diagram of the image analysis apparatus 1 according to the third embodiment.
- the configuration shown in FIG. 7 is the same as that in FIG. 2 or FIG. 5 except that the image quantification unit 23 includes a grid-like quantification processing unit 60, and therefore description of the common configuration is omitted or simplified.
- the image processing unit 22 binarizes the image of the material viewed from the width direction.
- the grid-like quantification processing unit 60 calculates a ratio of the first color (for example, white) to each grid-like region obtained by dividing the image binarized by the image processing processing unit 22 into a grid.
- the binarized image is divided into four areas in the horizontal direction and three areas in the vertical direction, and is divided into a total of 12 areas.
- the divided regions are divided into a lattice region A61, a lattice region B62, a lattice region C63, a lattice region D64, a lattice region E65, a lattice region F66, a lattice region G67, a lattice region H68, and a lattice region I69. These are referred to as a lattice region J70, a lattice region K71, and a lattice region L72.
- the grid quantification processing unit 60 calculates the ratio of the number of white pixels for each grid area.
- the ratio of the first color in each grid area obtained by dividing the image into grid patterns (hereinafter also referred to as the first color ratio) is calculated in real time, and the change in the first color ratio is confirmed, so that the position of the object to be imaged And change in shape can be grasped quantitatively.
- the material to be rolled 311 (FIG. 3), which is a material, may jump on the transport roll 313 (FIG. 3) of the steel plant.
- the object to be imaged (rolled material) is translated from the lattice area A61 to the lattice area B62. Therefore, it can be confirmed that the object to be imaged has moved in parallel by confirming that the increase amount of the first color ratio of the grid area A61 and the decrease amount of the first color ratio of the grid area B62 are equal.
- the first color ratio of the grid area A61 is saturated and the first color ratio of the grid area F66 increases. . From the increase / decrease amount of the first color ratio of the adjacent lattice area B62 and the increase / decrease amount of the first color ratio of the lattice area E65, it can be confirmed whether or not the subject to be photographed has expanded without lateral blur.
- the shape of the subject to be photographed may be deformed.
- the material to be rolled 311 (FIG. 3) may warp due to rolling.
- An example of image analysis will be described with reference to FIG. t3 is the shape of the material to be rolled in the previous period, and t4 is the shape of the material to be rolled in the current period.
- the grid quantification processing unit 60 grids the binarized image at least on the grid area F66, the grid area J70 adjacent to the grid area F66, and the grid area F66. And a grid area K71 adjacent to the grid area J70 and next to the grid area G67, and the first color ratio is calculated for each area.
- the boundary between the lattice region F66 and the lattice region G67 is set above the material to be rolled.
- the operator confirms the change in the first color ratio in each grid area accompanying the change from t3 to t4.
- the first color ratio increases in the order of the grid area F66 and the grid area J70, and the first color ratio in the grid area K71 increases in accordance with the decrease in the first color ratio in the grid area G67.
- the PLC 9 receives the data (first color ratio in each grid area) output from the numerical value output unit 24.
- the PLC 9 performs control according to the position of the shooting target from the first color ratio in each grid area, control according to the change movement amount of the shooting target, control according to the shape of the shooting target (for example, according to the amount of warping) Control).
- the first color ratio increases in the order of the grid area F 66 and the grid area J 70, and the first color ratio in the grid area K 71 increases in accordance with the decrease in the first color ratio in the grid area G 67.
- the control signal is a signal for stopping the pair of rolling rolls 312 or a signal for making the rotation speed of the lower rolling roll slower than the rotation speed of the upper rolling roll.
- the operator can confirm the position and size of the machine and the material more accurately than in the first embodiment. High support. Further, using the data quantified by the strip quantification processing unit 50, the PLC 9 can realize appropriate control according to the state of the imaging target.
- system of the third embodiment described above can be combined with the system of the first embodiment and the system of the second embodiment.
- the lattice-like quantification processing unit 60 defines the regions in the lattice shape in the horizontal direction and the vertical direction, the lattice-like regions may be set in the oblique direction.
- the lattice-like quantification processing unit 60 of the above-described third embodiment divides the image into 12 parts, but the number of divisions is not limited as long as it is equally divided.
- the subject to be photographed is photographed from an oblique angle, it is processed into an image from the side or directly above by mapping conversion.
- the movement amount and deformation amount of the photographing target may be small. In this case, it is possible to detect the amount of movement and the amount of deformation reduced by increasing the number of grid-like divisions.
Landscapes
- Engineering & Computer Science (AREA)
- Mechanical Engineering (AREA)
- Physics & Mathematics (AREA)
- General Physics & Mathematics (AREA)
- Testing And Monitoring For Control Systems (AREA)
- Control Of Metal Rolling (AREA)
- Length Measuring Devices By Optical Means (AREA)
- Image Analysis (AREA)
Abstract
Description
また、本発明は、産業プラント用画像解析装置により定量化されたデータを用いて、撮影対象の状態に応じた適切な制御を実現できる産業プラント監視制御システムを提供することを目的とする。
(システム構成)
図1は、実施の形態1に係る産業プラントのプラント監視制御システムの構成を示す概略図である。
画像解析装置1は、動画データ収集部21、画像加工処理部22、画像定量化部23、数値出力部24を備える。
画像解析装置1のハードウェア構成について図4を参照して説明する。図4は、画像解析装置1が有する処理回路のハードウェア構成例を示すブロック図である。図2に示す画像解析装置1の各部は、画像解析装置1が有する機能の一部を示し、各機能は処理回路により実現される。例えば、処理回路は、CPU111と、メモリ112と、HDDや大容量メモリ等のストレージ113と、外部機器I/F(インターフェース)部114と、制御用ネットワークI/F部115aと、動画用ネットワークI/F部115bとが、内部バス116を介して接続して構成されている。なお、データ収集装置7も同様に構成されている。
次に、図5および図6を参照して実施の形態2について説明する。上述した実施の形態1では、画像全体に第1カラーが占める割合を計算している。これに対し、実施の形態2では、画像を帯状に分割した各帯状領域について第1カラーが占める割合を計算し、各帯状領域での第1カラーが占める割合の変化を比較して、撮影対象の状態をより詳細に解析することとした。
次に、図7および図8を参照して実施の形態3について説明する。上述した実施の形態1では、画像全体に第1カラーが占める割合を計算している。これに対し、実施の形態3では、画像を格子状に分割した各格子状領域について第1カラーが占める割合を計算し、各格子状領域での第1カラーが占める割合の変化を比較して、撮影対象の状態をより詳細に解析することとした。
2 第1監視カメラ
3 第2監視カメラ
4 画像データ変換器
5 画像用信号線
6 動画用ネットワーク
7 データ収集装置
8 HMI
9 PLC
10 制御用ネットワーク
21 動画データ収集部
22 画像加工処理部
23 画像定量化部
24 数値出力部
31 左ウインドウ
32 中央ウインドウ
33 右ウインドウ
311 被圧延材
312 一対の圧延ロール
313 搬送ロール
41 カラーフィルタ部
42 2値化部
43 写像加工部
50 帯状定量化処理部
60 格子状定量化処理部
51~54 帯状領域A~帯状領域D
61~72 格子状領域A~格子状領域L
111 CPU
112 メモリ
113,113a,113b ストレージ,プログラム記憶部,データ記憶部
114 外部機器I/F部
115a,115b 制御用ネットワークI/F部,動画用ネットワークI/F部
116 内部バス
117 モニタ
118 キーボード
119 マウス
Claims (5)
- 産業プラントを構成する機器および該機器に加工される材料を撮影した動画データをリアルタイムに収集する動画データ収集部と、
一定周期毎に、前記動画データから画像を抽出し、指定色を第1カラーに、該指定色以外を第2カラーに変換して該画像を2値化する画像加工処理部と、
前記第1カラーに変換された画素数に基づいて前記2値化された画像を定量化する画像定量化部と、
前記定量化されたデータを出力する数値出力部と、
を備えることを特徴とする産業プラント用画像解析装置。 - 前記画像定量化部は、前記2値化された画像を前記材料の搬送方向と平行に分割した各帯状領域について前記第1カラーが占める割合を計算すること、
を特徴とする請求項1記載の産業プラント用画像解析装置。 - 前記画像定量化部は、前記2値化された画像を格子状に分割した各格子状領域について前記第1カラーが占める割合を計算すること、
を特徴とする請求項1又は2記載の産業プラント用画像解析装置。 - 請求項1の産業プラント用画像解析装置と、
前記機器を制御するプログラマブルロジックコントローラと、を備え、
前記機器は、前記材料である被圧延材を圧延する一対の圧延ロールを含み、
前記画像加工処理部は、前記被圧延材を幅方向から見た前記画像について2値化し、
前記画像定量化部は、前記2値化された画像を前記被圧延材の搬送方向と平行に、少なくとも第1領域と前記第1領域の上に隣接する第2領域とに分割し、各領域について前記第1カラーが占める割合を計算し、
前記プログラマブルロジックコントローラは、前記第2領域中の前記第1カラーが占める割合の増加量と前記第1領域中の前記第1カラーが占める割合の減少量との差が、閾値より大きい場合に、アラーム信号および前記被圧延材の上反りを抑制するように前記一対の圧延ロールの回転速度を変更する制御信号の少なくとも一方を出力すること、
を特徴とする産業プラント監視制御システム。 - 請求項1の産業プラント用画像解析装置と、
前記機器を制御するプログラマブルロジックコントローラと、を備え、
前記機器は、前記材料である被圧延材を圧延する一対の圧延ロールを含み、
前記画像加工処理部は、前記被圧延材を幅方向から見た前記画像について2値化し、
前記画像定量化部は、前記2値化された画像を格子状に、少なくとも第1領域と、前記第1領域の横に隣接する第2領域と、前記第1領域の上に隣接する第3領域と、前記第2領域の上かつ前記第3領域の横に隣接する第4領域とに分割し、各領域について前記第1カラーが占める割合を計算し、
前記プログラマブルロジックコントローラは、前記第1領域、前記第2領域の順に前記第1カラーが占める割合が増加し、かつ、前記第3領域中の前記第1カラーが占める割合の減少に応じて前記第4領域中の前記第1カラーが占める割合が増加する場合に、アラーム信号および前記被圧延材の上反りを抑制するように前記一対の圧延ロールの回転速度を変更する制御信号の少なくとも一方を出力すること、
を特徴とする産業プラント監視制御システム。
Priority Applications (5)
| Application Number | Priority Date | Filing Date | Title |
|---|---|---|---|
| JP2020520899A JP6849150B2 (ja) | 2018-05-22 | 2018-05-22 | 産業プラント監視制御システム |
| PCT/JP2018/019648 WO2019224906A1 (ja) | 2018-05-22 | 2018-05-22 | 産業プラント用画像解析装置および産業プラント監視制御システム |
| CN201880093515.7A CN112165996B (zh) | 2018-05-22 | 2018-05-22 | 产业成套设备监视控制系统 |
| BR112020023311-0A BR112020023311B1 (pt) | 2018-05-22 | Sistema de controle de monitoramento de instalação industrial | |
| TW107126335A TWI700567B (zh) | 2018-05-22 | 2018-07-30 | 產業工廠用畫像解析裝置及產業工廠監視控制系統 |
Applications Claiming Priority (1)
| Application Number | Priority Date | Filing Date | Title |
|---|---|---|---|
| PCT/JP2018/019648 WO2019224906A1 (ja) | 2018-05-22 | 2018-05-22 | 産業プラント用画像解析装置および産業プラント監視制御システム |
Publications (1)
| Publication Number | Publication Date |
|---|---|
| WO2019224906A1 true WO2019224906A1 (ja) | 2019-11-28 |
Family
ID=68616843
Family Applications (1)
| Application Number | Title | Priority Date | Filing Date |
|---|---|---|---|
| PCT/JP2018/019648 Ceased WO2019224906A1 (ja) | 2018-05-22 | 2018-05-22 | 産業プラント用画像解析装置および産業プラント監視制御システム |
Country Status (4)
| Country | Link |
|---|---|
| JP (1) | JP6849150B2 (ja) |
| CN (1) | CN112165996B (ja) |
| TW (1) | TWI700567B (ja) |
| WO (1) | WO2019224906A1 (ja) |
Cited By (3)
| Publication number | Priority date | Publication date | Assignee | Title |
|---|---|---|---|---|
| CN117161103A (zh) * | 2023-08-07 | 2023-12-05 | 中冶华天南京工程技术有限公司 | 一种轧钢作业安全联动系统及方法 |
| WO2023234904A1 (en) * | 2022-06-02 | 2023-12-07 | Cozge Irfan | Shopfloor data collection system for industrial machineries |
| WO2025046867A1 (ja) * | 2023-08-31 | 2025-03-06 | 東芝三菱電機産業システム株式会社 | 圧延記録装置、圧延記録方法、及び圧延記録プログラム |
Families Citing this family (1)
| Publication number | Priority date | Publication date | Assignee | Title |
|---|---|---|---|---|
| CN116967292B (zh) * | 2023-06-29 | 2024-12-03 | 鞍钢股份有限公司 | 一种粗轧板坯叩翘头自动控制的方法 |
Citations (5)
| Publication number | Priority date | Publication date | Assignee | Title |
|---|---|---|---|---|
| JPS63168209A (ja) * | 1986-12-27 | 1988-07-12 | Nippon Steel Corp | 鋼板の形状推定方法および装置 |
| JPH1074260A (ja) * | 1996-08-30 | 1998-03-17 | Shinko Electric Ind Co Ltd | めっき有無検査装置 |
| JP2001343223A (ja) * | 1999-11-08 | 2001-12-14 | Sumitomo Metal Ind Ltd | 帯状体の品質測定方法、キャンバ抑制方法、帯状体の品質測定装置、圧延装置及びトリム装置 |
| JP2013075326A (ja) * | 2011-09-30 | 2013-04-25 | Jfe Steel Corp | 熱間圧延設備 |
| JP2016186439A (ja) * | 2015-03-27 | 2016-10-27 | 株式会社ミツトヨ | 測定データ収集装置及びプログラム |
Family Cites Families (29)
| Publication number | Priority date | Publication date | Assignee | Title |
|---|---|---|---|---|
| JPH044925A (ja) * | 1990-04-23 | 1992-01-09 | Nippon Steel Corp | 熱延クロップ落下自動検出方法 |
| JPH04178209A (ja) * | 1990-11-09 | 1992-06-25 | Nippon Steel Corp | 熱間仕上圧延機における板曲り制御装置 |
| JP4351810B2 (ja) * | 2001-03-15 | 2009-10-28 | 東芝Itコントロールシステム株式会社 | 周期性欠陥検出装置 |
| JP2004363085A (ja) * | 2003-05-09 | 2004-12-24 | Ebara Corp | 荷電粒子線による検査装置及びその検査装置を用いたデバイス製造方法 |
| JP2005012273A (ja) * | 2003-06-16 | 2005-01-13 | Ricoh Co Ltd | 画像処理装置、画像処理方法、画像処理プログラム及び記録媒体 |
| JP4314123B2 (ja) * | 2004-01-30 | 2009-08-12 | 株式会社山武 | アラーム解析装置、アラーム解析方法及びアラーム解析プログラム |
| JP4276608B2 (ja) * | 2004-10-05 | 2009-06-10 | 新日本製鐵株式会社 | 帯状体や柱状体の周期性疵検出方法およびその装置 |
| CN100582755C (zh) * | 2005-03-17 | 2010-01-20 | 欧姆龙株式会社 | 基板检查装置及其检查逻辑设定方法和检查逻辑设定装置 |
| JP4935109B2 (ja) * | 2005-03-17 | 2012-05-23 | オムロン株式会社 | 基板検査装置並びにその検査ロジック設定方法および検査ロジック設定装置 |
| DE102005051053A1 (de) * | 2005-10-25 | 2007-04-26 | Sms Demag Ag | Verfahren zur Bandkantenerfassung |
| JP2008305259A (ja) * | 2007-06-08 | 2008-12-18 | Nec Electronics Corp | 生産設備稼働状態データ収集システム |
| CN101224472A (zh) * | 2008-02-03 | 2008-07-23 | 东北大学 | 一种基于近红外图像的板材头部弯曲形状检测装置及方法 |
| JP5322713B2 (ja) * | 2008-04-08 | 2013-10-23 | Jx日鉱日石エネルギー株式会社 | 監視装置 |
| US8506159B2 (en) * | 2008-09-17 | 2013-08-13 | Nippon Steel & Sumitomo Metal Corporation | Method for detecting defect in material and system for the method |
| IN2012DN03206A (ja) * | 2009-10-19 | 2015-10-23 | Sumitomo Electric Industries | |
| JP5538969B2 (ja) * | 2010-03-23 | 2014-07-02 | 三菱電機株式会社 | 画像目標検出装置および画像目標検出方法 |
| CN102441581A (zh) * | 2010-09-30 | 2012-05-09 | 邓玥 | 基于机器视觉的型钢断面尺寸在线检测的装置及方法 |
| JP5760462B2 (ja) * | 2011-02-01 | 2015-08-12 | Jfeスチール株式会社 | 尾端クロップ検出装置 |
| ES2530619T3 (es) * | 2011-04-26 | 2015-03-04 | Ct De Rech S Métallurgiques Asbl Ct Voor Res In De Metallurg Vzw | Aparato y método para la medición en línea industrial de la topografía micrométrica y de la ondulación de productos en movimiento |
| CN102836886B (zh) * | 2011-06-24 | 2014-12-03 | 宝山钢铁股份有限公司 | 热轧轧件头尾位置及运动方向的检测方法 |
| CN102322798A (zh) * | 2011-08-18 | 2012-01-18 | 大连康基科技有限公司 | 基于光学成像的工业测量系统 |
| JP2014059278A (ja) * | 2012-09-19 | 2014-04-03 | Toshiba Corp | 印刷検査装置 |
| JP5983771B2 (ja) * | 2012-12-25 | 2016-09-06 | 東芝三菱電機産業システム株式会社 | 板反り検出装置、デスケーリング制御装置、パススケジュール計算装置 |
| JP6171908B2 (ja) * | 2013-12-11 | 2017-08-02 | 東芝三菱電機産業システム株式会社 | データ解析装置 |
| JP6264026B2 (ja) * | 2013-12-24 | 2018-01-24 | 株式会社リコー | エッジ検出装置、画像形成装置およびエッジ検出方法 |
| KR20160029500A (ko) * | 2014-09-05 | 2016-03-15 | 삼성에스디에스 주식회사 | 지정 영역 색상 통계 정보 생성 장치 및 방법, 객체 검출 장치 및 방법 |
| JP6575232B2 (ja) * | 2014-09-22 | 2019-09-18 | 日本製鉄株式会社 | 鋼板形状測定装置及びその方法、並びにそれらを用いた鋼板製造装置及びその方法 |
| CN104392213B (zh) * | 2014-11-19 | 2017-12-19 | 郑可尧 | 一种适用于熔炼过程中的图像信息状态识别系统 |
| TWI574754B (zh) * | 2016-04-22 | 2017-03-21 | 中國鋼鐵股份有限公司 | 軋輥機台監控方法 |
-
2018
- 2018-05-22 CN CN201880093515.7A patent/CN112165996B/zh active Active
- 2018-05-22 WO PCT/JP2018/019648 patent/WO2019224906A1/ja not_active Ceased
- 2018-05-22 JP JP2020520899A patent/JP6849150B2/ja active Active
- 2018-07-30 TW TW107126335A patent/TWI700567B/zh active
Patent Citations (5)
| Publication number | Priority date | Publication date | Assignee | Title |
|---|---|---|---|---|
| JPS63168209A (ja) * | 1986-12-27 | 1988-07-12 | Nippon Steel Corp | 鋼板の形状推定方法および装置 |
| JPH1074260A (ja) * | 1996-08-30 | 1998-03-17 | Shinko Electric Ind Co Ltd | めっき有無検査装置 |
| JP2001343223A (ja) * | 1999-11-08 | 2001-12-14 | Sumitomo Metal Ind Ltd | 帯状体の品質測定方法、キャンバ抑制方法、帯状体の品質測定装置、圧延装置及びトリム装置 |
| JP2013075326A (ja) * | 2011-09-30 | 2013-04-25 | Jfe Steel Corp | 熱間圧延設備 |
| JP2016186439A (ja) * | 2015-03-27 | 2016-10-27 | 株式会社ミツトヨ | 測定データ収集装置及びプログラム |
Cited By (4)
| Publication number | Priority date | Publication date | Assignee | Title |
|---|---|---|---|---|
| WO2023234904A1 (en) * | 2022-06-02 | 2023-12-07 | Cozge Irfan | Shopfloor data collection system for industrial machineries |
| CN117161103A (zh) * | 2023-08-07 | 2023-12-05 | 中冶华天南京工程技术有限公司 | 一种轧钢作业安全联动系统及方法 |
| WO2025046867A1 (ja) * | 2023-08-31 | 2025-03-06 | 東芝三菱電機産業システム株式会社 | 圧延記録装置、圧延記録方法、及び圧延記録プログラム |
| JP7662106B1 (ja) * | 2023-08-31 | 2025-04-15 | 株式会社Tmeic | 圧延記録装置、圧延記録方法、及び圧延記録プログラム |
Also Published As
| Publication number | Publication date |
|---|---|
| TWI700567B (zh) | 2020-08-01 |
| CN112165996B (zh) | 2022-07-29 |
| JPWO2019224906A1 (ja) | 2020-12-10 |
| JP6849150B2 (ja) | 2021-03-24 |
| CN112165996A (zh) | 2021-01-01 |
| TW202004377A (zh) | 2020-01-16 |
| BR112020023311A2 (pt) | 2021-02-02 |
Similar Documents
| Publication | Publication Date | Title |
|---|---|---|
| WO2019224906A1 (ja) | 産業プラント用画像解析装置および産業プラント監視制御システム | |
| JP6226539B2 (ja) | 情報処理装置、情報処理装置の制御方法、およびプログラム | |
| CN104169964A (zh) | 图像处理装置及图像处理程序记录介质 | |
| KR20150068273A (ko) | 데이터 해석 장치 | |
| JP2011049980A (ja) | 画像処理プログラムおよび画像処理装置 | |
| JPWO2019160070A1 (ja) | 異常音検知装置および異常音検知方法 | |
| JP2016532099A (ja) | 画像化の同期 | |
| JP5955170B2 (ja) | 表示制御装置、表示制御方法、及びプログラム | |
| JP7020392B2 (ja) | データ収集再生システム | |
| JP7176429B2 (ja) | ガス漏れ位置特定システム及びガス漏れ位置特定プログラム | |
| JP2007322482A5 (ja) | ||
| JP6195688B1 (ja) | 非定常検出装置、非定常検出システムおよび非定常検出方法 | |
| KR20130097286A (ko) | 고정형 카메라를 이용한 이동형 카메라의 제어장치 및 그 제어방법 | |
| JPH04263395A (ja) | 設備監視システム | |
| JP6459550B2 (ja) | 機械設備の異常検出方法および異常検出装置 | |
| WO2020250501A1 (ja) | データ抽出装置、データ抽出装置の制御方法、情報処理プログラム、および記録媒体 | |
| JP6809128B2 (ja) | 画像処理装置、画像処理方法、および画像処理プログラム | |
| CN214040337U (zh) | 一种基于声音分贝的监测系统 | |
| JP2763169B2 (ja) | プラントの異常検知装置 | |
| WO2014162666A1 (ja) | 形状計測装置 | |
| KR20200079000A (ko) | 통합 환경 감시 시스템 및 그 시스템의 데이터 제어방법 | |
| JP2941511B2 (ja) | モ−ルド内ボイル検出方法 | |
| TWI661287B (zh) | 產業工廠用資料再生裝置 | |
| JP2012173044A (ja) | 鋼板の表面疵検査装置 | |
| WO2020115884A1 (ja) | 検査装置 |
Legal Events
| Date | Code | Title | Description |
|---|---|---|---|
| 121 | Ep: the epo has been informed by wipo that ep was designated in this application |
Ref document number: 18919811 Country of ref document: EP Kind code of ref document: A1 |
|
| ENP | Entry into the national phase |
Ref document number: 2020520899 Country of ref document: JP Kind code of ref document: A |
|
| NENP | Non-entry into the national phase |
Ref country code: DE |
|
| REG | Reference to national code |
Ref country code: BR Ref legal event code: B01A Ref document number: 112020023311 Country of ref document: BR |
|
| ENP | Entry into the national phase |
Ref document number: 112020023311 Country of ref document: BR Kind code of ref document: A2 Effective date: 20201116 |
|
| 122 | Ep: pct application non-entry in european phase |
Ref document number: 18919811 Country of ref document: EP Kind code of ref document: A1 |