WO2018020703A1 - Dispositif d'analyse d'informations de pilotage - Google Patents
Dispositif d'analyse d'informations de pilotage Download PDFInfo
- Publication number
- WO2018020703A1 WO2018020703A1 PCT/JP2016/087503 JP2016087503W WO2018020703A1 WO 2018020703 A1 WO2018020703 A1 WO 2018020703A1 JP 2016087503 W JP2016087503 W JP 2016087503W WO 2018020703 A1 WO2018020703 A1 WO 2018020703A1
- Authority
- WO
- WIPO (PCT)
- Prior art keywords
- information
- information analysis
- driving
- unit
- index value
- Prior art date
Links
Images


Classifications
-
- G—PHYSICS
- G05—CONTROLLING; REGULATING
- G05B—CONTROL OR REGULATING SYSTEMS IN GENERAL; FUNCTIONAL ELEMENTS OF SUCH SYSTEMS; MONITORING OR TESTING ARRANGEMENTS FOR SUCH SYSTEMS OR ELEMENTS
- G05B23/00—Testing or monitoring of control systems or parts thereof
- G05B23/02—Electric testing or monitoring
- G05B23/0205—Electric testing or monitoring by means of a monitoring system capable of detecting and responding to faults
- G05B23/0259—Electric testing or monitoring by means of a monitoring system capable of detecting and responding to faults characterized by the response to fault detection
- G05B23/0267—Fault communication, e.g. human machine interface [HMI]
- G05B23/0272—Presentation of monitored results, e.g. selection of status reports to be displayed; Filtering information to the user
-
- G—PHYSICS
- G05—CONTROLLING; REGULATING
- G05B—CONTROL OR REGULATING SYSTEMS IN GENERAL; FUNCTIONAL ELEMENTS OF SUCH SYSTEMS; MONITORING OR TESTING ARRANGEMENTS FOR SUCH SYSTEMS OR ELEMENTS
- G05B23/00—Testing or monitoring of control systems or parts thereof
- G05B23/02—Electric testing or monitoring
- G05B23/0205—Electric testing or monitoring by means of a monitoring system capable of detecting and responding to faults
- G05B23/0218—Electric testing or monitoring by means of a monitoring system capable of detecting and responding to faults characterised by the fault detection method dealing with either existing or incipient faults
- G05B23/0221—Preprocessing measurements, e.g. data collection rate adjustment; Standardization of measurements; Time series or signal analysis, e.g. frequency analysis or wavelets; Trustworthiness of measurements; Indexes therefor; Measurements using easily measured parameters to estimate parameters difficult to measure; Virtual sensor creation; De-noising; Sensor fusion; Unconventional preprocessing inherently present in specific fault detection methods like PCA-based methods
-
- G—PHYSICS
- G05—CONTROLLING; REGULATING
- G05B—CONTROL OR REGULATING SYSTEMS IN GENERAL; FUNCTIONAL ELEMENTS OF SUCH SYSTEMS; MONITORING OR TESTING ARRANGEMENTS FOR SUCH SYSTEMS OR ELEMENTS
- G05B23/00—Testing or monitoring of control systems or parts thereof
- G05B23/02—Electric testing or monitoring
- G05B23/0205—Electric testing or monitoring by means of a monitoring system capable of detecting and responding to faults
- G05B23/0208—Electric testing or monitoring by means of a monitoring system capable of detecting and responding to faults characterized by the configuration of the monitoring system
- G05B23/0216—Human interface functionality, e.g. monitoring system providing help to the user in the selection of tests or in its configuration
-
- G—PHYSICS
- G05—CONTROLLING; REGULATING
- G05B—CONTROL OR REGULATING SYSTEMS IN GENERAL; FUNCTIONAL ELEMENTS OF SUCH SYSTEMS; MONITORING OR TESTING ARRANGEMENTS FOR SUCH SYSTEMS OR ELEMENTS
- G05B19/00—Programme-control systems
- G05B19/02—Programme-control systems electric
- G05B19/418—Total factory control, i.e. centrally controlling a plurality of machines, e.g. direct or distributed numerical control [DNC], flexible manufacturing systems [FMS], integrated manufacturing systems [IMS], computer integrated manufacturing [CIM]
- G05B19/41885—Total factory control, i.e. centrally controlling a plurality of machines, e.g. direct or distributed numerical control [DNC], flexible manufacturing systems [FMS], integrated manufacturing systems [IMS], computer integrated manufacturing [CIM] characterised by modeling, simulation of the manufacturing system
-
- G—PHYSICS
- G05—CONTROLLING; REGULATING
- G05B—CONTROL OR REGULATING SYSTEMS IN GENERAL; FUNCTIONAL ELEMENTS OF SUCH SYSTEMS; MONITORING OR TESTING ARRANGEMENTS FOR SUCH SYSTEMS OR ELEMENTS
- G05B23/00—Testing or monitoring of control systems or parts thereof
- G05B23/02—Electric testing or monitoring
- G05B23/0205—Electric testing or monitoring by means of a monitoring system capable of detecting and responding to faults
- G05B23/0218—Electric testing or monitoring by means of a monitoring system capable of detecting and responding to faults characterised by the fault detection method dealing with either existing or incipient faults
- G05B23/0224—Process history based detection method, e.g. whereby history implies the availability of large amounts of data
- G05B23/0227—Qualitative history assessment, whereby the type of data acted upon, e.g. waveforms, images or patterns, is not relevant, e.g. rule based assessment; if-then decisions
- G05B23/0235—Qualitative history assessment, whereby the type of data acted upon, e.g. waveforms, images or patterns, is not relevant, e.g. rule based assessment; if-then decisions based on a comparison with predetermined threshold or range, e.g. "classical methods", carried out during normal operation; threshold adaptation or choice; when or how to compare with the threshold
-
- G—PHYSICS
- G05—CONTROLLING; REGULATING
- G05B—CONTROL OR REGULATING SYSTEMS IN GENERAL; FUNCTIONAL ELEMENTS OF SUCH SYSTEMS; MONITORING OR TESTING ARRANGEMENTS FOR SUCH SYSTEMS OR ELEMENTS
- G05B23/00—Testing or monitoring of control systems or parts thereof
- G05B23/02—Electric testing or monitoring
- G05B23/0205—Electric testing or monitoring by means of a monitoring system capable of detecting and responding to faults
- G05B23/0259—Electric testing or monitoring by means of a monitoring system capable of detecting and responding to faults characterized by the response to fault detection
- G05B23/0286—Modifications to the monitored process, e.g. stopping operation or adapting control
-
- G—PHYSICS
- G06—COMPUTING; CALCULATING OR COUNTING
- G06F—ELECTRIC DIGITAL DATA PROCESSING
- G06F16/00—Information retrieval; Database structures therefor; File system structures therefor
- G06F16/20—Information retrieval; Database structures therefor; File system structures therefor of structured data, e.g. relational data
- G06F16/23—Updating
- G06F16/2358—Change logging, detection, and notification
-
- G—PHYSICS
- G06—COMPUTING; CALCULATING OR COUNTING
- G06F—ELECTRIC DIGITAL DATA PROCESSING
- G06F16/00—Information retrieval; Database structures therefor; File system structures therefor
- G06F16/20—Information retrieval; Database structures therefor; File system structures therefor of structured data, e.g. relational data
- G06F16/24—Querying
- G06F16/245—Query processing
- G06F16/2458—Special types of queries, e.g. statistical queries, fuzzy queries or distributed queries
- G06F16/2477—Temporal data queries
-
- G—PHYSICS
- G06—COMPUTING; CALCULATING OR COUNTING
- G06F—ELECTRIC DIGITAL DATA PROCESSING
- G06F16/00—Information retrieval; Database structures therefor; File system structures therefor
- G06F16/20—Information retrieval; Database structures therefor; File system structures therefor of structured data, e.g. relational data
- G06F16/28—Databases characterised by their database models, e.g. relational or object models
- G06F16/284—Relational databases
- G06F16/285—Clustering or classification
Definitions
- the present invention relates to a driving information analysis device.
- Patent Document 1 discloses a driving situation analysis system that analyzes the driving situation of a device connected to a distributed field control system, and collects information on the control state of the device or the operation on the device, and It is disclosed that an index value related to the utilization of the device is calculated based on that, and a comparative analysis of the utilization of the device among a plurality of sites is performed based on the index value.
- the driving situation analysis system of the above-mentioned patent document 1 is, for example, the integrated value of the deviation amount from the setting value of the control value for each day, or the total time during which a specific control value in one day is controlled by automatic control.
- the degree of utilization of the device is compared and analyzed by comparing the index value with similar devices at other sites using the index value etc.
- the process amount of the device to be monitored and the occurrence status of event information also change. For this reason, there is a possibility that the operating condition of the device can not be accurately evaluated only by analyzing the index value by dividing into unit time, such as every day, like the operating condition analysis system of Patent Document 1.
- the present invention has been made in view of the above, and it is an object of the present invention to provide a driving information analysis device capable of more accurately evaluating the driving condition of the device.
- the present invention arranges an information collecting unit for collecting event information generated during operation of a device including a plurality of devices, and the collected event information
- the information analysis unit includes: an information analysis unit that generates and accumulates an index value used to evaluate the driving condition of the device; and an information presentation unit that presents the index value accumulated in the information analysis unit to a user
- the unit is characterized in that the index value is generated for each divided period based on a change in the operating state of the device.
- the driving information analysis device of the present invention the event information generated during the operation of the device is organized and the index value used for the evaluation of the driving condition of the device is generated for each divided period based on the change in the driving condition of the device. Accumulated, and the accumulated index values are presented to the user. As a result, the user can confirm the index value of the device generated and presented in sections whenever the operating state of the device changes. Therefore, according to the driving information analysis device of the present invention, the driving situation of the device can be evaluated more accurately.
- running state is a change of any load of the said apparatus.
- the index value can be more accurately evaluated in response to a change in any load of the device.
- running state is a change of the kind of fuel used for either of the said apparatuses.
- the index value can be more accurately evaluated according to the change of the type of fuel used for any of the devices.
- the event information includes information on an alarm of the device, information on an operation of the device, information on an operating state of the device, and information on an alarm of the driving information analysis device, and the information analysis unit
- the index value is generated and accumulated by classifying by information type, and the information presentation unit presents the index value classified by the type of event information to the user. In this manner, the user can easily evaluate the operating condition of the device by classifying and presenting the index value to the user for each event information related to the device such as an alarm, an operation of the device, and an operating state of the device. .
- the information analysis unit classifies the type of the device and generates the index value
- the information presentation unit presents the index value classified by the type of the device to the user. Is preferred.
- the user can easily evaluate the operating condition of the device by classifying the index value for each device included in the device and presenting it to the user.
- the information presentation unit presents the index value for each period arbitrarily divided by the user.
- the information presentation unit presents the index value for each period arbitrarily divided by the user.
- the information collection unit collects a process amount of the device, and the information analysis unit generates and accumulates data in which the event information is associated with the behavior of the process amount related to the event information.
- the information presentation unit presents the data accumulated in the information analysis unit to the user.
- the information analysis unit when the device is updated or repaired, temporarily stops accumulation of the index value associated with the device that has been updated or repaired, and newly generates an index value. It is preferable to accumulate. This makes it possible to easily compare the effects of what has affected the operating condition of the device by updating or repairing the device, and to easily evaluate the superiority and inferiority before and after the updating or repairing of the device. .
- the information analysis unit temporarily stops accumulation of the data related to the device that has been updated or repaired, and newly generates the data. It is preferable to accumulate. This makes it possible to compare the change in behavior of the related process amount when an event occurs before and after the device is updated or repaired. Therefore, it is possible to analyze the cause of the event more efficiently.
- the driving information analysis device has the effect of being able to evaluate the driving situation of the device more accurately.
- FIG. 1 is a block diagram showing a driving information analysis apparatus according to the first embodiment.
- FIG. 2 is an explanatory view showing an example of event information acquired by the information collection unit.
- FIG. 3 is an explanatory view showing the change of the load of the generator according to the passage of time.
- FIG. 4 is an explanatory view showing an example of a database of index values generated in the information analysis unit.
- FIG. 5 is an explanatory view showing an example of the analysis result presented by the information presentation unit.
- FIG. 6 is an explanatory view showing an example of the analysis result presented by the information presentation unit.
- FIG. 7 is an explanatory view showing an example of the analysis result presented by the information presentation unit.
- FIG. 8 is an explanatory view showing an example of the analysis result presented by the information presentation unit.
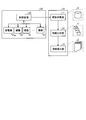
- FIG. 1 is a block diagram showing a driving information analysis apparatus according to the first embodiment.
- FIG. 2 is an explanatory view showing an example of event information acquired by the information collection unit.
- FIG. 3 is an
- FIG. 9 is an explanatory view showing an example of the analysis result presented by the information presentation unit.
- FIG. 10 is an explanatory view showing an example of the analysis result presented by the information presentation unit.
- FIG. 11 is an explanatory view showing an example of the analysis result presented by the information presentation unit.
- FIG. 12 is a block diagram showing a driving information analysis apparatus according to the second embodiment.
- FIG. 13 is an explanatory diagram of an example of correspondence between event information and a process amount related to the event information.
- FIG. 14 is an explanatory drawing showing an example of the analysis result of the event information and the behavior of the related process amount.
- FIG. 15 is a block diagram showing a driving information analysis apparatus according to a third embodiment.
- FIG. 1 is a block diagram showing a driving information analysis apparatus according to the first embodiment.
- the operation information analysis device 10 is a system for analyzing the operation status of the device 20, such as a power plant, and presenting the analyzed result to the user.
- the user is a manufacturer, a seller, or an operator who actually operates the device 20.
- the device 20 includes a plurality of devices 21 including a generator 21 g, and a control device 22 that controls the plurality of devices 21.
- the plurality of devices 21 are devices (for example, a gas turbine, a steam turbine, and the like) for driving the generator 21g, pumps, fans, various valve equipment, and the like.
- the control device 22 controls the process amount P of these devices 21.
- the control device 22 also functions as a storage unit that stores various types of event information generated when the device 20 is operated.
- the driving information analysis device 10 organizes the event information X of the device 20 collected by the information collecting unit 11 that communicates with the control device 22 and collects the event information X of the device 20, and the device 20
- the information analysis unit 12 that generates and accumulates a database Y of a plurality of index values used to evaluate 20 driving situations, and the database Y of a plurality of index values generated by the information analysis unit 12 are presented to the user as analysis results Z And an information presenting unit 13.
- the information collection unit 11 can communicate with the control device 22 via the network, and automatically acquires and stores the event information X of the device 20 from the control device 22 every predetermined period (for example, every hour, every day, etc.) .
- the information collection unit 11 may obtain the event information X of the device 20 stored in the control device 22 manually by the user via a storage medium such as a DVD-ROM, for example.
- the event information X generated during the operation of the device 20 includes information on an alarm generated by each device 21 of the device 20, information on an operation state of each device 21, and information on operation of each device 21 (see FIG. 4).
- the information on the operation of each device 21 includes the information on the driving operation of each device 21 and the information on the adjusting operation of each device 21.
- the event information X also includes information on a system alarm generated by the driving information analysis device 10.
- the information related to the alarm generated by each device 21 includes information such as an alarm related to a failure or abnormality of each device 21 or an alarm generated when the process amount P of each device 21 exceeds a control value in control.
- the case where an alarm is issued is defined as “occurrence”, and the case where an alarm is stopped is defined as “return”.
- the information on the operation state of each device 21 includes information on the start / stop operation of each device 21 and information such as what operation mode the device 21 is operated when having a plurality of operation modes.
- the start / stop operation of each device 21 means that if the device 21 is, for example, a pump, a fan, a motor or the like, an activation instruction or stop instruction is performed, and if the device 21 is a valve facility, the valve is opened. Indicates that a command or a close command has been issued.
- “on” is defined as one of the start / stop operation (an activation instruction or stop instruction, or an open instruction or a close instruction) for each device 21, and “off” is performed when the other is performed. Defined as
- the information on the driving operation of each device 21 includes information on any operation instruction other than the start / stop and the change of the operation mode performed to each device 21.
- the operation operation of each device 21 includes, for example, an operation of changing the control set value regarding the process amount P, such as the flow rate, pressure, and temperature as an operation target, for each device 21.
- the operation of each device 21 is mainly performed by an operator.
- the information on the adjustment operation of each device 21 includes the information on the operation instruction related to the control logic of each device 21.
- the adjustment operation of each device 21 includes, for example, an operation of changing a parameter value on control of each device 21 such as a set value of response speed to an input value or a detected value in control and a set value of gain. Adjustment operations of the respective devices 21 are mainly performed by maintenance personnel.
- the information on the system alarm generated in the driving information analysis device 10 is issued, for example, when the communication between the control device 22 and the information collecting unit 11 is interrupted, or when some abnormality occurs in the driving information analysis device 10, etc. Contains information about the alert.
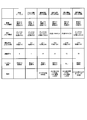
- FIG. 2 is an explanatory view showing an example of the event information X acquired by the information collection unit 11.
- the event information X information on the time when the event occurred, type code set in advance of the device 21 in which the event occurred, a message as specific content of the event, information on other events (for example, Information etc. regarding the plant hierarchy to which the corresponding device 21 belongs is included.
- produced in the apparatus 21 is shown as an example of a message.
- the information analysis unit 12 acquires the event information X from the information collection unit 11, and generates and accumulates a database Y of a plurality of index values for each period divided based on the operation state of the device 20.
- the change in the operating state of the device 20 refers to the change in the operating load of the generator 21g, and the device 21 for driving the generator 21g (for example, a gas turbine, a steam turbine, etc.) Change in the type of fuel being
- the change in the operating load of the generator 21g changes for each state of the generator 21g, such as the starting process of the generator 21g, the rated operation process, the partial load operating process, the minimum load operating process, the stop process, and the stop.
- the start-up process is, for example, a process in which the generator 21g is operated at an output of 35% or less of the rated load and until a predetermined time elapses without output fluctuation.
- the rated operation process is, for example, a process in which the generator 21g is operated at an output of 90% or more of the rated load.
- the partial load operation process is, for example, a process in which the generator 21g is operated at an output of 40% or more and less than 90% of the rated load.
- the minimum load operation process is, for example, a process in which the generator 21g is operated at an output of less than 40% of the rated load.
- the stopping process is a process until the operation of the generator 21g is stopped while the generator 21g is operated at an output of 5% or more and less than 35% of the rated load. During the stop, the operation of the generator 21g is stopped.
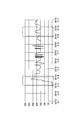
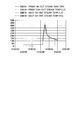
- FIG. 3 is an explanatory view showing a change of the load of the generator 21g according to the passage of time.
- the horizontal axis in FIG. 3 is the date, and the vertical axis is the load of the generator 21g.
- the range encircled by a broken line in FIG. 3 is the period of the start-up process of the generator 21g, and the range encircled by a two-dot chain line is the normal operation process of the generator 21g (rated operation process, partial load operation process and minimum load operation Period of the process).
- the load of the generator 21g is different in each process, and the change in the operating load of the generator 21g or the type of fuel used in the device 21 for driving the generator 21g
- the tendency of various events occurring in the device 20 is also likely to change. Therefore, by dividing the period in which the database Y of the index value is generated according to the change in the operation load of the generator 21g and the change in the type of fuel used, the evaluation of the operating condition of the device 20 is made more based on the index value. It can be done correctly.
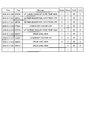
- FIG. 4 is an explanatory view showing an example of a database Y of index values generated in the information analysis unit 12.
- the index value database Y is generated by classifying the event information X according to the type.
- the type of event information X is information on an alarm generated by each device 21 of the apparatus 20, information on an operation state of each device 21, information on a driving operation of each device 21, adjustment operation of each device 21 Information related to the system alarm generated by the driving information analysis apparatus 10.
- the classification according to the type of event information X is not limited to this.
- the information analysis unit 12 generates a database Y of index values by classifying the types of the devices 21.
- a database Y of index values classified according to the type of each device 21 is generated with respect to information on the operating state of each device 21.
- the information analysis unit 12 classifies, for example, the pump, the fan, the valve equipment, and the like included in the device 20, and generates a database Y of index values for information on the operating state of the device 21.
- the information analysis unit 12 may also generate a database Y of index values by classifying the information related to the alarm, the information related to the driving operation, and the information related to the adjusting operation according to the type of each device 21.
- the information analysis unit 12 uses the alarm occurrence frequency (total number of occurrences), the order of occurrence and return of alarms according to time series, the generation interval of each alarm, the generation time length of each alarm, etc. Create a database Y of. Further, the information analysis unit 12 generates a database Y in which the top 30 types of cases are extracted in descending order of the occurrence frequency of the occurrence frequency (total occurrence number) of the alarm.
- the information analysis unit 12 uses the frequency of start / stop of each device 21 (total number of start / stop operations), the order of start / stop of each device 21 according to time series, and the start / stop of each device 21 A database Y such as an interval, a time length for each operation state (on state, off state, or operation state in each operation mode) of each device 21 is generated. In addition, the information analysis unit 12 generates a database Y in which the numbers of the top 30 types of cases are extracted in descending order of the start / stop frequency with respect to the start / stop frequency of each device 21 (total number of start / stop operations).
- the information analysis unit 12 relates to a driving operation frequency (total number of driving operation instructions) to the device 21, an order of the driving operation to the device 21 according to time series, and a process amount P of the device 21 as index values regarding the driving operation of the device 21.
- a database Y is generated such as the number of setting value changes on control, the setting value changing order according to time series, and the transition of driving operation frequency.
- the information analysis unit 12 generates a database Y in which the number of top 30 types of cases is extracted in descending order of driving operation frequency with respect to the driving operation frequency (total number of operation instructions).
- the information analysis unit 12 sets the adjustment operation frequency (total number of operation instructions) for the device 21, the order of the adjustment operation for the device 21 according to the time series, and the parameter change in control of the device 21 as an index value regarding the adjustment operation of the device 21.
- a database Y such as the number of times and parameter change order according to time series is generated.
- the information analysis unit 12 uses the alarm generation frequency (total number of generations), the order of alarm generation and recovery according to time series, the generation interval of each alarm, and the like as index values related to the system alarm generated in the driving information analysis device 10
- a database Y such as an alarm generation time length is generated.
- the information presentation unit 13 converts the database Y of index values acquired from the information analysis unit 12 into data usable by a spreadsheet application or the like of an externally connected personal computer (not shown), and the converted data is the operating condition of the apparatus 20 It transmits to the said personal computer as analysis result Z of.
- the user can view the analysis result Z via the personal computer.
- the driving information analysis device 10 may have a monitor for displaying the analysis result Z, and the information presentation unit 13 may cause the monitor to display the analysis result Z.
- the information presentation unit 13 generates a database Y of index values according to the type of event information X arbitrarily selected by the user and the type of the device 21 for each period arbitrarily divided by the user. Presented as analysis result Z. Further, in the present embodiment, the information presentation unit 13 presents, as the analysis result Z, a database Y of index values in response to a request from the user.
- the analysis result Z presented by the information presentation unit 13 will be described.
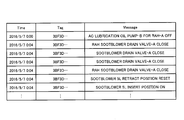
- the example of the analysis result Z of FIG. 5 shows the start / stop order according to the time series according to the type of the device 21 arbitrarily selected by the user.
- the "Time” column shows the date and time when the device 21 was started / stopped
- the "Tag” column shows the type code of the device 21,
- the "Messege” column The names of the respective devices 21 and the specific contents of the start / stop operation (instruction instruction or stop instruction, opening instruction or closing instruction of valve equipment) are shown.
- the user can easily grasp at what timing and in what order each device 21 started and stopped according to the type of the device 21 and in chronological order.
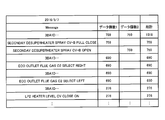
- the example of the analysis result Z of FIG. 6 shows the top 30 types of start / stop frequencies of the device 21 in a period optionally divided by the user.
- the user can select, for example, hourly, daily, weekly, monthly, half a year, one year, etc., as the time period arbitrarily divided.
- the period is targeted for May 7, 2016.
- the column "Messege” displays the type code of the device 21, the name of the device 21, and the specific content of the start / stop operation.
- the column of "number of data 1" displays the number of times the start / stop operation corresponding to "on" defined for each device 21 has been performed, and the column of "number of data 2" is defined for each device 21.
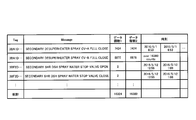
- the example of the analysis result Z of FIG. 7 shows the start / stop frequency for each of the devices 21 arbitrarily selected by the user during a period optionally divided by the user (for example, one month in May 2016).
- the column "Tag” displays the type code of the specific device 21
- the column "Message” displays the name of the device 21 and the contents of the start / stop information, "number of data 1".
- the column shows the number of times the starting / stopping operation corresponding to "on” defined for each device 21 has been performed, and the column “number of data 2" is "off” defined for each device 21.
- the number of times the corresponding start / stop operation has been performed is displayed, and the "time” column indicates the time when the start / stop of the device 21 has been performed.
- the period used by the user is arbitrary
- the user can easily grasp at what timing the start / stop has been performed while grasping the entire start / stop frequency of the device 21 arbitrarily selected by the person.
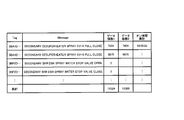
- the columns “Tag”, “Message”, “number of data 1”, and “number of data 2” are the same as the respective columns in FIG. 7.
- the column “total on time” displays the total time during which the on / off operation corresponding to “on” defined for each device 21 has been performed.
- 6 to 8 show an example of the analysis result Z relating to the start / stop frequency of the device 21 in a period arbitrarily divided by the user, but the period is divided according to the change in the operating state of the device 20. It may be one.
- the example of the analysis result Z of FIG. 9 shows the occurrence frequency according to the type of the event information X for each divided period based on the change of the operating state of the apparatus 20 and each user arbitrarily divided.
- the period consists of starting process (from May 1 to May 3), stopping process and starting process (May 17 and May 18) of the generator 21g, and normal operation process (from May to August) Separated by month).
- the types of event information X are the total occurrence of the top 30 alarms of the device 21, the total occurrence of the top 30 types of start / stop operation of the device 21, the total number of driving operations of the top 30 types of the device 21, the total number of adjustment operations of the device 21 The total number of system alarms generated by the driving information analysis device 10.
- the total number of occurrences of the top 30 types of alarms, the total number of occurrences of the top 30 types of recovery, and the total number of occurrences including alarms other than the top 30 types are displayed.
- the start / stop operation of the device 21 the total number of occurrences of start / stop operations corresponding to the top 30 types of "on”, the total number of occurrence of start / stop operations corresponding to the top 30 types of "off”, and the start non-top 30 types The total number of occurrences including stop operation is displayed.
- the driving operation of the device 21 the total number of the top 30 types of driving operations and the total number of occurrences including the driving operations other than the top 30 types are displayed.
- the total number of alarm occurrences and the total number of restoration occurrences are displayed.
- a part of the breakdown etc. is shown for items (items marked with * in the figure) in which the total number of occurrences was particularly large.
- the presentation of information by the information presentation unit 13 is not limited to the one shown in the table as described above.
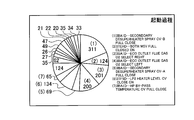
- the example of the analysis result Z of FIG. 10 shows the start / stop frequency of the device 21 arbitrarily selected by the user in the period of the start process of the generator 21g (period surrounded by the broken line in FIG. 3) by a circle graph. It is.
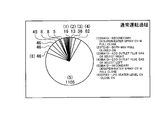
- the frequency of start / stop of the device 21 arbitrarily selected by the user during the period of the normal operation process of the generator 21g (period surrounded by a two-dot chain line in FIG. 3) It is shown.
- the information analysis unit 12 generates the database Y of index values for each divided period based on the change in the driving state of the apparatus 20 or It classifies and generates according to the event type, or classifies and generates according to the type of the device 21.
- the information presentation unit 13 can present the database Y of the index value as the analysis result Z in an easy-to-understand manner to the user in various modes.
- the user can evaluate the operating condition and abnormality indication of the device 20, and can efficiently find unnecessary driving operations, adjustment defects and the like in a short time. It is possible to make it easier to make improvement proposals to 20 operators.
- the driving information analysis device 10 the event information X generated during the driving of the device 20 is organized for each period divided based on the change in the driving state of the device 20, and the driving condition of the device 20
- the index value used for evaluation of is generated and accumulated, and the accumulated index value is presented to the user.
- the user can confirm the index value of the device 20 generated and presented in sections whenever the operating state of the device 20 changes. Therefore, according to the driving information analysis device 10, the driving situation of the device 20 can be evaluated more accurately.
- the change in the operating state is a change in the load of the generator 21g.
- an index value can be evaluated more correctly.
- the change in the operating state may be a change in the load of any one of the devices 21 other than the generator 21g.
- the change in the operating state is a change in the type of fuel used in the device 21 (for example, a gas turbine, a steam turbine, etc.) for driving the generator 21g.
- the index value can be more accurately evaluated according to the change in the type of fuel used for the device 21 for driving the generator 21g.
- the change in the operating state may be a change in the type of fuel used in the device 21 other than the device 21 for driving the generator 21g.
- the event information X includes information on the alarm of the device 20, information on the operation of the device 21, information on the operation state of the device 21, and information on the system alarm generated in the operation information analysis device 10, and the information analysis unit 12
- the information presentation unit 13 presents the user with the index values classified according to the type of the event information X. In this manner, the user can easily operate the device 20 by classifying the index value for each event information X related to the device 20 such as an alarm, the operation of the device 21 and the operation state of the device 21 and presenting the result to the user. It can be evaluated.
- the information analysis unit 12 classifies the type of the device 21 to generate an index value
- the information presentation unit 13 presents the user with the index value classified according to the type of the device 21.
- the user can easily evaluate the operating condition of the device 110 by classifying the index value for each of the devices 21 included in the device 20 and presenting the index value to the user.
- the information presentation unit 13 presents an index value for each period arbitrarily divided by the user. As a result, only the index value in the period that the user wants to confirm can be presented, so that the user can easily evaluate the driving situation of the device 20.
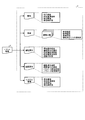
- FIG. 12 is a block diagram showing the driving information analysis apparatus 10B.
- the driving information analysis device 10B replaces the information collecting unit 11B of the driving information analysis device 10 of the first embodiment with the information analyzing unit 12B replacing the information collecting unit 11B with the information analyzing unit 12 of the driving information analysis device 10.
- the information presentation unit 13 instead of the information presentation unit 13.
- the functions of the information collection unit 11B, the information analysis unit 12B, and the information presentation unit 13B are the same as those of the information collection unit 11, the information analysis unit 12, and the information presentation unit 13 of the first embodiment, except for those described below. Since the same, the description of the overlapping functions is omitted.
- the information collecting unit 11B has a function of acquiring the process amount P of each device 21 from the control device 22 of the apparatus 20 and transmitting the process amount P to the information analyzing unit 12B.
- the other functions of the information collection unit 11B are the same as those of the information collection unit 11 of the first embodiment, and thus the description thereof is omitted.
- the information analysis unit 12B In addition to the function of the information analysis unit 12 of the first embodiment, the information analysis unit 12B generates a database Y2 that associates the event information X with the behavior of the process amount P related to the event information X. It has a function to accumulate.
- the other functions of the information analysis unit 12B are the same as those of the information analysis unit 12 of the first embodiment, and thus the description thereof is omitted.
- FIG. 13 is an explanatory drawing showing an example of the correspondence between event information X and the process amount P related to the event information X.
- the type code of the device 21, the name, and the specific contents of the start / stop operation are displayed in the “event information X” column, and the emission of the device 21 is displayed in the “related process amount P” column.
- the specific content of the process amount P (hereinafter referred to as “related process amount P”) related to the stopping operation is displayed.
- the event information X is not limited to the information on the start / stop operation of the device 21, but also the information on the alarm generated in each device 21 of the device 20, the information on the operation state other than the start / stop operation of each device 21 (in any operation mode It may be information on whether or not the vehicle is operated, information on the operation of each device 21, and information on the adjustment operation of each device 21.
- the user sets in advance the correspondence between the event information X and the related process amount P, an example of which is shown in FIG. 13, and stores the correspondence in the information analysis unit 12B.
- the correspondence relationship may not be set in advance, and may be generated as needed in the information analysis unit 12B.
- the information analysis unit 12B may set a related process amount P as one whose behavior has changed in a predetermined period before and after the event occurrence time.
- the information analysis unit 12B generates the database Y2 in which the values of the related process amounts P are arranged in time series in a predetermined period before and after the occurrence time of the event information X acquired from the information collection unit 11B according to the correspondence shown in FIG. To accumulate.
- the information presentation unit 13B presents the user as the analysis result Z2 a database Y2 in which the event information X accumulated by the information analysis unit 20B corresponds to the behavior of the related process amount P. .
- the other functions of the information presentation unit 13B are the same as those of the information presentation unit 13 of the first embodiment, and thus the description thereof is omitted.
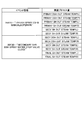
- FIG. 14 is an explanatory drawing showing an example of the analysis result Z2 of the event information X and the behavior of the related process amount P.
- the example shown in FIG. 14 is a line graph showing the behavior of the related process amount P in a predetermined period before and after the timing at which a predetermined event occurs in the device 20.
- the horizontal axis is time
- the vertical axis is the value of the related process amount P.
- the analysis result Z2 is not limited to a line graph, and may be a table in which the values of the process amount P are arranged in time series, or a graph of another format.
- FIG. 15 is a block diagram showing the driving information analysis apparatus 10C.
- the driving information analysis device 10C includes an information analysis unit 12C in place of the information analysis unit 12B of the driving information analysis device 10B of the second embodiment.
- the other configuration of the driving information analysis device 10C is the same as that of the driving information analysis device 10B, and thus the description thereof is omitted.
- the function of the information analysis unit 12C is the same as that of the information analysis unit 12B of the second embodiment except for those described below, and therefore the description of the overlapping functions is omitted.
- the information analysis unit 12C When updating or repairing (overhauling) of the device 21 is performed, the information analysis unit 12C temporarily stops accumulation of the database Y of index values associated with the device 21 for which the updating or repairing has been performed, and newly adds an indicator. Create and store a database Y of values. In addition, when the device 21 is updated or repaired, the information analysis unit 12C associates the event information X and the behavior of the related process amount P related to the device 21 for which the update or repair has been performed. The accumulation of the database Y2 is temporarily stopped, and the database Y2 is newly generated and accumulated.
- database Y of index values associated with updated or repaired device 21 and event information X associated with updated or repaired device 21 are associated with the behavior of associated process amount P.
- the user sets in advance the stored database Y2 and stores it in the information analysis unit 12C.
- the database Y of index values associated with the updated or repaired device 21 and the database Y2 associated with the updated or repaired device 21 are not preset and the information analysis unit It may be generated at any time in 12C.
- the information analysis unit 12C associates the event value X with the behavior of the related process amount P with the database Y of index values whose values suddenly change before and after the device 21 is updated or repaired.
- the database Y2 may be the database Y and the database Y2 associated with the device 21 in which the update or repair has been performed.
- the database Y2 of the event information X and the behavior of the related process amount P are analyzed by using the database Y of the index value as the analysis result Z in various modes. It can be presented to the user in an easy-to-understand manner as the result Z2. As a result, the user can evaluate the operating condition and abnormality indication of the device 20, and can efficiently find unnecessary driving operations, adjustment defects and the like in a short time. It is possible to make it easier to make improvement proposals to 20 operators.
- the change of the index value can be compared. Therefore, it is possible to easily compare the effects of what has affected the operating condition of the apparatus 20 by updating or repairing the device 21, and to easily evaluate superiority and inferiority before and after the updating or repair of the device 21. It becomes.
- the device 21 before and after the device 21 is updated or repaired, it is possible to compare the change in behavior of the related process amount P when an event occurs. Therefore, it is possible to analyze the cause of the event more efficiently.
- the occurrence frequency of an event is compared and shown by a pie chart as shown in FIG. 10, for example, before and after updating or repair of the device 21, devices before and after the updating or repair of the device 21 are performed. It is possible to present the change of the 20 driving situations more easily to the user.
- the information analysis unit 12C temporarily stops only accumulation of the database Y of index values associated with the device 21 for which the update or repair has been performed, Only the database Y of index values may be newly generated and accumulated.
- the information collection unit 11B may not have the function of collecting the process amount P of the apparatus 20, and the information analysis unit 12C may be a database Y2 in which the event information X is associated with the behavior of the related process amount P. It does not have to generate and store.
- the information analysis unit 12C performs the event information X and the behavior of the related process amount P related to the device 21 on which the update or repair is performed. Only the accumulation of the corresponding database Y2 may be temporarily stopped, and only the database Y2 may be newly generated and accumulated.
Abstract
La présente invention comprend : une unité de collecte (11) d'informations qui collecte des informations d'événements générées pendant le pilotage d'un dispositif (20) qui inclut une pluralité d'instruments (21) ; une unité d'analyse (12) d'informations qui organise les informations d'événements collectées pour générer et accumuler des valeurs d'indicateurs servant à évaluer la situation de pilotage du dispositif (20) ; et une unité de présentation (13) d'informations qui présente, à un utilisateur, les valeurs d'indicateurs accumulées par l'unité d'analyse (12) d'informations. L'unité d'analyse (12) d'informations génère les valeurs d'indicateurs pour chaque période délimitée sur la base de changements de l'état de pilotage du dispositif.
Priority Applications (6)
| Application Number | Priority Date | Filing Date | Title |
|---|---|---|---|
| US16/306,193 US10775779B2 (en) | 2016-07-27 | 2016-12-16 | Operation information analyzer |
| ES16910606T ES2857502T3 (es) | 2016-07-27 | 2016-12-16 | Dispositivo de análisis de información de conducción |
| KR1020187034674A KR102008642B1 (ko) | 2016-07-27 | 2016-12-16 | 운전 정보 분석 장치 |
| CN201680086160.XA CN109313437B (zh) | 2016-07-27 | 2016-12-16 | 运转信息分析装置 |
| EP16910606.9A EP3451098B1 (fr) | 2016-07-27 | 2016-12-16 | Dispositif d'analyse d'informations de pilotage |
| PH12018502503A PH12018502503B1 (en) | 2016-07-27 | 2018-11-27 | Operation information analyzer |
Applications Claiming Priority (2)
| Application Number | Priority Date | Filing Date | Title |
|---|---|---|---|
| JP2016-146926 | 2016-07-27 | ||
| JP2016146926A JP6382892B2 (ja) | 2016-07-27 | 2016-07-27 | 運転情報分析装置 |
Publications (1)
| Publication Number | Publication Date |
|---|---|
| WO2018020703A1 true WO2018020703A1 (fr) | 2018-02-01 |
Family
ID=61015945
Family Applications (1)
| Application Number | Title | Priority Date | Filing Date |
|---|---|---|---|
| PCT/JP2016/087503 WO2018020703A1 (fr) | 2016-07-27 | 2016-12-16 | Dispositif d'analyse d'informations de pilotage |
Country Status (9)
| Country | Link |
|---|---|
| US (1) | US10775779B2 (fr) |
| EP (1) | EP3451098B1 (fr) |
| JP (1) | JP6382892B2 (fr) |
| KR (1) | KR102008642B1 (fr) |
| CN (1) | CN109313437B (fr) |
| ES (1) | ES2857502T3 (fr) |
| PH (1) | PH12018502503B1 (fr) |
| TW (1) | TWI653530B (fr) |
| WO (1) | WO2018020703A1 (fr) |
Families Citing this family (5)
| Publication number | Priority date | Publication date | Assignee | Title |
|---|---|---|---|---|
| DE102018111892B4 (de) * | 2017-05-22 | 2023-06-29 | Okuma Corporation | Betriebsüberwachungsvorrichtung und Steuerprogramm dafür |
| JP7011486B2 (ja) * | 2018-02-16 | 2022-01-26 | 三菱重工パワー環境ソリューション株式会社 | プラント機器監視制御システム及びプラント機器監視制御方法 |
| JP7074542B2 (ja) | 2018-04-06 | 2022-05-24 | ファナック株式会社 | ネットワークを利用した診断サービスシステム及び診断方法 |
| JP7248100B2 (ja) * | 2019-03-19 | 2023-03-29 | 日本電気株式会社 | 監視方法、監視装置、プログラム |
| JP2021174352A (ja) * | 2020-04-28 | 2021-11-01 | 株式会社日立製作所 | プラント制御支援装置、プログラムおよびプラント制御支援方法 |
Citations (5)
| Publication number | Priority date | Publication date | Assignee | Title |
|---|---|---|---|---|
| JPH0836682A (ja) * | 1994-07-25 | 1996-02-06 | Hitachi Ltd | プラント監視装置および監視方法 |
| JPH10124221A (ja) * | 1996-10-24 | 1998-05-15 | Toshiba Corp | プラント監視装置 |
| JPH11161318A (ja) * | 1997-11-27 | 1999-06-18 | Sanyo Electric Co Ltd | 機器の運転状態管理装置 |
| JP2011243118A (ja) * | 2010-05-20 | 2011-12-01 | Hitachi Ltd | 監視診断装置および監視診断方法 |
| JP2012008782A (ja) * | 2010-06-24 | 2012-01-12 | Mitsubishi Heavy Ind Ltd | プラントの機能を診断する方法、及びプラント監視装置 |
Family Cites Families (18)
| Publication number | Priority date | Publication date | Assignee | Title |
|---|---|---|---|---|
| JPH05135185A (ja) * | 1991-01-23 | 1993-06-01 | Toshiba Corp | プラントデータ表示装置 |
| US7092914B1 (en) * | 1997-11-06 | 2006-08-15 | Intertrust Technologies Corporation | Methods for matching, selecting, narrowcasting, and/or classifying based on rights management and/or other information |
| JP2001045641A (ja) | 1999-07-29 | 2001-02-16 | Toyota Motor Corp | ワイヤーハーネスの配線構造 |
| CN1304911C (zh) | 2001-01-22 | 2007-03-14 | 东京毅力科创株式会社 | 提高机器生产率的系统及其方法 |
| JP2003271238A (ja) | 2002-03-18 | 2003-09-26 | Toshiba Corp | リモートメンテナンス方法及びシステム |
| JP2003271233A (ja) * | 2002-03-19 | 2003-09-26 | Hitachi Ltd | 電源設備及びその管理方法 |
| US20040073468A1 (en) | 2002-10-10 | 2004-04-15 | Caterpillar Inc. | System and method of managing a fleet of machines |
| US7110918B2 (en) | 2003-11-05 | 2006-09-19 | Shoplogix Inc. | Self-contained system and method for remotely monitoring machines |
| JP2010049532A (ja) * | 2008-08-22 | 2010-03-04 | Toshiba Corp | 運転監視支援装置 |
| JP5204075B2 (ja) | 2009-10-08 | 2013-06-05 | 横河電機株式会社 | 運転状況分析方法および運転状況分析システム |
| US10089582B2 (en) * | 2013-01-02 | 2018-10-02 | Qualcomm Incorporated | Using normalized confidence values for classifying mobile device behaviors |
| US9158604B1 (en) * | 2014-05-13 | 2015-10-13 | Qualcomm Incorporated | Lightweight data-flow tracker for realtime behavioral analysis using control flow |
| US20160078362A1 (en) * | 2014-09-15 | 2016-03-17 | Qualcomm Incorporated | Methods and Systems of Dynamically Determining Feature Sets for the Efficient Classification of Mobile Device Behaviors |
| US9703962B2 (en) * | 2014-10-09 | 2017-07-11 | Qualcomm Incorporated | Methods and systems for behavioral analysis of mobile device behaviors based on user persona information |
| US9519533B2 (en) * | 2015-01-28 | 2016-12-13 | Qualcomm Incorporated | Data flow tracking via memory monitoring |
| US10104107B2 (en) * | 2015-05-11 | 2018-10-16 | Qualcomm Incorporated | Methods and systems for behavior-specific actuation for real-time whitelisting |
| US20170046510A1 (en) * | 2015-08-14 | 2017-02-16 | Qualcomm Incorporated | Methods and Systems of Building Classifier Models in Computing Devices |
| DE102018111892B4 (de) * | 2017-05-22 | 2023-06-29 | Okuma Corporation | Betriebsüberwachungsvorrichtung und Steuerprogramm dafür |
-
2016
- 2016-07-27 JP JP2016146926A patent/JP6382892B2/ja active Active
- 2016-12-16 ES ES16910606T patent/ES2857502T3/es active Active
- 2016-12-16 US US16/306,193 patent/US10775779B2/en active Active
- 2016-12-16 EP EP16910606.9A patent/EP3451098B1/fr active Active
- 2016-12-16 KR KR1020187034674A patent/KR102008642B1/ko active IP Right Grant
- 2016-12-16 CN CN201680086160.XA patent/CN109313437B/zh active Active
- 2016-12-16 WO PCT/JP2016/087503 patent/WO2018020703A1/fr unknown
-
2017
- 2017-01-25 TW TW106102990A patent/TWI653530B/zh active
-
2018
- 2018-11-27 PH PH12018502503A patent/PH12018502503B1/en unknown
Patent Citations (5)
| Publication number | Priority date | Publication date | Assignee | Title |
|---|---|---|---|---|
| JPH0836682A (ja) * | 1994-07-25 | 1996-02-06 | Hitachi Ltd | プラント監視装置および監視方法 |
| JPH10124221A (ja) * | 1996-10-24 | 1998-05-15 | Toshiba Corp | プラント監視装置 |
| JPH11161318A (ja) * | 1997-11-27 | 1999-06-18 | Sanyo Electric Co Ltd | 機器の運転状態管理装置 |
| JP2011243118A (ja) * | 2010-05-20 | 2011-12-01 | Hitachi Ltd | 監視診断装置および監視診断方法 |
| JP2012008782A (ja) * | 2010-06-24 | 2012-01-12 | Mitsubishi Heavy Ind Ltd | プラントの機能を診断する方法、及びプラント監視装置 |
Also Published As
| Publication number | Publication date |
|---|---|
| EP3451098A4 (fr) | 2019-06-26 |
| PH12018502503A1 (en) | 2019-07-15 |
| JP6382892B2 (ja) | 2018-08-29 |
| EP3451098A1 (fr) | 2019-03-06 |
| CN109313437A (zh) | 2019-02-05 |
| TW201804326A (zh) | 2018-02-01 |
| EP3451098B1 (fr) | 2021-03-03 |
| PH12018502503B1 (en) | 2019-07-15 |
| KR102008642B1 (ko) | 2019-08-07 |
| KR20180133928A (ko) | 2018-12-17 |
| JP2018018233A (ja) | 2018-02-01 |
| US10775779B2 (en) | 2020-09-15 |
| US20190339680A1 (en) | 2019-11-07 |
| CN109313437B (zh) | 2020-01-31 |
| TWI653530B (zh) | 2019-03-11 |
| ES2857502T3 (es) | 2021-09-29 |
Similar Documents
| Publication | Publication Date | Title |
|---|---|---|
| WO2018020703A1 (fr) | Dispositif d'analyse d'informations de pilotage | |
| CN104254810B (zh) | 用于一组工厂的条件监视的方法和系统 | |
| US7966150B2 (en) | Data analysis applications | |
| WO2015159577A1 (fr) | Dispositif de surveillance d'état | |
| WO2012098727A1 (fr) | Dispositif d'aide à la conception de sécurité d'une centrale et dispositif d'aide à la surveillance et l'entretien d'une centrale | |
| US20170261403A1 (en) | Abnormality detection procedure development apparatus and abnormality detection procedure development method | |
| EP1000426A1 (fr) | Systeme dynamique de gestion de l'entretien | |
| JP2018120456A (ja) | アラーム表示システムおよびアラーム表示方法 | |
| US10572493B2 (en) | Computerized process safety management system | |
| EP4064144A1 (fr) | Procédés permettant d'identifier des indicateurs clés de performance | |
| Toirov et al. | Algorithm and Software Implementation of the Diagnostic System for the Technical Condition of Powerful Units | |
| WO2017216830A1 (fr) | Système d'analyse de données | |
| JP2004118693A (ja) | プラントの制御系異常診断システム及び異常診断方法 | |
| JP4607702B2 (ja) | プラント運転支援装置およびプラント運転支援方法 | |
| EP3819729B1 (fr) | Génération d'interface homme-machine pour surveillance industrielle | |
| JP2010044780A (ja) | 運転状況分析方法および運転状況分析システム | |
| JP2004317273A (ja) | 原子力設備保安規定情報提供装置 | |
| JP7309548B2 (ja) | 異常予兆検知装置、方法及びプログラム | |
| Vicente et al. | More about operator monitoring under normal operations: The role of workload regulation and the impact of control room technology | |
| Abd Rahman Sabri et al. | TB11: PETRONAS Rotating Equipment Analytics (PROTEAN): Disrupting and Challenging the Status Quo of Digital Remote Monitoring Solutions | |
| JPH05216935A (ja) | ドキュメント検索システム | |
| JP2023113019A (ja) | 情報処理装置 | |
| JP2006099298A (ja) | 機器故障診断方法 |
Legal Events
| Date | Code | Title | Description |
|---|---|---|---|
| 121 | Ep: the epo has been informed by wipo that ep was designated in this application |
Ref document number: 16910606 Country of ref document: EP Kind code of ref document: A1 |
|
| ENP | Entry into the national phase |
Ref document number: 20187034674 Country of ref document: KR Kind code of ref document: A |
|
| ENP | Entry into the national phase |
Ref document number: 2016910606 Country of ref document: EP Effective date: 20181130 |
|
| NENP | Non-entry into the national phase |
Ref country code: DE |