WO2018020703A1 - Driving information analysis device - Google Patents
Driving information analysis device Download PDFInfo
- Publication number
- WO2018020703A1 WO2018020703A1 PCT/JP2016/087503 JP2016087503W WO2018020703A1 WO 2018020703 A1 WO2018020703 A1 WO 2018020703A1 JP 2016087503 W JP2016087503 W JP 2016087503W WO 2018020703 A1 WO2018020703 A1 WO 2018020703A1
- Authority
- WO
- WIPO (PCT)
- Prior art keywords
- information
- information analysis
- driving
- unit
- index value
- Prior art date
Links
Images


Classifications
-
- G—PHYSICS
- G05—CONTROLLING; REGULATING
- G05B—CONTROL OR REGULATING SYSTEMS IN GENERAL; FUNCTIONAL ELEMENTS OF SUCH SYSTEMS; MONITORING OR TESTING ARRANGEMENTS FOR SUCH SYSTEMS OR ELEMENTS
- G05B23/00—Testing or monitoring of control systems or parts thereof
- G05B23/02—Electric testing or monitoring
- G05B23/0205—Electric testing or monitoring by means of a monitoring system capable of detecting and responding to faults
- G05B23/0259—Electric testing or monitoring by means of a monitoring system capable of detecting and responding to faults characterized by the response to fault detection
- G05B23/0267—Fault communication, e.g. human machine interface [HMI]
- G05B23/0272—Presentation of monitored results, e.g. selection of status reports to be displayed; Filtering information to the user
-
- G—PHYSICS
- G05—CONTROLLING; REGULATING
- G05B—CONTROL OR REGULATING SYSTEMS IN GENERAL; FUNCTIONAL ELEMENTS OF SUCH SYSTEMS; MONITORING OR TESTING ARRANGEMENTS FOR SUCH SYSTEMS OR ELEMENTS
- G05B23/00—Testing or monitoring of control systems or parts thereof
- G05B23/02—Electric testing or monitoring
- G05B23/0205—Electric testing or monitoring by means of a monitoring system capable of detecting and responding to faults
- G05B23/0218—Electric testing or monitoring by means of a monitoring system capable of detecting and responding to faults characterised by the fault detection method dealing with either existing or incipient faults
- G05B23/0221—Preprocessing measurements, e.g. data collection rate adjustment; Standardization of measurements; Time series or signal analysis, e.g. frequency analysis or wavelets; Trustworthiness of measurements; Indexes therefor; Measurements using easily measured parameters to estimate parameters difficult to measure; Virtual sensor creation; De-noising; Sensor fusion; Unconventional preprocessing inherently present in specific fault detection methods like PCA-based methods
-
- G—PHYSICS
- G05—CONTROLLING; REGULATING
- G05B—CONTROL OR REGULATING SYSTEMS IN GENERAL; FUNCTIONAL ELEMENTS OF SUCH SYSTEMS; MONITORING OR TESTING ARRANGEMENTS FOR SUCH SYSTEMS OR ELEMENTS
- G05B23/00—Testing or monitoring of control systems or parts thereof
- G05B23/02—Electric testing or monitoring
- G05B23/0205—Electric testing or monitoring by means of a monitoring system capable of detecting and responding to faults
- G05B23/0208—Electric testing or monitoring by means of a monitoring system capable of detecting and responding to faults characterized by the configuration of the monitoring system
- G05B23/0216—Human interface functionality, e.g. monitoring system providing help to the user in the selection of tests or in its configuration
-
- G—PHYSICS
- G05—CONTROLLING; REGULATING
- G05B—CONTROL OR REGULATING SYSTEMS IN GENERAL; FUNCTIONAL ELEMENTS OF SUCH SYSTEMS; MONITORING OR TESTING ARRANGEMENTS FOR SUCH SYSTEMS OR ELEMENTS
- G05B19/00—Programme-control systems
- G05B19/02—Programme-control systems electric
- G05B19/418—Total factory control, i.e. centrally controlling a plurality of machines, e.g. direct or distributed numerical control [DNC], flexible manufacturing systems [FMS], integrated manufacturing systems [IMS], computer integrated manufacturing [CIM]
- G05B19/41885—Total factory control, i.e. centrally controlling a plurality of machines, e.g. direct or distributed numerical control [DNC], flexible manufacturing systems [FMS], integrated manufacturing systems [IMS], computer integrated manufacturing [CIM] characterised by modeling, simulation of the manufacturing system
-
- G—PHYSICS
- G05—CONTROLLING; REGULATING
- G05B—CONTROL OR REGULATING SYSTEMS IN GENERAL; FUNCTIONAL ELEMENTS OF SUCH SYSTEMS; MONITORING OR TESTING ARRANGEMENTS FOR SUCH SYSTEMS OR ELEMENTS
- G05B23/00—Testing or monitoring of control systems or parts thereof
- G05B23/02—Electric testing or monitoring
- G05B23/0205—Electric testing or monitoring by means of a monitoring system capable of detecting and responding to faults
- G05B23/0218—Electric testing or monitoring by means of a monitoring system capable of detecting and responding to faults characterised by the fault detection method dealing with either existing or incipient faults
- G05B23/0224—Process history based detection method, e.g. whereby history implies the availability of large amounts of data
- G05B23/0227—Qualitative history assessment, whereby the type of data acted upon, e.g. waveforms, images or patterns, is not relevant, e.g. rule based assessment; if-then decisions
- G05B23/0235—Qualitative history assessment, whereby the type of data acted upon, e.g. waveforms, images or patterns, is not relevant, e.g. rule based assessment; if-then decisions based on a comparison with predetermined threshold or range, e.g. "classical methods", carried out during normal operation; threshold adaptation or choice; when or how to compare with the threshold
-
- G—PHYSICS
- G05—CONTROLLING; REGULATING
- G05B—CONTROL OR REGULATING SYSTEMS IN GENERAL; FUNCTIONAL ELEMENTS OF SUCH SYSTEMS; MONITORING OR TESTING ARRANGEMENTS FOR SUCH SYSTEMS OR ELEMENTS
- G05B23/00—Testing or monitoring of control systems or parts thereof
- G05B23/02—Electric testing or monitoring
- G05B23/0205—Electric testing or monitoring by means of a monitoring system capable of detecting and responding to faults
- G05B23/0259—Electric testing or monitoring by means of a monitoring system capable of detecting and responding to faults characterized by the response to fault detection
- G05B23/0286—Modifications to the monitored process, e.g. stopping operation or adapting control
-
- G—PHYSICS
- G06—COMPUTING; CALCULATING OR COUNTING
- G06F—ELECTRIC DIGITAL DATA PROCESSING
- G06F16/00—Information retrieval; Database structures therefor; File system structures therefor
- G06F16/20—Information retrieval; Database structures therefor; File system structures therefor of structured data, e.g. relational data
- G06F16/23—Updating
- G06F16/2358—Change logging, detection, and notification
-
- G—PHYSICS
- G06—COMPUTING; CALCULATING OR COUNTING
- G06F—ELECTRIC DIGITAL DATA PROCESSING
- G06F16/00—Information retrieval; Database structures therefor; File system structures therefor
- G06F16/20—Information retrieval; Database structures therefor; File system structures therefor of structured data, e.g. relational data
- G06F16/24—Querying
- G06F16/245—Query processing
- G06F16/2458—Special types of queries, e.g. statistical queries, fuzzy queries or distributed queries
- G06F16/2477—Temporal data queries
-
- G—PHYSICS
- G06—COMPUTING; CALCULATING OR COUNTING
- G06F—ELECTRIC DIGITAL DATA PROCESSING
- G06F16/00—Information retrieval; Database structures therefor; File system structures therefor
- G06F16/20—Information retrieval; Database structures therefor; File system structures therefor of structured data, e.g. relational data
- G06F16/28—Databases characterised by their database models, e.g. relational or object models
- G06F16/284—Relational databases
- G06F16/285—Clustering or classification
Definitions
- the present invention relates to a driving information analysis device.
- Patent Document 1 discloses a driving situation analysis system that analyzes the driving situation of a device connected to a distributed field control system, and collects information on the control state of the device or the operation on the device, and It is disclosed that an index value related to the utilization of the device is calculated based on that, and a comparative analysis of the utilization of the device among a plurality of sites is performed based on the index value.
- the driving situation analysis system of the above-mentioned patent document 1 is, for example, the integrated value of the deviation amount from the setting value of the control value for each day, or the total time during which a specific control value in one day is controlled by automatic control.
- the degree of utilization of the device is compared and analyzed by comparing the index value with similar devices at other sites using the index value etc.
- the process amount of the device to be monitored and the occurrence status of event information also change. For this reason, there is a possibility that the operating condition of the device can not be accurately evaluated only by analyzing the index value by dividing into unit time, such as every day, like the operating condition analysis system of Patent Document 1.
- the present invention has been made in view of the above, and it is an object of the present invention to provide a driving information analysis device capable of more accurately evaluating the driving condition of the device.
- the present invention arranges an information collecting unit for collecting event information generated during operation of a device including a plurality of devices, and the collected event information
- the information analysis unit includes: an information analysis unit that generates and accumulates an index value used to evaluate the driving condition of the device; and an information presentation unit that presents the index value accumulated in the information analysis unit to a user
- the unit is characterized in that the index value is generated for each divided period based on a change in the operating state of the device.
- the driving information analysis device of the present invention the event information generated during the operation of the device is organized and the index value used for the evaluation of the driving condition of the device is generated for each divided period based on the change in the driving condition of the device. Accumulated, and the accumulated index values are presented to the user. As a result, the user can confirm the index value of the device generated and presented in sections whenever the operating state of the device changes. Therefore, according to the driving information analysis device of the present invention, the driving situation of the device can be evaluated more accurately.
- running state is a change of any load of the said apparatus.
- the index value can be more accurately evaluated in response to a change in any load of the device.
- running state is a change of the kind of fuel used for either of the said apparatuses.
- the index value can be more accurately evaluated according to the change of the type of fuel used for any of the devices.
- the event information includes information on an alarm of the device, information on an operation of the device, information on an operating state of the device, and information on an alarm of the driving information analysis device, and the information analysis unit
- the index value is generated and accumulated by classifying by information type, and the information presentation unit presents the index value classified by the type of event information to the user. In this manner, the user can easily evaluate the operating condition of the device by classifying and presenting the index value to the user for each event information related to the device such as an alarm, an operation of the device, and an operating state of the device. .
- the information analysis unit classifies the type of the device and generates the index value
- the information presentation unit presents the index value classified by the type of the device to the user. Is preferred.
- the user can easily evaluate the operating condition of the device by classifying the index value for each device included in the device and presenting it to the user.
- the information presentation unit presents the index value for each period arbitrarily divided by the user.
- the information presentation unit presents the index value for each period arbitrarily divided by the user.
- the information collection unit collects a process amount of the device, and the information analysis unit generates and accumulates data in which the event information is associated with the behavior of the process amount related to the event information.
- the information presentation unit presents the data accumulated in the information analysis unit to the user.
- the information analysis unit when the device is updated or repaired, temporarily stops accumulation of the index value associated with the device that has been updated or repaired, and newly generates an index value. It is preferable to accumulate. This makes it possible to easily compare the effects of what has affected the operating condition of the device by updating or repairing the device, and to easily evaluate the superiority and inferiority before and after the updating or repairing of the device. .
- the information analysis unit temporarily stops accumulation of the data related to the device that has been updated or repaired, and newly generates the data. It is preferable to accumulate. This makes it possible to compare the change in behavior of the related process amount when an event occurs before and after the device is updated or repaired. Therefore, it is possible to analyze the cause of the event more efficiently.
- the driving information analysis device has the effect of being able to evaluate the driving situation of the device more accurately.
- FIG. 1 is a block diagram showing a driving information analysis apparatus according to the first embodiment.
- FIG. 2 is an explanatory view showing an example of event information acquired by the information collection unit.
- FIG. 3 is an explanatory view showing the change of the load of the generator according to the passage of time.
- FIG. 4 is an explanatory view showing an example of a database of index values generated in the information analysis unit.
- FIG. 5 is an explanatory view showing an example of the analysis result presented by the information presentation unit.
- FIG. 6 is an explanatory view showing an example of the analysis result presented by the information presentation unit.
- FIG. 7 is an explanatory view showing an example of the analysis result presented by the information presentation unit.
- FIG. 8 is an explanatory view showing an example of the analysis result presented by the information presentation unit.
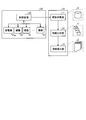
- FIG. 1 is a block diagram showing a driving information analysis apparatus according to the first embodiment.
- FIG. 2 is an explanatory view showing an example of event information acquired by the information collection unit.
- FIG. 3 is an
- FIG. 9 is an explanatory view showing an example of the analysis result presented by the information presentation unit.
- FIG. 10 is an explanatory view showing an example of the analysis result presented by the information presentation unit.
- FIG. 11 is an explanatory view showing an example of the analysis result presented by the information presentation unit.
- FIG. 12 is a block diagram showing a driving information analysis apparatus according to the second embodiment.
- FIG. 13 is an explanatory diagram of an example of correspondence between event information and a process amount related to the event information.
- FIG. 14 is an explanatory drawing showing an example of the analysis result of the event information and the behavior of the related process amount.
- FIG. 15 is a block diagram showing a driving information analysis apparatus according to a third embodiment.
- FIG. 1 is a block diagram showing a driving information analysis apparatus according to the first embodiment.
- the operation information analysis device 10 is a system for analyzing the operation status of the device 20, such as a power plant, and presenting the analyzed result to the user.
- the user is a manufacturer, a seller, or an operator who actually operates the device 20.
- the device 20 includes a plurality of devices 21 including a generator 21 g, and a control device 22 that controls the plurality of devices 21.
- the plurality of devices 21 are devices (for example, a gas turbine, a steam turbine, and the like) for driving the generator 21g, pumps, fans, various valve equipment, and the like.
- the control device 22 controls the process amount P of these devices 21.
- the control device 22 also functions as a storage unit that stores various types of event information generated when the device 20 is operated.
- the driving information analysis device 10 organizes the event information X of the device 20 collected by the information collecting unit 11 that communicates with the control device 22 and collects the event information X of the device 20, and the device 20
- the information analysis unit 12 that generates and accumulates a database Y of a plurality of index values used to evaluate 20 driving situations, and the database Y of a plurality of index values generated by the information analysis unit 12 are presented to the user as analysis results Z And an information presenting unit 13.
- the information collection unit 11 can communicate with the control device 22 via the network, and automatically acquires and stores the event information X of the device 20 from the control device 22 every predetermined period (for example, every hour, every day, etc.) .
- the information collection unit 11 may obtain the event information X of the device 20 stored in the control device 22 manually by the user via a storage medium such as a DVD-ROM, for example.
- the event information X generated during the operation of the device 20 includes information on an alarm generated by each device 21 of the device 20, information on an operation state of each device 21, and information on operation of each device 21 (see FIG. 4).
- the information on the operation of each device 21 includes the information on the driving operation of each device 21 and the information on the adjusting operation of each device 21.
- the event information X also includes information on a system alarm generated by the driving information analysis device 10.
- the information related to the alarm generated by each device 21 includes information such as an alarm related to a failure or abnormality of each device 21 or an alarm generated when the process amount P of each device 21 exceeds a control value in control.
- the case where an alarm is issued is defined as “occurrence”, and the case where an alarm is stopped is defined as “return”.
- the information on the operation state of each device 21 includes information on the start / stop operation of each device 21 and information such as what operation mode the device 21 is operated when having a plurality of operation modes.
- the start / stop operation of each device 21 means that if the device 21 is, for example, a pump, a fan, a motor or the like, an activation instruction or stop instruction is performed, and if the device 21 is a valve facility, the valve is opened. Indicates that a command or a close command has been issued.
- “on” is defined as one of the start / stop operation (an activation instruction or stop instruction, or an open instruction or a close instruction) for each device 21, and “off” is performed when the other is performed. Defined as
- the information on the driving operation of each device 21 includes information on any operation instruction other than the start / stop and the change of the operation mode performed to each device 21.
- the operation operation of each device 21 includes, for example, an operation of changing the control set value regarding the process amount P, such as the flow rate, pressure, and temperature as an operation target, for each device 21.
- the operation of each device 21 is mainly performed by an operator.
- the information on the adjustment operation of each device 21 includes the information on the operation instruction related to the control logic of each device 21.
- the adjustment operation of each device 21 includes, for example, an operation of changing a parameter value on control of each device 21 such as a set value of response speed to an input value or a detected value in control and a set value of gain. Adjustment operations of the respective devices 21 are mainly performed by maintenance personnel.
- the information on the system alarm generated in the driving information analysis device 10 is issued, for example, when the communication between the control device 22 and the information collecting unit 11 is interrupted, or when some abnormality occurs in the driving information analysis device 10, etc. Contains information about the alert.
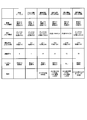
- FIG. 2 is an explanatory view showing an example of the event information X acquired by the information collection unit 11.
- the event information X information on the time when the event occurred, type code set in advance of the device 21 in which the event occurred, a message as specific content of the event, information on other events (for example, Information etc. regarding the plant hierarchy to which the corresponding device 21 belongs is included.
- produced in the apparatus 21 is shown as an example of a message.
- the information analysis unit 12 acquires the event information X from the information collection unit 11, and generates and accumulates a database Y of a plurality of index values for each period divided based on the operation state of the device 20.
- the change in the operating state of the device 20 refers to the change in the operating load of the generator 21g, and the device 21 for driving the generator 21g (for example, a gas turbine, a steam turbine, etc.) Change in the type of fuel being
- the change in the operating load of the generator 21g changes for each state of the generator 21g, such as the starting process of the generator 21g, the rated operation process, the partial load operating process, the minimum load operating process, the stop process, and the stop.
- the start-up process is, for example, a process in which the generator 21g is operated at an output of 35% or less of the rated load and until a predetermined time elapses without output fluctuation.
- the rated operation process is, for example, a process in which the generator 21g is operated at an output of 90% or more of the rated load.
- the partial load operation process is, for example, a process in which the generator 21g is operated at an output of 40% or more and less than 90% of the rated load.
- the minimum load operation process is, for example, a process in which the generator 21g is operated at an output of less than 40% of the rated load.
- the stopping process is a process until the operation of the generator 21g is stopped while the generator 21g is operated at an output of 5% or more and less than 35% of the rated load. During the stop, the operation of the generator 21g is stopped.
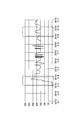
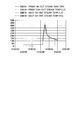
- FIG. 3 is an explanatory view showing a change of the load of the generator 21g according to the passage of time.
- the horizontal axis in FIG. 3 is the date, and the vertical axis is the load of the generator 21g.
- the range encircled by a broken line in FIG. 3 is the period of the start-up process of the generator 21g, and the range encircled by a two-dot chain line is the normal operation process of the generator 21g (rated operation process, partial load operation process and minimum load operation Period of the process).
- the load of the generator 21g is different in each process, and the change in the operating load of the generator 21g or the type of fuel used in the device 21 for driving the generator 21g
- the tendency of various events occurring in the device 20 is also likely to change. Therefore, by dividing the period in which the database Y of the index value is generated according to the change in the operation load of the generator 21g and the change in the type of fuel used, the evaluation of the operating condition of the device 20 is made more based on the index value. It can be done correctly.
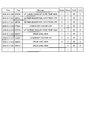
- FIG. 4 is an explanatory view showing an example of a database Y of index values generated in the information analysis unit 12.
- the index value database Y is generated by classifying the event information X according to the type.
- the type of event information X is information on an alarm generated by each device 21 of the apparatus 20, information on an operation state of each device 21, information on a driving operation of each device 21, adjustment operation of each device 21 Information related to the system alarm generated by the driving information analysis apparatus 10.
- the classification according to the type of event information X is not limited to this.
- the information analysis unit 12 generates a database Y of index values by classifying the types of the devices 21.
- a database Y of index values classified according to the type of each device 21 is generated with respect to information on the operating state of each device 21.
- the information analysis unit 12 classifies, for example, the pump, the fan, the valve equipment, and the like included in the device 20, and generates a database Y of index values for information on the operating state of the device 21.
- the information analysis unit 12 may also generate a database Y of index values by classifying the information related to the alarm, the information related to the driving operation, and the information related to the adjusting operation according to the type of each device 21.
- the information analysis unit 12 uses the alarm occurrence frequency (total number of occurrences), the order of occurrence and return of alarms according to time series, the generation interval of each alarm, the generation time length of each alarm, etc. Create a database Y of. Further, the information analysis unit 12 generates a database Y in which the top 30 types of cases are extracted in descending order of the occurrence frequency of the occurrence frequency (total occurrence number) of the alarm.
- the information analysis unit 12 uses the frequency of start / stop of each device 21 (total number of start / stop operations), the order of start / stop of each device 21 according to time series, and the start / stop of each device 21 A database Y such as an interval, a time length for each operation state (on state, off state, or operation state in each operation mode) of each device 21 is generated. In addition, the information analysis unit 12 generates a database Y in which the numbers of the top 30 types of cases are extracted in descending order of the start / stop frequency with respect to the start / stop frequency of each device 21 (total number of start / stop operations).
- the information analysis unit 12 relates to a driving operation frequency (total number of driving operation instructions) to the device 21, an order of the driving operation to the device 21 according to time series, and a process amount P of the device 21 as index values regarding the driving operation of the device 21.
- a database Y is generated such as the number of setting value changes on control, the setting value changing order according to time series, and the transition of driving operation frequency.
- the information analysis unit 12 generates a database Y in which the number of top 30 types of cases is extracted in descending order of driving operation frequency with respect to the driving operation frequency (total number of operation instructions).
- the information analysis unit 12 sets the adjustment operation frequency (total number of operation instructions) for the device 21, the order of the adjustment operation for the device 21 according to the time series, and the parameter change in control of the device 21 as an index value regarding the adjustment operation of the device 21.
- a database Y such as the number of times and parameter change order according to time series is generated.
- the information analysis unit 12 uses the alarm generation frequency (total number of generations), the order of alarm generation and recovery according to time series, the generation interval of each alarm, and the like as index values related to the system alarm generated in the driving information analysis device 10
- a database Y such as an alarm generation time length is generated.
- the information presentation unit 13 converts the database Y of index values acquired from the information analysis unit 12 into data usable by a spreadsheet application or the like of an externally connected personal computer (not shown), and the converted data is the operating condition of the apparatus 20 It transmits to the said personal computer as analysis result Z of.
- the user can view the analysis result Z via the personal computer.
- the driving information analysis device 10 may have a monitor for displaying the analysis result Z, and the information presentation unit 13 may cause the monitor to display the analysis result Z.
- the information presentation unit 13 generates a database Y of index values according to the type of event information X arbitrarily selected by the user and the type of the device 21 for each period arbitrarily divided by the user. Presented as analysis result Z. Further, in the present embodiment, the information presentation unit 13 presents, as the analysis result Z, a database Y of index values in response to a request from the user.
- the analysis result Z presented by the information presentation unit 13 will be described.
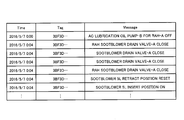
- the example of the analysis result Z of FIG. 5 shows the start / stop order according to the time series according to the type of the device 21 arbitrarily selected by the user.
- the "Time” column shows the date and time when the device 21 was started / stopped
- the "Tag” column shows the type code of the device 21,
- the "Messege” column The names of the respective devices 21 and the specific contents of the start / stop operation (instruction instruction or stop instruction, opening instruction or closing instruction of valve equipment) are shown.
- the user can easily grasp at what timing and in what order each device 21 started and stopped according to the type of the device 21 and in chronological order.
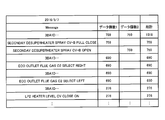
- the example of the analysis result Z of FIG. 6 shows the top 30 types of start / stop frequencies of the device 21 in a period optionally divided by the user.
- the user can select, for example, hourly, daily, weekly, monthly, half a year, one year, etc., as the time period arbitrarily divided.
- the period is targeted for May 7, 2016.
- the column "Messege” displays the type code of the device 21, the name of the device 21, and the specific content of the start / stop operation.
- the column of "number of data 1" displays the number of times the start / stop operation corresponding to "on" defined for each device 21 has been performed, and the column of "number of data 2" is defined for each device 21.
- the example of the analysis result Z of FIG. 7 shows the start / stop frequency for each of the devices 21 arbitrarily selected by the user during a period optionally divided by the user (for example, one month in May 2016).
- the column "Tag” displays the type code of the specific device 21
- the column "Message” displays the name of the device 21 and the contents of the start / stop information, "number of data 1".
- the column shows the number of times the starting / stopping operation corresponding to "on” defined for each device 21 has been performed, and the column “number of data 2" is "off” defined for each device 21.
- the number of times the corresponding start / stop operation has been performed is displayed, and the "time” column indicates the time when the start / stop of the device 21 has been performed.
- the period used by the user is arbitrary
- the user can easily grasp at what timing the start / stop has been performed while grasping the entire start / stop frequency of the device 21 arbitrarily selected by the person.
- the columns “Tag”, “Message”, “number of data 1”, and “number of data 2” are the same as the respective columns in FIG. 7.
- the column “total on time” displays the total time during which the on / off operation corresponding to “on” defined for each device 21 has been performed.
- 6 to 8 show an example of the analysis result Z relating to the start / stop frequency of the device 21 in a period arbitrarily divided by the user, but the period is divided according to the change in the operating state of the device 20. It may be one.
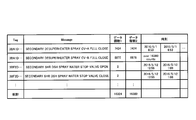
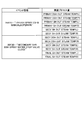
- the example of the analysis result Z of FIG. 9 shows the occurrence frequency according to the type of the event information X for each divided period based on the change of the operating state of the apparatus 20 and each user arbitrarily divided.
- the period consists of starting process (from May 1 to May 3), stopping process and starting process (May 17 and May 18) of the generator 21g, and normal operation process (from May to August) Separated by month).
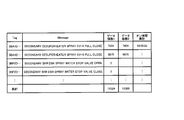
- the types of event information X are the total occurrence of the top 30 alarms of the device 21, the total occurrence of the top 30 types of start / stop operation of the device 21, the total number of driving operations of the top 30 types of the device 21, the total number of adjustment operations of the device 21 The total number of system alarms generated by the driving information analysis device 10.
- the total number of occurrences of the top 30 types of alarms, the total number of occurrences of the top 30 types of recovery, and the total number of occurrences including alarms other than the top 30 types are displayed.
- the start / stop operation of the device 21 the total number of occurrences of start / stop operations corresponding to the top 30 types of "on”, the total number of occurrence of start / stop operations corresponding to the top 30 types of "off”, and the start non-top 30 types The total number of occurrences including stop operation is displayed.
- the driving operation of the device 21 the total number of the top 30 types of driving operations and the total number of occurrences including the driving operations other than the top 30 types are displayed.
- the total number of alarm occurrences and the total number of restoration occurrences are displayed.
- a part of the breakdown etc. is shown for items (items marked with * in the figure) in which the total number of occurrences was particularly large.
- the presentation of information by the information presentation unit 13 is not limited to the one shown in the table as described above.
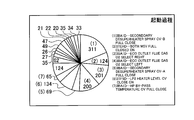
- the example of the analysis result Z of FIG. 10 shows the start / stop frequency of the device 21 arbitrarily selected by the user in the period of the start process of the generator 21g (period surrounded by the broken line in FIG. 3) by a circle graph. It is.
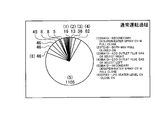
- the frequency of start / stop of the device 21 arbitrarily selected by the user during the period of the normal operation process of the generator 21g (period surrounded by a two-dot chain line in FIG. 3) It is shown.
- the information analysis unit 12 generates the database Y of index values for each divided period based on the change in the driving state of the apparatus 20 or It classifies and generates according to the event type, or classifies and generates according to the type of the device 21.
- the information presentation unit 13 can present the database Y of the index value as the analysis result Z in an easy-to-understand manner to the user in various modes.
- the user can evaluate the operating condition and abnormality indication of the device 20, and can efficiently find unnecessary driving operations, adjustment defects and the like in a short time. It is possible to make it easier to make improvement proposals to 20 operators.
- the driving information analysis device 10 the event information X generated during the driving of the device 20 is organized for each period divided based on the change in the driving state of the device 20, and the driving condition of the device 20
- the index value used for evaluation of is generated and accumulated, and the accumulated index value is presented to the user.
- the user can confirm the index value of the device 20 generated and presented in sections whenever the operating state of the device 20 changes. Therefore, according to the driving information analysis device 10, the driving situation of the device 20 can be evaluated more accurately.
- the change in the operating state is a change in the load of the generator 21g.
- an index value can be evaluated more correctly.
- the change in the operating state may be a change in the load of any one of the devices 21 other than the generator 21g.
- the change in the operating state is a change in the type of fuel used in the device 21 (for example, a gas turbine, a steam turbine, etc.) for driving the generator 21g.
- the index value can be more accurately evaluated according to the change in the type of fuel used for the device 21 for driving the generator 21g.
- the change in the operating state may be a change in the type of fuel used in the device 21 other than the device 21 for driving the generator 21g.
- the event information X includes information on the alarm of the device 20, information on the operation of the device 21, information on the operation state of the device 21, and information on the system alarm generated in the operation information analysis device 10, and the information analysis unit 12
- the information presentation unit 13 presents the user with the index values classified according to the type of the event information X. In this manner, the user can easily operate the device 20 by classifying the index value for each event information X related to the device 20 such as an alarm, the operation of the device 21 and the operation state of the device 21 and presenting the result to the user. It can be evaluated.
- the information analysis unit 12 classifies the type of the device 21 to generate an index value
- the information presentation unit 13 presents the user with the index value classified according to the type of the device 21.
- the user can easily evaluate the operating condition of the device 110 by classifying the index value for each of the devices 21 included in the device 20 and presenting the index value to the user.
- the information presentation unit 13 presents an index value for each period arbitrarily divided by the user. As a result, only the index value in the period that the user wants to confirm can be presented, so that the user can easily evaluate the driving situation of the device 20.
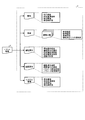
- FIG. 12 is a block diagram showing the driving information analysis apparatus 10B.
- the driving information analysis device 10B replaces the information collecting unit 11B of the driving information analysis device 10 of the first embodiment with the information analyzing unit 12B replacing the information collecting unit 11B with the information analyzing unit 12 of the driving information analysis device 10.
- the information presentation unit 13 instead of the information presentation unit 13.
- the functions of the information collection unit 11B, the information analysis unit 12B, and the information presentation unit 13B are the same as those of the information collection unit 11, the information analysis unit 12, and the information presentation unit 13 of the first embodiment, except for those described below. Since the same, the description of the overlapping functions is omitted.
- the information collecting unit 11B has a function of acquiring the process amount P of each device 21 from the control device 22 of the apparatus 20 and transmitting the process amount P to the information analyzing unit 12B.
- the other functions of the information collection unit 11B are the same as those of the information collection unit 11 of the first embodiment, and thus the description thereof is omitted.
- the information analysis unit 12B In addition to the function of the information analysis unit 12 of the first embodiment, the information analysis unit 12B generates a database Y2 that associates the event information X with the behavior of the process amount P related to the event information X. It has a function to accumulate.
- the other functions of the information analysis unit 12B are the same as those of the information analysis unit 12 of the first embodiment, and thus the description thereof is omitted.
- FIG. 13 is an explanatory drawing showing an example of the correspondence between event information X and the process amount P related to the event information X.
- the type code of the device 21, the name, and the specific contents of the start / stop operation are displayed in the “event information X” column, and the emission of the device 21 is displayed in the “related process amount P” column.
- the specific content of the process amount P (hereinafter referred to as “related process amount P”) related to the stopping operation is displayed.
- the event information X is not limited to the information on the start / stop operation of the device 21, but also the information on the alarm generated in each device 21 of the device 20, the information on the operation state other than the start / stop operation of each device 21 (in any operation mode It may be information on whether or not the vehicle is operated, information on the operation of each device 21, and information on the adjustment operation of each device 21.
- the user sets in advance the correspondence between the event information X and the related process amount P, an example of which is shown in FIG. 13, and stores the correspondence in the information analysis unit 12B.
- the correspondence relationship may not be set in advance, and may be generated as needed in the information analysis unit 12B.
- the information analysis unit 12B may set a related process amount P as one whose behavior has changed in a predetermined period before and after the event occurrence time.
- the information analysis unit 12B generates the database Y2 in which the values of the related process amounts P are arranged in time series in a predetermined period before and after the occurrence time of the event information X acquired from the information collection unit 11B according to the correspondence shown in FIG. To accumulate.
- the information presentation unit 13B presents the user as the analysis result Z2 a database Y2 in which the event information X accumulated by the information analysis unit 20B corresponds to the behavior of the related process amount P. .
- the other functions of the information presentation unit 13B are the same as those of the information presentation unit 13 of the first embodiment, and thus the description thereof is omitted.
- FIG. 14 is an explanatory drawing showing an example of the analysis result Z2 of the event information X and the behavior of the related process amount P.
- the example shown in FIG. 14 is a line graph showing the behavior of the related process amount P in a predetermined period before and after the timing at which a predetermined event occurs in the device 20.
- the horizontal axis is time
- the vertical axis is the value of the related process amount P.
- the analysis result Z2 is not limited to a line graph, and may be a table in which the values of the process amount P are arranged in time series, or a graph of another format.
- FIG. 15 is a block diagram showing the driving information analysis apparatus 10C.
- the driving information analysis device 10C includes an information analysis unit 12C in place of the information analysis unit 12B of the driving information analysis device 10B of the second embodiment.
- the other configuration of the driving information analysis device 10C is the same as that of the driving information analysis device 10B, and thus the description thereof is omitted.
- the function of the information analysis unit 12C is the same as that of the information analysis unit 12B of the second embodiment except for those described below, and therefore the description of the overlapping functions is omitted.
- the information analysis unit 12C When updating or repairing (overhauling) of the device 21 is performed, the information analysis unit 12C temporarily stops accumulation of the database Y of index values associated with the device 21 for which the updating or repairing has been performed, and newly adds an indicator. Create and store a database Y of values. In addition, when the device 21 is updated or repaired, the information analysis unit 12C associates the event information X and the behavior of the related process amount P related to the device 21 for which the update or repair has been performed. The accumulation of the database Y2 is temporarily stopped, and the database Y2 is newly generated and accumulated.
- database Y of index values associated with updated or repaired device 21 and event information X associated with updated or repaired device 21 are associated with the behavior of associated process amount P.
- the user sets in advance the stored database Y2 and stores it in the information analysis unit 12C.
- the database Y of index values associated with the updated or repaired device 21 and the database Y2 associated with the updated or repaired device 21 are not preset and the information analysis unit It may be generated at any time in 12C.
- the information analysis unit 12C associates the event value X with the behavior of the related process amount P with the database Y of index values whose values suddenly change before and after the device 21 is updated or repaired.
- the database Y2 may be the database Y and the database Y2 associated with the device 21 in which the update or repair has been performed.
- the database Y2 of the event information X and the behavior of the related process amount P are analyzed by using the database Y of the index value as the analysis result Z in various modes. It can be presented to the user in an easy-to-understand manner as the result Z2. As a result, the user can evaluate the operating condition and abnormality indication of the device 20, and can efficiently find unnecessary driving operations, adjustment defects and the like in a short time. It is possible to make it easier to make improvement proposals to 20 operators.
- the change of the index value can be compared. Therefore, it is possible to easily compare the effects of what has affected the operating condition of the apparatus 20 by updating or repairing the device 21, and to easily evaluate superiority and inferiority before and after the updating or repair of the device 21. It becomes.
- the device 21 before and after the device 21 is updated or repaired, it is possible to compare the change in behavior of the related process amount P when an event occurs. Therefore, it is possible to analyze the cause of the event more efficiently.
- the occurrence frequency of an event is compared and shown by a pie chart as shown in FIG. 10, for example, before and after updating or repair of the device 21, devices before and after the updating or repair of the device 21 are performed. It is possible to present the change of the 20 driving situations more easily to the user.
- the information analysis unit 12C temporarily stops only accumulation of the database Y of index values associated with the device 21 for which the update or repair has been performed, Only the database Y of index values may be newly generated and accumulated.
- the information collection unit 11B may not have the function of collecting the process amount P of the apparatus 20, and the information analysis unit 12C may be a database Y2 in which the event information X is associated with the behavior of the related process amount P. It does not have to generate and store.
- the information analysis unit 12C performs the event information X and the behavior of the related process amount P related to the device 21 on which the update or repair is performed. Only the accumulation of the corresponding database Y2 may be temporarily stopped, and only the database Y2 may be newly generated and accumulated.
Landscapes
- Engineering & Computer Science (AREA)
- Physics & Mathematics (AREA)
- General Physics & Mathematics (AREA)
- Automation & Control Theory (AREA)
- Theoretical Computer Science (AREA)
- Databases & Information Systems (AREA)
- General Engineering & Computer Science (AREA)
- Data Mining & Analysis (AREA)
- Manufacturing & Machinery (AREA)
- Human Computer Interaction (AREA)
- Fuzzy Systems (AREA)
- Software Systems (AREA)
- Computational Linguistics (AREA)
- Probability & Statistics with Applications (AREA)
- Mathematical Physics (AREA)
- Quality & Reliability (AREA)
- Testing And Monitoring For Control Systems (AREA)
- Management, Administration, Business Operations System, And Electronic Commerce (AREA)
- Recording Measured Values (AREA)
Abstract
The present invention comprises: an information collection unit (11) that collects event information generated during the driving of a device (20) that includes a plurality of instruments (21); an information analysis unit (12) that organizes the collected event information to generate and accumulate indicator values used in evaluating the driving situation of the device (20); and an information presentation unit (13) that presents, to a user, the indicator values accumulated by the information analysis unit (12). The information analysis unit (12) generates the indicator values for each period delimited on the basis of changes in the driving state of the device.
Description
本発明は、運転情報分析装置に関する。
The present invention relates to a driving information analysis device.
従来、装置の運転に関する様々な情報を収集し、収集した情報を分析することで装置の運転状況を評価する技術が知られている。例えば、特許文献1には、分散型フィールド制御システムに接続された装置の運転状況を分析する運転状況分析システムであって、装置の制御状態または装置への操作に関する情報を収集し、当該情報に基づいて装置の活用度に関する指標値を算出し、当該指標値に基づいて複数の現場間における装置の活用度の比較分析を行うものが開示されている。
2. Description of the Related Art Conventionally, there are known techniques for collecting various information related to the operation of a device and analyzing the collected information to evaluate the operating condition of the device. For example, Patent Document 1 discloses a driving situation analysis system that analyzes the driving situation of a device connected to a distributed field control system, and collects information on the control state of the device or the operation on the device, and It is disclosed that an index value related to the utilization of the device is calculated based on that, and a comparative analysis of the utilization of the device among a plurality of sites is performed based on the index value.
上記特許文献1の運転状況分析システムは、例えば、1日ごとの制御値の設定値からのずれ量の積算値や、1日の中で特定の制御値が自動制御により制御されている合計時間等を指標値として用い、当該指標値を他の現場における同様の装置同士で比較することで、装置の活用度を比較分析している。しかしながら、例えば、装置に含まれる機器の運転負荷の変化や、機器に使用される燃料の種類の変化といった運転状態の変化が生じた場合、監視対象である装置のプロセス量やイベント情報の発生状況も変化する。このため、特許文献1の運転状況分析システムのように、1日ごと等、単位時間ごとに区切って指標値を分析するだけでは、装置の運転状況を正確に評価し得ない可能性がある。
The driving situation analysis system of the above-mentioned patent document 1 is, for example, the integrated value of the deviation amount from the setting value of the control value for each day, or the total time during which a specific control value in one day is controlled by automatic control. The degree of utilization of the device is compared and analyzed by comparing the index value with similar devices at other sites using the index value etc. However, for example, when there is a change in the operating condition such as a change in the operation load of a device included in the device or a change in the type of fuel used in the device, the process amount of the device to be monitored and the occurrence status of event information Also change. For this reason, there is a possibility that the operating condition of the device can not be accurately evaluated only by analyzing the index value by dividing into unit time, such as every day, like the operating condition analysis system of Patent Document 1.
本発明は、上記に鑑みてなされたものであって、装置の運転状況をより正確に評価することができる運転情報分析装置を提供することを目的とする。
The present invention has been made in view of the above, and it is an object of the present invention to provide a driving information analysis device capable of more accurately evaluating the driving condition of the device.
上述した課題を解決し、目的を達成するために、本発明は、複数の機器を含む装置の運転中に発生したイベント情報を収集する情報収集部と、収集された前記イベント情報を整理して前記装置の運転状況の評価に用いる指標値を生成して蓄積する情報分析部と、前記情報分析部に蓄積された前記指標値を利用者に提示する情報提示部と、を備え、前記情報分析部は、前記装置の運転状態の変化に基づいて区切られる期間ごとに前記指標値を生成することを特徴とする。
In order to solve the problems described above and achieve the object, the present invention arranges an information collecting unit for collecting event information generated during operation of a device including a plurality of devices, and the collected event information The information analysis unit includes: an information analysis unit that generates and accumulates an index value used to evaluate the driving condition of the device; and an information presentation unit that presents the index value accumulated in the information analysis unit to a user The unit is characterized in that the index value is generated for each divided period based on a change in the operating state of the device.
本発明の運転情報分析装置では、装置の運転状態の変化に基づいて区切られる期間ごとに、装置の運転中に発生したイベント情報を整理して当該装置の運転状況の評価に用いる指標値を生成して蓄積し、蓄積された指標値を利用者に提示する。これにより、装置の運転状態が変化するごとに区切られて生成及び提示された装置の指標値を利用者が確認することができる。従って、本発明の運転情報分析装置によれば、装置の運転状況をより正確に評価することができる。
In the driving information analysis device of the present invention, the event information generated during the operation of the device is organized and the index value used for the evaluation of the driving condition of the device is generated for each divided period based on the change in the driving condition of the device. Accumulated, and the accumulated index values are presented to the user. As a result, the user can confirm the index value of the device generated and presented in sections whenever the operating state of the device changes. Therefore, according to the driving information analysis device of the present invention, the driving situation of the device can be evaluated more accurately.
また、前記運転状態の変化は、前記機器のいずれかの負荷の変化であることが好ましい。これにより、機器のいずれかの負荷の変化に応じて、より正確に指標値を評価することができる。
Moreover, it is preferable that the change of the said driving | running state is a change of any load of the said apparatus. Thereby, the index value can be more accurately evaluated in response to a change in any load of the device.
また、前記運転状態の変化は、前記機器のいずれかに使用される燃料の種類の変化であることが好ましい。これにより、機器のいずれかに使用される燃料の種類の変化に応じて、より正確に指標値を評価することができる。
Moreover, it is preferable that the change of the said driving | running state is a change of the kind of fuel used for either of the said apparatuses. Thereby, the index value can be more accurately evaluated according to the change of the type of fuel used for any of the devices.
また、前記イベント情報は、前記装置の警報に関する情報、前記機器の操作に関する情報、前記機器の運転状態に関する情報、及び前記運転情報分析装置の警報に関する情報を含み、前記情報分析部は、前記イベント情報の種類別に分類して前記指標値を生成して蓄積し、前記情報提示部は、前記イベント情報の種類別に分類された前記指標値を前記利用者に提示することが好ましい。このように、警報や機器の操作、機器の運転状態といった装置に関するイベント情報ごとに指標値を分類して利用者に提示することで、利用者が装置の運転状況を容易に評価することができる。
Further, the event information includes information on an alarm of the device, information on an operation of the device, information on an operating state of the device, and information on an alarm of the driving information analysis device, and the information analysis unit It is preferable that the index value is generated and accumulated by classifying by information type, and the information presentation unit presents the index value classified by the type of event information to the user. In this manner, the user can easily evaluate the operating condition of the device by classifying and presenting the index value to the user for each event information related to the device such as an alarm, an operation of the device, and an operating state of the device. .
また、前記情報分析部は、前記機器の種類別に分類して前記指標値を生成して蓄積し、前記情報提示部は、前記機器の種類別に分類された前記指標値を前記利用者に提示することが好ましい。このように、装置に含まれる機器ごとに指標値を分類して利用者に提示することで、利用者が装置の運転状況を容易に評価することができる。
In addition, the information analysis unit classifies the type of the device and generates the index value, and the information presentation unit presents the index value classified by the type of the device to the user. Is preferred. As described above, the user can easily evaluate the operating condition of the device by classifying the index value for each device included in the device and presenting it to the user.
また、前記情報提示部は、前記利用者によって任意に区切られた期間ごとに前記指標値を提示することが好ましい。これにより、利用者が確認したい期間における指標値だけを提示させることができるため、利用者が装置の運転状況を容易に評価することが可能となる。
Moreover, it is preferable that the information presentation unit presents the index value for each period arbitrarily divided by the user. As a result, only the index value in the period that the user wants to confirm can be presented, and the user can easily evaluate the driving situation of the device.
また、前記情報収集部は、前記装置のプロセス量を収集し、前記情報分析部は、前記イベント情報と、前記イベント情報に関連する前記プロセス量の挙動とを対応させたデータを生成して蓄積し、前記情報提示部は、前記情報分析部に蓄積された前記データを前記利用者に提示することが好ましい。これにより、例えば警報といったイベントが発生した際の関連するプロセス量の挙動を利用者が容易に把握することができる。この結果、イベントの発生原因をより効率的に分析することが可能となる。
Further, the information collection unit collects a process amount of the device, and the information analysis unit generates and accumulates data in which the event information is associated with the behavior of the process amount related to the event information. Preferably, the information presentation unit presents the data accumulated in the information analysis unit to the user. Thus, the user can easily grasp the behavior of the related process amount when an event such as an alarm occurs. As a result, it is possible to analyze the cause of the event more efficiently.
また、前記情報分析部は、前記機器の更新または修繕が行われたときに、更新または修繕が行われた前記機器と関連する指標値の蓄積を一旦停止し、新たに指標値を生成して蓄積することが好ましい。これにより、機器の更新または修繕によって、装置の運転状況にどのような影響を与えたかという効果の対比を容易に行い、機器の更新または修繕の前後における優劣を容易に評価することが可能となる。
In addition, when the device is updated or repaired, the information analysis unit temporarily stops accumulation of the index value associated with the device that has been updated or repaired, and newly generates an index value. It is preferable to accumulate. This makes it possible to easily compare the effects of what has affected the operating condition of the device by updating or repairing the device, and to easily evaluate the superiority and inferiority before and after the updating or repairing of the device. .
また、前記情報分析部は、前記機器の更新または修繕が行われたときに、更新または修繕が行われた前記機器と関連する前記データの蓄積を一旦停止し、新たに前記データを生成して蓄積することが好ましい。これにより、機器の更新または修繕が行われる前後で、イベントが発生した際の関連プロセス量の挙動の変化を対比することができる。従って、イベントの発生原因をさらに効率的に分析することが可能となる。
In addition, when the device is updated or repaired, the information analysis unit temporarily stops accumulation of the data related to the device that has been updated or repaired, and newly generates the data. It is preferable to accumulate. This makes it possible to compare the change in behavior of the related process amount when an event occurs before and after the device is updated or repaired. Therefore, it is possible to analyze the cause of the event more efficiently.
本発明にかかる運転情報分析装置は、装置の運転状況をより正確に評価することができるという効果を奏する。
The driving information analysis device according to the present invention has the effect of being able to evaluate the driving situation of the device more accurately.
以下に、本発明にかかる運転情報分析装置の実施形態を図面に基づいて詳細に説明する。なお、この実施形態によりこの発明が限定されるものではない。
Hereinafter, an embodiment of a driving information analysis apparatus according to the present invention will be described in detail based on the drawings. The present invention is not limited by this embodiment.
[第1実施形態]
図1は、第1実施形態にかかる運転情報分析装置を示すブロック図である。運転情報分析装置10は、例えば発電プラントといった装置20の運転状況を分析すると共に、分析した結果を利用者に提示するためのシステムである。利用者は、装置20の製造者、販売者、または装置20を実際に運用する運用者等である。装置20は、発電機21gを含む複数の機器21と、複数の機器21を制御する制御装置22とを備えている。複数の機器21は、発電機21gを駆動するための機器(例えばガスタービンや蒸気タービン等)、ポンプ、ファン、各種弁設備等である。制御装置22は、これらの機器21のプロセス量Pを制御する。また、制御装置22は、装置20の運転時に発生する各種イベント情報を記憶する記憶部としても機能する。 First Embodiment
FIG. 1 is a block diagram showing a driving information analysis apparatus according to the first embodiment. The operationinformation analysis device 10 is a system for analyzing the operation status of the device 20, such as a power plant, and presenting the analyzed result to the user. The user is a manufacturer, a seller, or an operator who actually operates the device 20. The device 20 includes a plurality of devices 21 including a generator 21 g, and a control device 22 that controls the plurality of devices 21. The plurality of devices 21 are devices (for example, a gas turbine, a steam turbine, and the like) for driving the generator 21g, pumps, fans, various valve equipment, and the like. The control device 22 controls the process amount P of these devices 21. The control device 22 also functions as a storage unit that stores various types of event information generated when the device 20 is operated.
図1は、第1実施形態にかかる運転情報分析装置を示すブロック図である。運転情報分析装置10は、例えば発電プラントといった装置20の運転状況を分析すると共に、分析した結果を利用者に提示するためのシステムである。利用者は、装置20の製造者、販売者、または装置20を実際に運用する運用者等である。装置20は、発電機21gを含む複数の機器21と、複数の機器21を制御する制御装置22とを備えている。複数の機器21は、発電機21gを駆動するための機器(例えばガスタービンや蒸気タービン等)、ポンプ、ファン、各種弁設備等である。制御装置22は、これらの機器21のプロセス量Pを制御する。また、制御装置22は、装置20の運転時に発生する各種イベント情報を記憶する記憶部としても機能する。 First Embodiment
FIG. 1 is a block diagram showing a driving information analysis apparatus according to the first embodiment. The operation
運転情報分析装置10は、制御装置22と通信して装置20のイベント情報Xを収集する情報収集部11と、情報収集部11によって取集された装置20のイベント情報Xを整理して、装置20の運転状況の評価に用いる複数の指標値のデータベースYを生成・蓄積する情報分析部12と、情報分析部12で生成された複数の指標値のデータベースYを分析結果Zとして利用者に提示する情報提示部13とを備える。
The driving information analysis device 10 organizes the event information X of the device 20 collected by the information collecting unit 11 that communicates with the control device 22 and collects the event information X of the device 20, and the device 20 The information analysis unit 12 that generates and accumulates a database Y of a plurality of index values used to evaluate 20 driving situations, and the database Y of a plurality of index values generated by the information analysis unit 12 are presented to the user as analysis results Z And an information presenting unit 13.
情報収集部11は、制御装置22とネットワークを介して通信可能であり、所定期間(例えば、毎時、毎日等)ごとに制御装置22から装置20のイベント情報Xを自動的に取得し、記憶する。ただし、情報収集部11は、制御装置22に記憶された装置20のイベント情報Xを例えばDVD-ROMといった記憶媒体を介して利用者の手動によって取得してもよい。
The information collection unit 11 can communicate with the control device 22 via the network, and automatically acquires and stores the event information X of the device 20 from the control device 22 every predetermined period (for example, every hour, every day, etc.) . However, the information collection unit 11 may obtain the event information X of the device 20 stored in the control device 22 manually by the user via a storage medium such as a DVD-ROM, for example.
装置20の運転中に発生するイベント情報Xは、装置20の各機器21で発生した警報に関する情報、各機器21の運転状態に関する情報、各機器21の操作に関する情報を含む(図4参照)。各機器21の操作に関する情報は、各機器21の運転操作に関する情報、及び各機器21の調整操作に関する情報を含む。また、イベント情報Xは、運転情報分析装置10で発生したシステム警報に関する情報も含む。
The event information X generated during the operation of the device 20 includes information on an alarm generated by each device 21 of the device 20, information on an operation state of each device 21, and information on operation of each device 21 (see FIG. 4). The information on the operation of each device 21 includes the information on the driving operation of each device 21 and the information on the adjusting operation of each device 21. The event information X also includes information on a system alarm generated by the driving information analysis device 10.
各機器21で発生した警報に関する情報は、各機器21の故障や異常に関する警報、各機器21のプロセス量Pが制御上の管理値を超えた場合に発せられる警報等の情報を含む。本実施形態では、警報が発せられた場合を「発生」と定義し、警報が停止された場合を「復帰」と定義する。
The information related to the alarm generated by each device 21 includes information such as an alarm related to a failure or abnormality of each device 21 or an alarm generated when the process amount P of each device 21 exceeds a control value in control. In the present embodiment, the case where an alarm is issued is defined as “occurrence”, and the case where an alarm is stopped is defined as “return”.
各機器21の運転状態に関する情報は、各機器21の発停動作の情報や、機器21が複数の運転モードを有する場合に、いかなる運転モードで運転されているかといった情報を含む。各機器21の発停動作とは、機器21が例えばポンプやファン、モータ等であれば、発動指示または停止指示が行われたことを意味し、機器21が弁設備であれば、弁の開指示または閉指示が行われたことを意味する。本実施形態では、機器21ごとに、発停動作(発動指示または停止指示、あるいは、開指示または閉指示)の一方がなされた場合を「オン」と定義し、他方がなされた場合を「オフ」と定義する。
The information on the operation state of each device 21 includes information on the start / stop operation of each device 21 and information such as what operation mode the device 21 is operated when having a plurality of operation modes. The start / stop operation of each device 21 means that if the device 21 is, for example, a pump, a fan, a motor or the like, an activation instruction or stop instruction is performed, and if the device 21 is a valve facility, the valve is opened. Indicates that a command or a close command has been issued. In the present embodiment, “on” is defined as one of the start / stop operation (an activation instruction or stop instruction, or an open instruction or a close instruction) for each device 21, and “off” is performed when the other is performed. Defined as
各機器21の運転操作に関する情報は、各機器21に対して行われた発停や運転モードの変更以外の何らかの操作指示に関する情報を含む。各機器21の運転操作は、例えば、各機器21について、運転目標とする流量や圧力、温度といったプロセス量Pに関する制御上の設定値を変更する操作を含む。各機器21の運転操作は、主として運転員(オペレータ)により行われる。各機器21の調整操作に関する情報は、各機器21の制御上のロジックに関わる操作指示に関する情報を含む。各機器21の調整操作は、例えば、制御において入力値や検出値に対する応答速度の設定値やゲインの設定値といった、各機器21の制御上のパラメータ値を変更する操作を含む。各機器21の調整操作は、主として保守員により行われる。
The information on the driving operation of each device 21 includes information on any operation instruction other than the start / stop and the change of the operation mode performed to each device 21. The operation operation of each device 21 includes, for example, an operation of changing the control set value regarding the process amount P, such as the flow rate, pressure, and temperature as an operation target, for each device 21. The operation of each device 21 is mainly performed by an operator. The information on the adjustment operation of each device 21 includes the information on the operation instruction related to the control logic of each device 21. The adjustment operation of each device 21 includes, for example, an operation of changing a parameter value on control of each device 21 such as a set value of response speed to an input value or a detected value in control and a set value of gain. Adjustment operations of the respective devices 21 are mainly performed by maintenance personnel.
運転情報分析装置10で発生したシステム警報に関する情報は、例えば制御装置22と情報収集部11との通信が遮断された場合や、運転情報分析装置10内において何らかの異常が発生した場合等に発せられる警報に関する情報を含む。
The information on the system alarm generated in the driving information analysis device 10 is issued, for example, when the communication between the control device 22 and the information collecting unit 11 is interrupted, or when some abnormality occurs in the driving information analysis device 10, etc. Contains information about the alert.
図2は、情報収集部11が取得するイベント情報Xの一例を示す説明図である。図示するように、イベント情報Xとしては、当該イベントが発生した時刻の情報、当該イベントが発生した機器21の予め設定された種類コード、イベントの具体的内容としてのメッセージ、その他イベントに関する情報(例えば該当する機器21が属するプラント階層に関する情報等)が含まれる。なお、図2では、メッセージの一例として、機器21に発生した警報の具体的内容を示している。
FIG. 2 is an explanatory view showing an example of the event information X acquired by the information collection unit 11. As illustrated, as the event information X, information on the time when the event occurred, type code set in advance of the device 21 in which the event occurred, a message as specific content of the event, information on other events (for example, Information etc. regarding the plant hierarchy to which the corresponding device 21 belongs is included. In addition, in FIG. 2, the specific content of the warning which generate | occur | produced in the apparatus 21 is shown as an example of a message.
情報分析部12は、イベント情報Xを情報収集部11から取得し、装置20の運転状態に基づいて区切られる期間ごとに、複数の指標値のデータベースYを生成して蓄積する。ここで、本実施形態において、装置20の運転状態の変化とは、発電機21gの運転負荷の変化、及び発電機21gを駆動するための機器21(例えば、ガスタービンや蒸気タービン等)において使用される燃料の種類の変化である。
The information analysis unit 12 acquires the event information X from the information collection unit 11, and generates and accumulates a database Y of a plurality of index values for each period divided based on the operation state of the device 20. Here, in the present embodiment, the change in the operating state of the device 20 refers to the change in the operating load of the generator 21g, and the device 21 for driving the generator 21g (for example, a gas turbine, a steam turbine, etc.) Change in the type of fuel being
発電機21gの運転負荷の変化は、発電機21gの起動過程、定格運転過程、部分負荷運転過程、最低負荷運転過程、停止過程、及び停止中といった発電機21gの状態ごとに変化する。起動過程は、例えば、発電機21gが定格負荷の35%以下の出力で、出力変動なしに所定時間を経過するまで運転されている過程である。定格運転過程は、例えば、発電機21gが定格負荷の90%以上の出力で運転されている過程である。部分負荷運転過程は、例えば、発電機21gが定格負荷の40%以上90%未満の出力で運転されている過程である。最低負荷運転過程は、例えば、発電機21gが定格負荷の40%未満の出力で運転されている過程である。停止過程は、発電機21gが定格負荷の5%以上35%未満の出力で運転されながら、発電機21gの運転が停止されるまでの過程である。停止中は、発電機21gの運転が停止されている状態である。
The change in the operating load of the generator 21g changes for each state of the generator 21g, such as the starting process of the generator 21g, the rated operation process, the partial load operating process, the minimum load operating process, the stop process, and the stop. The start-up process is, for example, a process in which the generator 21g is operated at an output of 35% or less of the rated load and until a predetermined time elapses without output fluctuation. The rated operation process is, for example, a process in which the generator 21g is operated at an output of 90% or more of the rated load. The partial load operation process is, for example, a process in which the generator 21g is operated at an output of 40% or more and less than 90% of the rated load. The minimum load operation process is, for example, a process in which the generator 21g is operated at an output of less than 40% of the rated load. The stopping process is a process until the operation of the generator 21g is stopped while the generator 21g is operated at an output of 5% or more and less than 35% of the rated load. During the stop, the operation of the generator 21g is stopped.
図3は、時間経過に従った発電機21gの負荷の変化を示す説明図である。図3の横軸は、日付であり、縦軸は、発電機21gの負荷である。図3において破線で囲んだ範囲は、発電機21gの起動過程の期間であり、二点鎖線で囲んだ範囲は、発電機21gの通常運転過程(定格運転過程、部分負荷運転過程および最低負荷運転過程のいずれか)の期間である。図示するように、発電機21gの負荷は、各過程において異なるものであり、このような発電機21gの運転負荷の変化、あるいは発電機21gを駆動するための機器21において使用される燃料の種類に変化が生じると、装置20で発生する各種イベントの傾向も変化しやすい。そのため、発電機21gの運転負荷の変化や使用される燃料の種類の変化に応じて指標値のデータベースYを生成する期間を区切ることで、指標値に基づいて装置20の運転状況の評価をより正確に行うことができる。
FIG. 3 is an explanatory view showing a change of the load of the generator 21g according to the passage of time. The horizontal axis in FIG. 3 is the date, and the vertical axis is the load of the generator 21g. The range encircled by a broken line in FIG. 3 is the period of the start-up process of the generator 21g, and the range encircled by a two-dot chain line is the normal operation process of the generator 21g (rated operation process, partial load operation process and minimum load operation Period of the process). As illustrated, the load of the generator 21g is different in each process, and the change in the operating load of the generator 21g or the type of fuel used in the device 21 for driving the generator 21g When the change occurs, the tendency of various events occurring in the device 20 is also likely to change. Therefore, by dividing the period in which the database Y of the index value is generated according to the change in the operation load of the generator 21g and the change in the type of fuel used, the evaluation of the operating condition of the device 20 is made more based on the index value. It can be done correctly.
図4は、情報分析部12において生成される指標値のデータベースYの例を示す説明図である。指標値のデータベースYは、イベント情報Xの種類別に分類して生成される。イベント情報Xの種類とは、上述したように、装置20の各機器21で発生した警報に関する情報、各機器21の運転状態に関する情報、各機器21の運転操作に関する情報、各機器21の調整操作に関する情報、及び運転情報分析装置10で発生したシステム警報に関する情報である。なお、イベント情報Xの種類別による分類は、これに限られない。
FIG. 4 is an explanatory view showing an example of a database Y of index values generated in the information analysis unit 12. The index value database Y is generated by classifying the event information X according to the type. As described above, the type of event information X is information on an alarm generated by each device 21 of the apparatus 20, information on an operation state of each device 21, information on a driving operation of each device 21, adjustment operation of each device 21 Information related to the system alarm generated by the driving information analysis apparatus 10. The classification according to the type of event information X is not limited to this.
また、情報分析部12は、各機器21の種類別に分類して指標値のデータベースYを生成する。本実施形態では、各機器21の運転状態に関する情報について、各機器21の種類別に分類した指標値のデータベースYを生成する。情報分析部12は、例えば装置20に含まれるポンプやファン、弁設備等ごとに分類して、機器21の運転状態に関する情報についての指標値のデータベースYを生成する。なお、情報分析部12は、警報に関する情報、運転操作に関する情報、及び調整操作に関する情報についても、各機器21の種類別に分類して指標値のデータベースYを生成してもよい。
Further, the information analysis unit 12 generates a database Y of index values by classifying the types of the devices 21. In the present embodiment, a database Y of index values classified according to the type of each device 21 is generated with respect to information on the operating state of each device 21. The information analysis unit 12 classifies, for example, the pump, the fan, the valve equipment, and the like included in the device 20, and generates a database Y of index values for information on the operating state of the device 21. The information analysis unit 12 may also generate a database Y of index values by classifying the information related to the alarm, the information related to the driving operation, and the information related to the adjusting operation according to the type of each device 21.
次に、指標値の具体的な内容について説明する。情報分析部12は、機器21の警報に関する指標値として、警報の発生頻度(発生総数)、時系列に従った警報の発生および復帰の順序、各警報の発生間隔、各警報の発生時間長等のデータベースYを生成する。また、情報分析部12は、警報の発生頻度(発生総数)について、発生頻度が多い順に上位30種類の件数を抽出したデータベースYを生成する。
Next, the specific content of the index value will be described. The information analysis unit 12 uses the alarm occurrence frequency (total number of occurrences), the order of occurrence and return of alarms according to time series, the generation interval of each alarm, the generation time length of each alarm, etc. Create a database Y of. Further, the information analysis unit 12 generates a database Y in which the top 30 types of cases are extracted in descending order of the occurrence frequency of the occurrence frequency (total occurrence number) of the alarm.
情報分析部12は、機器21の運転状態に関する指標値として、各機器21の発停頻度(発停動作の総数)、時系列に従った各機器21の発停順序、各機器21の発停間隔、各機器21の運転状態(オン状態、オフ状態、または各運転モードでの運転状態)ごとの時間長等のデータベースYを生成する。また、情報分析部12は、各機器21の発停頻度(発停動作の総数)について、発停頻度が多い順に上位30種類の件数を抽出したデータベースYを生成する。
The information analysis unit 12 uses the frequency of start / stop of each device 21 (total number of start / stop operations), the order of start / stop of each device 21 according to time series, and the start / stop of each device 21 A database Y such as an interval, a time length for each operation state (on state, off state, or operation state in each operation mode) of each device 21 is generated. In addition, the information analysis unit 12 generates a database Y in which the numbers of the top 30 types of cases are extracted in descending order of the start / stop frequency with respect to the start / stop frequency of each device 21 (total number of start / stop operations).
情報分析部12は、機器21の運転操作に関する指標値として、機器21に対する運転操作頻度(運転操作指示の総数)、時系列に従った機器21に対する運転操作の順序、機器21のプロセス量Pに関する制御上の設定値変更回数、時系列に従った設定値変更順序、運転操作頻度の推移等のデータベースYを生成する。また、情報分析部12は、運転操作頻度(操作指示の総数)について、運転操作頻度が多い順に上位30種類の件数を抽出したデータベースYを生成する。
The information analysis unit 12 relates to a driving operation frequency (total number of driving operation instructions) to the device 21, an order of the driving operation to the device 21 according to time series, and a process amount P of the device 21 as index values regarding the driving operation of the device 21. A database Y is generated such as the number of setting value changes on control, the setting value changing order according to time series, and the transition of driving operation frequency. In addition, the information analysis unit 12 generates a database Y in which the number of top 30 types of cases is extracted in descending order of driving operation frequency with respect to the driving operation frequency (total number of operation instructions).
情報分析部12は、機器21の調整操作に関する指標値として、機器21に対する調整操作頻度(操作指示の総数)、時系列に従った機器21に対する調整操作の順序、機器21の制御上のパラメータ変更回数、時系列に従ったパラメータ変更順序等のデータベースYを生成する。
The information analysis unit 12 sets the adjustment operation frequency (total number of operation instructions) for the device 21, the order of the adjustment operation for the device 21 according to the time series, and the parameter change in control of the device 21 as an index value regarding the adjustment operation of the device 21. A database Y such as the number of times and parameter change order according to time series is generated.
情報分析部12は、運転情報分析装置10で発生したシステム警報に関する指標値として、警報の発生頻度(発生総数)、時系列に従った警報の発生および復帰の順序、各警報の発生間隔、各警報の発生時間長等のデータベースYを生成する。
The information analysis unit 12 uses the alarm generation frequency (total number of generations), the order of alarm generation and recovery according to time series, the generation interval of each alarm, and the like as index values related to the system alarm generated in the driving information analysis device 10 A database Y such as an alarm generation time length is generated.
情報提示部13は、情報分析部12から取得した指標値のデータベースYを図示しない外部接続のパーソナルコンピュータの表計算アプリケーション等で利用可能なデータに変換し、当該変換したデータを装置20の運転状況の分析結果Zとして当該パーソナルコンピュータに送信する。利用者は、当該パーソナルコンピュータを介して分析結果Zを閲覧することができる。なお、運転情報分析装置10は、分析結果Zを表示するためのモニタを有してもよく、情報提示部13は、当該モニタに分析結果Zを表示させるものであってもよい。
The information presentation unit 13 converts the database Y of index values acquired from the information analysis unit 12 into data usable by a spreadsheet application or the like of an externally connected personal computer (not shown), and the converted data is the operating condition of the apparatus 20 It transmits to the said personal computer as analysis result Z of. The user can view the analysis result Z via the personal computer. The driving information analysis device 10 may have a monitor for displaying the analysis result Z, and the information presentation unit 13 may cause the monitor to display the analysis result Z.
本実施形態において、情報提示部13は、利用者によって任意に区切られた期間ごと、また、利用者によって任意に選択されたイベント情報Xの種類別や機器21の種類別に指標値のデータベースYを分析結果Zとして提示する。また、本実施形態において、情報提示部13は、指標値のデータベースYのうち、利用者からの要求に応じたものを分析結果Zとして提示する。以下、情報提示部13によって提示される分析結果Zの例について説明する。
In the present embodiment, the information presentation unit 13 generates a database Y of index values according to the type of event information X arbitrarily selected by the user and the type of the device 21 for each period arbitrarily divided by the user. Presented as analysis result Z. Further, in the present embodiment, the information presentation unit 13 presents, as the analysis result Z, a database Y of index values in response to a request from the user. Hereinafter, an example of the analysis result Z presented by the information presentation unit 13 will be described.
図5から図11は、情報提示部13により提示された分析結果Zの一例を示す説明図である。図5の分析結果Zの例は、利用者が任意に選択した機器21の種類別の時系列に従った発停順序を示す。“Time”の欄には、機器21の発停が行われた日時が表示されており、“Tag”の欄には、機器21の種類コードが表示されており、“Messege”の欄には、各機器21の名称と発停動作の具体的内容(発動指示または停止指示、弁設備の開指示または閉指示)とが示されている。これにより、機器21の種類別に、時系列に従って、各機器21がどのタイミングで、どの順序で発停したかを利用者が容易に把握することができる。
5 to 11 are explanatory diagrams showing an example of the analysis result Z presented by the information presentation unit 13. The example of the analysis result Z of FIG. 5 shows the start / stop order according to the time series according to the type of the device 21 arbitrarily selected by the user. The "Time" column shows the date and time when the device 21 was started / stopped, the "Tag" column shows the type code of the device 21, and the "Messege" column The names of the respective devices 21 and the specific contents of the start / stop operation (instruction instruction or stop instruction, opening instruction or closing instruction of valve equipment) are shown. As a result, the user can easily grasp at what timing and in what order each device 21 started and stopped according to the type of the device 21 and in chronological order.
図6の分析結果Zの例は、利用者が任意で区切った期間における機器21の発停頻度の上位30種類を示す。任意に区切られた期間は、例えば、毎時、毎日、毎週、毎月、半年、一年などから利用者が選択することができる。図6に示す例では、2016年5月7日を期間の対象としている。“Messege”の欄は、機器21の種類コードと、機器21の名称及び発停動作の具体的内容とを表示している。“データ個数1”の欄は、機器21ごとに定義される「オン」に該当する発停動作が行われた回数を表示し、“データ個数2”の欄は、機器21ごとに定義される「オフ」に該当する発停動作が行われた回数を表示し、“総計”の欄は、「オン」および「オフ」の総数を表示している。これにより、利用者が任意に指定した期間において、複数の機器21のいずれにおいて発停動作が多く行われたかを、利用者が容易に把握することができる。
The example of the analysis result Z of FIG. 6 shows the top 30 types of start / stop frequencies of the device 21 in a period optionally divided by the user. The user can select, for example, hourly, daily, weekly, monthly, half a year, one year, etc., as the time period arbitrarily divided. In the example shown in FIG. 6, the period is targeted for May 7, 2016. The column "Messege" displays the type code of the device 21, the name of the device 21, and the specific content of the start / stop operation. The column of "number of data 1" displays the number of times the start / stop operation corresponding to "on" defined for each device 21 has been performed, and the column of "number of data 2" is defined for each device 21. The number of times the start / stop operation corresponding to "off" is performed is displayed, and the "total" column indicates the total number of "on" and "off". As a result, the user can easily grasp in which of the plurality of devices 21 a large number of start / stop operations have been performed in a period arbitrarily designated by the user.
図7の分析結果Zの例は、利用者が任意で区切った期間(例えば2016年5月の1カ月間)、利用者が任意に選択した機器21ごとの発停頻度を示す。図7において、“Tag”の欄は、特定の機器21の種類コードを表示し、“Message”の欄は、当該機器21の名称および発停情報の内容を表示し、“データ個数1”の欄は、当該機器21ごとに定義される「オン」に該当する発停動作が行われた回数を表示し、“データ個数2”の欄は、当該機器21ごとに定義される「オフ」に該当する発停動作が行われた回数を表示し、“時刻”の欄は、機器21の発停が行われた時刻を示している。例えば、“時刻”の欄を「オン」に該当する発停動作と「オフ」に該当する発停動作とで異なる文字色で表示するものとすれば、利用者が任意で区切った期間、利用者が任意に選択した機器21について、全体の発停頻度を把握しながら、いかなるタイミングで発停が行われたかを利用者が容易に把握することができる。
The example of the analysis result Z of FIG. 7 shows the start / stop frequency for each of the devices 21 arbitrarily selected by the user during a period optionally divided by the user (for example, one month in May 2016). In FIG. 7, the column "Tag" displays the type code of the specific device 21, and the column "Message" displays the name of the device 21 and the contents of the start / stop information, "number of data 1". The column shows the number of times the starting / stopping operation corresponding to "on" defined for each device 21 has been performed, and the column "number of data 2" is "off" defined for each device 21. The number of times the corresponding start / stop operation has been performed is displayed, and the "time" column indicates the time when the start / stop of the device 21 has been performed. For example, if it is assumed that the column of "time" is displayed in different character colors for the on / off operation corresponding to "on" and the on / off operation corresponding to "off", the period used by the user is arbitrary The user can easily grasp at what timing the start / stop has been performed while grasping the entire start / stop frequency of the device 21 arbitrarily selected by the person.
図8の分析結果Zの例も、図7と同様に、利用者が任意で区切った期間(例えば2016年5月の1カ月間)、利用者が任意に選択した機器21ごとの発停頻度を示す。図8において、“Tag”、“Message”、“データ個数1”、“データ個数2”の欄は、図7の各欄と同じである。図7において、“オン時間集計”の欄は、機器21ごとに定義される「オン」に該当する発停動作が行われていた総時間を表示する。これにより、利用者が任意で区切った期間、利用者が任意に選択した機器21について、全体の発停頻度を把握しながら、機器21の発停動作が行われていた総時間を利用者が容易に把握することができる。
Similarly to FIG. 7, in the example of the analysis result Z of FIG. 8, the frequency of start and stop of each device 21 arbitrarily selected by the user during a period optionally divided by the user (for example, one month in May 2016). Indicates In FIG. 8, the columns “Tag”, “Message”, “number of data 1”, and “number of data 2” are the same as the respective columns in FIG. 7. In FIG. 7, the column “total on time” displays the total time during which the on / off operation corresponding to “on” defined for each device 21 has been performed. As a result, while the user arbitrarily divides the device 21, the total time during which the device 21 starts and stops while grasping the entire start and stop frequency of the device 21 is divided by the user. It can be easily grasped.
図6から図8の例では、利用者が任意で区切った期間における機器21の発停頻度に関する分析結果Zの例を示したが、期間は、装置20の運転状態の変化に応じて区切られるものであってもよい。例えば、図3において破線で囲んだ発電機21gの起動過程と、二点鎖線で囲んだ発電機21gの定格運転過程のそれぞれにおいて、図6から図8と同様に、機器21の発停頻度の上位30種類や、利用者が任意に選択した機器21ごとの発停頻度、発停動作の時刻、「オン」に該当する発停動作が行われていた総時間等を提示するものとすれば、各過程において発生した機器21の発停動作がいかなるものであったか、利用者が容易に把握することが可能となる。
6 to 8 show an example of the analysis result Z relating to the start / stop frequency of the device 21 in a period arbitrarily divided by the user, but the period is divided according to the change in the operating state of the device 20. It may be one. For example, in each of the start-up process of the generator 21g surrounded by a broken line in FIG. 3 and the rated operation process of the generator 21g surrounded by a two-dot chain line, similarly to FIGS. If the top 30 types, the frequency of start / stop for each device 21 arbitrarily selected by the user, the time of start / stop operation, the total time during which the start / stop operation corresponding to “on” is performed, etc. The user can easily grasp what kind of operation of the device 21 occurred in each process.
図9の分析結果Zの例は、装置20の運転状態の変化に基づいて区切られた期間、かつ利用者が任意で区切った期間ごとのイベント情報Xの種類別の発生頻度を示す。期間は、発電機21gの起動過程(5月1日から5月3日まで)、停止過程および起動過程(5月17日および5月18日)、通常運転過程(5月から8月まで一月ごと)に区切られている。イベント情報Xの種類は、機器21の警報の上位30種類の発生総数、機器21の発停動作の上位30種類の発生総数、機器21の上位30種類の運転操作総数、機器21の調整操作総数、運転情報分析装置10で発生したシステム警報の発生総数である。機器21の警報については、上位30種類の警報の発生総数と、上位30種類の復帰の発生総数、及び上位30種類以外の警報も含んだ発生総数が表示されている。機器21の発停動作については、上位30種類の「オン」に該当する発停動作の発生総数、上位30種類の「オフ」に該当する発停動作の発生総数、及び上位30種類以外の発停動作も含んだ発生総数が表示されている。機器21の運転操作については、上位30種類の運転操作総数、及び上位30種類以外の運転操作も含んだ発生総数が表示されている。運転情報分析装置10で発生したシステム警報については、警報の発生総数、及び復帰の発生総数が表示されている。また、“備考”の欄には、特に発生総数が多かった項目(図中の※印が付されている項目)について、その内訳の一部等を示している。これにより、装置20の運転状態(発電機21gの負荷)が変化するごとに、機器21の警報や発停動作、運転操作、調整操作、及び運転情報分析装置10で発生したシステム警報がどのような頻度で発生していたかを利用者が容易に把握することができる。
The example of the analysis result Z of FIG. 9 shows the occurrence frequency according to the type of the event information X for each divided period based on the change of the operating state of the apparatus 20 and each user arbitrarily divided. The period consists of starting process (from May 1 to May 3), stopping process and starting process (May 17 and May 18) of the generator 21g, and normal operation process (from May to August) Separated by month). The types of event information X are the total occurrence of the top 30 alarms of the device 21, the total occurrence of the top 30 types of start / stop operation of the device 21, the total number of driving operations of the top 30 types of the device 21, the total number of adjustment operations of the device 21 The total number of system alarms generated by the driving information analysis device 10. As for the alarms of the device 21, the total number of occurrences of the top 30 types of alarms, the total number of occurrences of the top 30 types of recovery, and the total number of occurrences including alarms other than the top 30 types are displayed. Regarding the start / stop operation of the device 21, the total number of occurrences of start / stop operations corresponding to the top 30 types of "on", the total number of occurrence of start / stop operations corresponding to the top 30 types of "off", and the start non-top 30 types The total number of occurrences including stop operation is displayed. As for the driving operation of the device 21, the total number of the top 30 types of driving operations and the total number of occurrences including the driving operations other than the top 30 types are displayed. For system alarms generated by the driving information analysis device 10, the total number of alarm occurrences and the total number of restoration occurrences are displayed. In addition, in the column of “Remarks”, a part of the breakdown etc. is shown for items (items marked with * in the figure) in which the total number of occurrences was particularly large. As a result, whenever the operating state of the device 20 (load of the generator 21g) changes, how is the alarm of the device 21, the on / off operation, the driving operation, the adjusting operation, and the system alarm generated in the driving information analysis device 10? The user can easily grasp whether it occurred at a certain frequency.
また、情報提示部13による情報の提示は、これまでに示したような表によるものだけには限られない。図10の分析結果Zの例は、発電機21gの起動過程の期間(図3において破線で囲んだ期間)において、利用者が任意に選んだ機器21の発停頻度を円グラフにより示したものである。図11の分析結果Zの例は、発電機21gの通常運転過程の期間(図3において二点鎖線で囲んだ期間)において、利用者が任意に選んだ機器21の発停頻度を円グラフにより示したものである。このように、発電機21gの負荷が変化するごとに期間を区切り、各期間における機器21の発停頻度等の指標値を円グラフで提示すれば、各期間で発生したイベントの比率を利用者が容易に把握することができる。
Further, the presentation of information by the information presentation unit 13 is not limited to the one shown in the table as described above. The example of the analysis result Z of FIG. 10 shows the start / stop frequency of the device 21 arbitrarily selected by the user in the period of the start process of the generator 21g (period surrounded by the broken line in FIG. 3) by a circle graph. It is. In the example of the analysis result Z of FIG. 11, the frequency of start / stop of the device 21 arbitrarily selected by the user during the period of the normal operation process of the generator 21g (period surrounded by a two-dot chain line in FIG. 3) It is shown. Thus, each time the load of the generator 21g changes, a period is divided, and if an index value such as the frequency of start / stop of the device 21 in each period is presented as a pie chart, the ratio of events occurring in each period is the user Can be easily grasped.
このように、本実施形態の運転情報分析装置10において、情報分析部12は、指標値のデータベースYを装置20の運転状態の変化に基づいて区切られた期間ごとに生成したり、装置20のイベント種類別に分類して生成したり、機器21の種類別に分類して生成する。これにより、情報提示部13は、様々な態様で当該指標値のデータベースYを分析結果Zとして利用者にわかりやすく提示することができる。この結果、利用者が装置20の運転状況や異常兆候を評価し、不要な運転操作、調整不良箇所等を短時間で効率的に発見することができるため、装置20の運用改善の検討や装置20の運用者への改善提案をより行いやすくすることが可能となる。
As described above, in the driving information analysis apparatus 10 of the present embodiment, the information analysis unit 12 generates the database Y of index values for each divided period based on the change in the driving state of the apparatus 20 or It classifies and generates according to the event type, or classifies and generates according to the type of the device 21. Thereby, the information presentation unit 13 can present the database Y of the index value as the analysis result Z in an easy-to-understand manner to the user in various modes. As a result, the user can evaluate the operating condition and abnormality indication of the device 20, and can efficiently find unnecessary driving operations, adjustment defects and the like in a short time. It is possible to make it easier to make improvement proposals to 20 operators.
以上説明したように、運転情報分析装置10では、装置20の運転状態の変化に基づいて区切られる期間ごとに、装置20の運転中に発生したイベント情報Xを整理して当該装置20の運転状況の評価に用いる指標値を生成して蓄積し、蓄積された指標値を利用者に提示する。これにより、装置20の運転状態が変化するごとに区切られて生成及び提示された装置20の指標値を利用者が確認することができる。従って、運転情報分析装置10によれば、装置20の運転状況をより正確に評価することができる。
As described above, in the driving information analysis device 10, the event information X generated during the driving of the device 20 is organized for each period divided based on the change in the driving state of the device 20, and the driving condition of the device 20 The index value used for evaluation of is generated and accumulated, and the accumulated index value is presented to the user. As a result, the user can confirm the index value of the device 20 generated and presented in sections whenever the operating state of the device 20 changes. Therefore, according to the driving information analysis device 10, the driving situation of the device 20 can be evaluated more accurately.
また、運転状態の変化は、発電機21gの負荷の変化である。これにより、発電機21gの負荷の変化に応じて、より正確に指標値を評価することができる。なお、運転状態の変化は、発電機21g以外の他の機器21のいずれかの負荷の変化であってもよい。
In addition, the change in the operating state is a change in the load of the generator 21g. Thereby, according to the change of the load of the generator 21g, an index value can be evaluated more correctly. The change in the operating state may be a change in the load of any one of the devices 21 other than the generator 21g.
また、運転状態の変化は、発電機21gを駆動するための機器21(例えば、ガスタービンや蒸気タービン等)において使用される燃料の種類の変化である。これにより、発電機21gを駆動するための機器21に使用される燃料の種類の変化に応じて、より正確に指標値を評価することができる。なお、運転状態の変化は、発電機21gを駆動するための機器21以外の機器21において使用される燃料の種類の変化であってもよい。
Further, the change in the operating state is a change in the type of fuel used in the device 21 (for example, a gas turbine, a steam turbine, etc.) for driving the generator 21g. Thus, the index value can be more accurately evaluated according to the change in the type of fuel used for the device 21 for driving the generator 21g. The change in the operating state may be a change in the type of fuel used in the device 21 other than the device 21 for driving the generator 21g.
また、イベント情報Xは、装置20の警報に関する情報、機器21の操作に関する情報、機器21の運転状態に関する情報、及び運転情報分析装置10で発生したシステム警報に関する情報を含み、情報分析部12は、イベント情報Xの種類別に分類して指標値を生成し、情報提示部13は、イベント情報Xの種類別に分類された指標値を利用者に提示する。このように、警報や機器21の操作、機器21の運転状態といった装置20に関するイベント情報Xごとに指標値を分類して利用者に提示することで、利用者が装置20の運転状況を容易に評価することができる。
Further, the event information X includes information on the alarm of the device 20, information on the operation of the device 21, information on the operation state of the device 21, and information on the system alarm generated in the operation information analysis device 10, and the information analysis unit 12 The information presentation unit 13 presents the user with the index values classified according to the type of the event information X. In this manner, the user can easily operate the device 20 by classifying the index value for each event information X related to the device 20 such as an alarm, the operation of the device 21 and the operation state of the device 21 and presenting the result to the user. It can be evaluated.
また、情報分析部12は、機器21の種類別に分類して指標値を生成し、情報提示部13は、機器21の種類別に分類された指標値を利用者に提示する。このように、装置20に含まれる機器21ごとに指標値を分類して利用者に提示することで、利用者が装置110の運転状況を容易に評価することができる。
Further, the information analysis unit 12 classifies the type of the device 21 to generate an index value, and the information presentation unit 13 presents the user with the index value classified according to the type of the device 21. Thus, the user can easily evaluate the operating condition of the device 110 by classifying the index value for each of the devices 21 included in the device 20 and presenting the index value to the user.
また、情報提示部13は、利用者によって任意に区切られた期間ごとに指標値を提示する。これにより、利用者が確認したい期間における指標値だけを提示させることができるため、利用者が装置20の運転状況を容易に評価することが可能となる。
In addition, the information presentation unit 13 presents an index value for each period arbitrarily divided by the user. As a result, only the index value in the period that the user wants to confirm can be presented, so that the user can easily evaluate the driving situation of the device 20.
[第2実施形態]
次に、第2実施形態にかかる運転情報分析装置10Bについて説明する。図12は、運転情報分析装置10Bを示すブロック図である。運転情報分析装置10Bは、第1実施形態の運転情報分析装置10の情報収集部11に代えて、情報収集部11Bを、運転情報分析装置10の情報分析部12に代えて、情報分析部12Bを、情報提示部13に代えて、情報提示部13Bを備える。なお、情報収集部11B、情報分析部12B、及び情報提示部13Bの機能は、以下に説明するものを除き、第1実施形態の情報収集部11、情報分析部12、及び情報提示部13と同様であるため、重複する機能についての説明は、省略する。 Second Embodiment
Next, the driving information analysis apparatus 10B according to the second embodiment will be described. FIG. 12 is a block diagram showing the driving information analysis apparatus 10B. The driving information analysis device 10B replaces theinformation collecting unit 11B of the driving information analysis device 10 of the first embodiment with the information analyzing unit 12B replacing the information collecting unit 11B with the information analyzing unit 12 of the driving information analysis device 10. And the information presentation unit 13 instead of the information presentation unit 13. The functions of the information collection unit 11B, the information analysis unit 12B, and the information presentation unit 13B are the same as those of the information collection unit 11, the information analysis unit 12, and the information presentation unit 13 of the first embodiment, except for those described below. Since the same, the description of the overlapping functions is omitted.
次に、第2実施形態にかかる運転情報分析装置10Bについて説明する。図12は、運転情報分析装置10Bを示すブロック図である。運転情報分析装置10Bは、第1実施形態の運転情報分析装置10の情報収集部11に代えて、情報収集部11Bを、運転情報分析装置10の情報分析部12に代えて、情報分析部12Bを、情報提示部13に代えて、情報提示部13Bを備える。なお、情報収集部11B、情報分析部12B、及び情報提示部13Bの機能は、以下に説明するものを除き、第1実施形態の情報収集部11、情報分析部12、及び情報提示部13と同様であるため、重複する機能についての説明は、省略する。 Second Embodiment
Next, the driving information analysis apparatus 10B according to the second embodiment will be described. FIG. 12 is a block diagram showing the driving information analysis apparatus 10B. The driving information analysis device 10B replaces the
情報収集部11Bは、第1実施形態の情報収集部11の機能に加えて、装置20の制御装置22から各機器21のプロセス量Pを取得し、情報分析部12Bへと送信する機能を有する。なお、情報収集部11Bのその他の機能は、第1実施形態の情報収集部11と同様であるため、説明を省略する。
In addition to the function of the information collecting unit 11 of the first embodiment, the information collecting unit 11B has a function of acquiring the process amount P of each device 21 from the control device 22 of the apparatus 20 and transmitting the process amount P to the information analyzing unit 12B. . The other functions of the information collection unit 11B are the same as those of the information collection unit 11 of the first embodiment, and thus the description thereof is omitted.
情報分析部12Bは、第1実施形態の情報分析部12の機能に加えて、上記イベント情報Xと、当該イベント情報Xに関連したプロセス量Pの挙動とを対応させたデータベースY2を生成して蓄積する機能を有する。なお、情報分析部12Bのその他の機能は、第1実施形態の情報分析部12と同様であるため、説明を省略する。
In addition to the function of the information analysis unit 12 of the first embodiment, the information analysis unit 12B generates a database Y2 that associates the event information X with the behavior of the process amount P related to the event information X. It has a function to accumulate. The other functions of the information analysis unit 12B are the same as those of the information analysis unit 12 of the first embodiment, and thus the description thereof is omitted.
図13は、イベント情報Xと、当該イベント情報Xに関連したプロセス量Pとの対応関係の一例を示す説明図である。図13に示す例では、“イベント情報X”の欄に、機器21の種類コード、名称および発停動作の具体的内容を表示し、“関連プロセス量P”の欄に、当該機器21の発停動作に関連したプロセス量P(以下、「関連プロセス量P」という。)の具体的内容を表示している。ただし、イベント情報Xは、機器21の発停動作に関する情報に限られず、装置20の各機器21で発生した警報に関する情報、各機器21の発停動作以外の運転状態に関する情報(いかなる運転モードで運転されているかの情報)、各機器21の運転操作に関する情報、及び各機器21の調整操作に関する情報であってもよい。
FIG. 13 is an explanatory drawing showing an example of the correspondence between event information X and the process amount P related to the event information X. As shown in FIG. In the example shown in FIG. 13, the type code of the device 21, the name, and the specific contents of the start / stop operation are displayed in the “event information X” column, and the emission of the device 21 is displayed in the “related process amount P” column. The specific content of the process amount P (hereinafter referred to as “related process amount P”) related to the stopping operation is displayed. However, the event information X is not limited to the information on the start / stop operation of the device 21, but also the information on the alarm generated in each device 21 of the device 20, the information on the operation state other than the start / stop operation of each device 21 (in any operation mode It may be information on whether or not the vehicle is operated, information on the operation of each device 21, and information on the adjustment operation of each device 21.
本実施形態において、図13に一例を示すイベント情報Xと関連プロセス量Pとの対応関係は、利用者が予め設定して情報分析部12Bに記憶させておく。ただし、当該対応関係は、予め設定されるものでなく、情報分析部12Bにおいて随時生成されるものであってもよい。この場合、情報分析部12Bは、情報収集部11Bから取得したプロセス量Pのうち、イベントの発生時刻の前後の所定期間において挙動が変化しているものを関連プロセス量Pとすればよい。情報分析部12Bは、図13に示す対応関係に従って、情報収集部11Bから取得したイベント情報Xの発生時刻の前後の所定期間において、関連プロセス量Pの値を時系列に並べたデータベースY2を生成して蓄積する。
In the present embodiment, the user sets in advance the correspondence between the event information X and the related process amount P, an example of which is shown in FIG. 13, and stores the correspondence in the information analysis unit 12B. However, the correspondence relationship may not be set in advance, and may be generated as needed in the information analysis unit 12B. In this case, among the process amounts P acquired from the information collection unit 11B, the information analysis unit 12B may set a related process amount P as one whose behavior has changed in a predetermined period before and after the event occurrence time. The information analysis unit 12B generates the database Y2 in which the values of the related process amounts P are arranged in time series in a predetermined period before and after the occurrence time of the event information X acquired from the information collection unit 11B according to the correspondence shown in FIG. To accumulate.
情報提示部13Bは、分析結果Zの提示と同様に、情報分析部20Bにより蓄積されたイベント情報Xと関連プロセス量Pの挙動とを対応させたデータベースY2を分析結果Z2として利用者に提示する。なお、情報提示部13Bのその他の機能は、第1実施形態の情報提示部13と同様であるため、説明を省略する。
Similar to the presentation of the analysis result Z, the information presentation unit 13B presents the user as the analysis result Z2 a database Y2 in which the event information X accumulated by the information analysis unit 20B corresponds to the behavior of the related process amount P. . The other functions of the information presentation unit 13B are the same as those of the information presentation unit 13 of the first embodiment, and thus the description thereof is omitted.
図14は、イベント情報Xと関連プロセス量Pの挙動との分析結果Z2の一例を示す説明図である。図14に示す例は、装置20において所定のイベントが発生したタイミングの前後の所定期間における関連プロセス量Pの挙動を示す線グラフである。図14において、横軸は、時刻であり、縦軸は、関連プロセス量Pの値である。これにより、イベント発生前後におけるプロセス量Pの挙動を容易に把握することができる。この結果、利用者がイベントの発生原因をより効率的に分析することが可能となる。すなわち、利用者が装置20の運転状況や異常兆候をより的確かつ細やかに評価し、不要な運転操作、調整不良箇所等をさらに効率的に発見することができる。なお、分析結果Z2は、線グラフに限られず、プロセス量Pの値を時系列に並べた表や、他の形式のグラフであってもよい。
FIG. 14 is an explanatory drawing showing an example of the analysis result Z2 of the event information X and the behavior of the related process amount P. As shown in FIG. The example shown in FIG. 14 is a line graph showing the behavior of the related process amount P in a predetermined period before and after the timing at which a predetermined event occurs in the device 20. In FIG. 14, the horizontal axis is time, and the vertical axis is the value of the related process amount P. Thereby, the behavior of the process amount P before and after the occurrence of the event can be easily grasped. As a result, the user can analyze the cause of the event more efficiently. That is, the user can more accurately and finely evaluate the operating condition and the abnormality indication of the device 20, and can more efficiently discover unnecessary driving operation, a poorly adjusted position, and the like. The analysis result Z2 is not limited to a line graph, and may be a table in which the values of the process amount P are arranged in time series, or a graph of another format.
[第3実施形態]
次に、第3実施形態にかかる運転情報分析装置10Cについて説明する。図15は、運転情報分析装置10Cを示すブロック図である。運転情報分析装置10Cは、第2実施形態の運転情報分析装置10Bの情報分析部12Bに代えて、情報分析部12Cを備える。なお、運転情報分析装置10Cのその他の構成は、運転情報分析装置10Bと同様であるため、説明を省略する。また、情報分析部12Cの機能は、以下に説明するものを除き、第2実施形態の情報分析部12Bと同様であるため、重複する機能についての説明は、省略する。 Third Embodiment
Next, a drivinginformation analysis apparatus 10C according to the third embodiment will be described. FIG. 15 is a block diagram showing the driving information analysis apparatus 10C. The driving information analysis device 10C includes an information analysis unit 12C in place of the information analysis unit 12B of the driving information analysis device 10B of the second embodiment. The other configuration of the driving information analysis device 10C is the same as that of the driving information analysis device 10B, and thus the description thereof is omitted. Further, the function of the information analysis unit 12C is the same as that of the information analysis unit 12B of the second embodiment except for those described below, and therefore the description of the overlapping functions is omitted.
次に、第3実施形態にかかる運転情報分析装置10Cについて説明する。図15は、運転情報分析装置10Cを示すブロック図である。運転情報分析装置10Cは、第2実施形態の運転情報分析装置10Bの情報分析部12Bに代えて、情報分析部12Cを備える。なお、運転情報分析装置10Cのその他の構成は、運転情報分析装置10Bと同様であるため、説明を省略する。また、情報分析部12Cの機能は、以下に説明するものを除き、第2実施形態の情報分析部12Bと同様であるため、重複する機能についての説明は、省略する。 Third Embodiment
Next, a driving
情報分析部12Cは、機器21の更新または修繕(オーバーホール)が行われたときに、当該更新または修繕が行われた機器21と関連する指標値のデータベースYの蓄積を一旦停止し、新たに指標値のデータベースYを生成して蓄積する。また、情報分析部12Cは、機器21の更新または修繕が行われたときに、当該更新または修繕が行われた機器21と関連する、イベント情報Xと関連プロセス量Pの挙動とを対応させたデータベースY2の蓄積を一旦停止し、新たに当該データベースY2を生成して蓄積する。
When updating or repairing (overhauling) of the device 21 is performed, the information analysis unit 12C temporarily stops accumulation of the database Y of index values associated with the device 21 for which the updating or repairing has been performed, and newly adds an indicator. Create and store a database Y of values. In addition, when the device 21 is updated or repaired, the information analysis unit 12C associates the event information X and the behavior of the related process amount P related to the device 21 for which the update or repair has been performed. The accumulation of the database Y2 is temporarily stopped, and the database Y2 is newly generated and accumulated.
本実施形態において、更新または修繕が行われた機器21と関連する指標値のデータベースY、並びに、更新または修繕が行われた機器21と関連するイベント情報Xと関連プロセス量Pの挙動とを対応させたデータベースY2は、利用者が予め設定して情報分析部12Cに記憶させておく。ただし、更新または修繕が行われた機器21と関連する指標値のデータベースY、並びに、更新または修繕が行われた機器21と関連する上記データベースY2は、予め設定されるものでなく、情報分析部12Cにおいて随時生成されるものであってもよい。この場合、情報分析部12Cは、機器21の更新または修繕が行われた前後において値が突発的に変化している指標値のデータベースY、イベント情報Xと関連プロセス量Pの挙動とを対応させたデータベースY2を、当該更新または修繕が行われた機器21と関連するデータベースY、データベースY2とすればよい。
In the present embodiment, database Y of index values associated with updated or repaired device 21 and event information X associated with updated or repaired device 21 are associated with the behavior of associated process amount P. The user sets in advance the stored database Y2 and stores it in the information analysis unit 12C. However, the database Y of index values associated with the updated or repaired device 21 and the database Y2 associated with the updated or repaired device 21 are not preset and the information analysis unit It may be generated at any time in 12C. In this case, the information analysis unit 12C associates the event value X with the behavior of the related process amount P with the database Y of index values whose values suddenly change before and after the device 21 is updated or repaired. The database Y2 may be the database Y and the database Y2 associated with the device 21 in which the update or repair has been performed.
これにより、機器21の更新または修繕が行われるごとに、様々な態様で当該指標値のデータベースYを分析結果Zとして、イベント情報Xと関連プロセス量Pの挙動とを対応させたデータベースY2を分析結果Z2として利用者にわかりやすく提示することができる。この結果、利用者が装置20の運転状況や異常兆候を評価し、不要な運転操作、調整不良箇所等を短時間で効率的に発見することができるため、装置20の運用改善の検討や装置20の運用者への改善提案をより行いやすくすることが可能となる。
Thereby, whenever the update or repair of the apparatus 21 is performed, the database Y2 of the event information X and the behavior of the related process amount P are analyzed by using the database Y of the index value as the analysis result Z in various modes. It can be presented to the user in an easy-to-understand manner as the result Z2. As a result, the user can evaluate the operating condition and abnormality indication of the device 20, and can efficiently find unnecessary driving operations, adjustment defects and the like in a short time. It is possible to make it easier to make improvement proposals to 20 operators.
また、機器21の更新または修繕が行われる前後で、指標値の変化を対比することができる。従って、機器21の更新または修繕によって、装置20の運転状況にどのような影響を与えたかという効果の対比を容易に行い、機器21の更新または修繕の前後における優劣を容易に評価することが可能となる。また、機器21の更新または修繕が行われる前後で、イベントが発生した際の関連プロセス量Pの挙動の変化を対比することができる。従って、イベントの発生原因をさらに効率的に分析することが可能となる。なお、機器21の更新または修繕が行われる前後で、イベントの発生頻度を例えば図10に示すような円グラフで対比させて示す等すれば、機器21の更新または修繕が行われた前後の装置20の運転状況の変化を利用者によりわかりやすく提示することができる。
Moreover, before and after the update or repair of the device 21 is performed, the change of the index value can be compared. Therefore, it is possible to easily compare the effects of what has affected the operating condition of the apparatus 20 by updating or repairing the device 21, and to easily evaluate superiority and inferiority before and after the updating or repair of the device 21. It becomes. In addition, before and after the device 21 is updated or repaired, it is possible to compare the change in behavior of the related process amount P when an event occurs. Therefore, it is possible to analyze the cause of the event more efficiently. In addition, if the occurrence frequency of an event is compared and shown by a pie chart as shown in FIG. 10, for example, before and after updating or repair of the device 21, devices before and after the updating or repair of the device 21 are performed. It is possible to present the change of the 20 driving situations more easily to the user.
なお、情報分析部12Cは、機器21の更新または修繕(オーバーホール)が行われたときに、当該更新または修繕が行われた機器21と関連する指標値のデータベースYの蓄積のみを一旦停止し、新たに指標値のデータベースYのみを生成して蓄積するものとしてもよい。この場合、情報収集部11Bは、装置20のプロセス量Pを収集する機能を有さなくてもよく、情報分析部12Cは、イベント情報Xと関連プロセス量Pの挙動とを対応させたデータベースY2を生成して蓄積するものでなくてもよい。
In addition, when the update or repair (overhaul) of the device 21 is performed, the information analysis unit 12C temporarily stops only accumulation of the database Y of index values associated with the device 21 for which the update or repair has been performed, Only the database Y of index values may be newly generated and accumulated. In this case, the information collection unit 11B may not have the function of collecting the process amount P of the apparatus 20, and the information analysis unit 12C may be a database Y2 in which the event information X is associated with the behavior of the related process amount P. It does not have to generate and store.
また、情報分析部12Cは、機器21の更新または修繕(オーバーホール)が行われたときに、当該更新または修繕が行われた機器21と関連する、イベント情報Xと関連プロセス量Pの挙動とを対応させたデータベースY2の蓄積のみを一旦停止し、新たに当該データベースY2のみを生成して蓄積するものとしてもよい。
In addition, when the device 21 is updated or repaired (overhauled), the information analysis unit 12C performs the event information X and the behavior of the related process amount P related to the device 21 on which the update or repair is performed. Only the accumulation of the corresponding database Y2 may be temporarily stopped, and only the database Y2 may be newly generated and accumulated.
10,10B,10C 運転情報分析装置
11,11B 情報収集部
12,12B,12C 情報分析部
13,13B 情報提示部
20 装置
21 機器
21g 発電機
22 制御装置
P プロセス量
X イベント情報
Y,Y2 データベース
Z,Z2 分析結果 10, 10B, 10C Operationinformation analysis device 11, 11B Information collection unit 12, 12B, 12C Information analysis unit 13, 13B Information presentation unit 20 Device 21 Equipment 21g Generator 22 Control device P Process amount X Event information Y, Y2 Database Z , Z2 analysis results
11,11B 情報収集部
12,12B,12C 情報分析部
13,13B 情報提示部
20 装置
21 機器
21g 発電機
22 制御装置
P プロセス量
X イベント情報
Y,Y2 データベース
Z,Z2 分析結果 10, 10B, 10C Operation
Claims (9)
- 複数の機器を含む装置の運転中に発生したイベント情報を収集する情報収集部と、
収集された前記イベント情報を整理して前記装置の運転状況の評価に用いる指標値を生成して蓄積する情報分析部と、
前記情報分析部に蓄積された前記指標値を利用者に提示する情報提示部と、
を備え、
前記情報分析部は、前記装置の運転状態の変化に基づいて区切られる期間ごとに前記指標値を生成することを特徴とする運転情報分析装置。 An information collection unit that collects event information generated during operation of a device including a plurality of devices;
An information analysis unit that arranges the collected event information and generates and accumulates an index value used to evaluate the operating condition of the device;
An information presentation unit for presenting the index value accumulated in the information analysis unit to a user;
Equipped with
The operation information analysis apparatus, wherein the information analysis unit generates the index value for each divided period based on a change in the operation state of the apparatus. - 前記運転状態の変化は、前記機器のいずれかの負荷の変化であることを特徴とする請求項1に記載の運転情報分析装置。 The operation information analysis apparatus according to claim 1, wherein the change in the operation state is a change in a load of any one of the devices.
- 前記運転状態の変化は、前記機器のいずれかに使用される燃料の種類の変化であることを特徴とする請求項1または請求項2に記載の運転情報分析装置。 The operation information analysis device according to claim 1 or 2, wherein the change of the operation state is a change of a type of fuel used for any of the devices.
- 前記イベント情報は、前記装置の警報に関する情報、前記機器の操作に関する情報、前記機器の運転状態に関する情報、及び前記運転情報分析装置の警報に関する情報を含み、
前記情報分析部は、前記イベント情報の種類別に分類して前記指標値を生成して蓄積し、
前記情報提示部は、前記イベント情報の種類別に分類された前記指標値を前記利用者に提示することを特徴とする請求項1から請求項3のいずれか一項に記載の運転情報分析装置。 The event information includes information on an alarm of the device, information on an operation of the device, information on an operating state of the device, and information on an alarm of the driving information analysis device.
The information analysis unit classifies the event information by type and generates and accumulates the index value.
The driving information analysis apparatus according to any one of claims 1 to 3, wherein the information presentation unit presents the index value classified according to the type of the event information to the user. - 前記情報分析部は、前記機器の種類別に分類して前記指標値を生成して蓄積し、
前記情報提示部は、前記機器の種類別に分類された前記指標値を前記利用者に提示することを特徴とする請求項1から請求項4のいずれか一項に記載の運転情報分析装置。 The information analysis unit classifies the information according to the type of the device and generates and accumulates the index value.
The driving information analysis device according to any one of claims 1 to 4, wherein the information presenting unit presents the index value classified according to the type of the device to the user. - 前記情報提示部は、前記利用者によって任意に区切られた期間ごとに前記指標値を提示することを特徴とする請求項1から請求項5のいずれか一項に記載の運転情報分析装置。 The driving information analysis device according to any one of claims 1 to 5, wherein the information presenting unit presents the index value for each period divided arbitrarily by the user.
- 前記情報収集部は、前記装置のプロセス量を収集し、
前記情報分析部は、前記イベント情報と、前記イベント情報に関連する前記プロセス量の挙動とを対応させたデータを生成して蓄積し、
前記情報提示部は、前記情報分析部に蓄積された前記データを前記利用者に提示することを特徴とする請求項1から請求項6のいずれか一項に記載の運転情報分析装置。 The information collecting unit collects a process amount of the device;
The information analysis unit generates and accumulates data in which the event information and the behavior of the process amount related to the event information are associated with each other.
The said information presentation part presents the said data accumulate | stored in the said information analysis part to the said user, The driving | running information analysis apparatus as described in any one of the Claims 1-6 characterized by the above-mentioned. - 前記情報分析部は、前記機器の更新または修繕が行われたときに、更新または修繕が行われた前記機器と関連する指標値の蓄積を一旦停止し、新たに指標値を生成して蓄積することを特徴とする請求項1から請求項7のいずれか一項に記載の運転情報分析装置。 The information analysis unit temporarily stops accumulation of index values associated with the updated or repaired device when the device is updated or repaired, and newly generates and accumulates an index value. The driving information analyzer according to any one of claims 1 to 7, characterized in that:
- 前記情報分析部は、前記機器の更新または修繕が行われたときに、更新または修繕が行われた前記機器と関連する前記データの蓄積を一旦停止し、新たに前記データを生成して蓄積することを特徴とする請求項7に記載の運転情報分析装置。 The information analysis unit temporarily suspends storage of the data related to the updated or repaired device when the device is updated or repaired, and newly generates and accumulates the data. The driving information analysis device according to claim 7, characterized in that.
Priority Applications (6)
| Application Number | Priority Date | Filing Date | Title |
|---|---|---|---|
| CN201680086160.XA CN109313437B (en) | 2016-07-27 | 2016-12-16 | Operation information analysis device |
| KR1020187034674A KR102008642B1 (en) | 2016-07-27 | 2016-12-16 | Driving information analysis device |
| US16/306,193 US10775779B2 (en) | 2016-07-27 | 2016-12-16 | Operation information analyzer |
| EP16910606.9A EP3451098B1 (en) | 2016-07-27 | 2016-12-16 | Driving information analysis device |
| ES16910606T ES2857502T3 (en) | 2016-07-27 | 2016-12-16 | Driving information analysis device |
| PH12018502503A PH12018502503B1 (en) | 2016-07-27 | 2018-11-27 | Operation information analyzer |
Applications Claiming Priority (2)
| Application Number | Priority Date | Filing Date | Title |
|---|---|---|---|
| JP2016-146926 | 2016-07-27 | ||
| JP2016146926A JP6382892B2 (en) | 2016-07-27 | 2016-07-27 | Driving information analyzer |
Publications (1)
| Publication Number | Publication Date |
|---|---|
| WO2018020703A1 true WO2018020703A1 (en) | 2018-02-01 |
Family
ID=61015945
Family Applications (1)
| Application Number | Title | Priority Date | Filing Date |
|---|---|---|---|
| PCT/JP2016/087503 WO2018020703A1 (en) | 2016-07-27 | 2016-12-16 | Driving information analysis device |
Country Status (9)
| Country | Link |
|---|---|
| US (1) | US10775779B2 (en) |
| EP (1) | EP3451098B1 (en) |
| JP (1) | JP6382892B2 (en) |
| KR (1) | KR102008642B1 (en) |
| CN (1) | CN109313437B (en) |
| ES (1) | ES2857502T3 (en) |
| PH (1) | PH12018502503B1 (en) |
| TW (1) | TWI653530B (en) |
| WO (1) | WO2018020703A1 (en) |
Families Citing this family (5)
| Publication number | Priority date | Publication date | Assignee | Title |
|---|---|---|---|---|
| CN108931967A (en) * | 2017-05-22 | 2018-12-04 | 大隈株式会社 | Running monitor device and its control program |
| JP7011486B2 (en) * | 2018-02-16 | 2022-01-26 | 三菱重工パワー環境ソリューション株式会社 | Plant equipment monitoring and control system and plant equipment monitoring and control method |
| JP7074542B2 (en) | 2018-04-06 | 2022-05-24 | ファナック株式会社 | Diagnostic service system and diagnostic method using network |
| WO2020189210A1 (en) * | 2019-03-19 | 2020-09-24 | 日本電気株式会社 | Monitoring method, monitoring device, and program |
| JP2021174352A (en) * | 2020-04-28 | 2021-11-01 | 株式会社日立製作所 | Plant control support device, program and plant control support method |
Citations (5)
| Publication number | Priority date | Publication date | Assignee | Title |
|---|---|---|---|---|
| JPH0836682A (en) * | 1994-07-25 | 1996-02-06 | Hitachi Ltd | Device and method for monitoring plant |
| JPH10124221A (en) * | 1996-10-24 | 1998-05-15 | Toshiba Corp | Plant monitor device |
| JPH11161318A (en) * | 1997-11-27 | 1999-06-18 | Sanyo Electric Co Ltd | Operation state managing device for equipment |
| JP2011243118A (en) * | 2010-05-20 | 2011-12-01 | Hitachi Ltd | Monitoring diagnosis device and monitoring diagnosis method |
| JP2012008782A (en) * | 2010-06-24 | 2012-01-12 | Mitsubishi Heavy Ind Ltd | Method for diagnosing function of plant, and plant monitoring device |
Family Cites Families (18)
| Publication number | Priority date | Publication date | Assignee | Title |
|---|---|---|---|---|
| JPH05135185A (en) * | 1991-01-23 | 1993-06-01 | Toshiba Corp | Plant data display device |
| US7092914B1 (en) * | 1997-11-06 | 2006-08-15 | Intertrust Technologies Corporation | Methods for matching, selecting, narrowcasting, and/or classifying based on rights management and/or other information |
| JP2001045641A (en) | 1999-07-29 | 2001-02-16 | Toyota Motor Corp | Wiring structure of wire harness |
| JPWO2002057860A1 (en) | 2001-01-22 | 2004-05-27 | 東京エレクトロン株式会社 | Device productivity improvement system and method |
| JP2003271238A (en) | 2002-03-18 | 2003-09-26 | Toshiba Corp | Remote maintenance method and system thereof |
| JP2003271233A (en) * | 2002-03-19 | 2003-09-26 | Hitachi Ltd | Power supply facility and management method therefor |
| US20040073468A1 (en) | 2002-10-10 | 2004-04-15 | Caterpillar Inc. | System and method of managing a fleet of machines |
| US7110918B2 (en) | 2003-11-05 | 2006-09-19 | Shoplogix Inc. | Self-contained system and method for remotely monitoring machines |
| JP2010049532A (en) * | 2008-08-22 | 2010-03-04 | Toshiba Corp | Operation monitoring support apparatus |
| JP5204075B2 (en) | 2009-10-08 | 2013-06-05 | 横河電機株式会社 | Driving condition analysis method and driving condition analysis system |
| US10089582B2 (en) * | 2013-01-02 | 2018-10-02 | Qualcomm Incorporated | Using normalized confidence values for classifying mobile device behaviors |
| US9158604B1 (en) * | 2014-05-13 | 2015-10-13 | Qualcomm Incorporated | Lightweight data-flow tracker for realtime behavioral analysis using control flow |
| US20160078362A1 (en) * | 2014-09-15 | 2016-03-17 | Qualcomm Incorporated | Methods and Systems of Dynamically Determining Feature Sets for the Efficient Classification of Mobile Device Behaviors |
| US9703962B2 (en) * | 2014-10-09 | 2017-07-11 | Qualcomm Incorporated | Methods and systems for behavioral analysis of mobile device behaviors based on user persona information |
| US9519533B2 (en) * | 2015-01-28 | 2016-12-13 | Qualcomm Incorporated | Data flow tracking via memory monitoring |
| US10104107B2 (en) * | 2015-05-11 | 2018-10-16 | Qualcomm Incorporated | Methods and systems for behavior-specific actuation for real-time whitelisting |
| US20170046510A1 (en) * | 2015-08-14 | 2017-02-16 | Qualcomm Incorporated | Methods and Systems of Building Classifier Models in Computing Devices |
| CN108931967A (en) * | 2017-05-22 | 2018-12-04 | 大隈株式会社 | Running monitor device and its control program |
-
2016
- 2016-07-27 JP JP2016146926A patent/JP6382892B2/en active Active
- 2016-12-16 US US16/306,193 patent/US10775779B2/en active Active
- 2016-12-16 ES ES16910606T patent/ES2857502T3/en active Active
- 2016-12-16 EP EP16910606.9A patent/EP3451098B1/en active Active
- 2016-12-16 CN CN201680086160.XA patent/CN109313437B/en active Active
- 2016-12-16 WO PCT/JP2016/087503 patent/WO2018020703A1/en unknown
- 2016-12-16 KR KR1020187034674A patent/KR102008642B1/en active IP Right Grant
-
2017
- 2017-01-25 TW TW106102990A patent/TWI653530B/en active
-
2018
- 2018-11-27 PH PH12018502503A patent/PH12018502503B1/en unknown
Patent Citations (5)
| Publication number | Priority date | Publication date | Assignee | Title |
|---|---|---|---|---|
| JPH0836682A (en) * | 1994-07-25 | 1996-02-06 | Hitachi Ltd | Device and method for monitoring plant |
| JPH10124221A (en) * | 1996-10-24 | 1998-05-15 | Toshiba Corp | Plant monitor device |
| JPH11161318A (en) * | 1997-11-27 | 1999-06-18 | Sanyo Electric Co Ltd | Operation state managing device for equipment |
| JP2011243118A (en) * | 2010-05-20 | 2011-12-01 | Hitachi Ltd | Monitoring diagnosis device and monitoring diagnosis method |
| JP2012008782A (en) * | 2010-06-24 | 2012-01-12 | Mitsubishi Heavy Ind Ltd | Method for diagnosing function of plant, and plant monitoring device |
Also Published As
| Publication number | Publication date |
|---|---|
| JP6382892B2 (en) | 2018-08-29 |
| CN109313437B (en) | 2020-01-31 |
| CN109313437A (en) | 2019-02-05 |
| PH12018502503A1 (en) | 2019-07-15 |
| TWI653530B (en) | 2019-03-11 |
| EP3451098B1 (en) | 2021-03-03 |
| EP3451098A4 (en) | 2019-06-26 |
| JP2018018233A (en) | 2018-02-01 |
| ES2857502T3 (en) | 2021-09-29 |
| US10775779B2 (en) | 2020-09-15 |
| TW201804326A (en) | 2018-02-01 |
| EP3451098A1 (en) | 2019-03-06 |
| KR102008642B1 (en) | 2019-08-07 |
| KR20180133928A (en) | 2018-12-17 |
| PH12018502503B1 (en) | 2019-07-15 |
| US20190339680A1 (en) | 2019-11-07 |
Similar Documents
| Publication | Publication Date | Title |
|---|---|---|
| WO2018020703A1 (en) | Driving information analysis device | |
| CN104254810B (en) | Method and system for the condition monitoring of one group of factory | |
| US7966150B2 (en) | Data analysis applications | |
| WO2015159577A1 (en) | State monitoring device | |
| US20170261403A1 (en) | Abnormality detection procedure development apparatus and abnormality detection procedure development method | |
| WO1999005684A1 (en) | Dynamic maintenance management system | |
| JP2018120456A (en) | Alarm display system and alarm display method | |
| US10572493B2 (en) | Computerized process safety management system | |
| EP4064144A1 (en) | Methods for identifying key performance indicators | |
| Toirov et al. | Algorithm and Software Implementation of the Diagnostic System for the Technical Condition of Powerful Units | |
| US20120232806A1 (en) | System and method for analyzing and retrieving data obtained from turbine operations | |
| WO2017216830A1 (en) | Data analysis system | |
| JP2004118693A (en) | Failure diagnosing system for control system of plant and failure diagnosing method | |
| JP4607702B2 (en) | Plant operation support apparatus and plant operation support method | |
| EP3819729B1 (en) | Human machine interface generation for industrial monitoring | |
| JP2010044780A (en) | Method and system for analyzing operating condition | |
| JP2004317273A (en) | Safety regulation information providing system for nuclear installation | |
| JP7309548B2 (en) | Abnormal sign detection device, method and program | |
| Sisk et al. | Automated diagnostics software requirements specification, Version 1.1 | |
| Vicente et al. | More about operator monitoring under normal operations: The role of workload regulation and the impact of control room technology | |
| Abd Rahman Sabri et al. | TB11: PETRONAS Rotating Equipment Analytics (PROTEAN): Disrupting and Challenging the Status Quo of Digital Remote Monitoring Solutions | |
| JPH05216935A (en) | Document retrieving system | |
| JP2023113019A (en) | Information processing device | |
| JP2006099298A (en) | Fault diagnosis method for device | |
| CN112805637A (en) | Design, configuration and maintenance of drive equipment |
Legal Events
| Date | Code | Title | Description |
|---|---|---|---|
| 121 | Ep: the epo has been informed by wipo that ep was designated in this application |
Ref document number: 16910606 Country of ref document: EP Kind code of ref document: A1 |
|
| ENP | Entry into the national phase |
Ref document number: 20187034674 Country of ref document: KR Kind code of ref document: A |
|
| ENP | Entry into the national phase |
Ref document number: 2016910606 Country of ref document: EP Effective date: 20181130 |
|
| NENP | Non-entry into the national phase |
Ref country code: DE |