WO2018003011A1 - 分析装置 - Google Patents
分析装置 Download PDFInfo
- Publication number
- WO2018003011A1 WO2018003011A1 PCT/JP2016/069124 JP2016069124W WO2018003011A1 WO 2018003011 A1 WO2018003011 A1 WO 2018003011A1 JP 2016069124 W JP2016069124 W JP 2016069124W WO 2018003011 A1 WO2018003011 A1 WO 2018003011A1
- Authority
- WO
- WIPO (PCT)
- Prior art keywords
- mass
- analysis
- charge ratio
- unit
- analysis method
- Prior art date
Links
Images


Classifications
-
- G—PHYSICS
- G01—MEASURING; TESTING
- G01N—INVESTIGATING OR ANALYSING MATERIALS BY DETERMINING THEIR CHEMICAL OR PHYSICAL PROPERTIES
- G01N30/00—Investigating or analysing materials by separation into components using adsorption, absorption or similar phenomena or using ion-exchange, e.g. chromatography or field flow fractionation
- G01N30/02—Column chromatography
- G01N30/86—Signal analysis
- G01N30/8624—Detection of slopes or peaks; baseline correction
- G01N30/8641—Baseline
-
- G—PHYSICS
- G01—MEASURING; TESTING
- G01N—INVESTIGATING OR ANALYSING MATERIALS BY DETERMINING THEIR CHEMICAL OR PHYSICAL PROPERTIES
- G01N30/00—Investigating or analysing materials by separation into components using adsorption, absorption or similar phenomena or using ion-exchange, e.g. chromatography or field flow fractionation
- G01N30/02—Column chromatography
- G01N30/86—Signal analysis
- G01N30/8624—Detection of slopes or peaks; baseline correction
- G01N30/8631—Peaks
-
- G—PHYSICS
- G01—MEASURING; TESTING
- G01N—INVESTIGATING OR ANALYSING MATERIALS BY DETERMINING THEIR CHEMICAL OR PHYSICAL PROPERTIES
- G01N30/00—Investigating or analysing materials by separation into components using adsorption, absorption or similar phenomena or using ion-exchange, e.g. chromatography or field flow fractionation
- G01N30/02—Column chromatography
- G01N30/62—Detectors specially adapted therefor
- G01N30/72—Mass spectrometers
-
- G—PHYSICS
- G01—MEASURING; TESTING
- G01N—INVESTIGATING OR ANALYSING MATERIALS BY DETERMINING THEIR CHEMICAL OR PHYSICAL PROPERTIES
- G01N30/00—Investigating or analysing materials by separation into components using adsorption, absorption or similar phenomena or using ion-exchange, e.g. chromatography or field flow fractionation
- G01N30/02—Column chromatography
- G01N30/86—Signal analysis
- G01N30/8675—Evaluation, i.e. decoding of the signal into analytical information
- G01N30/8679—Target compound analysis, i.e. whereby a limited number of peaks is analysed
-
- G—PHYSICS
- G01—MEASURING; TESTING
- G01N—INVESTIGATING OR ANALYSING MATERIALS BY DETERMINING THEIR CHEMICAL OR PHYSICAL PROPERTIES
- G01N30/00—Investigating or analysing materials by separation into components using adsorption, absorption or similar phenomena or using ion-exchange, e.g. chromatography or field flow fractionation
- G01N30/02—Column chromatography
- G01N30/62—Detectors specially adapted therefor
- G01N2030/621—Detectors specially adapted therefor signal-to-noise ratio
- G01N2030/625—Detectors specially adapted therefor signal-to-noise ratio by measuring reference material, e.g. carrier without sample
-
- G—PHYSICS
- G01—MEASURING; TESTING
- G01N—INVESTIGATING OR ANALYSING MATERIALS BY DETERMINING THEIR CHEMICAL OR PHYSICAL PROPERTIES
- G01N30/00—Investigating or analysing materials by separation into components using adsorption, absorption or similar phenomena or using ion-exchange, e.g. chromatography or field flow fractionation
- G01N30/02—Column chromatography
- G01N30/88—Integrated analysis systems specially adapted therefor, not covered by a single one of the groups G01N30/04 - G01N30/86
- G01N2030/8809—Integrated analysis systems specially adapted therefor, not covered by a single one of the groups G01N30/04 - G01N30/86 analysis specially adapted for the sample
- G01N2030/8872—Integrated analysis systems specially adapted therefor, not covered by a single one of the groups G01N30/04 - G01N30/86 analysis specially adapted for the sample impurities
-
- G—PHYSICS
- G01—MEASURING; TESTING
- G01N—INVESTIGATING OR ANALYSING MATERIALS BY DETERMINING THEIR CHEMICAL OR PHYSICAL PROPERTIES
- G01N30/00—Investigating or analysing materials by separation into components using adsorption, absorption or similar phenomena or using ion-exchange, e.g. chromatography or field flow fractionation
- G01N30/02—Column chromatography
- G01N30/62—Detectors specially adapted therefor
- G01N30/72—Mass spectrometers
- G01N30/7206—Mass spectrometers interfaced to gas chromatograph
-
- G—PHYSICS
- G01—MEASURING; TESTING
- G01N—INVESTIGATING OR ANALYSING MATERIALS BY DETERMINING THEIR CHEMICAL OR PHYSICAL PROPERTIES
- G01N30/00—Investigating or analysing materials by separation into components using adsorption, absorption or similar phenomena or using ion-exchange, e.g. chromatography or field flow fractionation
- G01N30/02—Column chromatography
- G01N30/62—Detectors specially adapted therefor
- G01N30/72—Mass spectrometers
- G01N30/7233—Mass spectrometers interfaced to liquid or supercritical fluid chromatograph
Definitions
- the present invention relates to an analyzer such as a chromatograph mass spectrometer or a spectroscopic analyzer combining a liquid chromatograph (LC) or gas chromatograph (GC) and a mass spectrometer.
- an analyzer such as a chromatograph mass spectrometer or a spectroscopic analyzer combining a liquid chromatograph (LC) or gas chromatograph (GC) and a mass spectrometer.
- a chromatogram total ion chromatogram
- a peak having a signal intensity of a predetermined ratio or more with respect to a signal intensity (peak height) of a known target compound-derived peak is an impurity Detect as a peak.
- Patent Document 1 acquires and stores a chromatogram and a mass spectrum in which background noise appears by performing GC / MS analysis on a blank sample containing only a solvent that does not contain a sample component, An apparatus for removing the influence of background noise by subtracting the chromatogram or mass spectrum in which the background noise appears from the chromatogram or mass spectrum obtained by performing GC / MS analysis is disclosed.
- a gas chromatograph mass spectrometer that combines a gas chromatograph and a mass spectrometer also has the same problem due to impurities contained in the carrier gas.
- an object of the present invention is to provide an analyzer such as a chromatograph mass spectrometer capable of detecting a trace amount of compound that could not be detected conventionally.
- the second object of the present invention is to easily create an analytical method including analytical conditions and the like, which is used when performing an analysis for detecting a trace amount of a compound that could not be detected in the past as described above. It is to provide an analyzer that can.
- the first aspect of the present invention made to solve the above-described problem is that a spectrum over a range of a predetermined value for a predetermined parameter is acquired by executing an analysis according to an analysis method including an analysis condition.
- a background information storage unit for storing parameter values of background signals appearing during analysis; b) When one or a plurality of parameter values or parameter value ranges are set as one of the analysis conditions, the parameter values stored in the background information storage unit are excluded from the parameter values or parameter value ranges.
- an analysis method creation unit for creating an analysis method for analyzing a plurality of parameter values or parameter value ranges, It is characterized by having.
- the parameter is, for example, a mass-to-charge ratio or a wavelength (or wave number).
- the analyzer according to the present invention includes a mass including an inductively coupled plasma mass spectrometer (ICP-MS), a matrix-assisted laser desorption ionization time-of-flight mass spectrometer (MALDI-TOFMS), and the like.
- ICP-MS inductively coupled plasma mass spectrometer
- MALDI-TOFMS matrix-assisted laser desorption ionization time-of-flight mass spectrometer
- the analyzer is a spectroscopic analyzer such as a photodiode array detector (PDA), an ultraviolet-visible spectrophotometer, a Fourier transform infrared spectrophotometer (FTIR), and the spectrum is Absorption spectrum and fluorescence spectrum.
- PDA photodiode array detector
- FTIR Fourier transform infrared spectrophotometer
- the analyzer according to the present invention is a mass spectrometer
- a single-type mass spectrometer that does not cleave ions such as a quadrupole mass spectrometer
- a mass spectrometer capable of such MS / MS analysis may be used.
- the analyzer according to the first aspect of the present invention is a chromatograph mass spectrometer that detects a component temporally separated by a chromatograph using a mass spectrometer
- the background information storage unit stores a mass-to-charge ratio value of a background signal that appears during analysis
- the analysis method creation unit when one or more mass-to-charge ratios or mass-to-charge ratio ranges to be repeatedly analyzed, which is one of the analysis conditions, is set from the mass-to-charge ratio or mass-to-charge ratio range.
- the analysis method can be configured to repeatedly analyze the mass to charge ratio or the mass to charge ratio range excluding the mass to charge ratio stored in the ground information storage unit.
- the background information storage unit stores the mass-to-charge ratio of the background signal that appears during analysis.
- the background signal here is typically derived from the mobile phase used in the liquid chromatograph and various reagents added thereto, and is present almost entirely in the total ion chromatogram. Such background signals may change from user to user or from analysis to analysis. In addition, the background signal may change depending on other conditions such as the flow rate of the mobile phase and the type of column.
- the background information is stored by extracting the parameter value of the background signal, that is, the mass-to-charge ratio, based on the result obtained by performing the blank analysis. It is good to set it as the structure further provided with the background information acquisition part memorize
- a blank analysis is actually performed without injecting the sample into the mobile phase or by injecting a solvent-only sample into the mobile phase, and the background information acquisition unit obtains a background from the obtained mass spectrum, for example. Extract the mass-to-charge ratio of the ground signal. As a result, the mass-to-charge ratio of the background signal appearing under the mobile phase used for the analysis at that time and other conditions can be accurately obtained.
- the analysis method creation unit is stored in the background information storage unit from one or more mass-to-charge ratios or mass-to-charge ratio ranges to be repeatedly analyzed, which is set by the user or automatically as one of the analysis conditions.
- the mass to charge ratio or the mass to charge ratio range excluding the mass to charge ratio is determined. Specifically, for example, in the case where repetition of scan measurement over a predetermined mass-to-charge ratio range is set, one or more mass-to-charge ratios stored in the background information storage unit from the mass-to-charge ratio range In other words, a mass-to-charge ratio range in which the mass-to-charge ratio range is interrupted is obtained.
- the background information storage unit stores the plurality of mass to charge ratios.
- One or more mass-to-charge ratios excluding the stored one or more mass-to-charge ratios are determined.
- ions having the mass-to-charge ratio of the background signal are excluded from the analysis target. Therefore, the background signal does not appear in the total ion chromatogram or mass spectrum obtained by the analysis according to this analytical method, and the mass-to-charge ratio of the background signal is not the same as the mass-to-charge ratio of the ions derived from impurities. For example, on the total ion chromatogram, a peak of a trace component such as an impurity that has been conventionally hidden behind a background signal can be observed.
- the background information storage unit may be a database that stores parameter values of background signals under various conditions.
- the various conditions referred to here are conditions that may change the manner in which the background signal is output as described above.
- the mobile phase and the types of various reagents added thereto are different.
- the flow rate of the mobile phase and the type of column can be included.
- Such a database may be created by the user himself or may be provided by a device manufacturer or the like.
- the second aspect of the present invention which has been made to solve the above-mentioned problems, is to acquire a spectrum over a range of a predetermined value for a predetermined parameter by executing an analysis according to an analysis method including an analysis condition.
- An intensity value determination unit for obtaining a parameter value whose signal intensity value exceeds the threshold; It is characterized by having.
- the “parameter value or parameter value range excluded from the analysis target” is, for example, the background stored in the background information storage unit in the analyzer according to the first aspect.
- the parameter value of the ground signal or a parameter value range having a predetermined width including the parameter value can be used.
- the analyzer according to the second aspect of the present invention is a chromatograph mass spectrometer that detects, by a mass spectrometer, components separated in time by a chromatograph
- the exclusion information setting unit sets a mass-to-charge ratio or mass-to-charge ratio range to be excluded from the analysis target
- the intensity value determination unit excludes the mass-to-charge ratio or the mass-to-charge ratio range set by the exclusion information setting unit on the mass spectrum obtained by analyzing the sample, and the signal intensity at other mass-to-charge ratios. It is possible to determine whether or not the value exceeds a predetermined threshold value, and obtain a mass-to-charge ratio in which the signal intensity value exceeds the threshold value.
- the intensity value determination unit Except for the mass-to-charge ratio or the mass-to-charge ratio range set by the exclusion information setting unit, it is determined whether or not the signal intensity value exceeds a predetermined threshold at other mass-to-charge ratios. In other words, no matter how large a peak exists in the mass-to-charge ratio or any mass-to-charge ratio within the mass-to-charge ratio range set by the exclusion information setting unit, the peak is ignored, and at other mass-to-charge ratios. Only those whose signal intensity values exceed a predetermined threshold are extracted.
- the intensity value determination unit is derived from a significant component other than the background signal, that is, the target compound or impurity.
- the mass-to-charge ratio of ions can be determined.
- an extracted ion chromatogram (usually a mass) at a mass-to-charge ratio obtained by the intensity value determination unit using data obtained by analyzing a sample. It may be configured to further include a chromatogram creation unit that creates a chromatogram). According to this configuration, an extracted ion chromatogram in which a peak derived from a target compound or an impurity in a sample is observed can be automatically created. For example, impurities are quantified based on the peak area value on the chromatogram. It is also possible.
- the analyzer according to the second aspect of the present invention is a chromatograph mass spectrometer that performs analysis according to an analysis method including analysis conditions
- the mass-to-charge ratio obtained by the intensity value determination unit is repeatedly analyzed.
- An analysis method creating unit that creates the analyzed method may be further included.
- the analysis method creation unit creates, for example, an analysis method that executes SIM measurement targeting the mass-to-charge ratio obtained by the intensity value determination unit.
- the mass spectrometer is a mass spectrometer capable of MS / MS analysis
- An analysis method for executing MRM measurement using a ratio as a precursor ion and a product ion as a predetermined mass electrolysis ratio corresponding to the mass-to-charge ratio is created. Thereby, it is possible to automatically create an analysis method for performing analysis with the target compound or impurity in the sample as a target without being affected by the background signal.
- the intensity value determination unit is a mass whose signal intensity value exceeds the threshold value based on a mass spectrum obtained in substantially real time during the analysis of the sample.
- An analysis control unit that obtains a charge ratio and controls each unit so as to execute SIM measurement, product ion scan measurement, or MRM measurement targeting the mass-to-charge ratio when the mass-to-charge ratio is obtained It is good.
- the analyzer of the first aspect of the present invention it can be conventionally detected because of the influence of a mobile phase, a reagent, etc. in a liquid chromatograph, or because of the influence of an impurity in a carrier gas in a gas chromatograph. It is possible to detect a minute amount of impurities and the like that have not been present on the chromatogram. Further, according to the analyzer of the first aspect of the present invention, it is possible to remove the influence of a small amount of impurities when performing the analysis according to the prepared analysis method, so that the background is obtained by data processing after data collection. Unlike the removal of impurities, the presence or absence of impurities can be confirmed in real time during the execution of the analysis. In addition, since an analysis method for performing such an analysis can be automatically created, the burden on the user can be reduced.
- the analyzer of the second aspect of the present invention it can be conventionally detected, for example, due to the influence of a mobile phase or a reagent in a liquid chromatograph or due to the influence of an impurity in a carrier gas in a gas chromatograph.
- the mass-to-charge ratio of ions derived from a trace amount of impurities that were not present can be easily confirmed.
- an analysis method for performing an analysis targeting such impurities can be automatically created.
- the retention time of impurities can be confirmed by detecting a peak on the extracted ion chromatogram in the mass-to-charge ratio of ions derived from impurities.
- the block diagram of the principal part of LC-MS which is 1st Example of this invention Explanatory drawing of the scan measurement in LC-MS of 1st Example.
- the block diagram of the principal part of LC-MS which is 2nd Example of this invention The flowchart which shows the procedure of the impurity confirmation process in LC-MS of 2nd Example.
- FIG. 1 is a configuration diagram of a main part of the LC-MS of the first embodiment.
- the measurement unit 1 includes a liquid chromatograph (LC unit) 11 and a mass spectrometer (MS unit) 12.
- the liquid chromatograph 11 includes a liquid feed pump 112 that sucks and feeds the mobile phase from the mobile phase container 111, an injector 113 that injects a sample into the mobile phase, a column 114 that separates each component in the sample, including.
- the mass spectrometer 12 is a quadrupole mass spectrometer having a quadrupole mass filter as a mass analyzer.
- the detection signal obtained by the measurement unit 1 is converted into digital data by an analog-digital converter (ADC) 2 and input to the control / processing unit 4.
- the control / processing unit 4 to which the input unit 5 and the display unit 6 are connected includes a data storage unit 41, a background information extraction unit 42, a background information storage unit 43, an analysis method creation unit 44, an analysis method storage unit 45, Functional blocks such as the impurity detection unit 46 are included.
- the control / processing unit 4 controls the operation of the measurement unit 1 via the analysis control unit 3.
- Each function of the control / processing unit 4 can be achieved by executing dedicated control / processing software installed in advance in the personal computer on the computer.
- FIGS. 3 is a flowchart of impurity detection control and processing in the LC-MS of this embodiment
- FIG. 2 is an explanatory diagram of scan measurement in the LC-MS of this embodiment
- FIG. 4 is an example of a mass spectrum obtained by blank analysis.
- FIG. 5A is a diagram showing an example of a total ion chromatogram (TIC) from which a background signal is not removed
- FIG. 5B is a diagram showing an example of a TIC from which a background signal is removed. .
- TIC total ion chromatogram
- the user sets analysis conditions including a mass-to-charge ratio range (that is, a lower limit value M min and an upper limit value M max ) of scan measurement performed in the mass spectrometer 12 from the input unit 5 (step S1).
- the set analysis conditions are temporarily stored in the analysis method storage unit 45.
- the analysis control unit 3 that has received an instruction from the control / processing unit 4 performs blank measurement by controlling the measurement unit 1 according to the previously stored analysis conditions (step S2). In the blank measurement, a sample is not injected into the mobile phase in the liquid chromatograph 11 or a sample containing only a solvent is injected into the mobile phase.
- the mass spectrometer 12 repeatedly performs scan measurement in the mass to charge ratio range of M min to M max .
- FIG. 2 (a) schematically shows the voltage applied to the quadrupole mass filter of the mass spectrometer 12 at this time.
- the mass spectrum obtained by the scan measurement mainly reflects the component in the mobile phase. That is, the data constituting the mass spectrum of the background signal due to the components in the mobile phase is stored in the data storage unit 41 (step S3).
- the background information extraction unit 42 extracts a peak having an intensity value equal to or greater than a predetermined threshold in the mass spectrum of the background signal, and obtains the mass-to-charge ratio of the peak as the mass-to-charge ratio M BG of the background signal (Ste S4). For example, when the mass spectrum of the background signal shown in FIG. 4 is obtained, m / z 279 and 391 corresponding to two peaks whose intensity values are equal to or greater than the threshold are extracted as the mass-to-charge ratio M BG of the background signal. .
- the analysis method creation unit 44 obtains a mass-to-charge ratio range excluding the background-charged mass-to-charge ratio M BG from the previously set scan-to-charge mass-to-charge ratio range M min to M max and scans this.
- An analysis method to be measured is created (step S5).
- M min ⁇ M max: m / z is 250 ⁇ 500
- m / z250 ⁇ 278 Three mass-to-charge ratio ranges of 280 to 390 and 392 to 500 are scan measurement targets.
- the mass-to-charge ratio width ( ⁇ 1 in the above example) to be excluded may be appropriately changed with respect to a certain mass-to-charge ratio value.
- the analysis method in which the mass-to-charge ratio range to be scanned is changed is stored in the analysis method storage unit 45.
- the analysis control unit 3 controls the measurement unit 1 to execute LC / MS analysis on the target sample according to the analysis method created in step S5 (step S6).
- various components are temporally separated in the column 114 and introduced into the mass spectrometer 12, but the components that cause the background signal (for example, components in the mobile phase) are also introduced into the mass spectrometer 12. Is done.
- the mass-to-charge ratio of ions derived from the component that caused the background signal is excluded from the scan measurement target, the intensity of ions derived from this component is not reflected in the collected data.
- Step S7 Data obtained by LC / MS analysis on the target sample is stored in the data storage unit 41. Then, after the analysis is completed, the impurity detection unit 46 creates a TIC based on the data stored in the data storage unit 41, sets the peak having the maximum signal intensity on the TIC as the main peak, and sets the signal intensity of the main peak to the peak. On the other hand, a threshold of a predetermined ratio is set, and a peak having a signal intensity equal to or higher than the threshold is detected as an impurity peak (step S7). As described above, since the main background signal derived from the mobile phase or the like is not reflected in the data which is the analysis result, the rise of the baseline due to the background signal is eliminated in the TIC as shown in FIG. . As a result, a minute impurity peak that has been hidden behind the base line can be detected.
- step S8 If no peak is detected on the TIC (No in step S8), the impurity detector 46 determines that there is no impurity (step S9). On the other hand, when a peak is detected on the TIC (Yes in step S8), a spectrum peak having a signal intensity equal to or greater than a predetermined threshold is detected on the mass spectrum obtained near the peak retention time (step S8). S10). Then, the mass-to-charge ratio of the spectrum peak is obtained, and this is recorded or displayed as the mass-to-charge ratio of the impurity (step S11).
- a series of processing and control is basically automatically performed. However, a part of the processing and control may be manually performed by the user. For example, after the TIC is created in step S7, the TIC is displayed on the screen of the display unit 6, and the subsequent work, that is, the confirmation of the impurity peak on the TIC or the mass spectrum when there is an impurity, is displayed. The confirmation of the mass-to-charge ratio of the impurities may be performed manually by the user. In addition, when the mass-to-charge ratio of the background signal is extracted from the mass spectrum in step S4, the user confirms the mass spectrum displayed on the screen of the display unit 6, and manually calculates the mass-to-charge ratio of the background signal. You may make it select.
- the scan measurement in the predetermined mass-to-charge ratio range was performed in the blank measurement and the LC / MS analysis for the target sample after that, but the scan measurement for scanning the mass-to-charge ratio substantially continuously.
- the mass-to-charge ratio may be changed by a predetermined step width (for example, 1 Da or 2 Da) within a predetermined mass-to-charge ratio range. This can be seen as a combination of a large number of SIM measurements, or it can be seen as an intermittent scan measurement.
- SIM measurement is performed with a mass-to-charge ratio corresponding to the mass of the impurity as a target. You may do it.
- the LC / MS analysis of the target sample was performed after the blank measurement was performed and the mass-to-charge ratio of the background signal was obtained based on the result.
- the background information is acquired during the period from when the sample is injected into the mobile phase at the time of analysis until the first peak appears, and based on the results, the analysis method is changed during the analysis, and data for each component in the sample is obtained. May be obtained.
- background information may be acquired together with acquisition of data for another purpose other than analysis of the target sample.
- the background information may be obtained when obtaining calibration curve data or when analyzing analysis conditions such as a mobile phase, a column, and a gradient.
- background information may be obtained during the optimization work such as the voltage / gas of the apparatus.
- the mass spectrometer 12 when it is a triple quadrupole mass spectrometer, it has a function of automatically optimizing collision-induced dissociation energy and the like, and background information is acquired in such a function. You may make it include a function. Moreover, you may make it acquire background information at the time of the validation work of a measurement method. Furthermore, in the case of a mass spectrometer using a MALDI ion source, background information may be obtained when examining the matrix effect.
- the mass-to-charge ratio of the background signal under various conditions is obtained in advance and stored in the background information storage unit 43, and the analysis is performed when analyzing the target sample.
- the analysis method may be created by reading out the mass-to-charge ratio of the background signal under the condition corresponding to or closest to the above condition from the storage unit 43.
- the various conditions may include the type of mobile phase used, the type and concentration of various reagents added to the mobile phase, the flow rate of the mobile phase, the type of column used, and the like.
- This is a kind of database that correlates various analysis conditions with the mass-to-charge ratio of the background signal. By using such a database, it is possible to sufficiently back up without performing blank measurement for each analysis of the target sample. A TIC from which the ground signal is removed can be obtained.
- background information under various conditions other than the LC separation conditions as described above can be stored in advance and used.
- pretreatment method such as solid phase extraction (reverse phase, normal phase) or liquid phase extraction
- sample storage container vial, vial cap, mobile phase bottle, column
- sample storage container vial, vial cap, mobile phase bottle, column
- background information for each sample type for example, XX for spinach, ⁇ for tomatoes, XX for mice), ionization methods in mass spectrometers (for example, XX for ESI methods, ⁇ for APCI methods, etc.) May be stored.
- background information may be stored.
- Background information may be stored according to “sample to be compared”.
- background information may be stored for each matrix (substances other than the sample, coexisting substances) (for example, in the case of a biological sample, the matrix is plasma, urine, etc.). Further, such background information may be included in a method package provided in advance from the apparatus manufacturer to the user.
- LC / MS analysis was performed on the target sample in accordance with the created analysis method, and a TIC or the like was created.
- the background information is excluded. You may make it produce and display a mass spectrometry imaging image from the data acquired based on it.
- FIG. 6 is a configuration diagram of a main part of the LC-MS of the second embodiment, and the same components as those of the LC-MS of the first embodiment shown in FIG.
- the measurement unit 1, ADC 2, and analysis control unit 3 are the same as those of the LC-MS of the first embodiment.
- the control / processing unit 4 includes a data storage unit 41, a background information extraction unit 42, a background information storage unit 43 similar to the LC-MS of the first embodiment, a significant peak detection unit 401, an automatic SIM measurement control unit. 402, functional blocks such as an EIC creation unit 403 and an analysis method creation unit 404 are included.
- FIG. 8 is a flowchart of impurity detection control / processing in the LC-MS of this embodiment
- FIG. 7 is an explanatory diagram of a significant peak detection operation in the LC-MS of this embodiment.
- steps S21 to S24 is the same as that of steps S1 to S4 in FIG. 3, and the background information storage unit 43 stores the mass-to-charge ratio M BG of the background signal.
- the analysis control unit 3 controls the measurement unit 1 so as to execute LC / MS analysis on the target sample and starts measurement (step S25).
- the mass spectrometer 12 performs scan measurement over a predetermined mass-to-charge ratio range Mmin to Mmax.
- the significant peak detector 401 creates a mass spectrum in real time based on the obtained data, and detects a significant peak on the mass spectrum.
- the peak of the mass-to-charge ratio M BG of the background signal stored in the background information storage unit 43 is ignored regardless of the intensity, and the peak whose intensity is greater than or equal to the threshold is significant at other mass-to-charge ratios. It is determined that the peak is a large peak (step S26).
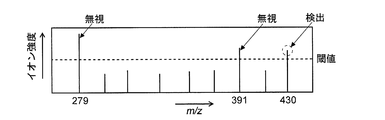
- M BG m / z 279 and m / z 391 and a mass spectrum as shown in FIG. 7 is obtained, the peaks of m / z 279 and m / z 391 are ignored and the intensity exceeds the threshold value. Only the peak at m / z 430 is judged as a significant peak.
- the automatic SIM measurement control unit 402 controls the measurement unit 1 to continue the SIM measurement targeting the detected mass-to-charge ratio (step S27).
- the detected peak is a peak derived from an impurity
- the time during which the impurity is introduced into the mass spectrometer 12 is limited. Therefore, the SIM measurement may be performed for a predetermined time from the time when a peak at a certain mass-to-charge ratio is detected as a significant peak, or the SIM measurement and the scan measurement are performed in a very short time division.
- SIM measurement targeting the mass-to-charge ratio may be performed only while the peak in the mass-to-charge ratio is detected as a significant peak. If the measurement end condition is not satisfied, for example, when a predetermined measurement end time is reached, the process returns from step S28 to S26.
- SIM measurement targeting the mass-to-charge ratio of the peak is performed, and the ion intensity at the mass-to-charge ratio is measured.
- Data indicating a time change is stored in the data storage unit 41.
- An ion peak derived from the component that caused the background signal is also observed on the mass spectrum. However, since this peak is not extracted as a significant peak, naturally, the SIM targeting the mass-to-charge ratio of the background signal is targeted. No measurement is performed.
- the EIC creation unit 403 creates an extracted ion chromatogram at a specific mass-to-charge ratio based on the data obtained by the SIM measurement stored in the data storage unit 41, and displays this. Drawing on the screen of the unit 6 (step S29).
- the user checks the displayed extracted ion chromatogram, for example, grasps the retention time of the impurity and grasps the mass-to-charge ratio of the impurity from the target mass-to-charge ratio (step S30).
- the peak derived from the target compound in the sample is also detected as a significant peak, but if it is not necessary to detect this, the target compound is detected when detecting a significant peak.
- the corresponding known mass-to-charge ratio may be set to be ignored. Thereby, only an extracted ion chromatogram in which impurities are observed can be created.
- the flowchart shown in FIG. 8 may be modified as follows. That is, each time a significant peak is detected in step S26, the mass-to-charge ratio of the peak and the time range (holding time) in which the peak is detected are stored. Then, after the measurement is completed, the analysis method creation unit 404 automatically performs an analysis method that performs SIM measurement targeting the mass-to-charge ratio of all detected significant peaks only in the time range corresponding to the peaks. Create it. Using these analytical methods, it is possible to identify (determine whether they are included) or quantify impurities in another sample of the same type (for example, a sample of another lot of pharmaceuticals having the same target compound). .
- the mass spectrometer 12 in the measurement unit 1 is a general single-type quadrupole mass spectrometer, but the mass spectrometer 12 is a triple quadrupole mass capable of MS / MS analysis.
- An analyzer may be used.
- Q1 scan mass scan in the front quadrupole mass filter
- Q3 scan mass scan in the rear quadrupole mass filter
- product ion scan precursor Perform measurements such as ion scan, neutral loss scan, etc., or set the mass-to-charge ratio of the significant peak to the mass-to-charge ratio of the precursor ion and the mass-to-charge ratio set in advance for each mass-to-charge ratio of the precursor ion
- a general measurement mode used in MS / MS analysis such as executing MRM measurement using the mass-to-charge ratio of ions, may be used.
- the present invention can be applied to mass spectrometers other than the quadrupole mass spectrometer, such as a time-of-flight mass spectrometer, an ion trap mass spectrometer, and an inductively coupled plasma mass spectrometer.
- mass spectrometers other than the quadrupole mass spectrometer, such as a time-of-flight mass spectrometer, an ion trap mass spectrometer, and an inductively coupled plasma mass spectrometer.
- the present invention can be applied not only to a liquid chromatograph mass spectrometer but also to a gas chromatograph mass spectrometer.
- the present invention can also be used for an imaging mass spectrometer using MALDI-TOFMS.
- the present invention is used when the background signal appears in a specific wavelength or wavelength range. Obviously it is applicable.
Abstract
LC-MSにおいて移動相やそれに添加される試薬等の影響で従来は検出できなかった微量な成分の検出も可能とする。まず、ブランク測定を実行し、それにより得られるマススペクトル上で移動相等によるバックグラウンド信号のm/z値MBGを抽出する(S2-S4)。そして、所定のm/z範囲からバックグラウンド信号のm/z値MBGを除外した複数の分割されたm/z範囲のスキャン測定を実行する分析メソッドを作成し、この分析メソッドに従って目的試料のLC/MS分析を実行する(S5-S6)。それにより得られたデータからトータルイオンクロマトグラム(TIC)を作成すると、該TICにはバックグラウンド信号の影響が殆ど現れずベースラインが低くなる。そこで、このTIC上で不純物ピークを検出し(S7)、ピークがあれば該ピーク付近のマススペクトルから不純物のm/zを特定する(S8-S11)。
Description
本発明は、液体クロマトグラフ(LC)やガスクロマトグラフ(GC)と質量分析装置とを組み合わせたクロマトグラフ質量分析装置、或いは分光分析装置などの分析装置に関する。
液体クロマトグラフ質量分析装置では、試料に含まれる様々な化合物を液体クロマトグラフで時間的に分離したあとにその化合物をそれぞれ質量分析装置で検出し、化合物毎に含有量に応じた強度信号を取得する。試料に含まれる化合物が未知である場合や未知である化合物を検出する必要がある場合には一般に、質量分析装置において所定の質量電荷比範囲に亘るスキャン測定が繰り返し行われ、これによって質量が未知である化合物についても漏れなく検出できるようにしている。
医薬品製造・開発、農薬製造・開発などの合成化学分野では、試料中に目的とする化合物以外にどのような不純物が含まれているのかを調べることが重要である。液体クロマトグラフ質量分析装置を用いた不純物検出の一般的な手順は次のとおりである。
(1)試料に対するLC/MS測定を行って得られるデータに基づきクロマトグラム(トータルイオンクロマトグラム)を作成し、該クロマトグラム上で不純物由来のピークを検出する。一般的には、既知である目的化合物由来のピーク(通常、このピークが信号強度が最大のメインピークである)の信号強度(ピーク高さ)に対し所定割合以上の信号強度を有するピークを不純物ピークとして検出する。
(2)検出された不純物ピークのピークトップの位置(保持時間)付近において得られたマススペクトルを確認し、該マススペクトルに現れるピークの位置から不純物の質量電荷比を求める。この質量電荷比から、或いは質量電荷比と保持時間とから不純物が何であるのかを推定可能な場合もある。
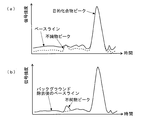
近年、試料に含まれるより微量な不純物を検出したいという要求が高まっている。しかしながら、上述したような従来の液体クロマトグラフ質量分析装置では、図5(a)に示すように、液体クロマトグラフで用いられる移動相中や移動相に添加される添加剤や緩衝剤、さらには移動相に含まれる夾雑物などの影響によってトータルイオンクロマトグラムのベースラインが上昇してしまい、微量の不純物のピークがそれに隠れてしまって検出できない場合があった。
従来装置として特許文献1には、試料成分を含まない溶媒のみのブランク試料をGC/MS分析することでバックグラウンドノイズが現れたクロマトグラムやマススペクトルを取得して記憶しておき、目的試料に対するGC/MS分析を行うことで得られたクロマトグラムやマススペクトルから上記バックグラウンドノイズが現れたクロマトグラムやマススペクトルを差し引くことでバックグラウンドノイズの影響を除去する装置が開示されている。しかしながら、こうした処理を行ったとしても、クロマトグラムにおいてバックグラウンドノイズで上昇しているベースラインに隠れてしまっている不純物ピークを見つけることはできない。
また、ガスクロマトグラフと質量分析装置とを組み合わせたガスクロマトグラフ質量分析装置でも、キャリアガスに含まれる不純物などのために同様の問題がある。
また、ガスクロマトグラフと質量分析装置とを組み合わせたガスクロマトグラフ質量分析装置でも、キャリアガスに含まれる不純物などのために同様の問題がある。
本発明は上記課題に鑑みてなされたものであり、その第1の目的は、例えば液体クロマトグラフにおける移動相やそれに添加される試薬の影響のために或いはガスクロマトグラフにおけるキャリアガスに含まれる不純物等のために、従来は検出できなかったような微量な化合物を検出することができるクロマトグラフ質量分析装置等の分析装置を提供することである。
また、本発明の第2の目的は、上述したような従来は検出できなかった微量な化合物を検出するための分析を実施する際に用いられる、分析条件等を含む分析メソッドを容易に作成することができる分析装置を提供することである。
上記課題を解決するためになされた本発明の第1の態様は、分析条件を含む分析メソッドに従って分析を実行することにより、所定のパラメータについての所定の値の範囲に亘るスペクトルを取得することが可能な分析装置において、
a)分析の際に現れるバックグラウンド信号のパラメータ値を記憶しておくバックグラウンド情報記憶部と、
b)前記分析条件の一つとして一若しくは複数のパラメータ値又はパラメータ値範囲が設定されたとき、そのパラメータ値又はパラメータ値範囲から前記バックグラウンド情報記憶部に記憶されているパラメータ値を除外した一若しくは複数のパラメータ値又はパラメータ値範囲を分析対象とした分析メソッドを作成する分析メソッド作成部と、
を備えることを特徴としている。
a)分析の際に現れるバックグラウンド信号のパラメータ値を記憶しておくバックグラウンド情報記憶部と、
b)前記分析条件の一つとして一若しくは複数のパラメータ値又はパラメータ値範囲が設定されたとき、そのパラメータ値又はパラメータ値範囲から前記バックグラウンド情報記憶部に記憶されているパラメータ値を除外した一若しくは複数のパラメータ値又はパラメータ値範囲を分析対象とした分析メソッドを作成する分析メソッド作成部と、
を備えることを特徴としている。
本発明の第1の態様及び後述する第2の態様の分析装置において、上記パラメータは例えば質量電荷比や波長(又は波数)である。パラメータが質量電荷比である場合、本発明に係る分析装置は、誘導結合プラズマ質量分析装置(ICP-MS)、マトリクス支援レーザ脱離イオン化飛行時間型質量分析装置(MALDI-TOFMS)等を含む質量分析装置、液体クロマトグラフ質量分析装置、ガスクロマトグラフ質量分析装置などであり、スペクトルはマススペクトルである。パラメータが波長である場合、本発明に係る分析装置は、フォトダイオードアレイ検出器(PDA)、紫外可視分光光度計、フーリエ変換赤外分光光度計(FTIR)などの分光分析装置であり、スペクトルは吸光スペクトルや蛍光スペクトルである。
本発明に係る分析装置が質量分析装置である場合、例えば四重極型質量分析装置のようなイオンを開裂させないシングルタイプの質量分析装置でも、三連(トリプル)四重極型質量分析装置のようなMS/MS分析が可能な質量分析装置でもよい。
本発明に係る第1の態様の分析装置がクロマトグラフにより時間的に分離された成分を質量分析装置により検出するクロマトグラフ質量分析装置である場合、
前記バックグラウンド情報記憶部は分析の際に現れるバックグラウンド信号の質量電荷比値を記憶しておき、
、前記分析メソッド作成部は、前記分析条件の一つである繰り返し分析対象の一若しくは複数の質量電荷比又は質量電荷比範囲が設定されたとき、その質量電荷比又は質量電荷比範囲から前記バックグラウンド情報記憶部に記憶されている質量電荷比を除外した質量電荷比又は質量電荷比範囲を繰り返し分析対象とした分析メソッドを作成する構成とすることができる。
前記バックグラウンド情報記憶部は分析の際に現れるバックグラウンド信号の質量電荷比値を記憶しておき、
、前記分析メソッド作成部は、前記分析条件の一つである繰り返し分析対象の一若しくは複数の質量電荷比又は質量電荷比範囲が設定されたとき、その質量電荷比又は質量電荷比範囲から前記バックグラウンド情報記憶部に記憶されている質量電荷比を除外した質量電荷比又は質量電荷比範囲を繰り返し分析対象とした分析メソッドを作成する構成とすることができる。
本発明に係る第1の態様の分析装置が液体クロマトグラフ質量分析装置である場合、バックグラウンド情報記憶部には分析の際に現れるバックグラウンド信号の質量電荷比が記憶される。ここでいうバックグラウンド信号は典型的には液体クロマトグラフに使用される移動相やそれに添加される各種試薬に由来するものであり、トータルイオンクロマトグラムにおいてそのほぼ全体に存在するものである。こうしたバックグラウンド信号はユーザ毎に或いは分析毎に変わる場合がある。また、移動相の流速、カラムの種類など、他の条件によってもバックグラウンド信号の出方が変わる可能性がある。
そこで本発明に係る第1の態様による液体クロマトグラフ質量分析装置では、ブランク分析を行うことで得られた結果に基づきバックグラウンド信号のパラメータ値つまりは質量電荷比を抽出して前記バックグラウンド情報記憶部に記憶するバックグラウンド情報取得部、をさらに備える構成とするとよい。この構成では、試料を移動相中に注入せずに又は溶媒のみの試料を移動相に注入することでブランク分析を実際に行い、バックグラウンド情報取得部はそれによって得られた例えばマススペクトルからバックグラウンド信号の質量電荷比を抽出する。これにより、そのときの分析に使用する移動相やそのほかの条件の下で現れるバックグラウンド信号の質量電荷比を正確に求めることができる。
分析メソッド作成部は、分析条件の一つとしてユーザにより又は自動的に設定された、繰り返し分析対象の1若しくは複数の質量電荷比又は質量電荷比範囲から、バックグラウンド情報記憶部に記憶されている質量電荷比を除外した質量電荷比又は質量電荷比範囲を求める。具体的には例えば、所定の質量電荷比範囲に亘るスキャン測定の繰り返しが設定されている場合には、その質量電荷比範囲からバックグラウンド情報記憶部に記憶されている一又は複数の質量電荷比を除外した、即ち質量電荷比範囲の途中が途切れたような質量電荷比範囲が求まる。また、複数の質量電荷比をターゲットとするSIM(選択イオンモニタリング)測定やMRM(多重反応モニタリング)測定の繰り返しが設定されている場合には、その複数の質量電荷比からバックグラウンド情報記憶部に記憶されている一又は複数の質量電荷比を除外した一又は複数の質量電荷比が求まる。
分析メソッド作成部により作成される分析メソッドでは、上記バックグラウンド信号の質量電荷比を有するイオンが分析対象から除外される。そのため、この分析メソッドに従った分析により得られるトータルイオンクロマトグラムやマススペクトルには上記バックグラウンド信号が現れず、バックグラウンド信号の質量電荷比と不純物由来のイオンの質量電荷比とが同じでない限り、例えばトータルイオンクロマトグラム上で従来はバックグラウンド信号に隠れて観測できなった不純物等の微量成分のピークが観測できるようになる。
なお、本発明に係る第1の態様の分析装置において、上記バックグラウンド情報記憶部は、種々の条件の下でのバックグラウンド信号のパラメータ値を記憶したデータベースとしてもよい。ここでいう種々の条件とは、上述したようにバックグラウンド信号の出方が変わる可能性がある条件であり、例えば液体クロマトグラフ質量分析装置では、移動相やそれに添加される各種試薬の種類のほか、移動相の流速やカラムの種類なども含むようにすることができる。こうしたデータベースはユーザ自身が作成してもよいが、装置メーカなどが提供するようにしてもよい。
上記課題を解決するためになされた本発明の第2の態様は、分析条件を含む分析メソッドに従って分析を実行することにより、所定のパラメータについての所定の値の範囲に亘るスペクトルを取得することが可能な分析装置において、
a)分析対象から除外するパラメータ値又はパラメータ値範囲を設定する除外情報設定部と、
b)試料に対する分析を行うことで得られたスペクトル上で前記除外情報設定部により設定されたパラメータ値を除き、それ以外のパラメータ値で信号強度値が所定の閾値を超えたか否かを判定し、信号強度値が該閾値を超えたパラメータ値を求める強度値判定部と、
を備えることを特徴としている。
a)分析対象から除外するパラメータ値又はパラメータ値範囲を設定する除外情報設定部と、
b)試料に対する分析を行うことで得られたスペクトル上で前記除外情報設定部により設定されたパラメータ値を除き、それ以外のパラメータ値で信号強度値が所定の閾値を超えたか否かを判定し、信号強度値が該閾値を超えたパラメータ値を求める強度値判定部と、
を備えることを特徴としている。
本発明に係る第2の態様の分析装置において、上記「分析対象から除外するパラメータ値又はパラメータ値範囲」は例えば 上記第1の態様の分析装置において、バックグラウンド情報記憶部に記憶されているバックグラウンド信号のパラメータ値又はそれを含む所定幅のパラメータ値範囲とすることができる。
本発明に係る第2の態様の分析装置がクロマトグラフにより時間的に分離された成分を質量分析装置により検出するクロマトグラフ質量分析装置である場合、
前記除外情報設定部は分析対象から除外する質量電荷比又は質量電荷比範囲を設定し、
前記強度値判定部は、試料に対する分析を行うことで得られたマススペクトル上で前記除外情報設定部により設定された質量電荷比又は質量電荷比範囲を除き、それ以外の質量電荷比で信号強度値が所定の閾値を超えたか否かを判定し、信号強度値が該閾値を超えた質量電荷比を求める構成とすることができる。
前記除外情報設定部は分析対象から除外する質量電荷比又は質量電荷比範囲を設定し、
前記強度値判定部は、試料に対する分析を行うことで得られたマススペクトル上で前記除外情報設定部により設定された質量電荷比又は質量電荷比範囲を除き、それ以外の質量電荷比で信号強度値が所定の閾値を超えたか否かを判定し、信号強度値が該閾値を超えた質量電荷比を求める構成とすることができる。
本発明に係る第2の態様の分析装置が液体クロマトグラフ質量分析装置である場合、試料に対するLC/MS分析を行うことでマススペクトルが得られると、強度値判定部は、そのマススペクトル上で、除外情報設定部により設定された質量電荷比又は質量電荷比範囲を除いて、それ以外の質量電荷比で信号強度値が所定の閾値を超えたか否かを判定する。即ち、除外情報設定部により設定された質量電荷比や質量電荷比範囲内の任意の質量電荷比に如何に大きな強度のピークが存在しても該ピークは無視され、それ以外の質量電荷比で信号強度値が所定の閾値を超えているもののみが抽出される。
したがって、上述したように除外情報設定部でバックグラウンド信号の質量電荷比を設定しておくことによって、強度値判定部ではバックグラウンド信号以外の有意な成分、つまりは目的化合物や不純物などに由来するイオンの質量電荷比を求めることができる。
したがって、上述したように除外情報設定部でバックグラウンド信号の質量電荷比を設定しておくことによって、強度値判定部ではバックグラウンド信号以外の有意な成分、つまりは目的化合物や不純物などに由来するイオンの質量電荷比を求めることができる。
本発明に係る第2の態様の分析装置では、試料に対する分析を行うことで得られたデータを用いて上記強度値判定部により得られた質量電荷比における抽出イオンクロマトグラム(慣用的にはマスクロマトグラムともいう)を作成するクロマトグラム作成部、をさらに備える構成とするとよい。
この構成によれば、試料中の目的化合物や不純物由来のピークが観測される抽出イオンクロマトグラムを自動的に作成することができ、例えばそれらクロマトグラム上のピークの面積値等から不純物を定量することも可能となる。
この構成によれば、試料中の目的化合物や不純物由来のピークが観測される抽出イオンクロマトグラムを自動的に作成することができ、例えばそれらクロマトグラム上のピークの面積値等から不純物を定量することも可能となる。
また本発明に係る第2の態様の分析装置が分析条件を含む分析メソッドに従って分析を実行するクロマトグラフ質量分析装置である場合、上記強度値判定部により得られた質量電荷比を繰り返し分析対象とした分析メソッドを作成する分析メソッド作成部、をさらに備える構成としてもよい。
この構成において、分析メソッド作成部は例えば、上記強度値判定部により得られた質量電荷比をターゲットとするSIM測定を実行する分析メソッド作成する。また、質量分析装置がMS/MS分析が可能な質量分析装置である場合には、上記強度値判定部により得られた質量電荷比をプリカーサイオンとするプロダクトイオンスキャン測定や、得られた質量電荷比をプリカーサイオンとし該質量電荷比に対応して予め定められた質量電解比をプロダクトイオンとするMRM測定を実行する分析メソッドを作成する。これにより、バックグラウンド信号に影響を受けずに試料中の目的化合物や不純物をターゲットとして分析を行うための分析メソッドを自動的に作成することができる。
また本発明に係る第2の態様の分析装置では、上述したようにSIM測定等を行う分析メソッドを作成するのではなく、分析実行中にターゲットとすべき成分が見つかったならば直ぐにSIM測定等を実施するようにしてもよい。
即ち、本発明に係る第2の態様の分析装置において、上記強度値判定部は、試料に対する分析の実行中に略リアルタイムで得られたマススペクトルに基づいて信号強度値が前記閾値を超えた質量電荷比を求め、該質量電荷比が得られたときに該質量電荷比をターゲットとするSIM測定又はプロダクトイオンスキャン測定若しくはMRM測定を実行するように各部を制御する分析制御部、をさらに備える構成としてもよい。
即ち、本発明に係る第2の態様の分析装置において、上記強度値判定部は、試料に対する分析の実行中に略リアルタイムで得られたマススペクトルに基づいて信号強度値が前記閾値を超えた質量電荷比を求め、該質量電荷比が得られたときに該質量電荷比をターゲットとするSIM測定又はプロダクトイオンスキャン測定若しくはMRM測定を実行するように各部を制御する分析制御部、をさらに備える構成としてもよい。
この構成では、LC/MS分析やGC/MS分析の実行中に着目すべき成分が見つかった場合に該成分をターゲットとしたSIM測定等が速やかに実施されるので、該成分についての抽出イオンクロマトグラムなどを得るために再度同じ試料をLC/MS分析やGC/MS分析する必要がない。そのため、分析効率を高めることができるとともに、分析すべき試料の量が少なくて済む。
本発明に係る第1の態様の分析装置によれば、例えば液体クロマトグラフにおける移動相や試薬等の影響のために、或いはガスクロマトグラフにおけるキャリアガス中の不純物の影響のために、従来は検出できなかった微量な不純物などをクロマトグラム上で検出することが可能となる。また本発明に係る第1の態様の分析装置によれば、作成された分析メソッドに従って分析を実施する際に微量な不純物などの影響を除去することができるので、データ収集後にデータ処理によってバックグラウンドを除去するのとは異なり、分析実行中にリアルタイムで不純物の有無を確認することができる。また、そうした分析を行うための分析メソッドを自動的に作成することができるので、ユーザの負担を軽減することができる。
本発明に係る第2の態様の分析装置によれば、例えば液体クロマトグラフにおける移動相や試薬等の影響のために、或いはガスクロマトグラフにおけるキャリアガス中の不純物の影響のために、従来は検出できなかった微量な不純物由来のイオンの質量電荷比を容易に確認することができる。また、そうした不純物をターゲットとした分析を行うための分析メソッドを自動的に作成することができる。さらにまた、不純物由来のイオンの質量電荷比における抽出イオンクロマトグラム上でピークを検出するとで不純物の保持時間も確認することができる。
[第1実施例]
本発明に係る第1実施例であるLC-MSについて、添付図面を参照して説明する。図1は第1実施例のLC-MSの要部の構成図である。
測定部1は、液体クロマトグラフ(LC部)11と質量分析計(MS部)12とを含む。液体クロマトグラフ11は、移動相容器111から移動相を吸引して送給する送液ポンプ112と、移動相中に試料を注入するインジェクタ113と、試料中の各成分を分離するカラム114と、を含む。一方、質量分析計12は質量分析器として四重極マスフィルタを有する四重極型質量分析計である。
本発明に係る第1実施例であるLC-MSについて、添付図面を参照して説明する。図1は第1実施例のLC-MSの要部の構成図である。
測定部1は、液体クロマトグラフ(LC部)11と質量分析計(MS部)12とを含む。液体クロマトグラフ11は、移動相容器111から移動相を吸引して送給する送液ポンプ112と、移動相中に試料を注入するインジェクタ113と、試料中の各成分を分離するカラム114と、を含む。一方、質量分析計12は質量分析器として四重極マスフィルタを有する四重極型質量分析計である。
測定部1で得られた検出信号はアナログデジタル変換器(ADC)2でデジタルデータに変換され、制御・処理部4に入力される。入力部5や表示部6が接続されている制御・処理部4は、データ記憶部41、バックグラウンド情報抽出部42、バックグラウンド情報記憶部43、分析メソッド作成部44、分析メソッド記憶部45、不純物検出部46などの機能ブロックを含む。また、制御・処理部4は分析制御部3を介して測定部1の動作を制御する。
なお、制御・処理部4の各機能は、パーソナルコンピュータに予めインストールされた専用の制御・処理ソフトウエアを該コンピュータ上で実行することにより達成されるものとすることができる。
なお、制御・処理部4の各機能は、パーソナルコンピュータに予めインストールされた専用の制御・処理ソフトウエアを該コンピュータ上で実行することにより達成されるものとすることができる。
第1実施例のLC-MSにおける特徴的な動作を図2~図5を参照して説明する。
図3は本実施例のLC-MSにおける不純物検出の制御・処理のフローチャート、図2は本実施例のLC-MSにおけるスキャン測定の説明図、図4はブランク分析で得られるマススペクトルの一例を示す図、図5(a)はバックグラウンド信号を除去していないトータルイオンクロマトグラム(TIC)の一例を示す図、図5(b)はバックグラウンド信号を除去したTICの一例を示す図である。
図3は本実施例のLC-MSにおける不純物検出の制御・処理のフローチャート、図2は本実施例のLC-MSにおけるスキャン測定の説明図、図4はブランク分析で得られるマススペクトルの一例を示す図、図5(a)はバックグラウンド信号を除去していないトータルイオンクロマトグラム(TIC)の一例を示す図、図5(b)はバックグラウンド信号を除去したTICの一例を示す図である。
まず、ユーザは入力部5から、質量分析計12において実施するスキャン測定の質量電荷比範囲(つまり下限値Mmin及び上限値Mmax)を含む分析条件を設定する(ステップS1)。設定された分析条件は分析メソッド記憶部45に一旦記憶される。次に、制御・処理部4から指示を受けた分析制御部3は先に記憶された分析条件に従って測定部1を制御することでブランク測定を実行する(ステップS2)。ブランク測定では、液体クロマトグラフ11において試料は移動相中に注入されないか或いは溶媒のみを含む試料が移動相中に注入される。質量分析計12はMmin~Mmaxの質量電荷比範囲のスキャン測定を繰り返し行う。図2(a)はこのときに質量分析計12の四重極マスフィルタに印加される電圧を模式的に示したものである。
ブランク測定においては、試料成分は質量分析計12に導入されないため、スキャン測定によって得られるマススペクトルは主として移動相中の成分を反映したものである。即ち、移動相中の成分によるバックグラウンド信号のマススペクトルを構成するデータがデータ記憶部41に格納される(ステップS3)。
次に、バックグラウンド情報抽出部42はバックグラウンド信号のマススペクトルにおいて強度値が所定の閾値以上であるピークを抽出し、そのピークの質量電荷比をバックグラウンド信号の質量電荷比MBGとして求める(ステップS4)。いま例えば図4に示すバックグラウンド信号のマススペクトルが得られたとしたとき、強度値が閾値以上である二つのピークに対応したm/z279、391をバックグラウンド信号の質量電荷比MBGとして抽出する。
次いで分析メソッド作成部44は、先に設定されたスキャン測定の質量電荷比範囲Mmin~Mmaxの中でバックグラウンド信号の質量電荷比MBGを除外した質量電荷比範囲を求め、これをスキャン測定の対象とする分析メソッドを作成する(ステップS5)。いま、Mmin~Mmax:m/z 250~500でありMBG1:m/z279、MBG2:m/z391である場合には、図2(b)に示すように、m/z250~278、280~390、392~500という三つの質量電荷比範囲がスキャン測定対象となる。なお、或る一つの質量電荷比の値に対し除外すべき質量電荷比の幅(上記例では±1)を適宜変えても構わない。こうしてスキャン測定対象の質量電荷比範囲が変更された分析メソッドが分析メソッド記憶部45に保存される。
引き続いて、分析制御部3はステップS5で作成された分析メソッドに従って目的試料に対するLC/MS分析を実行するように測定部1を制御する(ステップS6)。このとき、カラム114で各種成分が時間的に分離されて質量分析計12に導入されるが、上記バックグラウンド信号の原因となった成分(例えば移動相中の成分)も質量分析計12に導入される。ただし、バックグラウンド信号の原因となった成分由来のイオンの質量電荷比はスキャン測定対象から除外されているため、この成分由来のイオンの強度は収集されるデータに反映されない。
目的試料に対するLC/MS分析により得られたデータはデータ記憶部41に格納される。そして、分析終了後に不純物検出部46はデータ記憶部41に格納されたデータに基づいてTICを作成し、該TIC上で信号強度が最大であるピークをメインピークとし、該メインピークの信号強度に対し所定割合の閾値を定め、信号強度が該閾値以上であるピークを不純物ピークとして検出する(ステップS7)。上述したように、移動相等に由来する主要なバックグラウンド信号は分析結果であるデータには反映されていないので、図5(b)に示すようにTICにおいてバックグラウンド信号によるベースラインの盛り上がりはなくなる。その結果、従来はベースラインに隠れていた微小な不純物ピークも検出できるようになる。
TIC上でピークが検出されなければ(ステップS8でNo)、不純物検出部46は不純物なしと判断する(ステップS9)。一方、TIC上でピークが検出された場合には(ステップS8でYes)、該ピークの保持時間付近に得られたマススペクトル上で信号強度が所定の閾値以上であるスペクトルピークを検出する(ステップS10)。そして、そのスペクトルピークの質量電荷比を求め、これを不純物の質量電荷比として記録したり表示したりする(ステップS11)。
なお、上記実施例では、基本的に一連の処理や制御を自動的に行っていたが、その一部をユーザが手作業で行うようにしてもよい。例えば、上記ステップS7においてTICを作成したあとに該TICを表示部6の画面上に表示し、そのあとの作業、つまりはTIC上での不純物ピークの確認や不純物がある場合のマススペクトル上での不純物の質量電荷比の確認などはユーザが手作業で行うようにしてもよい。また、ステップS4においてマススペクトルからバックグラウンド信号の質量電荷比を抽出する際に、表示部6の画面上に表示されたマススペクトルをユーザが確認し、手作業でバックグラウンド信号の質量電荷比を選択するようにしてもよい。
また、上記実施例では、ブランク測定やそのあとの目的試料に対するLC/MS分析において所定の質量電荷比範囲のスキャン測定が行われたが、質量電荷比を実質的に連続的に走査させるスキャン測定でなくてもよい。例えば、所定の質量電荷比範囲内で質量電荷比を所定のステップ幅(例えば1Daや2Da)ずつ変化させるようにしてもよい。これは、多数のSIM測定の組み合わせとみることもできるし、間欠的なスキャン測定であるとみることもできる。また、試料に含まれる不純物の質量が推定できる場合、或いは既知である不純物が含まれるか否かを調べたいような場合には、不純物の質量に対応した質量電荷比をターゲットとするSIM測定を行うようにしてもよい。
また、上記実施例では、ブランク測定を行ってその結果に基づきバックグラウンド信号の質量電荷比を求めたのに引き続いて目的試料のLC/MS分析を実行していたが、目的試料のLC/MS分析時に試料を移動相に注入してから最初のピークが出現するまでの期間中にバックグラウンド情報を取得し、その結果に基づいて分析途中で分析メソッドを変更して試料中の各成分のデータを取得するようにしてもよい。また、バックグラウンド情報を取得するためにブランク測定を実行するのではなく、目的試料の分析時以外の別の目的のデータ取得時に併せてバックグラウンド情報を取得するようにしてもよい。例えば、検量線用データを取得する際や、移動相、カラム、グラジエント等の分析条件の検討時にバックグラウンド情報を得るようにしてもよい。また、装置の電圧/ガスなどの最適化の作業時にバックグラウンド情報を得るようにしてもよい。特に質量分析計12がトリプル四重極型質量分析計である場合には衝突誘起解離エネルギ等を自動的に最適化する機能を有しているから、そうした機能の中にバックグラウンド情報を取得する機能を盛り込むようにしてもよい。また、測定手法のバリデーション作業時にバックグラウンド情報を得るようにしてもよい。さらには、MALDIイオン源を用いた質量分析装置の場合には、マトリクス効果の検討の際にバックグラウンド情報を得るようにしてもよい。
また上記実施例のLC-MSでは、予め様々な条件の下でのバックグラウンド信号の質量電荷比を求めてバックグラウンド情報記憶部43に記憶しておき、目的試料を分析する際に、その分析の条件に対応した又はそれに最も近い条件の下でのバックグラウンド信号の質量電荷比を記憶部43から読み出して分析メソッドを作成するようにしてもよい。
ここで、様々な条件とは、使用する移動相の種類や移動相に添加する各種の試薬の種類や濃度、さらには移動相の流速、使用するカラムの種類などを含むようにするとよい。これは、様々な分析条件とバックグラウンド信号の質量電荷比とを対応付けた一種のデータベースであり、こうしたデータベースを利用することによって、目的試料の分析毎にブランク測定を行わなくても十分にバックグラウンド信号を除去したTICを得ることができる。
ここで、様々な条件とは、使用する移動相の種類や移動相に添加する各種の試薬の種類や濃度、さらには移動相の流速、使用するカラムの種類などを含むようにするとよい。これは、様々な分析条件とバックグラウンド信号の質量電荷比とを対応付けた一種のデータベースであり、こうしたデータベースを利用することによって、目的試料の分析毎にブランク測定を行わなくても十分にバックグラウンド信号を除去したTICを得ることができる。
また、上述したようなLCの分離条件以外に様々な条件の下でのバックグラウンド情報を予め記憶しておいて利用するようにすることができる。例えば、固相抽出(逆相、順相)や液相抽出などの前処理法毎、サンプルの保管容器(バイアル、バイアルキャップ、移動相ビン、カラム)毎、使用する内標用試薬毎、イオンペア試薬毎、さらには、サンプルのロッド毎や純度毎、のバックグラウンド情報を記憶するようにしてもよい。また、サンプルの種類毎(例えばホウレンソウでは○○、トマトでは●●、マウスではXX等)、質量分析装置におけるイオン化方法(例えばESI法では○○、APCI法では●●等)毎のバックグラウンド情報を記憶しておくようにしてもよい。さらには、培養細胞の不純物測定の場合であれば、培養時間、培養元の細胞別、培養温度などに応じたバックグラウンド情報を記憶しておいてもよいし、メタボロミクスなどの分析においては、「比較対象とするサンプル」に応じてバックグラウンド情報を記憶しておいてもよい。また、マトリクス(試料以外に存在する物質、共存物質)毎(例えば生体試料ではマトリクスが血漿、尿等)にバックグラウンド情報を記憶しておいてもよい。また、こうしたバックグラウンド情報は予め装置の製造メーカからユーザに提供されるメソッドパッケージに盛り込まれていてもよい。
また、上記実施例のLC-MSでは作成された分析メソッドに従って目的試料に対するLC/MS分析を行いTIC等を作成したが、後述するようなイメージング質量分析装置では、バックグラウド情報を除外した情報に基づいて取得したデータから質量分析イメージング画像を作成して表示するようにしてもよい。
[第2実施例]
次に、本発明に係る第2実施例であるLC-MSについて、添付図面を参照して説明する。
図6は第2実施例のLC-MSの要部の構成図であり、図1に示した第1実施例のLC-MSと同じ構成要素には同じ符号を付している。測定部1、ADC2、分析制御部3は第1実施例のLC-MSと同じである。制御・処理部4は、第1実施例のLC-MSと同様のデータ記憶部41、バックグラウンド情報抽出部42、バックグラウンド情報記憶部43のほか、有意ピーク検出部401、自動SIM測定制御部402、EIC作成部403、分析メソッド作成部404などの機能ブロックを含む。
次に、本発明に係る第2実施例であるLC-MSについて、添付図面を参照して説明する。
図6は第2実施例のLC-MSの要部の構成図であり、図1に示した第1実施例のLC-MSと同じ構成要素には同じ符号を付している。測定部1、ADC2、分析制御部3は第1実施例のLC-MSと同じである。制御・処理部4は、第1実施例のLC-MSと同様のデータ記憶部41、バックグラウンド情報抽出部42、バックグラウンド情報記憶部43のほか、有意ピーク検出部401、自動SIM測定制御部402、EIC作成部403、分析メソッド作成部404などの機能ブロックを含む。
第2実施例のLC-MSにおける特徴的な動作を図7、図8を参照して説明する。
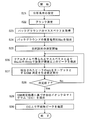
図8は本実施例のLC-MSにおける不純物検出の制御・処理のフローチャート、図7は本実施例のLC-MSにおける有意ピーク検出動作の説明図である。
図8は本実施例のLC-MSにおける不純物検出の制御・処理のフローチャート、図7は本実施例のLC-MSにおける有意ピーク検出動作の説明図である。
図8においてステップS21~S24の処理は図3におけるステップS1~S4と同じであり、バックグラウンド情報記憶部43にはバックグラウンド信号の質量電荷比MBGが記憶される。そのあと、本実施例のLC-MSでは、分析制御部3は目的試料に対するLC/MS分析を実行するように測定部1を制御し測定を開始する(ステップS25)。このときには、ブランク測定時と同様に、質量分析計12において所定の質量電荷比範囲Mmin~Mmaxに亘るスキャン測定が行われる。
目的試料に対するスキャン測定が行われる毎に、有意ピーク検出部401は得られたデータに基づいてリアルタイムでマススペクトルを作成し、そのマススペクトル上で有意なピークを検出する。その際に、バックグラウンド情報記憶部43に記憶されているバックグラウンド信号の質量電荷比MBGのピークは強度に関係なく無視し、それ以外の質量電荷比において強度が閾値以上であるピークを有意なピークであると判断する(ステップS26)。いま、MBG:m/z279、m/z391であって、図7に示すようなマススペクトルが得られた場合、m/z279、m/z391のピークは無視し、強度が閾値を超えているm/z430のピークのみを有意なピークと判断する。
ステップS26で有意なピークが検出されたならば、自動SIM測定制御部402はその検出されたピークの質量電荷比をターゲットとするSIM測定を引き続き実行するように測定部1を制御する(ステップS27)。例えば検出されたピークが不純物由来のピークである場合、その不純物が質量分析計12に導入されている時間には限りがある。そこで、或る質量電荷比におけるピークが有意なピークとして検出された時点から所定時間だけSIM測定を実行してもよいし、或いは、SIM測定とスキャン測定とをごく短い時間ずつの時分割で行い、その質量電荷比におけるピークが有意なピークとして検出されている間だけその質量電荷比をターゲットとするSIM測定を実施してもよい。そして、例えば予め決められた測定終了時間に達する等、測定終了条件が満たされていなければステップS28からS26へと戻る。
したがって、ステップS26~S28の繰り返しにより、リアルタイムで作成されるマススペクトル上に有意なピークがあれば、そのピークの質量電荷比をターゲットとするSIM測定が実施され、その質量電荷比におけるイオン強度の時間変化を示すデータがデータ記憶部41に格納される。マススペクトル上にはバックグラウンド信号の原因となった成分由来のイオンピークも観測されるが、このピークは有意なピークとして抽出されないので、当然、該バックグラウンド信号の質量電荷比をターゲットとするSIM測定は行われない。そして、測定が終了すると、EIC作成部403はデータ記憶部41に格納されている、SIM測定により得られたデータに基づいて、特定の質量電荷比における抽出イオンクロマトグラムを作成し、これを表示部6の画面上に描出する(ステップS29)。ユーザはこの表示された抽出イオンクロマトグラムを確認し、例えば不純物の保持時間を把握するとともに、そのターゲットの質量電荷比から不純物の質量電荷比を把握する(ステップS30)。
なお、当然のことながら、試料中の目的化合物由来のピークも有意なピークとして検出されることになるが、これを検出する必要がない場合には、有意なピークを検出する際に目的化合物に対応する既知の質量電荷比も無視するように設定しておけばよい。それにより、不純物が観測される抽出イオンクロマトグラムのみを作成することができる。
この第2実施例のLC-MSでは、LC/MS分析中に不純物が現れたタイミングで即座にSIM測定を実行するようにしていたが、同種の試料をLC/MS分析する際に同じ種類の不純物を検出するためのSIM測定を実施可能な分析メソッドを作成したい場合には、図8に示したフローチャートを次のように変更してもよい。即ち、ステップS26で有意なピークが検出されたならば、その度にそのピークの質量電荷比とそのピークが検出された時間範囲(保持時間)とを記憶しておく。そして、測定終了後に、分析メソッド作成部404が、検出された全ての有意なピークの質量電荷比をターゲットとしたSIM測定をそのピークに対応する時間範囲だけ実施するような分析メソッドを自動的に作成すればよい。こうした分析メソッドを用いて、別の同種の試料(例えば目的化合物が同じである別のロットの医薬品などの試料)中の不純物の同定(含まれるか否かの確認)や定量を行うことができる。
上記実施例ではいずれも測定部1における質量分析計12が一般的なシングルタイプの四重極型質量分析計であるが、質量分析計12はMS/MS分析が可能なトリプル四重極型質量分析計でもよい。その場合、第2実施例では、SIM測定の代わりに、Q1スキャン(前段の四重極マスフィルタにおける質量スキャン)、Q3スキャン(後段の四重極マスフィルタにおける質量スキャン)、プロダクトイオンスキャン、プリカーサイオンスキャン、ニュートラルロススキャンなどの測定を実行するか、或いは、有意なピークの質量電荷比をプリカーサイオンの質量電荷比とそのプリカーサイオンの質量電荷比毎に予め設定されている質量電荷比をプロダクトイオンの質量電荷比としたMRM測定を実行するなど、MS/MS分析で用いられる一般的な測定モードを使用すればよい。
また、四重極型質量分析装置以外の質量分析装置、例えば飛行時間型質量分析装置、イオントラップ型質量分析装置、誘導結合プラズマ質量分析装置などにも、本発明を同様に適用できることは言うまでもない。また、液体クロマトグラフ質量分析装置でなくガスクロマトグラフ質量分析装置にも本発明を同様に適用できることは当然である。また、MALDI-TOFMS等を利用したイメージング質量分析装置にも本発明を利用可能である。
さらにまた、マススペクトル以外のスペクトル、具体的には、吸光スペクトルや蛍光スペクトル等を取得可能な各種の分光分析装置においても、バックグラウンド信号が特定の波長や波長範囲に現れる場合には本発明を適用可能であることは明らかである。
さらにまた、マススペクトル以外のスペクトル、具体的には、吸光スペクトルや蛍光スペクトル等を取得可能な各種の分光分析装置においても、バックグラウンド信号が特定の波長や波長範囲に現れる場合には本発明を適用可能であることは明らかである。
さらにまた、それ以外の点において、本発明の趣旨の範囲で適宜に修正、変更、追加などを行っても本願請求の範囲に包含されることは明らかである。
1…測定部
11…液体クロマトグラフ(LC)
111…移動相容器
112…送液ポンプ
113…インジェクタ
114…カラム
12…質量分析計(MS)
2…アナログデジタル変換器(ADC)
3…分析制御部
4…制御・処理部
41…データ記憶部
42…バックグラウンド情報抽出部
43…バックグラウンド情報記憶部
44…分析メソッド作成部
45…分析メソッド記憶部
46…不純物検出部
401…有意ピーク検出部
402…自動SIM測定制御部
403…EIC作成部
404…分析メソッド作成部
5…入力部
6…表示部
11…液体クロマトグラフ(LC)
111…移動相容器
112…送液ポンプ
113…インジェクタ
114…カラム
12…質量分析計(MS)
2…アナログデジタル変換器(ADC)
3…分析制御部
4…制御・処理部
41…データ記憶部
42…バックグラウンド情報抽出部
43…バックグラウンド情報記憶部
44…分析メソッド作成部
45…分析メソッド記憶部
46…不純物検出部
401…有意ピーク検出部
402…自動SIM測定制御部
403…EIC作成部
404…分析メソッド作成部
5…入力部
6…表示部
Claims (10)
- 分析条件を含む分析メソッドに従って分析を実行することにより、所定のパラメータについての所定の値の範囲に亘るスペクトルを取得することが可能な分析装置において、
a)分析の際に現れるバックグラウンド信号のパラメータ値を記憶しておくバックグラウンド情報記憶部と、
b)前記分析条件の一つとして一若しくは複数のパラメータ値又はパラメータ値範囲が設定されたとき、そのパラメータ値又はパラメータ値範囲から前記バックグラウンド情報記憶部に記憶されているパラメータ値を除外した一若しくは複数のパラメータ値又はパラメータ値範囲を分析対象とした分析メソッドを作成する分析メソッド作成部と、
を備えることを特徴とする分析装置。 - 請求項1に記載の分析装置であって、
ブランク分析を行うことで得られた結果に基づきバックグラウンド信号のパラメータ値を抽出して前記バックグラウンド情報記憶部に記憶するバックグラウンド情報取得部、をさらに備えることを特徴とする分析装置。 - 請求項1に記載の分析装置であって、
前記バックグラウンド情報記憶部は、種々の条件の下でのバックグラウンド信号のパラメータ値を記憶したデータベースであることを特徴とする分析装置。 - 請求項1に記載の分析装置であって、クロマトグラフにより時間的に分離された成分を質量分析装置により検出するクロマトグラフ質量分析装置において、
前記バックグラウンド情報記憶部は分析の際に現れるバックグラウンド信号の質量電荷比値を記憶しておき、
、前記分析メソッド作成部は、前記分析条件の一つである繰り返し分析対象の一若しくは複数の質量電荷比又は質量電荷比範囲が設定されたとき、その質量電荷比又は質量電荷比範囲から前記バックグラウンド情報記憶部に記憶されている質量電荷比を除外した質量電荷比又は質量電荷比範囲を繰り返し分析対象とした分析メソッドを作成することを特徴とする分析装置。 - 請求項4に記載の分析装置であって、
前記分析メソッドに従って分析を行うことで得られた結果に基づいてトータルイオンクロマトグラムを作成するクロマトグラム取得部をさらに備えることを特徴とする分析装置。 - 分析条件を含む分析メソッドに従って分析を実行することにより、所定のパラメータについての所定の値の範囲に亘るスペクトルを取得することが可能な分析装置において、
a)分析対象から除外するパラメータ値又はパラメータ値範囲を設定する除外情報設定部と、
b)試料に対する分析を行うことで得られたスペクトル上で前記除外情報設定部により設定されたパラメータ値を除き、それ以外のパラメータ値で信号強度値が所定の閾値を超えたか否かを判定し、信号強度値が該閾値を超えたパラメータ値を求める強度値判定部と、
を備えることを特徴とする分析装置。 - 請求項6に記載の分析装置であって、クロマトグラフにより時間的に分離された成分を質量分析装置により検出するクロマトグラフ質量分析装置において、
前記除外情報設定部は分析対象から除外する質量電荷比又は質量電荷比範囲を設定し、
前記強度値判定部は、試料に対する分析を行うことで得られたマススペクトル上で前記除外情報設定部により設定された質量電荷比又は質量電荷比範囲を除き、それ以外の質量電荷比で信号強度値が所定の閾値を超えたか否かを判定し、信号強度値が該閾値を超えた質量電荷比を求めることを特徴とする分析装置。 - 請求項7に記載の分析装置であって、
試料に対する分析を行うことで得られたデータを用いて前記強度値判定部により得られた質量電荷比における抽出イオンクロマトグラムを作成するクロマトグラム作成部、をさらに備えることを特徴とするクロマトグラフ質量分析装置。 - 請求項7に記載の分析装置であり、分析条件を含む分析メソッドに従って分析を実行する分析装置であって、
前記強度値判定部により得られた質量電荷比を繰り返し分析対象とした分析メソッドを作成する分析メソッド作成部、をさらに備えることを特徴とする分析装置。 - 請求項7に記載の分析装置であって、
前記強度値判定部は、試料に対する分析の実行中に略リアルタイムで得られたマススペクトルに基づいて信号強度値が前記閾値を超えた質量電荷比を求め、
該質量電荷比が得られたときに該質量電荷比をターゲットとするSIM測定又はMRM測定を実行するように各部を制御する分析制御部、をさらに備えることを特徴とする分析装置。
Priority Applications (5)
| Application Number | Priority Date | Filing Date | Title |
|---|---|---|---|
| EP16907244.4A EP3477293A4 (en) | 2016-06-28 | 2016-06-28 | ANALYSIS DEVICE |
| CN201680087362.6A CN109416342B (zh) | 2016-06-28 | 2016-06-28 | 分析装置 |
| PCT/JP2016/069124 WO2018003011A1 (ja) | 2016-06-28 | 2016-06-28 | 分析装置 |
| JP2018524618A JP6665933B2 (ja) | 2016-06-28 | 2016-06-28 | 分析装置 |
| US16/307,650 US10935528B2 (en) | 2016-06-28 | 2016-06-28 | Analysis device |
Applications Claiming Priority (1)
| Application Number | Priority Date | Filing Date | Title |
|---|---|---|---|
| PCT/JP2016/069124 WO2018003011A1 (ja) | 2016-06-28 | 2016-06-28 | 分析装置 |
Publications (1)
| Publication Number | Publication Date |
|---|---|
| WO2018003011A1 true WO2018003011A1 (ja) | 2018-01-04 |
Family
ID=60786185
Family Applications (1)
| Application Number | Title | Priority Date | Filing Date |
|---|---|---|---|
| PCT/JP2016/069124 WO2018003011A1 (ja) | 2016-06-28 | 2016-06-28 | 分析装置 |
Country Status (5)
| Country | Link |
|---|---|
| US (1) | US10935528B2 (ja) |
| EP (1) | EP3477293A4 (ja) |
| JP (1) | JP6665933B2 (ja) |
| CN (1) | CN109416342B (ja) |
| WO (1) | WO2018003011A1 (ja) |
Cited By (4)
| Publication number | Priority date | Publication date | Assignee | Title |
|---|---|---|---|---|
| WO2020110583A1 (ja) * | 2018-11-29 | 2020-06-04 | 株式会社島津製作所 | 有害物質分析システム及び有害物質分析用プログラム |
| CN112601958A (zh) * | 2018-08-30 | 2021-04-02 | 英国质谱公司 | 质量校正 |
| GB2586376B (en) * | 2018-04-18 | 2023-03-29 | Agilent Technologies Inc | Analysis of blank runs for chromatograph performance |
| WO2023054125A1 (ja) * | 2021-10-01 | 2023-04-06 | 株式会社日立ハイテク | 液体クロマトグラフ質量分析装置の制御方法 |
Families Citing this family (4)
| Publication number | Priority date | Publication date | Assignee | Title |
|---|---|---|---|---|
| CN111465864A (zh) * | 2018-02-09 | 2020-07-28 | 株式会社岛津制作所 | 电传导度检测器及求取背景减法信号的相位调整值的方法 |
| EP3922989A4 (en) * | 2019-02-04 | 2022-10-26 | Hitachi High-Tech Corporation | LIQUID CHROMATOGRAPH MASS SPECTROMETER |
| CN113227778A (zh) * | 2019-03-27 | 2021-08-06 | 株式会社岛津制作所 | 色谱仪质量分析装置 |
| JP2022123952A (ja) * | 2021-02-15 | 2022-08-25 | 株式会社島津製作所 | 液体クロマトグラフ |
Citations (7)
| Publication number | Priority date | Publication date | Assignee | Title |
|---|---|---|---|---|
| JPS63135854A (ja) * | 1986-11-28 | 1988-06-08 | Hitachi Ltd | 質量分析装置 |
| JPS63168960A (ja) * | 1986-12-29 | 1988-07-12 | Shimadzu Corp | 4重極質量分析計の走査方法 |
| JPH10185873A (ja) * | 1996-12-26 | 1998-07-14 | Shimadzu Corp | 質量分析装置 |
| JP2000131284A (ja) | 1998-08-20 | 2000-05-12 | Shimadzu Corp | クロマトグラフ質量分析装置 |
| JP2005221276A (ja) * | 2004-02-04 | 2005-08-18 | Shimadzu Corp | クロマトグラフ質量分析用データ処理装置 |
| US20100213368A1 (en) * | 2009-02-22 | 2010-08-26 | Xin Wang | Precise and thorough background subtraction |
| JP2013228295A (ja) * | 2012-04-26 | 2013-11-07 | Shimadzu Corp | クロマトグラフ質量分析用データ処理装置 |
Family Cites Families (12)
| Publication number | Priority date | Publication date | Assignee | Title |
|---|---|---|---|---|
| US5668373A (en) * | 1996-04-26 | 1997-09-16 | Trustees Of Tufts College | Methods and apparatus for analysis of complex mixtures |
| JP3317221B2 (ja) * | 1997-11-28 | 2002-08-26 | 株式会社島津製作所 | プロセスガス監視装置 |
| US7409298B2 (en) * | 2002-04-12 | 2008-08-05 | Northeastern University | Matched filtration with experimental noise determination for denoising, peak picking and quantitation in LC-MS |
| US9859105B2 (en) * | 2006-02-14 | 2018-01-02 | Excellims Corporation | Multiple ion gate method and apparatus |
| JP2012145382A (ja) * | 2011-01-07 | 2012-08-02 | Shimadzu Corp | 液体クロマトグラフ分析装置 |
| CA2825280A1 (en) * | 2011-01-21 | 2012-07-26 | Massdefect Technologies, Llc | Background subtraction-mediated data-dependent acquisition |
| JP6115288B2 (ja) * | 2012-04-27 | 2017-04-19 | 株式会社島津製作所 | 質量分析におけるピーク検出方法及びそのシステム |
| JP6221800B2 (ja) * | 2014-02-12 | 2017-11-01 | 株式会社島津製作所 | クロマトグラフ質量分析装置用データ処理装置 |
| US9490115B2 (en) * | 2014-12-18 | 2016-11-08 | Thermo Finnigan Llc | Varying frequency during a quadrupole scan for improved resolution and mass range |
| US9869662B2 (en) * | 2014-06-19 | 2018-01-16 | Shimadzu Corporation | Chromatograph/mass spectrometer data processing device |
| US10768151B2 (en) * | 2014-09-16 | 2020-09-08 | Waters Technologies Corporation | Techniques for display and processing of mass spectral data |
| US9960027B2 (en) * | 2016-05-25 | 2018-05-01 | Thermo Finnigan Llc | Analyzing a complex sample by MS/MS using isotopically-labeled standards |
-
2016
- 2016-06-28 CN CN201680087362.6A patent/CN109416342B/zh active Active
- 2016-06-28 US US16/307,650 patent/US10935528B2/en active Active
- 2016-06-28 EP EP16907244.4A patent/EP3477293A4/en not_active Withdrawn
- 2016-06-28 JP JP2018524618A patent/JP6665933B2/ja active Active
- 2016-06-28 WO PCT/JP2016/069124 patent/WO2018003011A1/ja active Application Filing
Patent Citations (7)
| Publication number | Priority date | Publication date | Assignee | Title |
|---|---|---|---|---|
| JPS63135854A (ja) * | 1986-11-28 | 1988-06-08 | Hitachi Ltd | 質量分析装置 |
| JPS63168960A (ja) * | 1986-12-29 | 1988-07-12 | Shimadzu Corp | 4重極質量分析計の走査方法 |
| JPH10185873A (ja) * | 1996-12-26 | 1998-07-14 | Shimadzu Corp | 質量分析装置 |
| JP2000131284A (ja) | 1998-08-20 | 2000-05-12 | Shimadzu Corp | クロマトグラフ質量分析装置 |
| JP2005221276A (ja) * | 2004-02-04 | 2005-08-18 | Shimadzu Corp | クロマトグラフ質量分析用データ処理装置 |
| US20100213368A1 (en) * | 2009-02-22 | 2010-08-26 | Xin Wang | Precise and thorough background subtraction |
| JP2013228295A (ja) * | 2012-04-26 | 2013-11-07 | Shimadzu Corp | クロマトグラフ質量分析用データ処理装置 |
Non-Patent Citations (1)
| Title |
|---|
| See also references of EP3477293A4 |
Cited By (6)
| Publication number | Priority date | Publication date | Assignee | Title |
|---|---|---|---|---|
| GB2586376B (en) * | 2018-04-18 | 2023-03-29 | Agilent Technologies Inc | Analysis of blank runs for chromatograph performance |
| CN112601958A (zh) * | 2018-08-30 | 2021-04-02 | 英国质谱公司 | 质量校正 |
| US11823882B2 (en) | 2018-08-30 | 2023-11-21 | Micromass Uk Limited | Mass correction |
| CN112601958B (zh) * | 2018-08-30 | 2024-01-26 | 英国质谱公司 | 质量校正 |
| WO2020110583A1 (ja) * | 2018-11-29 | 2020-06-04 | 株式会社島津製作所 | 有害物質分析システム及び有害物質分析用プログラム |
| WO2023054125A1 (ja) * | 2021-10-01 | 2023-04-06 | 株式会社日立ハイテク | 液体クロマトグラフ質量分析装置の制御方法 |
Also Published As
| Publication number | Publication date |
|---|---|
| US20190170712A1 (en) | 2019-06-06 |
| JPWO2018003011A1 (ja) | 2018-11-29 |
| EP3477293A4 (en) | 2019-07-10 |
| CN109416342B (zh) | 2022-02-01 |
| JP6665933B2 (ja) | 2020-03-13 |
| CN109416342A (zh) | 2019-03-01 |
| EP3477293A1 (en) | 2019-05-01 |
| US10935528B2 (en) | 2021-03-02 |
Similar Documents
| Publication | Publication Date | Title |
|---|---|---|
| WO2018003011A1 (ja) | 分析装置 | |
| EP2798664B1 (en) | Use of windowed mass spectrometry data for retention time determination or confirmation | |
| Picó et al. | Identification of unknown pesticides in fruits using ultra-performance liquid chromatography–quadrupole time-of-flight mass spectrometry: Imazalil as a case study of quantification | |
| US7985948B2 (en) | Systems and methods for analyzing substances using a mass spectrometer | |
| US11215589B2 (en) | Data analyzer for chromatograph mass spectrometry | |
| He et al. | Wide-scope screening and quantification of 50 pesticides in wine by liquid chromatography/quadrupole time-of-flight mass spectrometry combined with liquid chromatography/quadrupole linear ion trap mass spectrometry | |
| JP6048590B2 (ja) | 包括的2次元クロマトグラフ用データ処理装置 | |
| US10818485B2 (en) | Multidimensional mass spectrometry data processing device | |
| JP6176334B2 (ja) | 質量分析方法、質量分析装置、及び質量分析データ処理プログラム | |
| US9583323B2 (en) | Use of variable XIC widths of TOF-MSMS data for the determination of background interference in SRM assays | |
| US11209406B2 (en) | Data processing device | |
| EP3605077B1 (en) | Mass spectrometer and chromatographic mass spectrometer | |
| WO2018154400A1 (en) | Physical isolation of adducts and other complicating factors in precursor ion selection for ida | |
| US9823228B2 (en) | Chromatograph mass spectrometer and control method therefor | |
| WO2020059144A1 (ja) | 質量分析装置及び質量分析方法 | |
| JP2019124610A (ja) | クロマトグラフ質量分析装置 | |
| CN114509511A (zh) | 色谱仪质量分析装置 | |
| Wang | Investigation of Deconvolution Approaches in GC-MS Metabolomics Studies | |
| JP2022066655A (ja) | 質量分析を用いた試料分析方法及び試料分析システム | |
| CN115516302A (zh) | 色谱质量分析数据处理方法、色谱质量分析装置以及色谱质量分析数据处理用程序 |
Legal Events
| Date | Code | Title | Description |
|---|---|---|---|
| WWE | Wipo information: entry into national phase |
Ref document number: 2018524618 Country of ref document: JP |
|
| 121 | Ep: the epo has been informed by wipo that ep was designated in this application |
Ref document number: 16907244 Country of ref document: EP Kind code of ref document: A1 |
|
| NENP | Non-entry into the national phase |
Ref country code: DE |
|
| ENP | Entry into the national phase |
Ref document number: 2016907244 Country of ref document: EP Effective date: 20190128 |