WO2017170984A1 - 施肥マップ作成方法と施肥マップ作成システムと施肥マップ作成装置と施肥マップ作成プログラム - Google Patents
施肥マップ作成方法と施肥マップ作成システムと施肥マップ作成装置と施肥マップ作成プログラム Download PDFInfo
- Publication number
- WO2017170984A1 WO2017170984A1 PCT/JP2017/013539 JP2017013539W WO2017170984A1 WO 2017170984 A1 WO2017170984 A1 WO 2017170984A1 JP 2017013539 W JP2017013539 W JP 2017013539W WO 2017170984 A1 WO2017170984 A1 WO 2017170984A1
- Authority
- WO
- WIPO (PCT)
- Prior art keywords
- area
- fertilization
- growth
- map
- unit
- Prior art date
- Legal status (The legal status is an assumption and is not a legal conclusion. Google has not performed a legal analysis and makes no representation as to the accuracy of the status listed.)
- Ceased
Links
Images



Classifications
-
- A—HUMAN NECESSITIES
- A01—AGRICULTURE; FORESTRY; ANIMAL HUSBANDRY; HUNTING; TRAPPING; FISHING
- A01C—PLANTING; SOWING; FERTILISING
- A01C21/00—Methods of fertilising, sowing or planting
- A01C21/007—Determining fertilization requirements
-
- A—HUMAN NECESSITIES
- A01—AGRICULTURE; FORESTRY; ANIMAL HUSBANDRY; HUNTING; TRAPPING; FISHING
- A01C—PLANTING; SOWING; FERTILISING
- A01C21/00—Methods of fertilising, sowing or planting
-
- A—HUMAN NECESSITIES
- A01—AGRICULTURE; FORESTRY; ANIMAL HUSBANDRY; HUNTING; TRAPPING; FISHING
- A01C—PLANTING; SOWING; FERTILISING
- A01C21/00—Methods of fertilising, sowing or planting
- A01C21/005—Following a specific plan, e.g. pattern
-
- G—PHYSICS
- G01—MEASURING; TESTING
- G01N—INVESTIGATING OR ANALYSING MATERIALS BY DETERMINING THEIR CHEMICAL OR PHYSICAL PROPERTIES
- G01N33/00—Investigating or analysing materials by specific methods not covered by groups G01N1/00 - G01N31/00
- G01N33/02—Food
- G01N33/025—Fruits or vegetables
-
- G—PHYSICS
- G01—MEASURING; TESTING
- G01S—RADIO DIRECTION-FINDING; RADIO NAVIGATION; DETERMINING DISTANCE OR VELOCITY BY USE OF RADIO WAVES; LOCATING OR PRESENCE-DETECTING BY USE OF THE REFLECTION OR RERADIATION OF RADIO WAVES; ANALOGOUS ARRANGEMENTS USING OTHER WAVES
- G01S19/00—Satellite radio beacon positioning systems; Determining position, velocity or attitude using signals transmitted by such systems
- G01S19/01—Satellite radio beacon positioning systems transmitting time-stamped messages, e.g. GPS [Global Positioning System], GLONASS [Global Orbiting Navigation Satellite System] or GALILEO
- G01S19/13—Receivers
-
- G—PHYSICS
- G06—COMPUTING OR CALCULATING; COUNTING
- G06Q—INFORMATION AND COMMUNICATION TECHNOLOGY [ICT] SPECIALLY ADAPTED FOR ADMINISTRATIVE, COMMERCIAL, FINANCIAL, MANAGERIAL OR SUPERVISORY PURPOSES; SYSTEMS OR METHODS SPECIALLY ADAPTED FOR ADMINISTRATIVE, COMMERCIAL, FINANCIAL, MANAGERIAL OR SUPERVISORY PURPOSES, NOT OTHERWISE PROVIDED FOR
- G06Q10/00—Administration; Management
- G06Q10/06—Resources, workflows, human or project management; Enterprise or organisation planning; Enterprise or organisation modelling
- G06Q10/063—Operations research, analysis or management
- G06Q10/0631—Resource planning, allocation, distributing or scheduling for enterprises or organisations
- G06Q10/06315—Needs-based resource requirements planning or analysis
-
- G—PHYSICS
- G06—COMPUTING OR CALCULATING; COUNTING
- G06Q—INFORMATION AND COMMUNICATION TECHNOLOGY [ICT] SPECIALLY ADAPTED FOR ADMINISTRATIVE, COMMERCIAL, FINANCIAL, MANAGERIAL OR SUPERVISORY PURPOSES; SYSTEMS OR METHODS SPECIALLY ADAPTED FOR ADMINISTRATIVE, COMMERCIAL, FINANCIAL, MANAGERIAL OR SUPERVISORY PURPOSES, NOT OTHERWISE PROVIDED FOR
- G06Q50/00—Information and communication technology [ICT] specially adapted for implementation of business processes of specific business sectors, e.g. utilities or tourism
- G06Q50/02—Agriculture; Fishing; Forestry; Mining
Definitions
- This invention relates to a fertilization map creation method, a fertilization map creation system, a fertilization map creation device, and a fertilization map creation program.
- fertilizer is applied in advance before sowing seeds, so that the seeds are sown after making the soil suitable for crops.
- Fertilization is performed using, for example, a fertilizer spreader mounted on a tractor (see Patent Document 1).
- An object of the present invention is to provide a fertilization map creation method and a fertilization map creation for creating a fertilization map in which a good and bad place can be accurately understood before seeding, and an appropriate amount of fertilization according to the place is known.
- the object is to provide a system, a fertilization map creation device, and a fertilization map creation program.
- the fertilization map creation method of the present disclosure obtains the past growth state of each area of the field set in advance based on the past growth data at each position of the field, and determines the seed according to the past growth state of each area.
- the fertilization amount of each area to be fertilized before sowing is obtained, and a fertilization map indicating the fertilization amount of each area of the field is created based on the fertilization amount.
- the fertilization map creation system of the present disclosure includes a growth sensor and a GPS device mounted on a tractor, A storage unit for storing the growth data detected by the growth sensor and the position data of the tractor detected by the GPS device as past data, and based on the growth data and the position data stored in the storage unit; A fertilization map creation system for creating a fertilization map While traveling the tractor in the field, the position data and growth data of each position in the field are accumulated in the storage unit, Based on the growth data at each position accumulated in the storage unit, a growth state calculation unit for obtaining the growth state of each area of the field set in advance, Based on the growth state of each area determined by the growth state calculation unit, a fertilization amount calculation unit for determining the fertilization amount of each area to be fertilized before sowing seeds; And a map creation unit that creates the fertilization map indicating the fertilization amount of each area obtained by the fertilization amount calculation unit.
- the fertilization map creation device of the present disclosure is a storage unit that accumulates past growth data at each position in a field, and a fertilization map creation device that creates a fertilization map based on the growth data accumulated at each location stored in the storage unit.
- a growth state calculation unit for obtaining the growth state of each area of the field set in advance
- a fertilization amount calculation unit for determining the fertilization amount of each area to be fertilized before sowing seeds
- a map creation unit that creates the fertilization map indicating the fertilization amount of each area obtained by the fertilization amount calculation unit.
- the fertilization map creation program of the present disclosure is a computer that creates a fertilization map indicating the fertilization amount of each area according to the growth state of each area of the field.
- a growth state calculation means for obtaining a growth state of each area of the field set in advance, Based on the growth state of each area determined by the growth state calculation means, fertilization amount calculation means for determining the fertilization amount of each area to be fertilized before sowing seeds; It is for functioning as a map creation means for creating the fertilization map indicating the fertilization amount of each area obtained by the fertilization amount calculation means.
- Fig. 1 shows the configuration of a fertilization map creation system.
- the fertilization map creation system 10 includes a growth sensor 21 and a GPS device 22 mounted on the tractor 20, a personal computer (personal computer) 30 that is a computer, and a display device (display unit) 40.
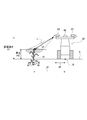
- the growth sensor 21 includes a laser distance measuring device 23.
- the laser distance measuring device 23 obtains a distance L to the grass Q, and obtains a plant height H2 of the grass Q from the distance L. This plant height H2 is obtained as a growing state.
- the plant height H2 is obtained by the following formula.
- H2 H1-L ⁇ sin ⁇
- L is the distance to the grass Q determined by the laser distance measuring device 23
- H1 is the height from the ground S to the laser distance measuring device 23.
- the laser distance measuring device 23 is used as the growth sensor 21, but the present invention is not limited thereto, and for example, a plant sensor described in Japanese Patent Application Laid-Open No. 2012-247235 may be used.
- the tractor 20 is equipped with a fertilizer application device 27 that can adjust the application amount and a display unit 24 that displays a fertilization map, which will be described later, and can apply fertilizer based on the fertilization map displayed on the display unit 24. It is like that.
- Reference numeral 25 denotes a control unit that controls the fertilizer spraying device 27 and the transmission / reception unit 26.
- the growth data detected by the growth sensor 21 and the position data detected by the GPS device 22 are wirelessly transmitted to the personal computer 30 by the transmission / reception unit 26.
- the personal computer 30 includes a transmission / reception unit 36 that receives growth data and position data transmitted from the transmission / reception unit 26, and a growth information storage unit (storage) that stores (accumulates) growth data and position data received by the transmission / reception unit 36.
- Unit) 31 a terrain memory 32 storing the terrain and position of the field E shown in FIG. 3, a sorting processing unit 33, a calculation processing unit 34, a map creating unit (map creating means) 35, and the like. Yes.
- the growth information storage unit 31 and the terrain memory 32 are provided in the personal computer 30 for convenience of explanation, but actually use a cloud database or the like performed via the Internet.
- the classification processing unit 33 divides the terrain data stored in the terrain memory 32 into a plurality of areas as shown in FIG. 6, and corresponds the position data and the growth information accumulated in the growth information accumulation unit 31 to the position data.
- the area is sorted into past areas (by measurement period), and the growth data for each area is stored in the memory 33M. That is, the growth data is stored in the memory 33M for each area and for each past.
- the arithmetic processing unit 34 obtains the average value of the growth data in the area for each area for each past, and standardizes the average value for each area for each past. That is, the growth state of each area is obtained for each past. Furthermore, while calculating the average value (growth state) of the values standardized for each past for each area, the amount of fertilizer to be fertilized in each area based on the growth state which is the average value obtained for each area, that is, The amount of fertilizer to be basic fertilized is determined for each area.
- the arithmetic processing part 34 is as a growth state calculating part (growth state calculating means) which calculates
- the map creation unit 35 creates a fertilization map that is a distribution diagram showing the fertilization amount of each area obtained by the arithmetic processing unit 34.
- the created fertilization map is displayed on the display device 40, and data of the fertilization map is transmitted to the tractor 20 by the transmission / reception unit 36.
- the fertilization map creation apparatus which creates a fertilization map with the growth information storage part 31, the classification
- the fertilizer map data is stored in a memory (not shown) of the tractor 20, and the fertilizer map is displayed on the display unit 24 of the tractor 20.
- the display unit 24 displays the position of the tractor 20 on the fertilization map based on position data detected by the GPS device.
- Step 1 the growth data and the position data detected by the growth sensor 21 and the GPS device 22 are collected while being moved in the field E by the tractor 20.
- the collected data is taken into the growth information storage unit 31 of the personal computer 30.
- the growth information storage unit 31 stores the growth state detected by the growth sensor 21 and the position data detected by the GPS device 22 at the time of detection as a set of data.
- FIG. 2 there is a difference between the position of the tractor 20 and the position of the grass Q of the plant height H2 detected by the growth sensor 21, but the position D of the tractor 20 from the mounting position of the laser distance measuring device 23.
- the distance J2 to (the mounting position of the GPS device 22 in the horizontal direction) is known, and the distance J1 from the position of the tractor 20 to the position of the grass Q can be accurately obtained.
- the position of the grass Q will be described as the position D of the tractor 20.
- the collected data includes, for example, growth data and position data of the crop U1 cultivated the first time (for example, spring) in the field E, and growth data and position of the crop U2 cultivated the second time (for example, autumn) in the field E.
- the data and the growth data and position data of the crop U3 cultivated in the field E for the third time for example, the spring of the following year.
- the crops U1 to U3 are different from each other.
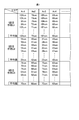
- step 2 the growth data is sorted for each area of the field E based on the position data stored in the growth information storage unit 31. For example, as shown in Table 1 of FIG. 5, in the crop U1 cultivated for the first time, all the growth data detected in the areas An1, An2, An3,. Record it. Similarly, for the crops U2, U3 cultivated in the second and third times, all the growth data detected in the areas An1, An2, An3,... Are recorded in the respective areas An1, An2, An3,. Go. That is, the growth data is sorted and recorded by past and area.
- the areas are a plurality of areas A1, A2 surrounded by the grid lines Gx, Gy by drawing a plurality of grid lines Gx, Gy at equal intervals along the latitude direction and the longitude direction on the field E. , A3... An1, An2, An3, An4.
- the vertical and horizontal sizes of each area A1, A2, A3... An1, An2, An3, An4... are set to 5 m, for example.
- step 3 the average value of growth in each area is determined for each past.
- Table 1 of FIG. Table 1 in FIG. 5 shows an average value of the areas An1, An2, An3, An4,... Of the first to third crops U1 to U3.
- the average value of the first area An1, An2, An3, An4 ... is 100cm, 73cm, 107cm, 90cm ...
- the average value of the second area An1, An2, An3, An4 is 50cm, 42cm, 32cm, 45cm, third time
- the average values of the areas An1, An2, An3, and An4 are 70 cm, 60 cm, 72 cm, and 65 cm.
- the average value of each area is standardized by past.
- the average value of the entire field E is obtained from the average value of each area for the first time. That is, a value obtained by dividing the total of the average values of each area by the number of areas of the field E is obtained.
- the average value of the entire first field E is 100 cm
- step 4 the growth state is obtained for each past and each area.
- step 5 it is determined whether there is an area where the difference between the standardized values is extremely large between the first and second times, the second and third times, or the first and third times. That is, it is determined whether there is an area where the difference is greater than a predetermined value.
- a predetermined value For example, if the difference between the first time and the second time is 0.43 in the area An3, for example, if the predetermined value is “0.4”, it is determined as YES and the process proceeds to Step 6.
- step 6 an area where the difference between the standardized values is larger than a predetermined value, such as area An3, is extracted.
- the extraction of this area is performed by the arithmetic processing unit 34, and functions as a first extracting means (first area extracting means) for extracting an area where the difference in the growth state compared by the past by the arithmetic processing unit 34 is extremely large. have.
- step 7 the area extracted in step 6 has a very bad land condition, so a special fertilization plan corresponding to this condition is created.
- This fertilization plan is carried out by farmers.
- the fertilization plan map which displays the extracted area in red, for example is created.
- step 8 find the average value for 3 times in each area with little fluctuation.
- Table 1 shown in FIG. 5 an average value for three times for each of the areas An1, An2, and An4 excluding the area An3 having a large variation is obtained. If it is determined NO in step 5 and the process proceeds to step 8, an average value for each area is obtained.
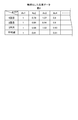
- the average value in Table 2 in FIG. 7 shows the average value for three times for each area An1, An2, and An4.
- step 9 it is determined from the average value obtained in step 8 whether there is an extremely bad growth area. That is, it is determined whether or not there is an area where the growth is extremely bad three times.
- step 10 areas with extremely poor growth are extracted.
- This area is an area where, for example, drainage and sunlight are bad, and thus the growth becomes extremely bad.
- the extraction of the area is performed by the arithmetic processing unit 34, and the arithmetic processing unit 34 has a function as a second extracting unit (second area extracting unit) for extracting an area where the growth state is extremely bad.
- step 11 since the area extracted in step 10 is in a very bad state, a special fertilization plan according to the land is created. This fertilization plan is carried out by farmers. Moreover, in order to show the area
- step 12 in an area where a normal growth state can be expected, that is, in areas An1 and An4 of Table 2 shown in FIG. A fertilization plan map is created.
- the fertilization plan map is created by comparing a preset index indicating the amount of fertilization with the average value of standardized growth data. For example, index values of 0.89 to 0.94, 0.95 to 1.05, 1.06 to 1.11, and the like are provided in advance, and the index values of 0.89 to 0.94 and 0.96 are respectively provided. Fertilization amounts V1, V2, V3, and V4 are set corresponding to 95 to 1.05, 1.06 to 1.11, and 1.12 to 1.17. However, V1> V2> V3> V4.
- the average value of the growth data standardized in the area An1 is “1” as shown in Table 2 of FIG. 7, it falls within the index value range of 0.95 to 1.05, and the fertilization amount in the area An1 is Set to V2.
- the average value of the standardized growth data of area An4 is “0.91”, it falls within the index value range of 0.89 to 0.94, and the fertilization amount is set to V1.
- the colors according to these fertilization amounts V1 to V4 for example, the fertilization amount V1 is displayed in dark green, the fertilization amount V2 is green, the fertilization amount V3 is light green, and the fertilization amount V4 is displayed in lighter green (very light green)
- a fertilization plan map which is the applied fertilization map, is created.
- step 13 the fertilization plan map created in steps 7, 11, and 12 is synthesized to create a basic fertilization plan map that is a fertilization map.
- a basic fertilizer application plan map MP is created as shown in FIG.
- the basic fertilizer application plan map MP displays areas with large growth fluctuations in red, displays poor growth areas in yellow, and displays normal growth areas in green. And, within the normal growth range, areas with a little bad growth are displayed in dark green, areas with good growth are displayed in light green, and areas with good growth are displayed in very light green, A darker green color means more fertilizer.
- a white part shows areas other than the agricultural field E, and the purple area K1 shows a test area, for example, and is a preset area.
- step 14 the basic fertilizer application plan map MP shown in FIG. 6 is displayed on the display unit 40 and stored in a memory (not shown).
- the basic fertilizer application plan map MP By displaying the basic fertilizer application plan map MP on the display device 40, it is possible to know which area of the field E is good or bad even before seeding, and the fluctuation in growth is extremely large depending on the year or season. You will be able to see the areas that grow and the areas that grow extremely badly. In addition, the amount of fertilizer applied for each area can be understood.
- the data of the basic fertilizer application plan map MP stored in the memory is transmitted to the tractor 20 by the transmission / reception unit 36.
- This transmission is performed by radio or the like, but may be performed by connecting a signal line.
- the control unit 25 stores the data of the basic fertilization application plan map MP in a memory (not shown).
- the basic fertilizer application plan map MP is displayed on the display unit 24 based on the data of the basic fertilizer application plan map MP stored in the memory. Further, the position of the tractor 20 is displayed on the basic fertilizer application plan map MP of the display unit 24 based on the position information obtained by the GPS device 22. The operator can see the amount of fertilizer to be fertilized before sowing seeds in the area at that position by looking at the position of the tractor 20 of the basic fertilization application plan map MP displayed on the display unit 24. You can fertilize the area.
- control unit 25 controls the fertilizer application device 27 based on the basic fertilizer application plan map MP, an appropriate amount of fertilizer can be automatically applied to each area of the field E, and its work efficiency Can be dramatically improved.
- the growth information storage unit 31 stores the growth state detected by the growth sensor 21 and the position data detected by the GPS device 22 at the time of detection as a set of data.
- the growth state may be stored separately for each area based on the data. In this case, the sorting processing unit 33 is not necessary.
- the growth sensor 21 and the GPS apparatus 22 are mounted in the tractor 20, it is comprised from the growth information storage part 31, the classification
- a fertilization map creation device may be installed.
Landscapes
- Life Sciences & Earth Sciences (AREA)
- Engineering & Computer Science (AREA)
- Business, Economics & Management (AREA)
- Human Resources & Organizations (AREA)
- Soil Sciences (AREA)
- Physics & Mathematics (AREA)
- General Physics & Mathematics (AREA)
- Strategic Management (AREA)
- Economics (AREA)
- Health & Medical Sciences (AREA)
- Environmental Sciences (AREA)
- Entrepreneurship & Innovation (AREA)
- Chemical & Material Sciences (AREA)
- Food Science & Technology (AREA)
- General Business, Economics & Management (AREA)
- General Health & Medical Sciences (AREA)
- Remote Sensing (AREA)
- Theoretical Computer Science (AREA)
- Tourism & Hospitality (AREA)
- Radar, Positioning & Navigation (AREA)
- Marketing (AREA)
- Operations Research (AREA)
- Medicinal Chemistry (AREA)
- Biochemistry (AREA)
- Game Theory and Decision Science (AREA)
- Analytical Chemistry (AREA)
- Development Economics (AREA)
- Immunology (AREA)
- Quality & Reliability (AREA)
- Pathology (AREA)
- Educational Administration (AREA)
- Computer Networks & Wireless Communication (AREA)
- Management, Administration, Business Operations System, And Electronic Commerce (AREA)
- Fertilizing (AREA)
- Agronomy & Crop Science (AREA)
- Animal Husbandry (AREA)
- Marine Sciences & Fisheries (AREA)
- Mining & Mineral Resources (AREA)
- Primary Health Care (AREA)
- Position Fixing By Use Of Radio Waves (AREA)
Abstract
Description
前記生育センサが検出した生育データと前記GPS装置が検出した前記トラクタの位置データとを過去のデータとして蓄積していく記憶部とを備え、この記憶部に蓄積された生育データ及び位置データに基づいて施肥マップを作成する施肥マップ作成システムであって、
前記トラクタを圃場内を走行させながら該圃場内の各位置の位置データ及び生育データを前記記憶部に蓄積させていき、
前記記憶部に蓄積された各位置における生育データに基づいて、予め設定した前記圃場の各エリアの生育状態を求める生育状態演算部と、
該生育状態演算部が求めた各エリアの生育状態に基づいて、種を播く前に施肥する各エリアの施肥量を求める施肥量演算部と、
該施肥量演算部が求めた各エリアの施肥量を示す前記施肥マップを作成するマップ作成部とを備えたことを特徴とする。
前記記憶部に蓄積された各位置における生育データに基づいて、予め設定した前記圃場の各エリアの生育状態を求める生育状態演算部と、
該生育状態演算部が求めた各エリアの生育状態に基づいて、種を播く前に施肥する各エリアの施肥量を求める施肥量演算部と、
該施肥量演算部が求めた各エリアの施肥量を示す前記施肥マップを作成するマップ作成部とを備えたことを特徴とする。
記憶手段に記憶された前記圃場の各位置の生育データに基づいて、予め設定した前記圃場の各エリアの生育状態を求める生育状態演算手段と、
前記生育状態演算手段が求めた各エリアの生育状態に基づいて、種を播く前に施肥する各エリアの施肥量を求める施肥量演算手段と、
前記施肥量演算手段が求めた各エリアの施肥量を示す前記施肥マップを作成するマップ作成手段として機能させるためのものである。
ただし、Lはレーザ測距装置23が求めた草Qまでの距離、H1は地上Sからレーザ測距装置23までの高さである。
[動 作]
次に、上記のように構成される施肥マップ作成システム10の動作を図4に示すフロー図に基づいて説明する。なお、フロー図は、施肥マップを作成するマップ作成プログラムの処理動作を示すものである。
Claims (12)
- 圃場の各位置における過去の生育データに基づいて、予め設定した前記圃場の各エリアの過去の生育状態を求め、この各エリアの過去の生育状態に応じて種を播く前に施肥する各エリアの施肥量を求め、この施肥量に基づいて前記圃場の各エリアの施肥量を示す施肥マップを作成することを特徴とする施肥マップ作成方法。
- 各エリアの過去別の生育状態に基づいて、過去別に比較した生育状態の差が極端に大きいエリアを抽出し、この抽出したエリアを前記施肥マップ上で示すようにしたことを特徴とする請求項1に記載の施肥マップ作成方法。
- 各エリアの過去の生育状態に基づいて、生育が極端に悪いエリアを抽出し、この抽出したエリアを前記施肥マップ上に示すようにしたことを特徴とする請求項1または請求項2に記載の施肥マップ作成方法。
- トラクタに搭載された生育センサ及びGPS装置と、
前記生育センサが検出した生育データと前記GPS装置が検出した前記トラクタの位置データとを過去のデータとして蓄積していく記憶部とを備え、この記憶部に蓄積された生育データ及び位置データに基づいて施肥マップを作成する施肥マップ作成システムであって、
前記トラクタを圃場内を走行させながら該圃場内の各位置の位置データ及び生育データを前記記憶部に蓄積させていき、
前記記憶部に蓄積された各位置における生育データに基づいて、予め設定した前記圃場の各エリアの生育状態を求める生育状態演算部と、
該生育状態演算部が求めた各エリアの生育状態に基づいて、種を播く前に施肥する各エリアの施肥量を求める施肥量演算部と、
該施肥量演算部が求めた各エリアの施肥量を示す前記施肥マップを作成するマップ作成部とを備えたことを特徴とする施肥マップ作成システム。 - 前記生育状態演算部は、過去別に前記圃場の各エリアの生育状態を求め、
この求めた過去別の生育状態に基づいて、過去別に比較した生育状態の差が極端に大きいエリアを抽出する第1エリア抽出手段と、
この第1エリア抽出手段が抽出したエリアを前記マップ作成部が作成する前記施肥マップ上に示すことを特徴とする請求項4に記載の施肥マップ作成システム。 - 前記生育状態演算部が求めた各エリアの生育状態に基づいて、生育が極端に悪いエリアを抽出する第2エリア抽出手段と、
この第2エリア抽出手段が抽出したエリアを前記施肥マップ上に示すようにしたことを特徴とする請求項4または請求項5に記載の施肥マップ作成システム。 - 前記マップ作成部が作成した前記施肥マップを表示する表示部を設けたことを特徴とする請求項4ないし請求項6のいずれか1項に記載の施肥マップ作成システム。
- 圃場の各位置における過去の生育データを蓄積した記憶部と、この記憶部に蓄積された各位置における生育データに基づいて施肥マップを作成する施肥マップ作成装置であって、
前記記憶部に蓄積された各位置における生育データに基づいて、予め設定した前記圃場の各エリアの生育状態を求める生育状態演算部と、
該生育状態演算部が求めた各エリアの生育状態に基づいて、種を播く前に施肥する各エリアの施肥量を求める施肥量演算部と、
該施肥量演算部が求めた各エリアの施肥量を示す前記施肥マップを作成するマップ作成部とを備えたことを特徴とする施肥マップ作成装置。 - 前記生育状態演算部は、過去別に前記圃場の各エリアの生育状態を求め、
この求めた過去別の生育状態に基づいて、過去別に比較した生育状態の差が極端に大きいエリアを抽出する第1エリア抽出手段と、
この第1エリア抽出手段が抽出したエリアを前記マップ作成部が作成する前記施肥マップ上に示すことを特徴とする請求項8に記載の施肥マップ作成装置。 - 前記生育状態演算部が求めた各エリアの生育状態に基づいて、生育が極端に悪いエリアを抽出する第2エリア抽出手段と、
この第2エリア抽出手段が抽出したエリアを前記施肥マップ上に示すようにしたことを特徴とする請求項8または請求項9に記載の施肥マップ作成装置。 - 前記マップ作成部が作成した前記施肥マップを表示する表示部を設けたことを特徴とする請求項8ないし請求項10のいずれか1項に記載の施肥マップ作成装置。
- 圃場の各エリアの生育状態に応じた各エリアの施肥量を示す施肥マップを作成するコンピュータを、
記憶手段に記憶された前記圃場の各位置の生育データに基づいて、予め設定した前記圃場の各エリアの生育状態を求める生育状態演算手段と、
前記生育状態演算手段が求めた各エリアの生育状態に基づいて、種を播く前に施肥する各エリアの施肥量を求める施肥量演算手段と、
前記施肥量演算手段が求めた各エリアの施肥量を示す前記施肥マップを作成するマップ作成手段として機能させるための施肥マップ作成プログラム。
Priority Applications (3)
| Application Number | Priority Date | Filing Date | Title |
|---|---|---|---|
| AU2017245116A AU2017245116A1 (en) | 2016-04-01 | 2017-03-31 | Fertilization map generation method, fertilization map generation system, fertilization map generation device, and fertilization map generation program |
| US16/090,223 US20190116725A1 (en) | 2016-04-01 | 2017-03-31 | Fertilization Map Generation Method, Fertilization Map Generation System, Fertilization Map Generation Device, and Fertilization Map Generation Program |
| AU2020217409A AU2020217409A1 (en) | 2016-04-01 | 2020-08-13 | Fertilization map generation method, fertilization map generation system, fertilization map generation device, and fertilization map generation program |
Applications Claiming Priority (2)
| Application Number | Priority Date | Filing Date | Title |
|---|---|---|---|
| JP2016-074654 | 2016-04-01 | ||
| JP2016074654A JP6823232B2 (ja) | 2016-04-01 | 2016-04-01 | 施肥マップ作成方法と施肥マップ作成システムと施肥マップ作成装置と施肥マップ作成プログラム |
Publications (1)
| Publication Number | Publication Date |
|---|---|
| WO2017170984A1 true WO2017170984A1 (ja) | 2017-10-05 |
Family
ID=59965692
Family Applications (1)
| Application Number | Title | Priority Date | Filing Date |
|---|---|---|---|
| PCT/JP2017/013539 Ceased WO2017170984A1 (ja) | 2016-04-01 | 2017-03-31 | 施肥マップ作成方法と施肥マップ作成システムと施肥マップ作成装置と施肥マップ作成プログラム |
Country Status (4)
| Country | Link |
|---|---|
| US (1) | US20190116725A1 (ja) |
| JP (1) | JP6823232B2 (ja) |
| AU (2) | AU2017245116A1 (ja) |
| WO (1) | WO2017170984A1 (ja) |
Cited By (2)
| Publication number | Priority date | Publication date | Assignee | Title |
|---|---|---|---|---|
| US11096324B2 (en) * | 2018-02-27 | 2021-08-24 | Topcon Corporation | Fertilization design device, agricultural tool, fertilization design method and fertilization design program |
| CN114786463A (zh) * | 2019-12-25 | 2022-07-22 | 株式会社久保田 | 作业机 |
Families Citing this family (23)
| Publication number | Priority date | Publication date | Assignee | Title |
|---|---|---|---|---|
| JP6948917B2 (ja) * | 2017-11-10 | 2021-10-13 | ヤンマーパワーテクノロジー株式会社 | 散布作業機 |
| JP6963763B2 (ja) * | 2018-02-08 | 2021-11-10 | ヤンマーパワーテクノロジー株式会社 | 作業支援システム |
| JP7059096B2 (ja) * | 2018-04-27 | 2022-04-25 | 株式会社クボタ | 作業機の散布支援システム |
| JP7090009B2 (ja) * | 2018-10-25 | 2022-06-23 | 三菱マヒンドラ農機株式会社 | 施肥作業機及び施肥システム |
| JP7134864B2 (ja) * | 2018-12-28 | 2022-09-12 | 株式会社クボタ | 管理機 |
| JP2020103235A (ja) * | 2018-12-28 | 2020-07-09 | 株式会社クボタ | 管理機 |
| JP2020103233A (ja) * | 2018-12-28 | 2020-07-09 | 株式会社クボタ | 管理機 |
| JP7388816B2 (ja) | 2019-01-30 | 2023-11-29 | 株式会社トプコン | 生育情報管理システム、生育情報管理システムの制御方法及び生育情報管理システムの制御プログラム |
| JP7113773B2 (ja) * | 2019-03-07 | 2022-08-05 | ヤンマーパワーテクノロジー株式会社 | 施肥マップ作成装置および施肥マップ作成方法 |
| JP7125827B2 (ja) * | 2019-03-28 | 2022-08-25 | ヤンマーパワーテクノロジー株式会社 | 作業マップ提供サーバ |
| JP7288632B2 (ja) * | 2019-08-06 | 2023-06-08 | ヤンマーパワーテクノロジー株式会社 | 生育値算出方法、および生育値算出システム |
| JP7191004B2 (ja) * | 2019-12-25 | 2022-12-16 | 株式会社クボタ | 作業機 |
| JP7411455B2 (ja) * | 2020-03-06 | 2024-01-11 | 株式会社Ihiアグリテック | 作業機 |
| US12471518B2 (en) | 2021-02-04 | 2025-11-18 | Deere & Company | Systems and methods for selective material placement, sensing, and control |
| JP2022127178A (ja) * | 2021-02-19 | 2022-08-31 | 株式会社ジョーニシ | 搭載型施肥装置 |
| WO2023060299A1 (en) * | 2021-10-12 | 2023-04-20 | Agriculture Victoria Services Pty Ltd | System and method/process for in-field measurements of plant crops |
| US12067718B2 (en) * | 2021-12-27 | 2024-08-20 | Deere & Company | Crop yield component map |
| JP7338773B1 (ja) | 2022-11-07 | 2023-09-05 | 井関農機株式会社 | 作業車両 |
| CN115226457A (zh) * | 2022-07-29 | 2022-10-25 | 驻马店市驿城区禾绿农业开发有限公司 | 应用于农机作业的田块施肥图制作方法 |
| KR20240021693A (ko) | 2022-08-10 | 2024-02-19 | 이세키노우키가부시키가이샤 | 영농 관리 시스템 |
| JP7720034B2 (ja) * | 2023-01-31 | 2025-08-07 | 井関農機株式会社 | 作業車両 |
| JP2024148589A (ja) | 2023-04-06 | 2024-10-18 | 井関農機株式会社 | 作業車両 |
| JP7679852B2 (ja) * | 2023-05-30 | 2025-05-20 | 井関農機株式会社 | 作業装置 |
Citations (3)
| Publication number | Priority date | Publication date | Assignee | Title |
|---|---|---|---|---|
| JP2002149744A (ja) * | 2000-11-09 | 2002-05-24 | Ebara Corp | 農作業管理装置及び農作業管理方法及び農作業機械 |
| JP2008278816A (ja) * | 2007-05-11 | 2008-11-20 | Atsushi Yoshida | 施肥情報管理システム,施肥情報管理システム用プログラム及び施肥情報管理システム用記録媒体。 |
| JP2011254711A (ja) * | 2010-06-05 | 2011-12-22 | Zukosha:Kk | 施肥マップ生成システム,その方法,産業用ヘリコプタ,サーバ,可変施肥機 |
-
2016
- 2016-04-01 JP JP2016074654A patent/JP6823232B2/ja active Active
-
2017
- 2017-03-31 WO PCT/JP2017/013539 patent/WO2017170984A1/ja not_active Ceased
- 2017-03-31 AU AU2017245116A patent/AU2017245116A1/en not_active Abandoned
- 2017-03-31 US US16/090,223 patent/US20190116725A1/en not_active Abandoned
-
2020
- 2020-08-13 AU AU2020217409A patent/AU2020217409A1/en not_active Abandoned
Patent Citations (3)
| Publication number | Priority date | Publication date | Assignee | Title |
|---|---|---|---|---|
| JP2002149744A (ja) * | 2000-11-09 | 2002-05-24 | Ebara Corp | 農作業管理装置及び農作業管理方法及び農作業機械 |
| JP2008278816A (ja) * | 2007-05-11 | 2008-11-20 | Atsushi Yoshida | 施肥情報管理システム,施肥情報管理システム用プログラム及び施肥情報管理システム用記録媒体。 |
| JP2011254711A (ja) * | 2010-06-05 | 2011-12-22 | Zukosha:Kk | 施肥マップ生成システム,その方法,産業用ヘリコプタ,サーバ,可変施肥機 |
Cited By (2)
| Publication number | Priority date | Publication date | Assignee | Title |
|---|---|---|---|---|
| US11096324B2 (en) * | 2018-02-27 | 2021-08-24 | Topcon Corporation | Fertilization design device, agricultural tool, fertilization design method and fertilization design program |
| CN114786463A (zh) * | 2019-12-25 | 2022-07-22 | 株式会社久保田 | 作业机 |
Also Published As
| Publication number | Publication date |
|---|---|
| AU2017245116A1 (en) | 2018-10-25 |
| JP6823232B2 (ja) | 2021-02-03 |
| JP2017184640A (ja) | 2017-10-12 |
| US20190116725A1 (en) | 2019-04-25 |
| AU2020217409A1 (en) | 2020-09-03 |
Similar Documents
| Publication | Publication Date | Title |
|---|---|---|
| JP6823232B2 (ja) | 施肥マップ作成方法と施肥マップ作成システムと施肥マップ作成装置と施肥マップ作成プログラム | |
| US12302780B2 (en) | Site-specific seed orientation | |
| US20190050947A1 (en) | Agricultural field management system | |
| AU2017316292B2 (en) | Optimizing split fertilizer application | |
| ES2942415T3 (es) | Detección automática de valores atípicos de datos de cosecha | |
| RU2699005C2 (ru) | Система и способ управления машинами для рандомизации и повторения заданных режимов применения сельскохозяйственного ресурса | |
| US11069005B2 (en) | Methods and systems for determining agricultural revenue | |
| US11272701B2 (en) | Method for remediating developmentally delayed plants | |
| UA125849C2 (uk) | Спосіб контролю роботи сільськогосподарського транспорту | |
| UA126555C2 (uk) | Спосіб управління робочими параметрами сільськогосподарського обладнання | |
| JP2019128741A (ja) | 営農システム | |
| UA126557C2 (uk) | Спосіб визначення врожайності сільськогосподарської культури на національному рівні протягом періоду вегетації із використанням погодних індексів | |
| UA123576C2 (uk) | Спосіб та система тестування ґрунту | |
| UA126552C2 (uk) | Спосіб визначення та надання рекомендації щодо норми висіву насіння рослин на полі | |
| JP6824350B2 (ja) | 圃場管理システム | |
| Schimmelpfennig | Cost savings from precision agriculture technologies on us corn farms | |
| US20210051944A9 (en) | System and method for controlling machinery for randomizing and replicating predetermined argonomic input levels | |
| CA3255117A1 (en) | COMPUTER-IMPLEMENTED METHOD FOR SEEDING, PLANTING AND/OR FERTILIZATION PURPOSES | |
| Toriyama et al. | Development of a site-specific nitrogen management system for paddy rice | |
| CA3033952C (en) | Optimizing split fertilizer application | |
| JP2024109245A (ja) | 作業計画支援システム、作業計画支援システムサーバおよび移植機 |
Legal Events
| Date | Code | Title | Description |
|---|---|---|---|
| NENP | Non-entry into the national phase |
Ref country code: DE |
|
| ENP | Entry into the national phase |
Ref document number: 2017245116 Country of ref document: AU Date of ref document: 20170331 Kind code of ref document: A |
|
| 121 | Ep: the epo has been informed by wipo that ep was designated in this application |
Ref document number: 17775516 Country of ref document: EP Kind code of ref document: A1 |
|
| 122 | Ep: pct application non-entry in european phase |
Ref document number: 17775516 Country of ref document: EP Kind code of ref document: A1 |