WO2017135167A1 - 光音響画像生成システム、装置、及び方法 - Google Patents
光音響画像生成システム、装置、及び方法 Download PDFInfo
- Publication number
- WO2017135167A1 WO2017135167A1 PCT/JP2017/002992 JP2017002992W WO2017135167A1 WO 2017135167 A1 WO2017135167 A1 WO 2017135167A1 JP 2017002992 W JP2017002992 W JP 2017002992W WO 2017135167 A1 WO2017135167 A1 WO 2017135167A1
- Authority
- WO
- WIPO (PCT)
- Prior art keywords
- signal
- photoacoustic
- power doppler
- image generation
- image
- Prior art date
- Legal status (The legal status is an assumption and is not a legal conclusion. Google has not performed a legal analysis and makes no representation as to the accuracy of the status listed.)
- Ceased
Links
Images







Classifications
-
- A—HUMAN NECESSITIES
- A61—MEDICAL OR VETERINARY SCIENCE; HYGIENE
- A61B—DIAGNOSIS; SURGERY; IDENTIFICATION
- A61B8/00—Diagnosis using ultrasonic, sonic or infrasonic waves
- A61B8/13—Tomography
Definitions
- the present invention relates to a photoacoustic image generation system, apparatus, and method, and more specifically, generates a photoacoustic image based on a detection signal of a photoacoustic wave generated when a light absorber in a subject absorbs light.
- the present invention relates to a photoacoustic image generation system, apparatus, and method.
- An ultrasonic inspection method is known as a kind of image inspection method capable of non-invasively examining the state inside a living body.
- an ultrasonic probe capable of transmitting and receiving ultrasonic waves is used.
- the ultrasonic waves travel inside the living body and are reflected at the tissue interface.
- the reflected ultrasound is received by the ultrasound probe, and the internal state can be imaged by calculating the distance based on the time it takes for the reflected ultrasound to return to the ultrasound probe. .
- photoacoustic imaging in which the inside of a living body is imaged using the photoacoustic effect.
- a living body in photoacoustic imaging, a living body is irradiated with pulsed laser light. Inside the living body, the living tissue absorbs the energy of the pulsed laser light, and ultrasonic waves (photoacoustic waves) are generated by adiabatic expansion due to the energy.
- ultrasonic waves photoacoustic waves
- Doppler measurement is known as a kind of ultrasonic inspection.
- Doppler measurement is a measurement technique that non-invasively measures hemodynamics, blood flow velocity, in-vivo trend, and the like based on the Doppler shift of the frequency of the received wave with respect to the frequency of the transmitted wave.
- Patent Document 1 describes selecting a pixel of a photoacoustic image displayed using Doppler information.
- a photoacoustic image is displayed only as a color overlay on a pixel at a position where a Doppler signal exceeds a certain threshold value.
- Patent Literature 1 since a photoacoustic image is displayed only at a position where a Doppler signal obtained by Doppler measurement exceeds a threshold value, when a blood vessel is imaged in the photoacoustic image, the image moves over a certain speed. A blood vessel image can be displayed. However, in this case, although the blood vessel in the portion where the blood flow is fast can be displayed, the blood vessel in the portion where the blood flow is slow cannot be displayed. In general, in a photoacoustic image, when a photoacoustic wave detection signal is lower than a certain signal intensity, the portion is displayed in black and is not displayed as an image. In Patent Document 1, since only the photoacoustic image at a position where the Doppler signal exceeds the threshold value is displayed, it is impossible to display the portion that is not originally imaged by the photoacoustic image.
- the present invention provides a photoacoustic image generation system, apparatus, and method capable of imaging a portion of a detection signal of a photoacoustic wave emitted from a blood vessel or the like even if the signal intensity is weak. For the purpose.
- the present invention provides a power Doppler signal generation unit that generates a power Doppler signal based on a detection signal of a reflected acoustic wave with respect to an acoustic wave transmitted in the subject, and light absorption in the subject.
- a photoacoustic signal correction unit that corrects a photoacoustic wave detection signal generated due to absorption of light emitted from a light source by a body based on a power Doppler signal, and light corrected by the photoacoustic signal correction unit
- a photoacoustic image generation apparatus including a photoacoustic image generation unit that generates a photoacoustic image based on an acoustic wave detection signal.
- the photoacoustic signal correction unit corrects the photoacoustic wave detection signal using a correction coefficient that is a function of the signal intensity of the power Doppler signal. In that case, it is preferable that the value of the correction coefficient increases monotonously as the signal strength of the power Doppler signal increases.
- the photoacoustic image generation apparatus of the present invention may further include an operation unit that changes the relationship between the signal strength of the power Doppler signal and the value of the correction coefficient in the correction coefficient.
- the photoacoustic signal correction unit may correct the detection signal of the photoacoustic wave by multiplying the detection signal of the photoacoustic wave before correction by a correction coefficient.
- the power Doppler signal generation unit may generate a power Doppler signal by orthogonally detecting the detection signal of the reflected acoustic wave.
- the photoacoustic image generation apparatus of the present invention may further include a power Doppler image generation unit that generates a power Doppler image based on the detection signal of the reflected acoustic wave.
- the power Doppler signal generation unit includes a first high-pass filter that passes a signal component in a frequency band higher than the first cutoff frequency, and the power Doppler image generation unit includes the first A second high-pass filter that passes a signal component in a frequency band higher than the cutoff frequency of 2 may be included.
- the first cutoff frequency is preferably lower than the second cutoff frequency.
- the photoacoustic image generation apparatus of the present invention may further include an image output unit that displays a photoacoustic image and a power Doppler image on a monitor screen.
- the image output unit may superimpose the photoacoustic image and the power Doppler image on the monitor screen.
- the image output unit may display the photoacoustic image and the power Doppler image side by side on the monitor screen.
- the photoacoustic image generation apparatus of the present invention may further include a reflected acoustic wave image generation unit that generates a reflected acoustic wave image based on a detection signal of the reflected acoustic wave.
- the image output unit may further display the reflected acoustic image on the monitor screen.
- the present invention also provides a photoacoustic wave generated due to a light source, an acoustic wave transmitter that transmits an acoustic wave in the subject, and a light absorber in the subject that absorbs light emitted from the light source.
- an acoustic wave receiving unit that detects a reflected acoustic wave with respect to the acoustic wave transmitted from the acoustic wave transmitting unit, a power Doppler signal generating unit that generates a power Doppler signal based on a detection signal of the reflected acoustic wave, and a photoacoustic wave
- a photoacoustic signal correction unit that corrects the detection signal based on the power Doppler signal
- a photoacoustic image generation unit that generates a photoacoustic image based on the photoacoustic wave detection signal corrected by the photoacoustic signal correction unit, and A photoacoustic image generation system is provided.
- the present invention further includes a step of generating a power Doppler signal based on a detection signal of a reflected acoustic wave with respect to an acoustic wave transmitted into the subject, and a light absorber in the subject absorbs light emitted from the light source. Correcting a photoacoustic wave detection signal generated based on the power Doppler signal, generating a photoacoustic image based on the photoacoustic wave detection signal corrected in the correcting step, and The photoacoustic image generation method which has this.
- the photoacoustic image generation system, apparatus, and method of the present invention can image a portion of a detection signal of a photoacoustic wave emitted from a blood vessel or the like even if the signal intensity is weak.
- FIG. 1 is a block diagram showing a photoacoustic image generation system according to a first embodiment of the present invention.
- the block diagram which shows the structure of a power Doppler signal generation part.
- the graph which shows the relationship between the thickness of a blood vessel and signal strength. The figure which shows arrangement
- the wave form diagram which shows the signal waveform of the detection signal in a sound ray.
- the graph which shows the correction coefficient used for correction
- the block diagram which shows the photoacoustic image generation system which concerns on 2nd Embodiment of this invention.
- the block diagram which shows a power Doppler signal generation part and a Doppler image generation part.
- the block diagram which shows the photoacoustic image generation system which concerns on 3rd Embodiment of this invention.
- FIG. 1 shows a photoacoustic image generation system according to the first embodiment of the present invention.
- the photoacoustic image generation system 10 includes a probe (ultrasonic probe) 11, an ultrasonic unit 12, and a laser unit 13.
- the photoacoustic image generation system 10 according to the present embodiment is configured to be capable of Doppler measurement.
- an ultrasonic wave is used as an acoustic wave.
- the ultrasonic wave is not limited to an ultrasonic wave, and is audible as long as an appropriate frequency is selected according to a test object, measurement conditions, and the like.
- An acoustic wave having a frequency may be used.
- the laser unit 13 is a light source and emits measurement light.
- the measurement light emitted from the laser unit 13 is guided to the probe 11 using light guide means such as an optical fiber, and is emitted from the probe 11 toward the subject.
- the laser unit 13 is a solid-state laser light source using, for example, YAG (yttrium / aluminum / garnet) or alexandrite.
- the laser unit 13 includes, for example, a flash lamp that is an excitation light source, and a Q switch for causing the laser to oscillate.
- the type of light source in the laser unit 13 is not particularly limited, and the laser unit 13 may be a laser diode light source (semiconductor laser light source), or an optically amplified laser light source using a laser diode light source as a seed light source. Also good. A light source other than the laser light source may be used.
- the wavelength of the laser beam emitted from the laser unit 13 is appropriately determined according to the light absorption characteristics of the substance in the subject to be measured.
- the wavelength of the laser light is preferably a wavelength belonging to the near-infrared wavelength region.
- the near-infrared wavelength region means a wavelength region of about 700 to 850 nm.
- the laser unit 13 may emit laser light having a single wavelength, or may emit laser light having a plurality of wavelengths. When the laser unit 13 can emit laser beams having a plurality of wavelengths, the laser unit 13 may emit laser beams having a plurality of wavelengths at the same time, or may switch and emit laser beams having a plurality of wavelengths.
- the probe 11 has, for example, a plurality of ultrasonic transducers arranged one-dimensionally.
- the probe 11 detects a photoacoustic wave emitted from a light absorber in the specimen after the subject is irradiated with the laser light emitted from the laser unit 13.
- the probe 11 transmits an acoustic wave (ultrasonic wave) to the subject and receives a reflected acoustic wave (reflected ultrasonic wave) with respect to the transmitted ultrasonic wave.
- the probe 11 serves as an acoustic wave transmission part and an acoustic wave reception part. You may perform transmission / reception of an ultrasonic wave in the separated position.
- ultrasonic waves may be transmitted from a position different from the probe 11, and reflected ultrasonic waves with respect to the transmitted ultrasonic waves may be received by the probe 11.
- the probe 11 is not limited to a linear probe, and may be a convex probe or a sector probe.
- the ultrasonic unit 12 constitutes a photoacoustic image generation apparatus.
- the ultrasonic unit 12 includes a reception circuit 21, an AD converter (Analog-to-Digital converter) 22, a reception memory 23, a photoacoustic signal correction unit 24, a power Doppler signal generation unit 25, an ultrasonic image generation unit 26, and a photoacoustic image generation.
- the ultrasonic unit 12 typically includes a processor, a memory, a bus, and the like. In the ultrasonic unit 12, a program relating to photoacoustic image generation, Doppler image generation, and ultrasonic image generation is incorporated in a memory.
- the program is operated by the control unit 30 configured by a processor, so that the photoacoustic signal correction unit 24, the power Doppler signal generation unit 25, the ultrasonic image generation unit 26, the photoacoustic image generation unit 27, and the Doppler image generation unit 28. And the function of the image output part 29 is implement
- the hardware configuration of the ultrasonic unit 12 is not particularly limited. A plurality of integrated circuits (ICs), processors, ASICs (application specific integrated circuits), FPGAs (field-programmable gate arrays), memories, etc. It can implement
- ICs integrated circuits
- processors processors
- ASICs application specific integrated circuits
- FPGAs field-programmable gate arrays
- memories etc. It can implement
- the receiving circuit 21 receives the detection signal output from the probe 11.
- the reception circuit 21 typically includes a low noise amplifier, a variable gain amplifier, and a low pass filter.
- the detection signal of the probe 11 is amplified by the low noise amplifier, and then the gain is adjusted according to the depth by the variable gain amplifier, and the high frequency component is cut by the low pass filter.
- the AD converter 22 converts the detection signal received by the receiving circuit 21, that is, the photoacoustic wave detection signal and the reflected ultrasonic detection signal detected by the probe 11, from an analog signal to a digital signal.
- the AD converter 22 stores the detection signal (sampling data) of the photoacoustic wave and the reflected ultrasonic wave subjected to AD conversion in the reception memory 23.
- the reception circuit 21 and the AD converter 22 may be configured as one IC, for example, or may be configured as individual ICs.
- the ultrasonic image generation unit (reflected acoustic wave image generation unit) 26 reads the sampling data of the detection signal of the reflected ultrasonic wave from the reception memory 23.
- the ultrasonic image generation unit 26 generates an ultrasonic image (reflected acoustic wave image) based on the detection signal (the sampling data) of the reflected ultrasonic wave.
- the ultrasonic image generation unit 26 first reconstructs a detection signal (reflection ultrasonic signal) of a reflected ultrasonic wave, and generates data of each line of the ultrasonic image.
- the reconstructed reflected ultrasound signal can be regarded as an ultrasound image.
- the ultrasonic image generation unit 26 adds data from 64 acoustic detection elements of the probe 11 with a delay time corresponding to the position of the acoustic detection element, and generates data for one line (delay addition method). .
- the ultrasonic image generation unit 26 performs, for example, envelope detection on the reconstructed reflected ultrasonic signal (ultrasonic image signal), and logarithmically converts the detected signal. Thereafter, the ultrasonic image generation unit 26 converts the ultrasonic image signal subjected to detection and logarithmic conversion into a pixel value of the display image, and generates an ultrasonic image (B-mode image). The ultrasonic image generation unit 26 generates an ultrasonic image by converting, for example, the signal intensity within a certain range of the ultrasonic image signal into a display gradation in a range from the highest luminance to the lowest luminance. The ultrasonic image generation unit 26 transmits the generated ultrasonic image to the image output unit 29.
- the power Doppler signal generation unit 25 reads the sampling data of the reflected ultrasonic detection signal from the reception memory 23.
- the power Doppler signal generation unit 25 generates a power Doppler signal based on the reflected ultrasonic detection signal (its sampling data).
- FIG. 2 shows a configuration of the power Doppler signal generation unit 25.
- the power Doppler signal generation unit 25 includes a reception beam former 251, a detector 252, a high pass filter (HPF) 253, and a power calculator 254.
- the reception beamformer 251 performs phasing addition on each of the reflected ultrasonic detection signals obtained by transmitting and receiving ultrasonic waves having a packet size of about 10 times, for example.
- the detector 252 detects the reflected ultrasonic signal subjected to phasing addition. For example, the detector 252 performs orthogonal detection on the reflected ultrasonic signal. By performing quadrature detection, an I signal and a Q signal are obtained. Instead of quadrature detection, the reflected ultrasonic signal may be detected by envelope detection.
- the high-pass filter 253 performs high-pass filter processing on each transmission / reception I signal and Q signal. By passing through the high-pass filter, a relatively low frequency signal component that is a clutter component is removed, and a blood flow component that is a higher frequency component is extracted.
- the high pass filter 253 is also called a wall motion filter.
- the power calculator 254 calculates the signal value of the power Doppler signal based on the I signal and Q signal that have been subjected to the high-pass filter processing. More specifically, the power calculator 254 calculates the signal value of the power Doppler signal by calculating the sum of the square of the I signal and the square of the Q signal.
- the power Doppler signal generation unit 25 transmits the generated power Doppler signal to the photoacoustic signal correction unit 24 and the Doppler image generation unit 28.
- the Doppler image generation unit (power Doppler image generation unit) 28 generates a power Doppler image based on the detection signal of the reflected ultrasound.
- the Doppler image generation unit 28 generates a power Doppler image based on the power Doppler signal generated by the power Doppler signal generation unit 25.
- the Doppler image generation unit 28 generates a power Doppler image by converting the signal intensity within a certain range of the power Doppler signal into a display gradation in the range from the highest luminance to the lowest luminance.
- the Doppler image generation unit 28 transmits the generated power Doppler image to the image output unit 29.
- the photoacoustic signal correction unit 24 reads the sampling data of the photoacoustic wave detection signal from the reception memory 23. In addition, the power Doppler signal is received from the power Doppler signal generation unit 25. The photoacoustic signal correction unit 24 corrects the photoacoustic wave detection signal (its sampling data) based on the power Doppler signal. The photoacoustic signal correction unit 24 corrects the photoacoustic wave detection signal (photoacoustic signal) using a correction coefficient that is a function of the signal intensity of the power Doppler signal, for example. The photoacoustic signal correction unit 24 corrects the photoacoustic signal, for example, by multiplying the photoacoustic signal before correction by a correction coefficient. The value of the correction coefficient increases monotonously as the power Doppler signal increases, for example.
- the photoacoustic image generation unit 27 generates a photoacoustic image based on the photoacoustic signal corrected by the photoacoustic signal correction unit 24. For example, the photoacoustic image generation unit 27 first reconstructs a photoacoustic signal and generates data for each line of the photoacoustic image. The reconstructed photoacoustic signal can be regarded as a photoacoustic image. The photoacoustic image generation unit 27 reconstructs the photoacoustic signal using, for example, a delay count method. The photoacoustic image generation unit 27 may perform reconstruction by a CBP method (Circular Back Projection) instead of the delay addition method. Alternatively, the photoacoustic image generation unit 27 may perform reconstruction using a Hough transform method or a Fourier transform method.
- CBP method Chemical Back Projection
- the photoacoustic image generation unit 27 performs, for example, envelope detection on the reconstructed photoacoustic signal (photoacoustic image signal), and logarithmically converts the detected signal. Thereafter, the photoacoustic image generation unit 27 converts the photoacoustic image signal that has been detected and logarithmically converted into a pixel value of the display image, and generates a photoacoustic image. For example, the photoacoustic image generation unit 27 generates a photoacoustic image by converting the signal intensity within a certain range of the photoacoustic image signal into a display gradation in a range from the highest luminance to the lowest luminance. The photoacoustic image generation unit 27 transmits the generated photoacoustic image to the image output unit 29.
- the image output unit 29 displays the photoacoustic image, the ultrasonic image, and the power Doppler image on the image display device 14 such as a display device.
- the image output unit 29 superimposes a photoacoustic image and a power Doppler image on the monitor screen of the image display device 14.
- the image output unit 29 may display the photoacoustic image and the power Doppler image side by side on the monitor screen of the image display device 14.
- the image output unit 29 may further display the ultrasonic image on the monitor screen of the image display device 14 by superimposing the photoacoustic image and the power Doppler image or arranging the photoacoustic image and the power Doppler image side by side.
- the image output unit 29 may switch and display the photoacoustic image, the power Doppler image, and the ultrasonic image on the monitor screen of the image display device 14.
- the control unit 30 controls each unit in the ultrasonic unit 12. For example, when acquiring a photoacoustic image, the control unit 30 transmits a trigger signal to the laser unit 13 to emit laser light from the laser unit 13.
- the trigger signal includes, for example, an excitation trigger signal for emitting excitation light to the laser medium in the laser unit 13 and a Q switch trigger signal for causing the laser to perform Q switch oscillation.
- the control unit 30 transmits a sampling trigger signal to the receiving circuit 21 in accordance with the emission of the laser light, and controls the photoacoustic wave sampling start timing and the like.
- the control unit 30 When acquiring an ultrasonic image, the control unit 30 transmits an ultrasonic transmission trigger signal to the transmission control circuit 31 to instruct ultrasonic transmission. When receiving the ultrasonic transmission trigger signal, the transmission control circuit 31 transmits ultrasonic waves from the probe 11. The control unit 30 transmits a sampling trigger signal to the receiving circuit 21 in synchronization with the timing of ultrasonic transmission, and starts sampling of reflected ultrasonic waves. The control unit 30 performs ultrasonic transmission / reception a plurality of times when performing Doppler measurement.
- the sample points with strong signal strength of the power Doppler signal are points included in the blood vessel region. Conversely, it can be estimated that a sample point with a low signal strength of the power Doppler signal is unlikely to be a point included in the blood vessel region.
- the signal strength of the power Doppler signal at each sample point is generated in the generation of the photoacoustic image. Use this to correct the photoacoustic signal.
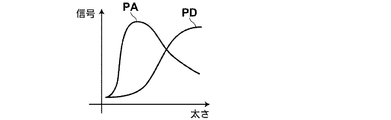
- FIG. 3 shows the relationship between the thickness of the blood vessel and the signal intensity.
- the horizontal axis represents the thickness of the blood vessel, and the vertical axis represents the signal intensity of the photoacoustic signal and the power Doppler signal.
- the graph PA shows the relationship between the thickness of the blood vessel in the photoacoustic signal and the detection signal of the photoacoustic wave emitted from the blood vessel of that thickness.
- Graph PD shows the relationship between the thickness of the blood vessel in the power Doppler signal and the power Doppler signal extracted from the blood vessel of that thickness.
- the photoacoustic signal tends to have a high signal intensity when the thickness of the blood vessel is relatively thin.
- the signal intensity of the photoacoustic signal decreases.
- the signal intensity of the photoacoustic signal is high in the vessel wall (edge) portion of the blood vessel, but the signal strength is low in the central portion of the blood vessel.
- the signal strength of the power Doppler signal is low when the blood vessel is relatively thin.
- the power Doppler signal tends to increase in signal strength as the blood vessel becomes thicker.
- FIG. 4 shows the arrangement of blood vessels in the subject.
- a blood vessel V1 a blood vessel V2, and a blood vessel V3 are arranged in this order from the body surface S of the subject to the depth direction of the subject.
- the blood vessel V1 and the blood vessel V2 are blood vessels having a relatively small diameter
- the blood vessel V3 is a blood vessel having a large blood vessel.
- a sound ray L passing near the center of each blood vessel is considered.
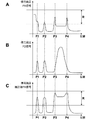
- FIG. 5 shows a signal waveform of a detection signal in the sound ray L.
- FIG. 5A shows the signal waveform of the detected photoacoustic signal (PA signal)
- B shows the signal waveform of the power Doppler signal (PD signal)
- C shows the photoacoustic signal after correction (PA signal after correction).
- a signal waveform is shown.
- the position P1 corresponds to the position on the sound ray L of the blood vessel V1 (see FIG. 4)
- the position P2 corresponds to the position on the sound line L of the blood vessel V2.
- the position P3 corresponds to the position on the sound ray L of the edge closer to the body surface S in the blood vessel V3, and the position P4 corresponds to the position on the sound line L of the deeper edge in the blood vessel V3.
- a range R illustrated in FIGS. 5A and 5C indicates a range of signal intensity of a photoacoustic signal imaged as a photoacoustic image.
- the photoacoustic signal has a peak at each of position P2, position P3, and position P4. There are many noise components in the part closer to the body surface than the position P1, and no clear peak is observed at the position P1.
- the blood vessel V2 corresponding to the position P2 can be imaged.
- the signal intensity of the photoacoustic signal is lower than the lower limit of the range R that is the imaging range between the position P3 and the position P4. Only the edge part can be imaged.
- the blood vessel V1 corresponding to the position P1 is buried in noise and cannot be clearly imaged.
- the power Doppler signal has a peak at each of position P1, position P2, and an intermediate position between positions P3 and P4. Comparing FIG. 5A and FIG. 5B, it can be seen that, for a thick blood vessel, the photoacoustic signal has a peak at the edge position, whereas the power Doppler signal has a peak in the lumen portion of the blood vessel. In the photoacoustic signal, there are many noise components near the body surface, whereas in the power Doppler signal, no noise component exists near the body surface.
- FIG. 6 shows correction coefficients used for correcting the photoacoustic signal.
- the correction coefficient is a function of the power Doppler signal.
- the horizontal axis represents the power Doppler signal intensity (PD signal intensity)
- the vertical axis represents the magnitude of the correction coefficient.
- the correction coefficient increases in proportion to the signal strength of the power Doppler signal in a section from the signal strength S11 to the signal strength S12 of the power Doppler signal.
- the correction coefficient is 0 in the section where the signal intensity is S11 or less, and the correction coefficient is 2 in the section where the signal intensity is S12 or more.
- the photoacoustic signal after correction is given by, for example, correction coefficient ⁇ photoacoustic signal before correction.
- the correction coefficient is 1, the photoacoustic signal does not change before and after correction.
- the correction coefficient is smaller than 1, the photoacoustic signal after correction is smaller than the photoacoustic signal before correction.
- the correction coefficient is larger than 1, the photoacoustic signal after correction is larger than the photoacoustic signal before correction.
- the correction coefficient only needs to be monotonically increased as the signal strength of the power Doppler signal increases in the section from the signal strength S11 to the signal strength S12, and increases in a linear function with respect to the signal strength of the power Doppler signal. It is not limited to things.
- the corrected photoacoustic signal has a peak at each of position P1, position P2, position P3, and position P4, as shown in FIG. 5C.
- the noise component present in the portion near the body surface in the photoacoustic signal before correction is the power Doppler signal of that portion. Since the signal intensity is low, it is removed from the photoacoustic signal after correction. Therefore, by generating a photoacoustic image using the corrected photoacoustic signal, the blood vessel V1 located near the body surface can be imaged as a photoacoustic image without being buried in noise.
- the signal intensity of the photoacoustic signal was below the lower limit of the range R in the section from the position P3 to the position P4 as shown in FIG. 5A.
- a correction coefficient based on a power Doppler signal having a peak at an intermediate position between the position P3 and the position P4
- a signal of the photoacoustic signal is obtained in a section from the position P3 to the position P4.
- the intensity can be made stronger than the lower limit of the range R. Therefore, by generating a photoacoustic image using the corrected photoacoustic signal, the entire thick blood vessel V3 can be imaged as a photoacoustic image.
- the blood vessel V2 that was originally imaged with a photoacoustic image has a strong signal intensity of the power Doppler signal at the position P2. Therefore, the photoacoustic image generated using the corrected photoacoustic signal can be imaged without any problem. it can.
- a power Doppler signal is generated, and a photoacoustic image is generated by correcting the photoacoustic signal based on the power Doppler signal.
- the portion where the power Doppler signal intensity is strong enhances the photoacoustic signal, and the signal intensity of the detection signal of the photoacoustic wave emitted from blood or the like is weak.
- it becomes possible to reduce the noise component contained in a photoacoustic signal by weakening a photoacoustic signal in the part with a weak power Doppler signal.
- FIG. 7 shows a photoacoustic image generation system according to the second embodiment of the present invention.
- the Doppler image generation unit 28 included in the ultrasound unit 12 generates a power Doppler image based on the power Doppler signal generated by the power Doppler signal generation unit 25.
- the Doppler image generation unit 28 included in the ultrasound unit 12a generates a power Doppler image without using the power Doppler signal generated by the power Doppler signal generation unit 25.
- the ultrasonic image generation unit 26 (see FIG. 1) is omitted, but in the present embodiment, the ultrasonic unit 12 a is similar to the ultrasonic unit 12 described in the first embodiment.
- the ultrasonic image generation unit 26 may be included.
- the Doppler image generation unit 28 reads the reflected ultrasonic signal from the reception memory 23.
- the Doppler image generation unit 28 generates a power Doppler image based on the reflected ultrasonic signal.
- the Doppler image generation unit 28 generates a power Doppler image for each sound ray (line) based on a reflected ultrasonic signal obtained by transmitting and receiving an ultrasonic wave having a packet size of about 10 times.
- the Doppler image generation unit 28 generates a power Doppler signal in generating a power Doppler image.
- the Doppler image generation unit 28 and the power Doppler signal generation unit 25 do not need to be completely separated, and some circuits may be common to both.
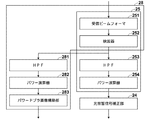
- FIG. 8 shows the power Doppler signal generation unit 25 and the Doppler image generation unit 28.
- the power Doppler signal generation unit 25 includes a reception beam former 251, a detector 252, a high pass filter 253, and a power calculator 254.
- the Doppler image generation unit 28 includes a reception beam former 251, a detector 252, a high-pass filter 281, a power calculator 282, and a power Doppler image construction unit 283.
- the reception beamformer 251 and the detector 252 are common parts to the power Doppler signal generation unit 25 and the Doppler image generation unit 28.
- the power Doppler signal generation unit 25 and the Doppler image generation unit 28 may individually include a reception beamformer and a detector.
- the operation of the power Doppler signal generation unit 25 is the same as that described in the first embodiment. That is, the reception beamformer 251 performs phasing addition of the reflected ultrasonic detection signal, and the detector 252 performs, for example, quadrature detection on the reflected ultrasonic signal subjected to phasing addition.
- the high-pass filter 253 performs high-pass filter processing on each transmission / reception I signal and Q signal, and the power calculator 254 calculates the signal value of the power Doppler signal based on the I signal and Q signal subjected to the high-pass filter processing. Calculate.
- the processing up to the calculation of the signal value of the power Doppler signal performed by the power calculator 282 in the Doppler image generation unit 28 is the same as the processing of the power Doppler signal generation unit 25.
- the power Doppler image construction unit 283 generates a power Doppler image by converting the signal intensity within a certain range of the power Doppler signal into a display gradation in a range from the highest luminance to the lowest luminance.
- the high-pass filter (hereinafter also referred to as the first high-pass filter) 253 of the power Doppler signal generation unit 25 and the high-pass filter (hereinafter also referred to as the second high-pass filter) 281 of the Doppler image generation unit 28 are the high-pass filter. It is preferred that the processing cut-off frequencies are different.
- the first high-pass filter 253 passes a signal component in a frequency band higher than the first cutoff frequency.
- the second high-pass filter 281 passes a signal component in a frequency band higher than the second cutoff frequency higher than the first cutoff frequency.
- the power Doppler signal generated by the power Doppler signal generation unit 25 is used in the photoacoustic signal correction unit 24 to correct the photoacoustic signal.
- the power Doppler signal generated inside the Doppler image generation unit 28 is converted into an image by the power Doppler image construction unit 283.
- the power Doppler signal used for correcting the photoacoustic signal has a cutoff frequency of the high-pass filter processing lower than the cutoff frequency of the high-pass filter processing used to generate the power Doppler signal used for generating the power Doppler image, Good sensitivity at low speed.
- a relatively low frequency signal component which is a clutter component, remains to some extent in the power Doppler signal with good low-speed sensitivity.
- the power Doppler signal is used for correcting the photoacoustic signal, there is no particular problem unless the photoacoustic signal is present in a portion where the clutter component exists.
- the first cutoff frequency is preferably lower than the cutoff frequency used when generating a normal power Doppler image.
- the cutoff frequency of the first high-pass filter 253 included in the power Doppler signal generation unit 25 is set lower than the cutoff frequency of the second high-pass filter 281 included in the Doppler image generation unit 28.
- the signal strength of the power Doppler signal in the blood vessel portion where the blood flow is constant is high-passed at a high cut-off frequency by performing high-pass filter processing at a low cut-off frequency. This can be strengthened compared to the case of filtering, and the photoacoustic signal can be corrected appropriately.
- a power Doppler image generated based on a power Doppler signal that has been high-pass filtered at a high cutoff frequency an image from which clutter components have been removed can be displayed.
- FIG. 9 shows a photoacoustic image generation system according to the third embodiment of the present invention.
- the photoacoustic image generation system 10b according to the present embodiment includes an operation unit 32 in addition to the configuration of the photoacoustic image generation system 10 according to the first embodiment illustrated in FIG. Other points may be the same as in the first embodiment or the second embodiment.
- the operation unit 32 operates the relationship between the signal intensity of the power Doppler signal and the value of the correction coefficient in the correction coefficient used by the photoacoustic signal correction unit 24.
- the operation unit 32 has a user interface that changes the relationship between the signal intensity of the power Doppler signal in the correction coefficient and the value of the correction coefficient in accordance with a user operation.
- the user interface of the operation unit 32 may be a physical means such as a slide bar or a dial, or may be configured by a GUI (graphical user interface).
- the operation unit 32 may be configured inside the ultrasonic unit 12b or may be configured outside the ultrasonic unit 12b.
- FIG. 10 shows correction coefficients used for correcting the photoacoustic signal.
- the horizontal axis represents the power Doppler signal intensity (PD signal intensity)
- the vertical axis represents the magnitude of the correction coefficient.
- the correction coefficient increases in proportion to the signal strength of the power Doppler signal in the section from the signal strength S11 to the signal strength S12 of the power Doppler signal.
- the correction coefficient is 0 in the section where the signal intensity is S11 or less, and the correction coefficient is 2 in the section where the signal intensity is S12 or more.
- the user operates the operation unit 32 to change the correction coefficient in a direction that makes blood flow easier to see, for example.
- the operation unit 32 corrects the correction by moving the lower limit signal strength S11 and the upper limit signal strength S12 of the section in which the correction coefficient increases monotonously as the signal strength of the power Doppler signal increases, in a direction in which the signal strength is lower.
- the relationship between the power Doppler signal intensity in the coefficient and the value of the correction coefficient is changed.
- the corrected correction coefficient increases in proportion to the signal strength of the power Doppler signal in the section from the signal strength S21 of the power Doppler signal to the signal strength S22.
- the correction coefficient is 0 in the section where the signal intensity is S21 or less, and the correction coefficient is 2 in the section where the signal intensity is S22 or more.
- the photoacoustic signal correction unit 24 corrects the photoacoustic signal using the corrected correction coefficient.
- the operation unit 32 changes the relationship between the signal strength of the power Doppler signal and the value of the correction coefficient in the correction coefficient used for correcting the photoacoustic signal.
- the user can change the correction coefficient so as to obtain a desired display state while observing the displayed image.
- Other effects are the same as those of the first embodiment or the second embodiment.
- the photoacoustic signal correction unit 24 corrects the photoacoustic signal input to the photoacoustic image generation unit 27.
- the correction of the photoacoustic signal is not limited to this.
- a signal (photoacoustic image signal) at a certain stage of image generation in the photoacoustic image generation unit 27 may be corrected.
- the photoacoustic signal reconstructed in the photoacoustic image generation unit 27 may be corrected based on the power Doppler signal.
- correction based on the power Doppler signal may be performed on the photoacoustic signal subjected to detection and / or logarithmic conversion. Further, correction based on the power Doppler signal may be performed on the photoacoustic image signal converted into the display gradation.
- the detection of reflected ultrasonic waves and the detection of photoacoustic waves are performed in the photoacoustic image generation system, but these detections may not necessarily be performed.
- a photoacoustic wave detection signal and a reflected ultrasonic detection signal detected in the past are stored in a storage device (not shown), and a photoacoustic wave detection signal and a reflected ultrasonic detection signal are stored from the storage device. You may read.
- the storage device only needs to be configured to be readable from the ultrasonic unit 12.
- the storage device and the ultrasonic unit 12 may be connected via a network such as the Internet.
Landscapes
- Life Sciences & Earth Sciences (AREA)
- Health & Medical Sciences (AREA)
- Biomedical Technology (AREA)
- Biophysics (AREA)
- Nuclear Medicine, Radiotherapy & Molecular Imaging (AREA)
- Pathology (AREA)
- Radiology & Medical Imaging (AREA)
- Engineering & Computer Science (AREA)
- Physics & Mathematics (AREA)
- Heart & Thoracic Surgery (AREA)
- Medical Informatics (AREA)
- Molecular Biology (AREA)
- Surgery (AREA)
- Animal Behavior & Ethology (AREA)
- General Health & Medical Sciences (AREA)
- Public Health (AREA)
- Veterinary Medicine (AREA)
- Ultra Sonic Daignosis Equipment (AREA)
Abstract
【課題】光音響画像生成システム、装置、及び方法において、血管などから発せられた光音響波の検出信号の信号強度が弱くても、その部分の画像化を可能とする。 【解決手段】パワードプラ信号生成部(25)は、反射超音波信号に基づいてパワードプラ信号を生成する。光音響信号補正部(24)は、パワードプラ信号生成部(25)が生成したパワードプラ信号に基づいて、光音響信号を補正する。光音響画像生成部(27)は、光音響信号補正部(24)で補正された光音響波の検出信号に基づいて光音響画像を生成する。
Description
本発明は、光音響画像生成システム、装置、及び方法に関し、更に詳しくは、被検体内の光吸収体が光を吸収することで発生した光音響波の検出信号に基づいて光音響画像を生成する光音響画像生成システム、装置、及び方法に関する。
生体内部の状態を非侵襲で検査できる画像検査法の一種として、超音波検査法が知られている。超音波検査では、超音波の送信及び受信が可能な超音波探触子が用いられる。超音波探触子から被検体(生体)に超音波を送信させると、その超音波は生体内部を進んでいき、組織界面で反射する。超音波探触子でその反射超音波を受信し、反射超音波が超音波探触子に戻ってくるまでの時間に基づいて距離を計算することで、内部の様子を画像化することができる。
また、光音響効果を利用して生体の内部を画像化する光音響イメージングが知られている。一般に光音響イメージングでは、パルスレーザ光を生体内に照射する。生体内部では、生体組織がパルスレーザ光のエネルギーを吸収し、そのエネルギーによる断熱膨張により超音波(光音響波)が発生する。この光音響波を超音波プローブなどで検出し、検出信号に基づいて光音響画像を構成することで、光音響波に基づく生体内の可視化が可能である。
ところで、超音波検査の一種として、ドプラ計測が知られている。ドプラ計測は、送信波の周波数に対する受信波の周波数のドプラ偏移に基づいて、非侵襲的に血行動態、血流速度及び生体内動向などを計測する計測手法である。光音響画像とドプラ計測との組み合わせに関し、ドプラ情報を使用して表示される光音響画像の画素を選択することが特許文献1に記載されている。特許文献1では、光音響画像は、ドプラ信号が一定のしきい値を超えた位置において、ピクセル上のカラーオーバーレイとしてのみ表示される。
特許文献1では、ドプラ計測で得られたドプラ信号がしきい値を超えた位置のみ光音響画像が表示されるため、光音響画像において血管を画像化する場合、ある一定の速度を超えて動いている血管の画像を表示することができる。しかしながら、この場合、血流が速い部分の血管は表示できるものの、血流が遅い部分の血管を表示することはできない。また、一般に、光音響画像では、光音響波の検出信号がある信号強度よりも低い場合、その部分は黒で表示され、画像として表示されない。特許文献1では、ドプラ信号がしきい値を超えた位置の光音響画像を表示しているだけであるため、もともと光音響画像で画像化されない部分について、その部分を表示することはできない。
本発明は、上記事情に鑑み、血管などから発せられた光音響波の検出信号の信号強度が弱くても、その部分の画像化が可能な光音響画像生成システム、装置、及び方法を提供することを目的とする。
上記目的を達成するために、本発明は、被検体内に送信された音響波に対する反射音響波の検出信号に基づいてパワードプラ信号を生成するパワードプラ信号生成部と、被検体内の光吸収体が光源から出射した光を吸収することに起因して発生した光音響波の検出信号を、パワードプラ信号に基づいて補正する光音響信号補正部と、光音響信号補正部で補正された光音響波の検出信号に基づいて光音響画像を生成する光音響画像生成部とを備える光音響画像生成装置を提供する。
本発明の光音響画像生成装置では、光音響信号補正部は、パワードプラ信号の信号強度の関数である補正係数を用いて光音響波の検出信号を補正することが好ましい。その場合、補正係数の値は、パワードプラ信号の信号強度が大きくなるに従って単調的に増加することが好ましい。
本発明の光音響画像生成装置は、上記の補正係数におけるパワードプラ信号の信号強度と補正係数の値との関係を変化させる操作部を更に有していてもよい。
本発明の光音響画像生成装置では、光音響信号補正部は、補正前の光音響波の検出信号に補正係数を乗じることで、光音響波の検出信号を補正することとしてもよい。
本発明の光音響画像生成装置では、パワードプラ信号生成部は、反射音響波の検出信号を直交検波することによりパワードプラ信号を生成してもよい。
本発明の光音響画像生成装置は、反射音響波の検出信号に基づいてパワードプラ画像を生成するパワードプラ画像生成部を更に有していてもよい。
本発明の光音響画像生成装置では、パワードプラ信号生成部は第1のカットオフ周波数よりも高域の周波数帯域の信号成分を通過させる第1のハイパスフィルタを含み、パワードプラ画像生成部は第2のカットオフ周波数よりも高域の周波数帯域の信号成分を通過させる第2のハイパスフィルタを含んでいてもよい。その場合、第1のカットオフ周波数は第2のカットオフ周波数よりも低いことが好ましい。
本発明の光音響画像生成装置は、光音響画像とパワードプラ画像とをモニタ画面上に表示させる画像出力部を更に有していてもよい。
本発明の光音響画像生成装置では、画像出力部は、光音響画像とパワードプラ画像とを重畳してモニタ画面上に表示させてもよい。あるいは、画像出力部は、光音響画像とパワードプラ画像とを並べてモニタ画面上に表示させてもよい。
本発明の光音響画像生成装置は、反射音響波の検出信号に基づいて反射音響波画像を生成する反射音響波画像生成部を更に有していてもよい。その場合、画像出力部は、反射音波響画像をモニタ画面上に更に表示させることとしてもよい。
本発明は、また、光源と、被検体内に音響波を送信する音響波送信部と、被検体内の光吸収体が光源から出射した光を吸収することに起因して発生した光音響波、及び音響波送信部から送信された音響波に対する反射音響波を検出する音響波受信部と、反射音響波の検出信号に基づいてパワードプラ信号を生成するパワードプラ信号生成部と、光音響波の検出信号を、パワードプラ信号に基づいて補正する光音響信号補正部と、光音響信号補正部で補正された光音響波の検出信号に基づいて光音響画像を生成する光音響画像生成部とを備える光音響画像生成システムを提供する。
本発明は、更に、被検体内に送信された音響波に対する反射音響波の検出信号に基づいてパワードプラ信号を生成するステップと、被検体内の光吸収体が光源から出射した光を吸収することに起因して発生した光音響波の検出信号を、パワードプラ信号に基づいて補正するステップと、補正するステップで補正された光音響波の検出信号に基づいて光音響画像を生成するステップとを有する光音響画像生成方法を提供する。
本発明の光音響画像生成システム、装置、及び方法は、血管などから発せられた光音響波の検出信号の信号強度が弱くても、その部分を画像化することができる。
以下、図面を参照し、本発明の実施の形態を詳細に説明する。図1は、本発明の第1実施形態に係る光音響画像生成システムを示す。光音響画像生成システム10は、プローブ(超音波探触子)11、超音波ユニット12、及びレーザユニット13を含む。本実施形態に係る光音響画像生成システム10は、ドプラ計測が可能に構成されている。なお、本発明の実施形態では、音響波として超音波を用いるが、超音波に限定されるものではなく、被検対象や測定条件等に応じて適切な周波数を選択してさえいれば、可聴周波数の音響波を用いてもよい。
レーザユニット13は、光源であり、測定光を出射する。レーザユニット13から出射した測定光は、例えば光ファイバなどの導光手段を用いてプローブ11まで導光され、プローブ11から被検体に向けて出射される。レーザユニット13は、例えばYAG(イットリウム・アルミニウム・ガーネット)やアレキサンドライトなどを用いた固体レーザ光源である。レーザユニット13は、例えば励起光源であるフラッシュランプと、レーザをパルス発振させるためのQスイッチとを含む。レーザユニット13における光源のタイプは特に限定されず、レーザユニット13が、レーザダイオード光源(半導体レーザ光源)であってもよいし、或いはレーザダイオード光源を種光源とする光増幅型レーザ光源であってもよい。レーザ光源以外の光源を用いてもよい。
レーザユニット13が出射するレーザ光の波長は、計測の対象となる被検体内の物質の光吸収特性によって適宜決定される。例えば計測対象が生体内のヘモグロビンである場合(つまり、血管を撮像する場合)には、レーザ光の波長は近赤外波長域に属する波長であることが好ましい。近赤外波長域とはおよそ700~850nmの波長域を意味する。レーザユニット13は、単波長のレーザ光を出射するものであってもよいし、複数の波長のレーザ光を出射可能なものであってもよい。レーザユニット13は、複数波長のレーザ光を出射可能である場合は、複数の波長のレーザ光を同時に出射してもよいし、複数の波長のレーザ光を切り替えて出射してもよい。
プローブ11は、例えば一次元的に配列された複数の超音波振動子を有している。プローブ11は、レーザユニット13から出射されたレーザ光が被検体に照射された後に、検体内の光吸収体から発せられた光音響波を検出する。また、プローブ11は、光音響波の検出に加えて、被検体に対する音響波(超音波)の送信、及び送信した超音波に対する反射音響波(反射超音波)の受信を行う。その場合、プローブ11は、音響波送信部と音響波受信部とを兼ねる。超音波の送受信は分離した位置で行ってもよい。例えばプローブ11とは異なる位置から超音波の送信を行い、その送信された超音波に対する反射超音波をプローブ11で受信してもよい。プローブ11は、リニアプローブに限定されず、コンベクスプローブ、又はセクタープローブでもよい。
超音波ユニット12は、光音響画像生成装置を構成する。超音波ユニット12は、受信回路21、AD変換器(Analog to Digital convertor)22、受信メモリ23、光音響信号補正部24、パワードプラ信号生成部25、超音波画像生成部26、光音響画像生成部27、ドプラ画像生成部28、画像出力部29、制御部30、及び送信制御回路31を有する。超音波ユニット12は、典型的にはプロセッサ、メモリ、及びバスなどを有する。超音波ユニット12には、光音響画像生成、ドプラ画像生成、及び超音波画像生成に関するプログラムがメモリに組み込まれている。プロセッサによって構成される制御部30によってそのプログラムが動作することで、光音響信号補正部24、パワードプラ信号生成部25、超音波画像生成部26、光音響画像生成部27、ドプラ画像生成部28および画像出力部29の機能が実現する。すなわち、これらの各部は、プログラムが組み込まれたメモリとプロセッサにより構成されている。
なお、超音波ユニット12のハードウェアの構成は特に限定されるものではなく、複数のIC(Integrated Circuit)、プロセッサ、ASIC(application specific integrated circuit)、FPGA(field-programmable gate array)、メモリなどを適宜組み合わせることによって実現することができる。
受信回路21は、プローブ11が出力する検出信号を受信する。受信回路21は、典型的には、低ノイズアンプ、可変ゲインアンプ、及びローパスフィルタを含む。プローブ11の検出信号は、低ノイズアンプで増幅された後に、可変ゲインアンプで深度に応じたゲイン調整がなされ、ローパスフィルタで高周波成分がカットされる。
AD変換器22は、受信回路21が受信した検出信号、すなわちプローブ11で検出された光音響波の検出信号及び反射超音波の検出信号をアナログ信号からデジタル信号に変換する。AD変換器22は、AD変換された光音響波及び反射超音波の検出信号(サンプリングデータ)を受信メモリ23に格納する。受信回路21とAD変換器22とは、例えば1つのICとして構成されていてもよし、個別のICとして構成されていてもよい。
超音波画像生成部(反射音響波画像生成部)26は、受信メモリ23から反射超音波の検出信号のサンプリングデータを読み出す。超音波画像生成部26は、反射超音波の検出信号(そのサンプリングデータ)に基づいて超音波画像(反射音響波画像)を生成する。
例えば、超音波画像生成部26は、まず反射超音波波の検出信号(反射超音波信号)の再構成を行い、超音波画像の各ラインのデータを生成する。再構成された反射超音波信号は超音波画像とみなすことができる。超音波画像生成部26は、例えばプローブ11の64個の音響検出素子からのデータを、音響検出素子の位置に応じた遅延時間で加算し、1ライン分のデータを生成する(遅延加算法)。
次いで、超音波画像生成部26は、再構成された反射超音波信号(超音波画像信号)に対して例えば包絡線検波を行い、検波後の信号を対数変換する。その後、超音波画像生成部26は、検波及び対数変換がなされた超音波画像信号を表示画像の画素値に変換し、超音波画像(Bモード画像)を生成する。超音波画像生成部26は、例えば超音波画像信号のある範囲内の信号強度を、最高輝度から最低輝度の範囲の表示階調に変換することで、超音波画像を生成する。超音波画像生成部26は、生成した超音波画像を画像出力部29に送信する。
パワードプラ信号生成部25は、受信メモリ23から反射超音波の検出信号のサンプリングデータを読み出す。パワードプラ信号生成部25は、反射超音波の検出信号(そのサンプリングデータ)に基づいてパワードプラ信号を生成する。パワードプラ信号生成部25は、例えば各音線(ライン)について、パケットサイズ10回程度の超音波の送受信により得られた反射超音波の検出信号(反射超音波信号)に基づいて、パワードプラ信号を生成する。
図2は、パワードプラ信号生成部25の構成を示す。パワードプラ信号生成部25は、受信ビームフォーマ251、検波器252、ハイパスフィルタ(HPF:High Pass Filter)253、及びパワー演算器254を有する。受信ビームフォーマ251は、例えばパケットサイズ10回程度の超音波の送受信により得られた反射超音波検出信号のそれぞれに対して、整相加算を行う。検波器252は、整相加算された反射超音波信号に対して検波を行う。検波器252は、例えば反射超音波信号を直交検波する。直交検波を実施することで、I信号とQ信号とが得られる。直交検波に代えて、包絡線検波により反射超音波信号を検波してもよい。
ハイパスフィルタ253は、各送受信のI信号及びQ信号に対してハイパスフィルタ処理を行う。ハイパスフィルタを通すことで、クラッタ成分である比較的低周波の信号成分が除去され、それよりも高周波の成分である血流成分が抽出される。ハイパスフィルタ253は、ウォールモーションフィルタとも呼ばれる。パワー演算器254は、ハイパスフィルタ処理がなされたI信号及びQ信号に基づいて、パワードプラ信号の信号値を演算する。より詳細には、パワー演算器254は、I信号の2乗とQ信号の2乗との和を計算することで、パワードプラ信号の信号値を演算する。
図1に戻り、パワードプラ信号生成部25は、生成したパワードプラ信号を、光音響信号補正部24とドプラ画像生成部28とに送信する。ドプラ画像生成部(パワードプラ画像生成部)28は、反射超音波の検出信号に基づいてパワードプラ画像を生成する。本実施形態では、ドプラ画像生成部28は、パワードプラ信号生成部25で生成されたパワードプラ信号に基づいて、パワードプラ画像を生成する。ドプラ画像生成部28は、例えばパワードプラ信号のある範囲内の信号強度を、最高輝度から最低輝度の範囲の表示階調に変換することで、パワードプラ画像を生成する。ドプラ画像生成部28は、生成したパワードプラ画像を画像出力部29に送信する。
光音響信号補正部24は、受信メモリ23から光音響波の検出信号のサンプリングデータを読み出す。また、パワードプラ信号生成部25からパワードプラ信号を受信する。光音響信号補正部24は、光音響波の検出信号(そのサンプリングデータ)をパワードプラ信号に基づいて補正する。光音響信号補正部24は、例えばパワードプラ信号の信号強度の関数である補正係数を用いて光音響波の検出信号(光音響信号)を補正する。光音響信号補正部24は、例えば補正前の光音響信号に補正係数を乗じることで、光音響信号を補正する。補正係数の値は、例えばパワードプラ信号が大きくなるに従って単調的に増加する。
光音響画像生成部27は、光音響信号補正部24で補正された光音響信号に基づいて光音響画像を生成する。例えば、光音響画像生成部27は、まず光音響信号の再構成を行い、光音響画像の各ラインのデータを生成する。再構成された光音響信号は光音響画像とみなすことができる。光音響画像生成部27は、例えば遅延可算法を用いて光音響信号の再構成を行う。光音響画像生成部27は、遅延加算法に代えて、CBP法(Circular Back Projection)により再構成を行ってもよい。あるいは光音響画像生成部27は、ハフ変換法又はフーリエ変換法を用いて再構成を行ってもよい。
次いで、光音響画像生成部27は、再構成された光音響信号(光音響画像信号)に対して例えば包絡線検波を行い、検波後の信号を対数変換する。その後、光音響画像生成部27は、検波及び対数変換された光音響画像信号を表示画像の画素値に変換し、光音響画像を生成する。光音響画像生成部27は、例えば光音響画像信号のある範囲内の信号強度を、最高輝度から最低輝度の範囲の表示階調に変換することで、光音響画像を生成する。光音響画像生成部27は、生成した光音響画像を画像出力部29に送信する。
画像出力部29は、光音響画像、超音波画像、及びパワードプラ画像を、ディスプレイ装置などの画像表示装置14に表示させる。画像出力部29は、例えば光音響画像とパワードプラ画像とを重畳して画像表示装置14のモニタ画面上に表示させる。あるいは、画像出力部29は、光音響画像とパワードプラ画像と並べて画像表示装置14のモニタ画面上に表示させてもよい。画像出力部29は、更に超音波画像を、光音響画像とパワードプラ画像とを重畳して、或いは光音響画像とパワードプラ画像と並べて、画像表示装置14のモニタ画面上に表示させてもよい。画像出力部29は、光音響画像と、パワードプラ画像と、超音波画像とを、画像表示装置14のモニタ画面上に切り替えて表示してもよい。
制御部30は、超音波ユニット12内の各部を制御する。制御部30は、例えば光音響画像を取得する場合は、レーザユニット13にトリガ信号を送信し、レーザユニット13からレーザ光を出射させる。トリガ信号には、例えばレーザユニット13においてレーザ媒質に励起光を出射させるための励起トリガ信号と、レーザをQスイッチ発振させるためのQスイッチトリガ信号とを含む。制御部30は、レーザ光の出射に合わせて、受信回路21にサンプリングトリガ信号を送信し、光音響波のサンプリング開始タイミングなどを制御する。
制御部30は、超音波画像を取得する場合は、送信制御回路31に超音波送信を指示する旨の超音波送信トリガ信号を送信する。送信制御回路31は、超音波送信トリガ信号を受けると、プローブ11から超音波を送信させる。制御部30は、超音波送信のタイミングに合わせて受信回路21にサンプリグトリガ信号を送信し、反射超音波のサンプリングを開始させる。制御部30は、ドプラ計測を実施する場合は、複数回の超音波送受信を実施させる。
ここで、パワードプラ信号の信号強度が強いサンプル点は、血管領域に含まれる点であると推定することができる。逆に、パワードプラ信号の信号強度が低いサンプル点は、血管領域に含まれる点である可能性が低いと推定できる。本実施形態では、パワードプラ信号の信号強度に基づいて血管領域であるか否かの推定が可能であることを利用し、光音響画像の生成において、各サンプル点のパワードプラ信号の信号強度を利用して、光音響信号を補正する。
血管の太さと、パワードプラ信号及び光音響信号との関係について説明する。図3は、血管の太さと信号強度との関係を示す。横軸は血管の太さを表し、縦軸は光音響信号及びパワードプラ信号の信号強度を表す。グラフPAは、光音響信号における、血管の太さとその太さの血管から発せられる光音響波の検出信号との関係を示す。グラフPDは、パワードプラ信号における、血管の太さとその太さの血管から抽出されるパワードプラ信号との関係を示す。
グラフPAに示すように、光音響信号は、血管の太さが比較的細い場合、信号強度が強い傾向にある。一方で、血管がある程度以上太い場合、光音響信号の信号強度は低下する。特に、血管が太い場合、光音響信号は、血管の管壁(エッジ)の部分において信号強度が高いものの、血管の中央の部分では信号強度が低くなることが知られている。
一方、グラフPDに示すように、パワードプラ信号は、血管の太さが比較的細い場合、信号強度は低い。パワードプラ信号は、血管が太くなるにつれて、信号強度が増加していく傾向にある。このようなパワードプラ信号と光音響信号の性質を利用し、パワードプラ信号に基づいて光音響信号を補正することで、光音響計測が苦手とする太い血管について、血管の中央の部分も光音響画像で画像化することができると考えられる。
光音響信号の補正について具体例を挙げて説明する。図4は、被検体内における血管の配置を示す。被検体の体表Sから被検体の深さ方向に、血管V1、血管V2、及び血管V3がこの順で並んでいる場合を考える。血管V1及び血管V2は比較的直径が細い血管であり、血管V3は血管が太い血管である。このような被検体において、各血管の中心付近を通る音線Lを考える。
図5は、音線Lにおける検出信号の信号波形を示す。図5Aは、検出された光音響信号(PA信号)の信号波形を示し、Bはパワードプラ信号(PD信号)の信号波形を示し、Cは補正後の光音響信号(補正後PA信号)の信号波形を示す。位置P1は、血管V1(図4を参照)の音線L上の位置に対応し、位置P2は、血管V2の音線L上の位置に対応する。位置P3は、血管V3における体表Sに近い側のエッジの音線L上の位置に対応し、位置P4は、血管V3における深部側のエッジの音線L上の位置に対応する。図5のA及びCに示す範囲Rは、光音響画像として画像化される光音響信号の信号強度の範囲を示す。
図5Aに示すように、光音響信号は、位置P2、位置P3、及び位置P4のそれぞれにピークを有する。位置P1よりも体表に近い部分ではノイズ成分が多く、位置P1に明確なピークは観察されない。このような光音響信号について、信号強度が範囲Rにある部分を輝度値に変換して光音響画像を生成すると、位置P2に対応した血管V2を画像化することができる。位置P3から位置P4の間にある血管V3については、位置P3から位置P4までの間で光音響信号の信号強度が画像化範囲である範囲Rの下限を下回っているため、血管V3は、そのエッジの部分しか画像化できない。位置P1に対応した血管V1は、ノイズに埋もれて明確に画像化することができない。
図5Bに示すように、パワードプラ信号は、位置P1、位置P2、及び位置P3と位置P4との中間の位置のそれぞれにピークを有する。図5Aと図5Bとを比較すると、太い血管について、光音響信号ではエッジの位置にピークがあるのに対し、パワードプラ信号では血管の内腔の部分にピークがあることがわかる。また、光音響信号では、体表に近い部分にノイズ成分が多いのに対し、パワードプラ信号には体表に近い部分にノイズ成分が存在しない。
図6は、光音響信号の補正に用いる補正係数を示す。補正係数は、パワードプラ信号の関数である。図6に示すグラフにおいて、横軸はパワードプラ信号の強度(PD信号強度)を表し、縦軸は補正係数の大きさを表す。補正係数は、例えばパワードプラ信号の信号強度S11から信号強度S12の区間において、パワードプラ信号の信号強度に比例して増加する。信号強度S11以下の区間では補正係数は0であり、信号強度がS12以上の区間では補正係数は2である。
補正後の光音響信号は、例えば補正係数×補正前の光音響信号で与えられる。補正係数が1の場合、光音響信号は補正前後で変化しない。補正係数が1よりも小さい値の場合、補正後の光音響信号は補正前の光音響信号よりも小さくなる。補正係数が1より大きい値の場合、補正後の光音響信号は補正前の光音響信号よりも大きくなる。なお、補正係数は信号強度S11から信号強度S12の区間において、パワードプラ信号の信号強度の増加に従って単調に増加するものであればよく、パワードプラ信号の信号強度に対して一次関数的に増加するものには限定されない。
補正後の光音響信号は、図5Cに示すように、位置P1、位置P2、位置P3、及び位置P4のそれぞれにピークを有する。補正後の光音響信号と、補正前の光音響信号(図5A)と比較すると、補正前の光音響信号において体表に近い部分に存在していたノイズ成分は、その部分のパワードプラ信号の信号強度が低いことから、補正後の光音響信号から除去されている。したがって、補正後の光音響信号を用いて光音響画像を生成することで、体表に近い部分にある血管V1を、ノイズに埋もれることなく光音響画像で画像化できる。
また、補正前の光音響信号では、図5Aに示すように、位置P3から位置P4までの区間で光音響信号の信号強度が範囲Rの下限を下回っていた。このような光音響信号を、位置P3と位置P4との中間の位置にピークを有するパワードプラ信号に基づく補正係数で補正することで、位置P3から位置P4までの区間において、光音響信号の信号強度を、範囲Rの下限よりも強くすることができる。したがって、補正後の光音響信号を用いて光音響画像を生成することで、太い血管V3の全体を光音響画像で画像化できる。もともと光音響画像で画像化できていた血管V2については、その位置P2のパワードプラ信号の信号強度が強いため、補正された光音響信号を用いて生成された光音響画像においても支障なく画像化できる。
本実施形態では、パワードプラ信号を生成し、パワードプラ信号に基づいて光音響信号を補正して光音響画像を生成する。パワードプラ信号は血管領域から得られることを利用して、パワードプラ信号強度が強い部分は光音響信号を増強することで、血液などから発せられた光音響波の検出信号の信号強度が弱くても、光音響画像においてその部分の画像化することが可能となる。例えば、光音響信号をパワードプラ信号を用いて補正しない場合にエッジ部分しか画像化できなかった太い血管の全体を、光音響画像で画像化することができる。また、パワードプラ信号が弱い部分は光音響信号を弱めることで、光音響信号に含まれるノイズ成分を低減することが可能となる。
次いで、本発明の第2実施形態を説明する。図7は、本発明の第2実施形態に係る光音響画像生成システムを示す。第1実施形態に係る光音響画像生成システム10では、超音波ユニット12に含まれるドプラ画像生成部28は、パワードプラ信号生成部25が生成したパワードプラ信号に基づいてパワードプラ画像を生成した。本実施形態に係る光音響画像生成システム10aでは、超音波ユニット12aに含まれるドプラ画像生成部28は、パワードプラ信号生成部25が生成したパワードプラ信号を用いずに、パワードプラ画像を生成する。なお、図7では超音波画像生成部26(図1を参照)が省略されているが、本実施形態において、超音波ユニット12aは、第1実施形態で説明した超音波ユニット12と同様に、超音波画像生成部26を有していてもよい。
ドプラ画像生成部28は、受信メモリ23から反射超音波信号を読み出す。ドプラ画像生成部28は、反射超音波信号に基づいてパワードプラ画像を生成する。ドプラ画像生成部28は、例えば各音線(ライン)について、パケットサイズ10回程度の超音波の送受信により得られた反射超音波信号に基づいて、パワードプラ画像を生成する。ドプラ画像生成部28は、パワードプラ画像の生成においてパワードプラ信号を生成する。ドプラ画像生成部28とパワードプラ信号生成部25とは、完全に分離されている必要はなく、一部の回路が双方に共通であってもよい。
図8は、パワードプラ信号生成部25とドプラ画像生成部28とを示す。パワードプラ信号生成部25は、図2に示す第1実施形態において説明したパワードプラ信号生成部25と同様に、受信ビームフォーマ251、検波器252、ハイパスフィルタ253、及びパワー演算器254を有する。ドプラ画像生成部28は、受信ビームフォーマ251、検波器252、ハイパスフィルタ281、パワー演算器282、及びパワードプラ画像構築部283を有する。なお、受信ビームフォーマ251及び検波器252は、パワードプラ信号生成部25とドプラ画像生成部28とに共通の部分である。これに代えて、パワードプラ信号生成部25及びドプラ画像生成部28は、受信ビームフォーマ及び検波器を個別に有していてもよい。
パワードプラ信号生成部25の動作は、第1実施形態で説明したものと同様である。すなわち、受信ビームフォーマ251は、反射超音波検出信号を整相加算し、検波器252は、整相加算された反射超音波信号に対して例えば直交検波を行う。ハイパスフィルタ253は、各送受信のI信号及びQ信号に対してハイパスフィルタ処理を行い、パワー演算器254は、ハイパスフィルタ処理がなされたI信号及びQ信号に基づいて、パワードプラ信号の信号値を演算する。
ドプラ画像生成部28におけるパワー演算器282が行うパワードプラ信号の信号値の演算までの処理は、パワードプラ信号生成部25の処理と同様である。パワードプラ画像構築部283は、パワードプラ信号のある範囲内の信号強度を、最高輝度から最低輝度の範囲の表示階調に変換することで、パワードプラ画像を生成する。
ここで、パワードプラ信号生成部25のハイパスフィルタ(以下、第1のハイパスフィルタとも呼ぶ)253とドプラ画像生成部28のハイパスフィルタ(以下、第2のハイパスフィルタとも呼ぶ)281とでは、ハイパスフィルタ処理のカットオフ周波数が異なっていることが好ましい。例えば、第1のハイパスフィルタ253は、第1のカットオフ周波数よりも高域の周波数帯域の信号成分を通過させる。一方、第2のハイパスフィルタ281は、第1のカットオフ周波数よりも高い第2のカットオフ周波数よりも高域の周波数帯域の信号成分を通過させる。
第1のハイパスフィルタ253と第2のハイパスフィルタ281とでカットオフ周波数が異なることで、本実施形態では2つのパワードプラ信号が生成される。パワードプラ信号生成部25が生成したパワードプラ信号は、光音響信号補正部24において光音響信号の補正に用いられる。一方、ドプラ画像生成部28の内部で生成されたパワードプラ信号は、パワードプラ画像構築部283で画像に変換される。
光音響信号の補正に用いられるパワードプラ信号は、ハイパスフィルタ処理のカットオフ周波数がパワードプラ画像の生成に用いられるパワードプラ信号の生成に用いられたハイパスフィルタ処理のカットオフ周波数よりも低いため、低速の感度が良好である。低速の感度を良好にしたパワードプラ信号には、クラッタ成分である比較的低周波の信号成分がある程度残存することとなる。しかしながら、そのパワードプラ信号は、光音響信号の補正に用いられるため、クラッタ成分が存在する部分に光音響信号が存在しなければ、特に問題は生じない。血流が遅い血管についても光音響画像で画像化を可能にするために、第1のカットオフ周波数は、通常のパワードプラ画像を生成する場合に用いられるカットオフ周波数よりも低いことが好ましい。
本実施形態では、パワードプラ信号生成部25に含まれる第1のハイパスフィルタ253のカットオフ周波数を、ドプラ画像生成部28に含まれる第2のハイパスフィルタ281のカットオフ周波数よりも低くする。光音響信号の補正に用いられるパワードプラ信号については、低いカットオフ周波数でハイパスフィルタ処理を行うことで、血流が定速の血管の部分のパワードプラ信号の信号強度を高いカットオフ周波数でハイパスフィルタ処理する場合より強めることができ、光音響信号の補正を適切に行うことが可能である。一方で、高いカットオフ周波数でハイパスフィルタ処理されたパワードプラ信号に基づいて生成されるパワードプラ画像においては、クラッタ成分が除去された画像の表示が可能である。
続いて、本発明の第3実施形態を説明する。図9は、本発明の第3実施形態に係る光音響画像生成システムを示す。本実施形態に係る光音響画像生成システム10bは、図1に示す第1実施形態に係る光音響画像生成システム10の構成に加えて、操作部32を有する。その他の点は、第1実施形態又は第2実施形態と同様でよい。
操作部32は、光音響信号補正部24で使用される補正係数におけるパワードプラ信号の信号強度と補正係数の値との関係を操作する。操作部32は、ユーザ操作に応じて補正係数におけるパワードプラ信号の信号強度と補正係数の値との関係を変化させるユーザインタフェースを有する。操作部32がユーザインタフェースは、スライドバー又はダイヤルなどの物理的な手段であってもよいし、GUI(graphical user interface)で構成されたものであってもよい。操作部32は、超音波ユニット12bの内部に構成されていてもよいし、超音波ユニット12bの外部に構成されていてもよい。
図10は、光音響信号の補正に用いられる補正係数を示す。図10に示すグラフにおいて、横軸はパワードプラ信号の強度(PD信号強度)を表し、縦軸は補正係数の大きさを表す。補正係数は、例えば、初期状態ではパワードプラ信号の信号強度S11から信号強度S12の区間において、パワードプラ信号の信号強度に比例して増加する。信号強度S11以下の区間では補正係数は0であり、信号強度がS12以上の区間では補正係数は2である。
ユーザは、操作部32を操作して、例えば血流を見やすくする方向に補正係数を変更する。操作部32は、例えば補正係数がパワードプラ信号の信号強度が増加するに従って単調に増加する区間の下限の信号強度S11及び上限の信号強度S12を、信号強度が低い方向へ移動させることで、補正係数におけるパワードプラ信号の強度と補正係数の値との関係を変更する。変更後の補正係数は、パワードプラ信号の信号強度S21から信号強度S22の区間において、パワードプラ信号の信号強度に比例して増加する。信号強度S21以下の区間では補正係数は0であり、信号強度がS22以上の区間では補正係数は2である。光音響信号補正部24は、変更後の補正係数を用いて、光音響信号の補正を行う。
本実施形態では、操作部32は、光音響信号の補正に用いられる補正係数におけるパワードプラ信号の信号強度と補正係数の値との関係を変更させる。このような操作部32を用いることで、例えば、ユーザは、表示された画像を観察しながら、所望の表示状態となるように、補正係数を変更することが可能となる。その他の効果は、第1実施形態又は第2実施形態と同様である。
なお、上記各実施形態では、光音響信号補正部24は、光音響画像生成部27に入力する光音響信号を補正することを説明したが、光音響信号の補正は、これには限定されない。例えば、光音響画像生成部27における画像生成のある段階の信号(光音響画像信号)を補正することとしてもよい。具体的には、光音響画像生成部27において再構成された光音響信号に対してパワードプラ信号に基づく補正を行ってもよい。あるいは、検波及び/又は対数変換がなされた光音響信号に対してパワードプラ信号に基づく補正を行ってもよい。さらには、表示階調に変換された光音響画像信号に対してパワードプラ信号に基づく補正を行ってもよい。
上記各実施形態では、光音響画像生成システムにおいて反射超音波の検出と光音響波の検出とを行っているが、これらの検出は必ずしも実施されなくてもよい。例えば、図示しない記憶装置に、過去に検出された光音響波の検出信号及び反射超音波の検出信号を記憶しておき、その記憶装置から光音響波の検出信号及び反射超音波の検出信号を読み出してもよい。記憶装置は、超音波ユニット12から読み出し可能に構成されていればよく、例えば記憶装置と超音波ユニット12とがインターネットなどのネットワークを介して接続されていてもよい。
以上、本発明をその好適な実施形態に基づいて説明したが、本発明の光音響画像生成システム、装置、及び方法は、上記実施形態にのみ限定されるものではなく、上記実施形態の構成から種々の修正及び変更を施したものも、本発明の範囲に含まれる。
10、10a、10b:光音響画像生成システム
11:プローブ
12、12a、12b:超音波ユニット
13:レーザユニット
14:画像表示装置
21:受信回路
22:AD変換器
23:受信メモリ
24:光音響信号補正部
25:パワードプラ信号生成部
26:超音波画像生成部
27:光音響画像生成部
28:ドプラ画像生成部
29:画像出力部
30:制御部
31:送信制御回路
32:操作部
251:受信ビームフォーマ
252:検波器
253:ハイパスフィルタ
254:パワー演算器
281:ハイパスフィルタ
282:パワー演算器
283:パワードプラ画像構築部
S:体表
V1~V3:血管
11:プローブ
12、12a、12b:超音波ユニット
13:レーザユニット
14:画像表示装置
21:受信回路
22:AD変換器
23:受信メモリ
24:光音響信号補正部
25:パワードプラ信号生成部
26:超音波画像生成部
27:光音響画像生成部
28:ドプラ画像生成部
29:画像出力部
30:制御部
31:送信制御回路
32:操作部
251:受信ビームフォーマ
252:検波器
253:ハイパスフィルタ
254:パワー演算器
281:ハイパスフィルタ
282:パワー演算器
283:パワードプラ画像構築部
S:体表
V1~V3:血管
Claims (14)
- 被検体内に送信された音響波に対する反射音響波の検出信号に基づいてパワードプラ信号を生成するパワードプラ信号生成部と、
前記被検体内の光吸収体が光源から出射した光を吸収することに起因して発生した光音響波の検出信号を、前記パワードプラ信号に基づいて補正する光音響信号補正部と、
前記光音響信号補正部で補正された光音響波の検出信号に基づいて光音響画像を生成する光音響画像生成部とを備える光音響画像生成装置。 - 前記光音響信号補正部は、前記パワードプラ信号の信号強度の関数である補正係数を用いて前記光音響波の検出信号を補正する請求項1に記載の光音響画像生成装置。
- 前記補正係数の値は、前記パワードプラ信号の信号強度が大きくなるに従って単調的に増加する請求項2に記載の光音響画像生成装置。
- 前記補正係数における前記パワードプラ信号の信号強度と前記補正係数の値との関係を変化させる操作部を更に有する請求項2又は3に記載の光音響画像生成装置。
- 前記光音響信号補正部は、補正前の光音響波の検出信号に前記補正係数を乗じることで、前記光音響波の検出信号を補正する請求項2から4何れか1項に記載の光音響画像生成装置。
- 前記パワードプラ信号生成部は、前記反射音響波の検出信号を直交検波することにより前記パワードプラ信号を生成する請求項1から5何れか1項に記載の光音響画像生成装置。
- 前記反射音響波の検出信号に基づいてパワードプラ画像を生成するパワードプラ画像生成部を更に有する請求項1から6何れか1項に記載の光音響画像生成装置。
- 前記パワードプラ信号生成部は第1のカットオフ周波数よりも高域の周波数帯域の信号成分を通過させる第1のハイパスフィルタを含み、前記パワードプラ画像生成部は第2のカットオフ周波数よりも高域の周波数帯域の信号成分を通過させる第2のハイパスフィルタを含み、前記第1のカットオフ周波数は前記第2のカットオフ周波数よりも低い請求項7に記載の光音響画像生成装置。
- 前記光音響画像と前記パワードプラ画像とをモニタ画面上に表示させる画像出力部を更に有する請求項7又は8に記載の光音響画像生成装置。
- 前記画像出力部は、前記光音響画像と前記パワードプラ画像とを重畳して前記モニタ画面上に表示させる請求項9に記載の光音響画像生成装置。
- 前記画像出力部は、前記光音響画像と前記パワードプラ画像とを並べて前記モニタ画面上に表示させる請求項9に記載の光音響画像生成装置。
- 前記反射音響波の検出信号に基づいて反射音響波画像を生成する反射音響波画像生成部を更に有し、
前記画像出力部は、前記反射音響波画像を前記モニタ画面上に更に表示させる請求項10から11何れか1項に記載の光音響画像生成装置。 - 光源と、
被検体内に音響波を送信する音響波送信部と、
前記被検体内の光吸収体が前記光源から出射した光を吸収することに起因して発生した光音響波、及び前記音響波送信部から送信された音響波に対する反射音響波を検出する音響波受信部と、
前記反射音響波の検出信号に基づいてパワードプラ信号を生成するパワードプラ信号生成部と、
前記光音響波の検出信号を、前記パワードプラ信号に基づいて補正する光音響信号補正部と、
前記光音響信号補正部で補正された光音響波の検出信号に基づいて光音響画像を生成する光音響画像生成部とを備える光音響画像生成システム。 - 被検体内に送信された音響波に対する反射音響波の検出信号に基づいてパワードプラ信号を生成するステップと、
前記被検体内の光吸収体が光源から出射した光を吸収することに起因して発生した光音響波の検出信号を、前記パワードプラ信号に基づいて補正するステップと、
前記補正するステップで補正された光音響波の検出信号に基づいて光音響画像を生成するステップとを有する光音響画像生成方法。
Priority Applications (1)
| Application Number | Priority Date | Filing Date | Title |
|---|---|---|---|
| JP2017565522A JP6482686B2 (ja) | 2016-02-05 | 2017-01-27 | 光音響画像生成システム、装置、及び方法 |
Applications Claiming Priority (2)
| Application Number | Priority Date | Filing Date | Title |
|---|---|---|---|
| JP2016-020530 | 2016-02-05 | ||
| JP2016020530 | 2016-02-05 |
Publications (1)
| Publication Number | Publication Date |
|---|---|
| WO2017135167A1 true WO2017135167A1 (ja) | 2017-08-10 |
Family
ID=59499784
Family Applications (1)
| Application Number | Title | Priority Date | Filing Date |
|---|---|---|---|
| PCT/JP2017/002992 Ceased WO2017135167A1 (ja) | 2016-02-05 | 2017-01-27 | 光音響画像生成システム、装置、及び方法 |
Country Status (2)
| Country | Link |
|---|---|
| JP (1) | JP6482686B2 (ja) |
| WO (1) | WO2017135167A1 (ja) |
Cited By (2)
| Publication number | Priority date | Publication date | Assignee | Title |
|---|---|---|---|---|
| CN111432730A (zh) * | 2018-10-24 | 2020-07-17 | 中国医学科学院北京协和医院 | 一种成像方法以及成像系统 |
| JP2023184248A (ja) * | 2022-06-17 | 2023-12-28 | コニカミノルタ株式会社 | 超音波診断装置、超音波診断装置の制御方法、及び、超音波診断装置の制御プログラム |
Citations (3)
| Publication number | Priority date | Publication date | Assignee | Title |
|---|---|---|---|---|
| JPH10171976A (ja) * | 1996-10-07 | 1998-06-26 | Ge Yokogawa Medical Syst Ltd | 画像処理方法及び画像処理装置 |
| JP2011502688A (ja) * | 2007-11-14 | 2011-01-27 | コーニンクレッカ フィリップス エレクトロニクス エヌ ヴィ | 光‐音響撮像アプリケーションにおいて、流れを検出し、snr特性を改良するシステム及び方法 |
| JP2014136103A (ja) * | 2013-01-18 | 2014-07-28 | Fujifilm Corp | 光音響画像生成装置および光音響画像生成方法 |
-
2017
- 2017-01-27 WO PCT/JP2017/002992 patent/WO2017135167A1/ja not_active Ceased
- 2017-01-27 JP JP2017565522A patent/JP6482686B2/ja not_active Expired - Fee Related
Patent Citations (3)
| Publication number | Priority date | Publication date | Assignee | Title |
|---|---|---|---|---|
| JPH10171976A (ja) * | 1996-10-07 | 1998-06-26 | Ge Yokogawa Medical Syst Ltd | 画像処理方法及び画像処理装置 |
| JP2011502688A (ja) * | 2007-11-14 | 2011-01-27 | コーニンクレッカ フィリップス エレクトロニクス エヌ ヴィ | 光‐音響撮像アプリケーションにおいて、流れを検出し、snr特性を改良するシステム及び方法 |
| JP2014136103A (ja) * | 2013-01-18 | 2014-07-28 | Fujifilm Corp | 光音響画像生成装置および光音響画像生成方法 |
Cited By (3)
| Publication number | Priority date | Publication date | Assignee | Title |
|---|---|---|---|---|
| CN111432730A (zh) * | 2018-10-24 | 2020-07-17 | 中国医学科学院北京协和医院 | 一种成像方法以及成像系统 |
| JP2023184248A (ja) * | 2022-06-17 | 2023-12-28 | コニカミノルタ株式会社 | 超音波診断装置、超音波診断装置の制御方法、及び、超音波診断装置の制御プログラム |
| JP7848607B2 (ja) | 2022-06-17 | 2026-04-21 | コニカミノルタ株式会社 | 超音波診断装置、超音波診断装置の制御方法、及び、超音波診断装置の制御プログラム |
Also Published As
| Publication number | Publication date |
|---|---|
| JP6482686B2 (ja) | 2019-03-13 |
| JPWO2017135167A1 (ja) | 2018-07-26 |
Similar Documents
| Publication | Publication Date | Title |
|---|---|---|
| JP5275830B2 (ja) | 光超音波断層画像化装置および光超音波断層画像化方法 | |
| US11083376B2 (en) | Photoacoustic measurement device and signal processing method of photoacoustic measurement device | |
| US9888856B2 (en) | Photoacoustic image generation apparatus, system and method | |
| JP6049215B2 (ja) | 光音響計測装置並びにそれに利用される信号処理装置および信号処理方法 | |
| JP5719242B2 (ja) | ドプラ画像表示方法および装置 | |
| JP2012196308A (ja) | 光音響画像生成装置及び方法 | |
| JP2013233386A (ja) | 光音響画像生成装置、システム、及び方法 | |
| JP6177530B2 (ja) | ドプラ計測装置およびドプラ計測方法 | |
| JP6289050B2 (ja) | 被検体情報取得装置、情報処理方法、およびプログラム | |
| JP5936559B2 (ja) | 光音響画像生成装置および光音響画像生成方法 | |
| JP5864905B2 (ja) | 被検体情報取得装置及び被検体情報取得方法 | |
| JP5647584B2 (ja) | 光音響画像生成装置及び方法 | |
| JP6482686B2 (ja) | 光音響画像生成システム、装置、及び方法 | |
| US11119199B2 (en) | Acoustic wave image generation apparatus and acoustic wave image generation method | |
| JP5839688B2 (ja) | 光音響画像処理装置、及び方法 | |
| WO2013128921A1 (ja) | 画像生成装置及び方法 | |
| JP6404451B2 (ja) | 光音響計測装置及びプローブ | |
| WO2019044594A1 (ja) | 光音響画像生成装置および画像取得方法 | |
| US11333599B2 (en) | Photoacoustic image generation apparatus, photoacoustic image generation method, and photoacoustic image generation program | |
| JP6475175B2 (ja) | 光音響画像生成装置、システム、及び方法 | |
| JP2015092914A (ja) | 被検体情報取得装置および音響波受信装置 | |
| JP2019083887A (ja) | 情報処理装置および情報処理方法 | |
| JP6513121B2 (ja) | 処理装置、被検体情報取得装置、光音響画像の表示方法、及びプログラム | |
| JP6643108B2 (ja) | 被検体情報取得装置および被検体情報取得方法 | |
| WO2019044212A1 (ja) | 光音響画像生成装置および画像取得方法 |
Legal Events
| Date | Code | Title | Description |
|---|---|---|---|
| 121 | Ep: the epo has been informed by wipo that ep was designated in this application |
Ref document number: 17747324 Country of ref document: EP Kind code of ref document: A1 |
|
| ENP | Entry into the national phase |
Ref document number: 2017565522 Country of ref document: JP Kind code of ref document: A |
|
| NENP | Non-entry into the national phase |
Ref country code: DE |
|
| 122 | Ep: pct application non-entry in european phase |
Ref document number: 17747324 Country of ref document: EP Kind code of ref document: A1 |