WO2017010375A1 - Dispositif d'analyse d'échantillon de tissu et système d'analyse d'échantillon de tissu - Google Patents
Dispositif d'analyse d'échantillon de tissu et système d'analyse d'échantillon de tissu Download PDFInfo
- Publication number
- WO2017010375A1 WO2017010375A1 PCT/JP2016/070019 JP2016070019W WO2017010375A1 WO 2017010375 A1 WO2017010375 A1 WO 2017010375A1 JP 2016070019 W JP2016070019 W JP 2016070019W WO 2017010375 A1 WO2017010375 A1 WO 2017010375A1
- Authority
- WO
- WIPO (PCT)
- Prior art keywords
- tissue sample
- light
- light source
- unit
- image
- Prior art date
Links
Images


Classifications
-
- G—PHYSICS
- G01—MEASURING; TESTING
- G01N—INVESTIGATING OR ANALYSING MATERIALS BY DETERMINING THEIR CHEMICAL OR PHYSICAL PROPERTIES
- G01N21/00—Investigating or analysing materials by the use of optical means, i.e. using sub-millimetre waves, infrared, visible or ultraviolet light
- G01N21/62—Systems in which the material investigated is excited whereby it emits light or causes a change in wavelength of the incident light
- G01N21/63—Systems in which the material investigated is excited whereby it emits light or causes a change in wavelength of the incident light optically excited
- G01N21/64—Fluorescence; Phosphorescence
- G01N21/645—Specially adapted constructive features of fluorimeters
- G01N21/6456—Spatial resolved fluorescence measurements; Imaging
- G01N21/6458—Fluorescence microscopy
-
- G—PHYSICS
- G06—COMPUTING; CALCULATING OR COUNTING
- G06T—IMAGE DATA PROCESSING OR GENERATION, IN GENERAL
- G06T7/00—Image analysis
- G06T7/0002—Inspection of images, e.g. flaw detection
- G06T7/0012—Biomedical image inspection
- G06T7/0014—Biomedical image inspection using an image reference approach
-
- G—PHYSICS
- G06—COMPUTING; CALCULATING OR COUNTING
- G06V—IMAGE OR VIDEO RECOGNITION OR UNDERSTANDING
- G06V20/00—Scenes; Scene-specific elements
- G06V20/60—Type of objects
- G06V20/69—Microscopic objects, e.g. biological cells or cellular parts
-
- G—PHYSICS
- G01—MEASURING; TESTING
- G01N—INVESTIGATING OR ANALYSING MATERIALS BY DETERMINING THEIR CHEMICAL OR PHYSICAL PROPERTIES
- G01N21/00—Investigating or analysing materials by the use of optical means, i.e. using sub-millimetre waves, infrared, visible or ultraviolet light
- G01N21/75—Systems in which material is subjected to a chemical reaction, the progress or the result of the reaction being investigated
- G01N21/77—Systems in which material is subjected to a chemical reaction, the progress or the result of the reaction being investigated by observing the effect on a chemical indicator
- G01N2021/7769—Measurement method of reaction-produced change in sensor
- G01N2021/7786—Fluorescence
-
- G—PHYSICS
- G06—COMPUTING; CALCULATING OR COUNTING
- G06T—IMAGE DATA PROCESSING OR GENERATION, IN GENERAL
- G06T2207/00—Indexing scheme for image analysis or image enhancement
- G06T2207/30—Subject of image; Context of image processing
- G06T2207/30004—Biomedical image processing
- G06T2207/30024—Cell structures in vitro; Tissue sections in vitro
Definitions
- the present invention provides, for example, a tissue sample analyzer that quantifies and images a tissue sample such as a living body brain neurotransmitter and brain neuromodulator at the cellular level, and a tissue sample analyzer including the tissue sample analyzer. About the system.
- the human brain which is a living body, has tens of millions of nerve cells distributed, and as a result of chemical reactions occurring in each cell, all emotions and behaviors, including emotions and emotions. Dominated. Examining at the cellular level what kind of chemical reaction occurs in which area of the brain is a central theme of brain research.
- a test reagent is dropped and reacted with a tissue sample, for example, a sliced brain cell of an animal or the like, and the state of the reaction part is observed. .
- the sliced brain cells are placed on the stage, and the brain cell region is moved by 1 point, 1 point while moving the stage without using the test reagent on the brain cells.
- the stage is returned to the original position.
- the same part of the reaction region of the brain cell measured at the first time is measured one point at a time while moving the stage again to the brain cell using a test reagent.
- the measured value of the location of the brain cell region without using the test reagent is compared with the measured value of the location of the brain cell region using the test reagent.
- Patent Document 1 discloses a tissue sample analyzer that performs such measurement.
- a photomultiplier is attached to a camera mount of a large microscope, and fluorescence emitted from a minute point (for example, a diameter of several tens ⁇ m) of a tissue sample is pinholed. Measure with a large microscope camera and photomultiplier.
- the tissue sample analyzer collects the photometric values of all regions of the tissue sample while moving the stage, and constructs the obtained photometric value data on the coordinates.
- the stage is returned to the origin when the first measurement is completed and the second measurement is started.
- the position display control unit of the tissue sample analyzer compares the position information of the setting position of the first stage with the position information of the setting position of the second stage, and the position information of the setting position of the first stage and 2 When it is determined that there is no difference in the position information of the setting position of the first stage, the setting position information of the second stage is regarded as the setting position information of the first stage, and the position information of the setting position of the first stage is Keep it as it is.
- the position display control unit of the tissue sample analyzer determines that there is a difference between the position information of the setting position of the first stage and the position information of the setting position of the second stage, the setting position of the first stage Display information on the screen.
- the tissue sample analyzer described in Patent Document 1 it is excellent in analysis sensitivity, quantitativeness, and reproducibility, and quickly starts measurement work regardless of the positional accuracy when set on the stage. be able to. For this reason, the tissue sample analyzer described in Patent Document 1 is excellent in that the test reagent localized in the tissue sample can be quantified in a minute range of the tissue sample while maintaining the tissue structure of the macro sample of the tissue sample. ing.
- the tissue sample analyzer described in Patent Document 1 is a large-scale system and is expensive, the analysis operation by the operator is complicated and poor in operability, the analysis time of the tissue sample is long, and the resolution is not sufficient. There are problems such as. If the analysis time of the tissue sample is long, the tissue sample may be deteriorated. Therefore, it is not desirable that the analysis time is long. In addition, with the rapid advancement of learning, when analyzing a tissue sample, it is required to perform a finer analysis result and a higher-speed analysis operation.
- the present invention has been made in view of the above circumstances, and the object of the present invention is to reduce the cost and size of the tissue sample analyzer capable of speeding up the analysis of the tissue sample, and An object of the present invention is to provide a tissue sample analysis system including the tissue sample analyzer.
- a tissue sample analyzer is a tissue sample analyzer that quantitatively analyzes photometric information obtained by irradiating a biological tissue sample with light.
- a light source unit that irradiates the sample with light, and is disposed opposite to the light source unit, and the tissue sample is disposed between the light source unit and light transmitted through the tissue sample or emitted from the tissue sample.
- a flat plate-shaped light receiving portion for receiving the light.
- the tissue sample analyzer of the first aspect of the present invention since the tissue sample is disposed between the light source unit and the light receiving unit, the distribution of the entire chemical substance of the tissue sample can be shortened as photometric information at a time. Can be obtained in time. In addition, since photometric information can be acquired at once in such a short time, it is possible to prevent deterioration of tissue samples due to changes over time, and there is no variation in the technique of the operator of the experiment. Further, when the tissue sample is placed in close contact between the light source unit and the light receiving unit, even when the flatness of the tissue sample is poor, the tissue sample can be flattened for photometry.
- the tissue sample analyzer of the first aspect of the present invention can be reduced in price and size, and the analysis work of the tissue sample can be speeded up. In addition, it is possible to quantify and image chemical substances that are unevenly distributed in the tissue sample.
- the tissue sample analyzer according to the second aspect of the present invention is characterized in that the light emitted from the light source unit to the tissue sample is parallel light.
- tissue sample analyzer According to the tissue sample analyzer according to the second aspect of the present invention, it is easy to obtain a two-dimensional quantitative image with high quantitativeness.
- the tissue sample analyzer according to the third aspect of the present invention is characterized in that the light source section is flat.
- the light source section is flat, and thus the irradiated light is likely to be parallel light or light having parallelism similar to this parallel light. Therefore, it is easy to obtain a two-dimensional quantitative image with high quantitativeness. Further, when the tissue sample is placed in close contact between the light source unit and the light receiving unit, it can be expected that the light source unit is in a flat plate shape so that the tissue sample is more closely attached.
- the tissue sample analyzer according to the fourth aspect of the present invention is characterized in that the tissue sample is a tissue sample to which a test reagent is added.
- the tissue sample analyzer of the fourth aspect of the present invention when the chemical substance contained in the tissue sample is changed to photometric information by the addition of a test reagent, the chemical substance in the entire tissue sample Can be obtained.
- the test reagent is a fluorescent material, and excitation light that excites the fluorescent material added to the tissue sample between the light source unit and the tissue sample.
- a band pass filter that transmits light is disposed, and an absorption filter that transmits fluorescence emitted by the fluorescent material added to the tissue sample is disposed between the tissue sample and the light receiving unit.
- the bandpass filter can give only the light of the wavelength that fluoresces the fluorescent substance as the reagent added to the tissue sample to the tissue sample. Fluorescence emitted from the fluorescent material of the tissue sample passes through the absorption filter, and other leakage light of excitation light is blocked or removed by the absorption filter, so that only the fluorescence or substantially only the fluorescence is reliably received by the light receiving unit. Light can be received. For this reason, it becomes possible to quantify and image the chemical substance unevenly distributed in the tissue sample.
- the tissue sample analyzer according to the sixth aspect of the present invention is characterized in that the test reagent is a stain.
- tissue sample analyzer for example, a tissue sample unsuitable for immunohistochemical staining such as lipids is stained with a general histochemical stain or the like.
- concentration distribution of the target substance in the tissue sample can be photometrically measured as the transmittance distribution.
- a band that transmits only a light component in a wavelength region where absorption of a stain added to the tissue sample is large is interposed between the light source unit and the tissue sample.
- a path filter is arranged.
- the absorbance of the stained portion stained with the histochemical stain is more accurately determined. Can be measured.
- tissue sample analyzer In the tissue sample analyzer according to the eighth aspect of the present invention, only the light component in the wavelength region where the absorption of the stain added to the tissue sample is large is transmitted between the tissue sample and the light receiving unit.
- An absorption filter is arranged.
- the absorbance of the stained portion stained with the histochemical stain is more accurately determined. Can be measured.
- the tissue sample analyzer according to the ninth aspect of the present invention is characterized in that the light receiving unit is configured by two-dimensionally arranging solid-state imaging devices.
- tissue sample analyzer of the ninth aspect of the present invention it is not necessary to use a large microscope or a photomultiplier because the solid-state imaging device only needs to be two-dimensionally arranged as the light receiving unit.
- the tissue sample analyzer can be greatly reduced in size and price.
- the tissue sample analyzer is characterized in that the light source unit is configured by two-dimensionally arranging a plurality of light emitting diodes.
- tissue sample analyzer of the tenth aspect of the present invention it is only necessary to two-dimensionally arrange a plurality of light-emitting diodes as the light source unit, and therefore it is not necessary to use a large microscope or photomultiplier.
- the tissue sample analyzer can be greatly reduced in size and price.
- the light source unit is configured by electroluminescence in a flat plate shape
- the light receiving unit is configured by two-dimensionally arranging solid-state imaging elements. It is characterized by.
- the light source unit is configured by electroluminescence in a flat plate shape, and the light receiving unit only needs to be two-dimensionally arranged as a solid-state imaging device. Since there is no need to use a large microscope or photomultiplier, the tissue sample analyzer can be significantly reduced in size and price.
- a tissue sample analyzer includes a protection mechanism for preventing damage due to contact between the light source unit or the light receiving unit and the tissue sample or a preparation including the tissue sample. .
- tissue sample analyzer of the twelfth aspect of the present invention direct contact and breakage between the light source unit 30 or the light receiving unit 31 and the tissue sample M or the preparation containing the tissue sample M can be prevented. .
- a tissue sample analysis system includes a tissue sample analyzer, a high-definition image acquisition device that acquires a high-definition image of the tissue sample, and a quantitative image created by the tissue sample analyzer. And an integrated control unit for associating the high-definition image acquired by the high-definition image acquisition device.
- the quantitative image created by the tissue sample analyzer is associated with the high-definition image acquired by the high-definition image acquisition device. It is possible to analyze a chemical substance in a sample by a two-dimensional image complex in which a quantitative image excellent in quantification and a high-definition image with high resolution are linked and associated by coordinates. Furthermore, a three-dimensional image composite in which a two-dimensional image composite of a plurality of continuous tissue sections is three-dimensionally constructed can be formed. For example, it is possible to reconstruct and prepare the thickness when cutting continuous tissue sections in consideration of the coordinate information.
- a tissue sample analysis system includes the tissue sample analyzer, a high-definition image reading unit that reads a high-definition image of the tissue sample, and a quantitative image created by the tissue sample analyzer.
- An integrated control unit for associating the high-definition image read by the high-definition image reading unit.
- the quantitative image created by the tissue sample analyzer is associated with the high-definition image read by the high-definition image reading unit. It is possible to analyze a chemical substance in a sample by a two-dimensional image complex in which a quantitative image excellent in quantification and a high-definition image with high resolution are linked and associated by coordinates. Furthermore, a three-dimensional image composite in which a two-dimensional image composite of a plurality of continuous tissue sections is three-dimensionally constructed can be formed. For example, it is possible to reconstruct and prepare the thickness when cutting continuous tissue sections in consideration of the coordinate information.
- tissue sample analyzer it is possible to reduce the price and size, and to increase the speed of the analysis work of the tissue sample.
- tissue sample analysis system according to the present invention in addition to the effects of the tissue sample analysis apparatus according to the present invention, a quantitative image excellent in quantification and a high-resolution image with high resolution can be linked to the chemical substance in the tissue sample by coordinates. It is possible to analyze with 2D and 3D image composites attached and associated.
- FIG. 1 is an overall view showing a tissue sample analyzer according to a first embodiment of the present invention. It is a block diagram which shows the structural example of the tissue sample analyzer shown in FIG. It is a perspective view which shows a light source part, a light-receiving part, a tissue sample M, etc. It is a front view which shows a light source part, a light-receiving part, the tissue sample M, etc. It is a figure which shows the space
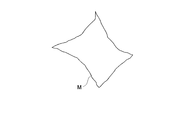
- 2 is a diagram illustrating an example of a tissue sample M.
- FIG. It is a figure which shows an example of the two-dimensional quantitative image obtained by adding a fluorescent substance to the tissue sample M shown in FIG.
- FIG. 1 It is a perspective view which shows the tissue sample analyzer which concerns on 2nd Embodiment of this invention. It is a front view which shows the tissue sample analyzer which concerns on 2nd Embodiment of this invention. It is a block diagram which shows the structural example of the tissue sample analysis system which concerns on 3rd Embodiment of this invention. It is a figure which shows an example of a structure of the two-dimensional image complex which consists of a two-dimensional fixed_quantity
- FIG. 1 It is a figure which shows an example of a structure of the two-dimensional image complex which consists of a two-dimensional fixed_quantity
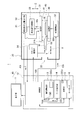
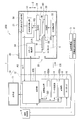
- FIG. 1 is an overall view showing a tissue sample analyzer according to a first embodiment of the present invention.
- FIG. 2 is a block diagram showing a configuration example of the tissue sample analyzer shown in FIG.
- the tissue sample analyzer 1 shown in FIGS. 1 and 2 can measure photometric information of a single tissue sample in, for example, several minutes, regardless of the size of the biological tissue sample M. Has the ability to analyze.
- the tissue sample analyzer 1 can also be called a tissue sample analyzer or a quantitative lensless imaging analyzer.
- the tissue sample analyzer 1 is necessary for the following purposes.
- This device immunohistochemically stains a tissue sample on a slide glass and finely measures the intensity of fluorescence and absorption emitted from the target substance under a microscope.
- the above apparatus makes it possible to quantitatively image chemical reactions when various biological phenomena are manifested by this technique.
- the above-described apparatus has elucidated the onset mechanism using several disease model animals and human pathological tissue samples.
- mapping analyzer device is used in research sites as an advanced measurement and analysis instrument for elucidating the basic mechanism of life phenomena, elucidating the onset mechanism of diseases, and developing new therapeutic drugs.
- the mapping analyzer device has been highly evaluated both in Japan and overseas, and plays a leading role in the development of microscopic imaging devices.
- a microscopic imaging apparatus using a later laser confocal microscope or a CCD (charge imaging device) camera provides a clear and fine tissue image, but has a problem in quantitativeness. Imaging mass spectrometers cannot easily identify the distribution of biological material with the same mass.
- mapping analyzer device is a large-scale device and has problems such as a complicated analysis operation and a long analysis time. For this reason, with the rapid progress of academics in this field, finer analysis and faster analysis are required.
- the tissue sample analyzer 1 solves such problems, can be reduced in price and size, and can analyze photometric information in a finer region of the tissue sample M. Thus, the analysis work of the tissue sample M can be speeded up.
- the tissue sample analyzer 1 is a tissue sample analyzer that quantitatively analyzes photometric information obtained by irradiating a biological tissue sample with light.
- the tissue sample analyzer 1 is disposed opposite to the light source unit 30 for irradiating the tissue sample with light, and transmits the tissue sample with the tissue sample disposed between the light source unit 30 and the light source unit 30.
- a plate-shaped light receiving unit 31 that receives the light emitted from the tissue sample.
- the tissue sample analyzer 1 is a device that obtains two-dimensional distribution information (hereinafter also referred to as “distribution information OD”) of the photometric information AS of the tissue sample M, and performs quantification and two-dimensional imaging of the tissue sample M. is there.
- the tissue sample analyzer 1 includes a control device 10 and a tissue sample analyzer 20.
- the tissue sample analyzer 20 has a function of acquiring photometric information AS from the tissue sample M.
- the control device 10 has a function of creating various information based on the photometric information AS acquired by the tissue sample analyzer 20, controlling the tissue sample analyzer 20, and performing various calculations.
- a general-purpose small computer PC
- the tissue sample analyzer 1 can be reduced in price and size.
- the photometry information AS the two-dimensional distribution information (distribution information OD) of the photometry information AS, the quantification and two-dimensional imaging of the tissue sample M will be described.
- the photometric information AS of the tissue sample M is information composed of a numerical sequence in which coordinate information in the light receiving unit 31 is added to the photometric value RS.
- the photometric value RS refers to the light that is transmitted from the tissue sample M by the illumination light emitted from the light source unit 30 or the light emitted from the tissue sample M, respectively, for each of a number of photoelectric conversion elements that constitute the light receiving unit 31. Is information obtained by converting into an electrical signal.
- the photoelectric conversion element as described later, for example, a light receiving element of a CMOS (complementary metal oxide semiconductor) image sensor (solid-state imaging element) is used.
- CMOS complementary metal oxide semiconductor
- the photometric value RS is expressed as, for example, a gradation value of light detected by one pixel composed of a CMOS image sensor element constituting the light receiving unit 31.
- the photometric value RS is information corresponding to a quantitative analysis value of a chemical substance unevenly distributed in the tissue sample M, for example.
- the photometric information AS of the tissue sample M is, for example, the gradation of light detected by one pixel of the light receiving unit 31. This is information obtained by adding coordinate information in the light receiving unit 31 of one pixel to the value.
- the photometric value RS indicates that the spectrum of the transmitted light of the tissue sample M changes depending on the state of the inspection reagent such as a fluorescent substance or a chemical substance present in the tissue sample M, or light of a specific wavelength is used to inspect the tissue sample M. It may be absorbed by a reagent or chemical substance, or the intensity of a specific wavelength of the transmitted light of the tissue sample M may change. Due to such a property, according to the photometric value RS, the property of the chemical substance and the amount of the chemical substance in the tissue sample M can be measured. Further, according to the photometric value RS, it is possible to measure a chemical substance such as a dye originally contained in the tissue sample M even in a state where a test reagent such as a fluorescent substance is not present in the tissue sample M. is there.
- the two-dimensional distribution information (distribution information OD) of the photometric information AS of the tissue sample M is a plurality of photometric values RS included in the multiple photometric information AS, and coordinate information where each photometric value RS exists in the light receiving unit 31.
- the information is arranged two-dimensionally so as to correspond to.
- the distribution information OD is information including a numerical matrix in which the photometric values RS are arranged based on the coordinate information in the light receiving unit 31 added to the photometric information AS.
- the distribution information OD includes the gradation values of a large number of lights detected by a large number of pixels.
- the information is composed of a numerical matrix of light gradation values arranged two-dimensionally based on the coordinate information of each pixel.
- the distribution information OD is information from which the two-dimensional imaging data GD that is information for displaying a two-dimensional image on the display unit 11 is generated.
- a two-dimensional image can be constructed by computing distribution information OD.
- the light receiving unit 31 has a rectangular shape in which a large number of quadrangular pixels having sides parallel in the vertical and horizontal directions are two-dimensionally arranged, and the corner portion of the tissue sample M in which the light receiving unit 31 is directed in the vertical and horizontal directions.
- the distribution information OD of the tissue sample M will be considered using an example of a rhombus shape having.
- the size of the pixel of the light receiving unit 31 is not small enough to reproduce the shape of the corner and the hypotenuse of the tissue sample M as they are.
- the quantification of the tissue sample M means associating a quantitative analysis value of the amount of chemical substance unevenly distributed in the tissue sample M for each part corresponding to each photoelectric conversion element constituting the light receiving unit 31.
- the quantification of the tissue sample M is achieved by creating the distribution information OD of the tissue sample M.
- the distribution information OD of the tissue sample M includes a light measurement value RS such as a light gradation value, which is two-dimensionally arranged based on the coordinate information of each photoelectric conversion element in the light receiving unit 31.
- the information consists of a numerical matrix of gradation values.
- the two-dimensional imaging of the tissue sample M means creating two-dimensional imaging data GD that is image data constituting the two-dimensional image from the distribution information OD.
- Control device 10 The control device 10 will be described.
- the control device 10 includes a display unit 11 and a control main body unit 12.
- the control main body unit 12 includes a control unit 100, an image configuration unit 13, a data calculation unit 14, a storage unit 15, and a keyboard 16.
- the display unit 11 is electrically connected to the control unit 100 of the control main body unit 12, and based on a control signal from the control unit 100, a two-dimensional image of the tissue sample M or a micrograph acquired from outside the tissue sample analyzer 1. High-definition images such as can be displayed.
- the two-dimensional image of the tissue sample M for example, a two-dimensional image in which a chemical substance contained in the tissue sample M is quantified and displayed is used.
- control signal from the control unit 100 examples include two-dimensional imaging data GD described later.
- the two-dimensional imaging data GD is variously processed by the control device 10 based on the photometric information AS acquired from the tissue sample M by the tissue sample analysis unit 20 and finally image data created by the image construction unit 13. It is.
- a color liquid crystal display device can be used as the display unit 11.
- the display unit 11 can display in color the analysis example EX of the effect of music on the brain function, for example, as shown in FIG. 1, according to the control signal from the control unit 100.
- the concentration of a neurotransmitter (dopamine) that gives a pleasant sensation when music is listened to by a rat (right) than when the music is not listened to by a rat (left). has increased significantly.
- the analysis example EX is an example in which a change in emotion is molecularly converted into a two-dimensional image.
- control unit 100 of the control main body unit 12 is electrically connected to an image configuration unit 13, a data calculation unit 14, a storage unit 15, and a keyboard 16 as an information input unit. Accordingly, the control unit 100 can exchange information with the image configuration unit 13, the data calculation unit 14, the storage unit 15, and the keyboard 16.
- the data calculating unit 14 has a function of calculating based on photometric information AS obtained by analyzing the tissue sample M obtained from the tissue sample analyzing unit 20 and creating two-dimensional distribution information (distribution information OD) of the photometric information AS. Have.
- the distribution information OD is information used to create the two-dimensional imaging data GD that is image data for displaying the two-dimensional image on the display unit 11.
- the distribution information OD is arithmetically processed by the image construction unit 13 described below, two-dimensional imaging data GD that is image data for displaying a two-dimensional image on the display unit 11 is constructed.
- the image construction unit 13 has a function of constructing the two-dimensional imaging data GD from the distribution information OD.
- the two-dimensional imaging data GD is image data for displaying a two-dimensional image on the display unit 11.
- the storage unit 15 stores information such as distribution information OD and two-dimensional imaging data GD.
- a user of the tissue sample analyzer 1 can use the keyboard 16 to input necessary data and information to the control unit 100 and input commands to the control unit 100.
- tissue sample analysis unit Next, the tissue sample analyzer 20 will be described.
- the tissue sample analyzer 20 has a box-shaped housing 21, and an opening 22 for introducing the tissue sample M is provided on the front side of the housing 21. ing.
- the tissue sample analysis unit 20 adds a test reagent such as a fluorescent substance to the tissue sample M, and the light receiving unit 31 receives and photoelectrically converts light such as fluorescence emitted from the test reagent based on the light emitted from the light source unit 30.
- a test reagent such as a fluorescent substance
- the light receiving unit 31 receives and photoelectrically converts light such as fluorescence emitted from the test reagent based on the light emitted from the light source unit 30.
- it has a function of analyzing a chemical substance localized in the tissue sample M and quantifying it in a minute range of the tissue sample M.
- a fluorescent substance is used as a test reagent, a fluorescent substance is added to the tissue sample M, and the fluorescence emitted by the fluorescent substance is received, thereby analyzing a chemical substance localized in the tissue sample M and analyzing the tissue sample M.
- the operation of quantifying in a minute range is called a fluorescence mode.
- a light source unit 30, a light receiving unit 31, a light source driving unit 32, a received light signal amplifying unit 33, and a stage driving unit 34 are accommodated in the housing 21.
- the light source unit 30 is configured by, for example, arranging a plurality of light emitting diodes two-dimensionally.
- the light source unit 30 may be configured in a flat plate shape by electroluminescence, for example.
- the tissue sample M can be held between the light receiving unit 31 and the measurement surface of the tissue sample M can be flattened as described later.
- the light source part 30 can also be set as the structure which is not flat form.
- the light receiving unit 31 is configured by two-dimensionally arranging solid-state imaging elements.
- the light receiving unit 31 may be configured by, for example, two-dimensionally arranging solid-state imaging elements.
- the light source unit 30 and the light receiving unit 31 can hold the tissue sample M between them so that the tissue sample M can be disposed between them, and preferably between them. They are arranged in parallel so as to face each other.
- the light source unit 30 and the light receiving unit 31 have substantially the same size, and are both rectangular or square.
- the shape of the light source part 30 or the light-receiving part 31 is a shape which can hold
- the light source unit 30 is arranged on the lower side in the drawing, and the light receiving unit 31 is arranged on the upper side in the drawing.
- the light source unit 30 shown in FIG. 2 is a plate-like light emitter that is disposed along the X direction and the Y direction orthogonal to the X direction.
- a light source unit 30 for example, a self-luminous panel type light source unit 30 in which a plurality of LEDs (light emitting diodes) are two-dimensionally arranged along the X direction and the Y direction is used.
- the light source unit 30 is electrically connected to the light source driving unit 32.
- the light source driving unit 32 is electrically connected to the control unit 100.
- the light source driving unit 32 drives the light source unit 30 so that the light source units 30 emit light all at once. It has become. .
- the light receiving unit 31 has a flat plate shape, is disposed to face the light source unit 30, and is in a state in which the tissue sample M is disposed between the light source unit 30, preferably the tissue sample M is sandwiched between the light source unit 30. In this state, light transmitted through the tissue sample M or light emitted from the tissue sample M is received.
- the light receiving unit 31 has a photoelectric conversion element, and receives light such as fluorescence emitted from the test reagent in the tissue sample M based on the light emitted from the light source unit 30 and photoelectrically converts it to create photometric information AS.
- the light receiving unit 31 is configured, for example, such that a plurality of light receiving elements of a CMOS (complementary metal oxide semiconductor) image sensor (solid-state imaging element) as a photoelectric conversion element are arranged on a plane.
- CMOS complementary metal oxide semiconductor
- solid-state imaging element solid-state imaging elements
- light receiving elements of a plurality of CMOS image sensors may be two-dimensionally arranged along the X direction and the Y direction.
- the CMOS image sensor elements used for the light receiving unit 31 are arranged one by one in a section partitioned in a grid pattern vertically and horizontally at a pitch of several microns, for example.
- One section of the CMOS image sensor element corresponds to one pixel.
- the light receiving signal amplifying unit 33 is electrically connected to the light receiving unit 31.
- the received light signal amplifier 33 has a function of amplifying the photometric value RS included in the photometric information AS acquired from the light receiver 31.
- the received light signal amplifier 33 is electrically connected to the controller 100 of the control main body 12. As a result, the light reception signal amplifying unit 33 can send the photometric information AS having the amplified photometric value RS to the control unit 100.
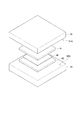
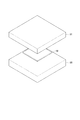
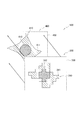
- FIGS. 3 is a perspective view showing the light source unit 30, the light receiving unit 31, the tissue sample M and the like
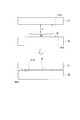
- FIG. 4 is a front view showing the light source unit 30, the light receiving unit 31, the tissue sample M and the like.
- FIG. 5 is a diagram illustrating the distance d between the upper surface of the tissue sample M and the lower surface of the absorption filter 41.
- a band pass filter 40 and an absorption filter 41 are disposed between the light source unit 30 and the light receiving unit 31.
- the band-pass filter 40 is a filter having a property of transmitting primary light such as excitation light emitted from the light source unit 30 that excites the fluorescent substance added to the tissue sample, but not transmitting light other than the primary light. is there.
- the absorption filter 41 does not transmit or remove the primary light, while receiving the primary light, and transmits the fluorescence emitted by the fluorescent material added to the tissue sample to transmit the lower surface of the light receiving unit 31 (light receiving surface).
- a filter having the property of leading to the 31A side is a filter having a property of transmitting primary light such as excitation light emitted from the light source unit 30 that excites the fluorescent substance added to the tissue sample, but not transmitting light other than the primary light. is there.
- the absorption filter 41 does not transmit or remove the primary light, while receiving the primary light, and transmits the fluorescence emitted by the fluorescent material added to the tissue sample
- the bandpass filter 40 and the absorption filter 41 are formed in a shape similar to that of the light source unit 30 and the light receiving unit 31 and slightly the same as or slightly smaller than the light source unit 30 and the light receiving unit 31.
- the light source unit 30 and the light receiving unit 31 are rectangular or square plate-shaped members, respectively.
- the sizes of the bandpass filter 40 and the absorption filter 41 are formed to be slightly smaller than the sizes of the light source unit 30 and the light receiving unit 31.
- the relationship among the sizes of the light source unit 30, the light receiving unit 31, the band pass filter 40, and the absorption filter 41 is not particularly limited.
- the sizes of the bandpass filter 40 and the absorption filter 41 may be formed larger than the sizes of the light source unit 30 and the light receiving unit 31.
- the size of the bandpass filter 40 and the absorption filter 41 is greater than or equal to the size of the light source unit 30 and the light receiving unit 31, and the size of the light source unit 30 and the light receiving unit 31 is larger than that of the tissue sample M. Can be.
- the biological tissue sample M shown in FIG. 4 and FIG. 5 is a sample that can analyze a chemical substance localized in the tissue sample M and quantify it in a minute range of the tissue sample M.
- the tissue sample M is a sample composed of a tissue sample labeled with a test reagent such as a fluorescent substance, or a tissue sample itself not labeled with a test reagent or the like. That is, the tissue sample M may be a tissue sample to which a test reagent is added, or may be a tissue sample to which no test reagent is added.
- a test reagent added to the tissue sample M a fluorescent substance or a staining agent can be used.
- the fluorescent substance a commercially available fluorescent labeling reagent, for example, a dye such as a rhodamine derivative can be used.
- the tissue sample analyzer 1 is an apparatus used when a fluorescent substance is added to the tissue sample M, and has a configuration suitable for adding the fluorescent substance to the tissue sample M. That is, in the tissue sample analyzer 1, the tissue sample M is disposed between the bandpass filter 40 and the absorption filter 41 as shown in FIGS. The size of the tissue sample M is slightly smaller than the sizes of the bandpass filter 40 and the absorption filter 41.
- the sizes of the bandpass filter 40 and the absorption filter 41 are preferably set slightly smaller than the sizes of the light source unit 30 and the light receiving unit 31. Further, the size of the tissue sample M is set to be slightly smaller than the sizes of the bandpass filter 40 and the absorption filter 41.
- the distance between the light emitting surface 30 ⁇ / b> A of the light source unit 30 and the lower surface of the bandpass filter 40 is indicated by a symbol f
- the interval between the upper surface of the bandpass filter 40 and the lower surface of the tissue sample M is indicated by a symbol.
- e the interval between the upper surface of the tissue sample M and the lower surface of the absorption filter 41
- d a distance between the upper surface of the absorption filter 41 and the light receiving surface 31A of the light receiving unit 31
- the interval f, the interval e, and the interval c are 0 ⁇ m.
- the light emitting surface 30A of the light source unit 30 and the lower surface of the bandpass filter 40 are in close contact, and the upper surface of the bandpass filter 40 and the lower surface of the tissue sample M are also in close contact.
- the upper surface of the absorption filter 41 and the light receiving surface 31A of the light receiving unit 31 are also in close contact with each other.
- the light emitting surface 30A of the light source unit 30 and the lower surface of the bandpass filter 40 are in close contact, the light emitted from the light emitting surface 30A of the light source unit 30 enters the bandpass filter 40 without spreading.
- the light source unit 30 When the light source unit 30 emits parallel light, the light emitted from the light emitting surface 30A is spread even if the light emitting surface 30A of the light source unit 30 and the lower surface of the bandpass filter 40 are separated from each other. Without being incident on the bandpass filter 40. For this reason, when the light source part 30 irradiates parallel light, the space
- the distance d between the upper surface of the tissue sample M and the lower surface of the absorption filter 41 shown in FIGS. 4 and 5 is not particularly limited, but is usually in the range of 0 to 600 ⁇ m, preferably 0 to It is in the range of 50 ⁇ m, more preferably in the range of 0 to 20 ⁇ m. That is, the upper surface of the tissue sample M and the lower surface of the absorption filter 41 are in close contact with each other or are arranged so as to be separated by a predetermined distance d. When the upper surface of the tissue sample M and the lower surface of the absorption filter 41 are in close contact, the tissue sample M is sandwiched between the light source unit 30 and the light receiving unit 31, and the resolution of the obtained two-dimensional image is increased.
- the distance d between the upper surface of the tissue sample M and the lower surface of the absorption filter 41 can be separated within a range of, for example, 600 ⁇ m or less as described above. Generally, the resolution of the two-dimensional image obtained becomes higher as the distance d is closer to 0 ⁇ m.
- the light receiving unit 31 can move up and down in the Z direction.
- the vertical movement of the light receiving unit 31 is performed by operating the positioning unit 50 of the light receiving unit in response to a command from the control unit 100.
- the light source unit 30 is fixed to a fixed stage (not shown), and the light receiving unit 31 is fixed to a moving stage (not shown).
- the tissue sample M is placed on the upper surface of the band-pass filter 40 as shown in FIG.
- the distance d between the upper surface of the tissue sample M and the lower surface of the absorption filter 41 can be adjusted.
- the numerical value of the interval d is confirmed by laser distance measurement or the like.
- the light receiving unit 31 side can be moved up and down in the Z direction using the positioning unit 50 of the light receiving unit.
- the light source unit 30 side can be moved up and down in the Z direction by the operation of the light source unit positioning unit (not shown) in response to a command from the control unit 100. May be.
- the tissue sample analyzer 1 first, as shown in FIG. 1, the user places the tissue sample M on a pedestal (scanning stage) 55, and then places the pedestal 55 from the opening 22 of the casing 21 into the casing 21. Put in. Next, the stage drive unit 34 moves the pedestal 55 between the light source unit 30 and the light receiving unit 31 and moves the tissue sample M from the pedestal 55 to the upper surface of the bandpass filter 40 in accordance with an instruction from the control unit 100. Be able to.
- the tissue sample M is usually held in a preparation or the like made of glass or the like.
- a preparation or the like made of glass or the like For example, in fluorescent tissue immunostaining, if an encapsulant that is not completely solidified is used as a mounting agent when fixing a tissue sample to a preparation, it is not preferable to place the preparation upside down because the cover glass is temporarily fixed.
- the measurement is performed in a state where the tissue sample M is not completely fixed. Is disposed, and the light receiving unit 31 is disposed on the upper side.
- FIGS. 2 to 5 show the tissue sample analyzer 1 in a state where the light source unit 30 is disposed on the lower side and the light receiving unit 31 is disposed on the upper side.
- the light source unit 30 and the light receiving unit 31 are arranged so that the state where the light source unit 30 is arranged on the lower side and the light receiving unit 31 is arranged upside down. You may make it a movable structure. For example, if the preparation using the tissue sample M is configured so that it can be turned upside down, the light source unit 30 and the light receiving unit 31 are rotated while holding the tissue sample M, so that the light source unit 30 is located on the lower side and the light receiving unit 31. The light source unit 30 may be placed on the upper side and the light receiving unit 31 may be placed on the lower side. Examples of the preparation that can be turned upside down include a preparation that does not cause the cover glass or the tissue sample M to fall off when the encapsulant is completely solidified.
- the tissue sample analyzer is used in a state where the light source unit 30 and the light receiving unit 31 are not reversed upside down.
- the tissue sample analyzer in which the light source unit 30 and the light receiving unit 31 are not reversed upside down for example, the tissue sample analyzing device 1 shown in FIGS. 2 to 5 and the light source unit 30 and the light receiving unit 31 can be turned upside down.
- preparations that cannot be turned upside down include preparations that are temporarily fixed with an encapsulant because the encapsulant does not solidify, and that there is a risk that the cover glass may fall off or the tissue sample M may fall off. Is mentioned.
- the preparation in the case where fluorescent tissue immunostaining or the like is performed on the tissue sample M is a preparation that cannot be turned upside down.
- the light source unit 30 when the encapsulant is an object to be measured such as a cover glass or a tissue sample that does not move or drop out, such as completely solidified, the light source unit 30 is on the upper side and the light receiving unit 31 is on the lower side. Therefore, as another embodiment (not shown), a tissue sample analyzer in which the light source unit 30 is disposed on the upper side and the light receiving unit 31 is disposed on the lower side can be used. As a tissue sample analyzer in which the light source unit 30 is disposed on the upper side and the light receiving unit 31 is disposed on the lower side, for example, the state in which the light source unit 30 is disposed on the upper side and the light receiving unit 31 is disposed on the lower side is fixed. A tissue sample analyzer can be used.
- tissue sample analyzer in which the light source unit 30 is disposed on the upper side and the light receiving unit 31 is disposed on the lower side, for example, the light source unit 30 and the light receiving unit 31 are rotated while holding the tissue sample M.
- tissue sample analyzer that can change the state in which the light source unit 30 is disposed on the upper side and the light receiving unit 31 is disposed on the lower side to the state in which the light source unit 30 is disposed on the lower side and the light receiving unit 31 is disposed on the upper side. it can.
- tissue sample analyzer 1 when the above-described tissue sample analyzer 1 is used, a fluorescent substance is used as a test reagent, the two-dimensional distribution of the photometric information AS of the tissue sample M is obtained, and the tissue sample M is quantified and two-dimensionally imaged. An example of the operation will be described.
- photometric information AS (AS B ) is acquired for a tissue sample M in a blank state to which no fluorescent substance is added.
- the photometric information AS of the blank tissue sample M to which no fluorescent substance is added is particularly referred to as AS B.
- the photometric information AS B is information consisting of a numerical sequence in which coordinate information in the light receiving unit 31 is added to a photometric value RS (RS B ) of a blank tissue sample M to which no fluorescent substance is added.
- the photometric information AS is acquired in the same manner as the procedure of “Measurement using the tissue sample M to which a fluorescent substance is added” described later, except that no fluorescent substance is added to the tissue sample M.
- the photometric information AS of the blank tissue sample M to which no fluorescent substance is added includes a band-pass filter 40 disposed on the surface of the light emitting surface 30 ⁇ / b> A of the light source unit 30, and the light receiving unit 31. In a state where the absorption filter 41 is disposed on the surface of 31A, the tissue sample M is sandwiched between the bandpass filter 40 and the absorption filter 41 and acquired in advance.
- the photometric information AS B of the blank tissue sample M to which no fluorescent substance is added is processed by the data calculation unit 14 to create two-dimensional distribution information (distribution information OD B ) of the photometric information AS B.
- the distribution information OD B is information including a numerical matrix in which the photometric values RS B are arranged based on the coordinate information in the light receiving unit 31 added to the photometric information AS B.
- the obtained distribution information OD B as shown in FIG. 2, previously stored in a storage unit 15 and an image construction unit 13.
- tissue sample M is, for example, immunohistochemically stained with a fluorescent material.
- the user places the tissue sample M to which the fluorescent material has been added on the pedestal 55, and then places the pedestal 55 in the casing 21 from the opening 22 of the casing 21 as shown in FIG. Put in.
- the stage drive unit 34 moves the pedestal 55 to the light source unit 30 side according to a command from the control unit 100, and moves the tissue sample M from the pedestal 55 to the upper surface of the bandpass filter 40.
- the tissue sample M to which the fluorescent material has been added is interposed between the light emitting surface 30A on which the LED of the light source unit 30 is disposed and the light receiving surface 31A of the light receiving unit 31 via the bandpass filter 40 and the absorption filter 41.
- the tissue sample M and the absorption filter 41 may be separated from each other.
- the wavelength of light generated by each LED of the light source unit 30 is in the region from ultraviolet to visible light.
- Fluorescence excitation light among the light of each LED of the light source unit 30 passes through the bandpass filter 40 and reaches the tissue sample M to which the fluorescent material is added.
- the fluorescent substance in the tissue sample M is excited by the fluorescence excitation light of each LED of the light source unit 30 and emits fluorescence.
- Fluorescence emitted from the fluorescent material in the entire region of the tissue sample M passes through the absorption filter 41 and reaches the light receiving surface 31A where a large number of CMOS image sensor elements as photoelectric conversion elements of the light receiving unit 31 are arranged. Other leakage light of the excitation light is blocked by the absorption filter 41.
- the light receiving unit 31 measures the intensity of the fluorescence emitted from the fluorescent material for each of a large number of CMOS image sensor elements constituting the light receiving surface 31A and the entire CMOS image sensor elements existing on the light receiving surface 31A. Is obtained.
- the photometric value RS is obtained by the number of CMOS image sensor elements. Since the light receiving surface 31A of the light receiving unit 31 includes the tissue sample M and is larger than the tissue sample M, the photometric value RS is obtained for the entire light receiving unit 31 including the entire region of the tissue sample M.
- the photometric value RS is added with the coordinate information of the CMOS image sensor element on the light receiving surface 31A of the light receiving unit 31 and becomes photometric information AS.
- the photometric information AS is sent to the control unit 100 after the photometric value RS included therein is amplified by the received light signal amplifying unit 33.
- the CMOS image sensor elements constituting the light receiving unit 31 are arranged in a state of being divided into a grid pattern vertically and horizontally at a pitch of several microns, for example.
- One square of the CMOS image sensor element corresponds to one pixel.
- the fluorescence intensity (photometric value RS) of the fluorescent substance distributed in the entire region of the tissue sample M has a resolution of several microns.
- the photometric information AS obtained by adding the coordinate information of the CMOS image sensor element of the light receiving surface 31A of the light receiving unit 31 to the photometric value RS is formed for the entire CMOS image sensor element of the light receiving surface 31A of the light receiving unit 31.
- the fluorescence intensity (photometric value RS) of the fluorescent substance distributed in the entire region of the tissue sample M can be obtained in a short time over the entire region of the tissue sample M with a resolution of several microns. For example, it can be measured simultaneously in several minutes.
- the data calculation unit 14 calculates and creates distribution information OD of the photometric information AS for two-dimensional image configuration from the photometric information AS formed by the tissue sample analysis unit 20. For example, the data calculation unit 14 adjusts the intensity of the color and displays the color information of the distribution information OD of the photometric information AS for two-dimensional image configuration so that the data calculation unit 14 can be displayed on the display unit 11 for easy viewing. The type of color can be selected.
- the control unit 100 sends the adjusted distribution information OD of the photometric information AS for image configuration to the image configuration unit 13.
- Image constructing unit 13 for example, with respect to the distribution information OD B tissue samples M of blank without the addition of a fluorescent substance, by superimposing the distribution information OD tissue samples M was added fluorescent substance, the tissue sample M Colored two-dimensional imaging data GD is constructed.
- the two-dimensional imaging data GD means general-purpose image data created based on a certain rule for storing the distribution information OD.
- a two-dimensional image obtained by color-coding the distribution information OD based on a certain rule is used for data visualization.
- This color classification is performed, for example, by classifying the intensity value of the photometric value RS included in the photometric information AS by a histogram or the like, and the class to which the intensity value of the photometric value RS belongs to the pixel corresponding to the coordinates of the coordinate information included in the photometric information AS. It is realized by coloring according to. In this color coding, colors may be colored with different hues.
- a 16-bit numerical matrix composed of the photometric value RS based on the coordinates of the photometric information AS is converted into an image format of a 16-bit monochrome image format. You may express using.
- the image format at this time may be an existing general-purpose format or a unique original format.
- This two-dimensional imaging data GD is sent from the image construction unit 13 to the control unit 100.
- the control unit 100 displays a two-dimensional quantitative image on the display unit 11 based on the two-dimensional imaging data GD of the tissue sample M. Specific examples of the two-dimensional quantitative image are shown in FIGS.
- the image of the colorized analysis example EX shown in FIG. 1 is displayed in a state where, for example, the distribution of the fluorescence intensity (photometric value RS) of the fluorescent substance distributed in the entire region of the tissue sample M is easy to see (shading distribution). Can be made.
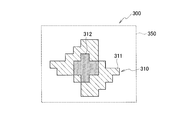
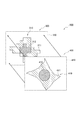
- FIG. 7 is an example of a two-dimensional quantitative image obtained by adding a fluorescent substance to the tissue sample M shown in FIG.
- the two-dimensional quantitative image 300 shown in FIG. 7 is a rectangular two-dimensional quantitative image region 350 in which a mosaic two-dimensional quantitative image main body 310 made up of a collection of square pixels of a CMOS image sensor element is displayed. It has become.
- the two-dimensional quantitative image main body 310 has a shape similar to the rhombus-shaped tissue sample M shown in FIG. 6, and displays the photometric values RS in the respective parts of the tissue sample M according to the intensity values. .
- a diamond-shaped peripheral portion similar to the outer shape of the tissue sample M is a portion 311 having a low photometric value RS, and a central portion is a portion 312 having a high photometric value RS.
- the level of the photometric value RS corresponds to the amount of fluorescent substance in the tissue sample M, according to the two-dimensional quantitative image main body 310 shown in FIG. You can see that there are more parts.
- the state of the density distribution of the fluorescent material distributed in the tissue sample M can be obtained with a resolution of several microns. Can be measured in a short time.
- the tissue sample analyzer 1 according to the first embodiment of the present invention is not a large-scale system as in the prior art, can be downsized, and is inexpensive.
- the tissue sample analyzer 1 since the tissue sample M can be measured simply by placing it between the light source unit 30 and the light receiving unit 31, the analysis operation by the operator is easy and the operability is good. Analysis time is short and resolution is sufficient. Further, according to the tissue sample analyzer 1 having such a configuration, the tissue sample M is disposed between the light source unit 30 and the light receiving unit 31, and the density of the fluorescent material distributed in the entire region of the tissue sample M at one time. Can be acquired as photometric information AS, and a two-dimensional image can be formed based on the photometric information AS. For this reason, according to the tissue sample analyzer 1 having such a configuration, the analysis time for performing the quantification and two-dimensional imaging of the tissue sample M is short.
- tissue sample analyzer 1 since the analysis time is short as described above, a chemical substance localized in the tissue sample M is analyzed and quantified in a minute range of the tissue sample M before the biological tissue sample M deteriorates. Can complete the operation. For this reason, according to the tissue sample analyzer 1, a quantitative analysis result can be obtained earlier in a smaller range of the tissue sample M.
- the size of the light source unit 30 and the light receiving unit 31 is appropriately selected, so that the tissue sample M can vary from a small animal to a human large tissue sample M regardless of the size of the tissue sample M. It is possible to acquire a state of distribution of the fluorescent substance distributed in the region, to form a two-dimensional image, and to analyze in a short time.
- tissue sample analyzer 1 a plurality of distributions in the same tissue sample (tissue sample) M are made by selecting and combining the emission wavelength of each LED of the light source unit 30 and the fluorescent substance used for immunohistochemical staining. Different types of biological materials can be analyzed simultaneously and quantitatively.
- the tissue sample analyzer 1 since the tissue sample M can be measured simply by placing it between the light source unit 30 and the light receiving unit 31, the entire fluorescent substance distribution of the tissue sample M is used as photometric information AS at a time. It can be acquired in a short time. As described above, since the photometric information AS can be acquired in a short time at once, the tissue sample analyzer 1 can prevent the tissue sample M from being deteriorated due to a change with time, and can be used by the operator of the experiment. Difficult to occur.
- the tissue sample analyzer 1 when the tissue sample M is sandwiched between the light source unit 30 and the light receiving unit 31, even if the flatness of the tissue sample M is poor, the tissue sample M is flattened and the photometry is performed. be able to. For this reason, according to the tissue sample analyzer 1 having such a configuration, the reproducibility of the quantitative analysis (quantitative value) of the tissue sample M can be enhanced.
- the tissue sample analyzer 1 when the tissue sample analyzer 1 is used to sandwich the tissue sample M between the light source unit 30 and the light receiving unit 31, the distance between the light source unit 30 and the light receiving unit 31 can be made constant. For this reason, according to the tissue sample analyzer 1 having such a configuration, the tissue sample M increases the accuracy of quantitative analysis (quantitative value) of the tissue sample M even when the thickness of the tissue sample M is large. be able to.
- the light source unit 30 is fixed to a fixed stage. For this reason, according to the tissue sample analyzer 1, the measurement operation is simple, and variations in measurement values by the operator can be suppressed.
- the light source unit 30 and the light receiving unit 31 when the size of the light source unit 30 and the light receiving unit 31 is larger than the size of the tissue sample M, the light source unit 30 and the light receiving unit 31 can cover the entire region of the tissue sample M.
- the size of the light source unit 30 and the light receiving unit 31 of the tissue sample analyzer 1 is larger than the size of the tissue sample M, the size of the entire area of the tissue sample M is not limited to two.
- Photometric information AS necessary for constructing a three-dimensional image can be acquired at a time. Therefore, according to the tissue sample analyzer 1 having such a configuration, it is not necessary to perform a scanning operation, photometry can be performed in a short time, and the reproducibility of quantitative analysis is improved.
- photometric information AS necessary for constructing a two-dimensional image of the entire region of the tissue sample M before the tissue sample M deteriorates can be acquired at one time. It is possible to easily photograph a tissue sample M having a large size. For this reason, a three-dimensional image (3D image) can be constructed.
- the tissue sample M is sandwiched between the light source unit 30 and the light receiving unit 31, even if the tissue sample M is wavy and the flatness of the tissue sample M is poor, the light source unit 30 and the light receiving unit 31 It can be fixed in between. Therefore, according to the tissue sample analyzer 1 having such a configuration, the tissue sample M is fixed using the light source unit 30 and the light receiving unit 31. Therefore, according to the tissue sample analyzer 1 having such a configuration, the amount of fluorescence is not affected by the poor flatness of the tissue sample M over the entire region of the tissue sample M without using a lens system. Can be obtained to obtain a distribution of fluorescence intensity, and the tissue sample M can be quantitatively analyzed.
- the tissue sample analyzer 1 when the tissue sample M is sandwiched between the light source unit 30 and the light receiving unit 31, the thickness of the tissue sample M (the chemical substance is localized) is not affected. For this reason, according to the tissue sample analyzer 1 having such a configuration, it is possible to quantitatively analyze the tissue sample M without including an error. Further, according to the tissue sample analyzer 1 having such a configuration, the light source unit 30 and the light receiving unit 31 are used to integrate the light amount without using a lens, and to quantify the tissue sample M without including an error. Can be analyzed.
- the tissue sample analyzer 1 since the lens causing the aberration is not used using the light source unit 30 and the light receiving unit 31, the tissue sample M can be accurately quantitatively analyzed.
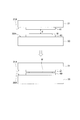
- FIGS. 8 and 9 the same components as those in the first embodiment shown in FIGS. 1 and 2 are denoted by the same reference numerals, and the description thereof is omitted.
- the second embodiment of the present invention shown in FIG. 8 and FIG. 9 differs from the first embodiment of the present invention in the following points, but is otherwise the same.
- the photometric system constituting the first embodiment of the present invention shown in FIGS. 4 and 5 is a photometric system for measuring the tissue sample M in a so-called fluorescence mode using the tissue sample M to which a fluorescent material is added.
- the photometric system constituting the second embodiment of the present invention shown in FIGS. 8 and 9 uses a tissue sample M to which no fluorescent substance is added and measures the light by transmitting light through the tissue sample M.
- This is a photometric system for measuring a tissue sample M in the transmission mode.
- a general histochemical staining agent or the like is used as a test reagent.
- the transmission mode photometry system constituting the second embodiment shown in FIGS. 8 and 9 is different from the fluorescence mode photometry system constituting the first embodiment shown in FIGS. 4 and 5 from the bandpass filter 40 and the absorption filter 41. It is what removed.
- the transmission mode photometry system shown in FIG. 8 and FIG. 9 does not have the bandpass filter 40 and the absorption filter 41, so that a lesion or the like is determined using a bright field observation image such as general histochemical staining. It is preferable because the cost can be reduced by reducing the number of parts.
- the transmission-mode photometric system may be configured to include at least one of the band-pass filter 40 and the absorption filter 41, unlike the configurations illustrated in FIGS.
- the band pass filter 40 can be disposed between the light source unit 30 and the tissue sample M in the same manner as the fluorescence mode photometry system constituting the first embodiment shown in FIGS. 4 and 5.
- the bandpass filter 40 only the light component in the wavelength region corresponding to the absorption wavelength of the stained portion of the tissue sample M stained with the histochemical stain is transmitted through the illumination light emitted from the light source unit 30.
- the tissue sample M can be irradiated.
- the bandpass filter 40 when the bandpass filter 40 is arranged as described above in the transmission mode photometry system and the tissue sample M stained with the histochemical stain is measured, the absorbance of the stained portion stained with the histochemical stain is accurately measured. It can be measured well. Further, the band pass filter 40 transmits only the light component in the wavelength region where the absorption of the stain such as the histochemical stain added to the tissue sample M is large among the illumination light emitted from the light source unit 30. If there is, when the tissue sample M stained with the histochemical stain is measured, the absorbance of the stained portion stained with the histochemical stain can be measured with higher accuracy.
- the absorption filter 41 can be disposed between the light receiving unit 31 and the tissue sample M, similarly to the fluorescence mode photometry system constituting the first embodiment shown in FIGS. 4 and 5.
- the absorption filter 41 the light component in the wavelength region corresponding to the absorption wavelength of the stained portion of the tissue sample M stained with the histochemical stain among the light emitted from the tissue sample M stained with the histochemical stain It is possible to irradiate the light receiving unit 31 with only the light transmitted therethrough. Therefore, when the absorption filter 41 is arranged as described above in the transmission mode photometry system and the tissue sample M stained with the histochemical stain is measured, the absorbance of the stained portion stained with the histochemical stain is accurately measured. Can be measured.
- the absorption filter 41 has only a light component in the wavelength region where the absorption of the stain such as the histochemical stain added to the tissue sample M is large.
- the absorbance of the stained portion stained with the histochemical stain can be measured with higher accuracy.
- the absorption filter 41 can be disposed between the light receiving unit 31 and the tissue sample M, similarly to the fluorescence mode photometry system constituting the first embodiment shown in FIGS. 4 and 5.
- the absorption filter 41 it is possible to transmit only the light component in the wavelength region corresponding to the absorption wavelength of the stained portion of the tissue sample M stained with the histochemical stain to irradiate the light receiving unit 31. Therefore, when the absorption filter 41 is arranged as described above in the transmission mode photometry system and the tissue sample M stained with the histochemical stain is measured, the absorbance of the stained portion stained with the histochemical stain is accurately measured. Can be measured.
- the distance between the light emitting surface 30 ⁇ / b> A of the light source unit 30 and the lower surface of the tissue sample M is indicated by a symbol b. Is denoted by a.
- the interval b is 0 ⁇ m, and the tissue sample M is in close contact with the upper surface 30 ⁇ / b> A of the light source unit 30.
- the distance a is, for example, in the range of 0 to 50 ⁇ m, more preferably 0 to 20 ⁇ m. That is, the upper surface of the tissue sample M and the light receiving surface 31A of the light receiving unit 31 are in close contact with each other, or are arranged so as to be separated by a predetermined interval a.
- the tissue sample M is sandwiched between the upper surface 30 ⁇ / b> A of the light source unit 30 and the light receiving surface 31 ⁇ / b> A of the light receiving unit 31. Arranged to be.
- the wavelength of light generated by each LED of the light source unit 30 is in the region from ultraviolet to visible light.
- the operation of the second embodiment is different from the operation of the tissue sample analyzer 1 according to the first embodiment in that the photometry system is a photometry system for transmission mode, and the other operations are the same.
- description is abbreviate
- the light of each LED of the light source unit 30 reaches the tissue sample M as it is.
- the light reaching the tissue sample M is measured by the light receiving unit 31 as the transmittance value (photometric value RS) of the concentration of the target material in the stained tissue sample M.
- the coordinate information in the light receiving unit 31 is added to the photometric value RS to create photometric information AS.
- the light receiving unit 31 can measure the entire tissue sample M in a short time with a resolution of several microns.
- the second embodiment it is also possible to simultaneously analyze a plurality of biological substances in the same tissue sample M by combining the wavelength of each LED of the light source unit 30 and the type of stain. For example, when a plurality of types of wavelengths of the LED of the light source unit 30 are prepared and a plurality of types of stains corresponding to any of the plurality of types of wavelengths are used, a plurality of biological materials in the same tissue sample M are analyzed simultaneously. Is possible.
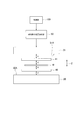
- FIG. 10 is a block diagram showing a configuration example of a tissue sample analysis system according to the third embodiment of the present invention.
- the tissue sample analysis system 200 includes the tissue sample analysis apparatus 1 according to the first embodiment, a high-definition image acquisition apparatus 2, and an integrated control unit 5.
- the integrated control unit 5 is electrically connected to the control unit 100 of the tissue sample analyzer 1 and the high-definition image acquisition device 2.
- the tissue sample analysis system 200 includes a sample moving unit 3 that is electrically connected to the integrated control unit 5.
- the high-definition image acquisition device 2 is a device that acquires a high-definition image of a tissue sample.
- a microscope is used as the high-definition image acquisition device 2.
- a microscope usually has a lens and an image sensor. For this reason, the high-definition image acquired with the high-definition image acquisition apparatus 2 becomes an image normally obtained with the microscope which has a lens and an image pick-up element.
- the high-definition image means an image having a resolution equal to or higher than that of a photoelectric conversion element such as a CMOS image sensor element constituting the light receiving unit 31 of the tissue sample analyzer 1.
- the tissue sample analyzer 1 does not have a lens for enlargement.
- the two-dimensional quantitative image created by the tissue sample analyzer 1 is a photometric value obtained only through a photoelectric conversion element such as an image sensor of the light receiving unit 31 without using an optical enlarging means such as a lens.
- the image is created based on the RS.
- the resolution of the two-dimensional quantitative image created by the tissue sample analyzer 1 is lower than that of the high-definition image. That is, the high-definition image acquired by the high-definition image acquisition device 2 is a higher-definition image than the two-dimensional quantitative image created by the tissue sample analyzer 1.
- the two-dimensional quantitative image and the high-definition image will be described in detail later.
- the two-dimensional quantitative image has an advantage of excellent quantitativeness
- the high-definition image has an advantage of high resolution.
- the tissue sample analysis system 200 is used, for example, to exhibit the merit excellent in the quantitative property of the two-dimensional quantitative image and to compensate for the low resolution of the two-dimensional quantitative image by exhibiting the merit of the high-definition image.
- the integrated control unit 5 has a function of associating the two-dimensional quantitative image created by the tissue sample analyzer 1 with the high-definition image acquired by the high-definition image acquisition device.
- the integrated control unit 5 acquires a two-dimensional quantitative image from the control unit 100 of the tissue sample analyzer 1, acquires a high-definition image from the high-definition image acquisition device 2, and combines the two-dimensional quantitative image and the high-definition image. Associate.
- the two-dimensional quantitative image and the high-definition image are associated with each other, for example, a two-dimensional image complex is formed.
- the two-dimensional image complex means an image complex in which a two-dimensional quantitative image and a high-definition image are associated with each other.
- the sample moving unit 3 has a function of performing control to move the tissue sample M so that the tissue sample M can be analyzed by the tissue sample analyzer 1 and an image can be acquired by the high-definition image acquiring device 2. Specifically, the sample moving unit 3 performs control so that the tissue sample M is moved onto the pedestal 55 of the tissue sample analyzer 1 and the imaging pedestal (not shown) of the high-definition image acquisition device 2.
- FIG. 11 and 12 are diagrams showing an example of the configuration of a two-dimensional image complex 500 including a two-dimensional quantitative image 300 and a high-definition image 400 obtained by adding a fluorescent substance to the tissue sample M shown in FIG. is there.
- the two-dimensional image composite 500 shown in FIGS. 11 and 12 displays only the image in front of FIGS. 11 and 12 on the actual screen of the display unit 11. That is, in the two-dimensional image complex 500 shown in FIG.
- the two-dimensional quantitative image 300 is the same as the two-dimensional quantitative image 300 shown in FIG. That is, the two-dimensional quantitative image 300 is a rectangular two-dimensional quantitative image region 350 in which a mosaic two-dimensional quantitative image main body 310 made up of a collection of square pixels of a CMOS image sensor element is displayed. Yes.
- the two-dimensional quantitative image main body 310 has a shape similar to the rhombus-shaped tissue sample M shown in FIG. 6, and displays the photometric values RS in the respective parts of the tissue sample M according to the intensity values. .
- a diamond-shaped peripheral portion similar to the outer shape of the tissue sample M is a portion 311 having a low photometric value RS, and a central portion is a portion 312 having a high photometric value RS.
- the level of the photometric value RS corresponds to the amount of the fluorescent substance in the tissue sample M. Therefore, according to the two-dimensional quantitative image main body 310 shown in FIGS. 11 and 12, the amount of the fluorescent substance in the tissue sample M is It can be seen that there are more central parts than parts.
- the high-definition image 400 is obtained by displaying a rhombus-shaped high-definition image main body 410 in a rectangular high-definition image region 450.
- the high-definition image main body 410 is a high-definition image corresponding to the two-dimensional quantitative image main body 310 of the two-dimensional quantitative image 300.
- a portion 411 in the high-definition image main body 410 is a portion corresponding to the portion 311 having a low photometric value RS of the two-dimensional quantitative image 300.
- a portion 412 in the high-definition image main body 410 is a portion corresponding to the portion 312 having a high photometric value RS of the two-dimensional quantitative image 300. Since the high-definition image 400 has higher resolution than the two-dimensional quantitative image 300, the accuracy of the contour is improved.
- the two-dimensional quantitative image 300 is an image formed by processing information such as the photometric value RS, and has no aberration because no magnifying means such as a lens is used. For this reason, the two-dimensional quantitative image 300 has an advantage of superior quantitative performance as compared with a high-definition image 400 described later.
- the two-dimensional quantitative image 300 has a demerit that the resolution is lower than that of the high-definition image 400 described later because the limit of resolution depends on the size of a photoelectric conversion element such as an imaging element.
- the high-definition image 400 has an advantage that the resolution is higher than that of the two-dimensional quantitative image 300 because an enlargement means such as a lens is used.
- the high-definition image 400 is not an image formed by processing information such as the photometric value RS, and aberrations occur because of the enlargement means such as a lens. For this reason, the high-definition image 400 has a demerit that the quantitative property is lower than that of the two-dimensional quantitative image 300.
- the two-dimensional quantitative image 300 and the high-definition image 400 each have advantages and disadvantages.
- the two-dimensional image composite 500 shown in FIG. 11 and FIG. 12 easily exhibits the merits of the two-dimensional quantitative image 300 and the high-definition image 400 by associating the two-dimensional quantitative image 300 and the high-definition image 400. It is something that can be done.
- the two-dimensional image composite 500 in the state shown in FIG. 11 is designed to easily exhibit the merit of the two-dimensional quantitative image 300.
- the two-dimensional image composite 500 in the state shown in FIG. 11 is designed to easily exhibit the merit of the two-dimensional quantitative image 300.
- the two-dimensional image composite 500 in the state shown in FIG. 12 can easily exhibit the merit of the high-definition image 400.
- the advantage of high resolution is exhibited.
- the two-dimensional quantitative image 300 and the high-definition image 400 are associated with each other, and at least one of the two-dimensional quantitative image 300 and the high-definition image 400 is displayed on the screen of the display unit 11.
- the display between the quantitative image 300 and the high-definition image 400 can be switched. For example, if the currently displayed two-dimensional quantitative image 300 or the high-definition image 400 is clicked, the remaining image that is not currently displayed can be displayed.
- the setting method is not particularly limited.
- tissue sample analysis system 200 The operation of the tissue sample analysis system 200 is the same as that of the above-described tissue sample analysis apparatus 1 and the operation of the known high-definition image acquisition apparatus 2 by using the same tissue sample M by the sample moving unit 3.
- the analysis of the image and the image acquisition by the high-definition image acquisition device 2 the operation of associating the two-dimensional quantitative image 300 created by the tissue sample analysis device 1 with the high-definition image 400 acquired by the high-definition image acquisition device And an action based on this association.
- the integrated control unit 5 associates the two-dimensional quantitative image 300 created by the tissue sample analyzer 1 and the high-definition image 400 acquired by the high-definition image acquisition device 2.
- the association method is not particularly limited.
- the respective merits of the two-dimensional quantitative image 300 and the high-definition image 400 can be easily exhibited as described above.
- the tissue sample analyzer according to the second embodiment may be used instead of the tissue sample analyzer 1 according to the first embodiment.
- FIG. 13 is a block diagram showing a configuration example of a tissue sample analysis system according to the fourth embodiment of the present invention.
- the tissue sample analysis system 200 ⁇ / b> A includes the tissue sample analysis apparatus 1 according to the first embodiment, a high-definition image reading unit 6, and an integrated control unit 5.
- the integrated control unit 5 is electrically connected to the control unit 100 and the high-definition image reading unit 6 of the tissue sample analyzer 1.
- the tissue sample analysis system 200 ⁇ / b> A according to the fourth embodiment shown in FIG. 13 reads a high-definition image instead of the high-definition image acquisition device 2. It is the same except that the part 6 is provided and the sample moving part 3 is not provided. For this reason, in the tissue sample analysis system 200A according to the fourth embodiment and the tissue sample analysis system 200 according to the third embodiment, the same reference numerals are given to the same components, and descriptions of the configurations and operations are omitted or simplified. .
- the high-definition image reading unit 6 has a function of reading a high-definition image of a tissue sample acquired by a high-definition image acquisition device (not shown) or the like.
- a known image reading device can be used as the high-definition image reading unit 6, a known image reading device can be used.
- a high-definition image of a tissue sample acquired by a high-definition image acquisition device or the like is a high-definition acquired from the same tissue sample M as the tissue sample M analyzed by the tissue sample analysis device 1 according to the first embodiment. An image.
- the tissue sample analysis system 200A functions to read a high-definition image from another high-definition image acquisition device or the like instead of acquiring a high-definition image by the high-definition image acquisition device 2, while the sample moving unit 3
- the operation of the tissue sample analysis system 200 is the same as that of the tissue sample analysis system 200 except that there is no operation of moving the tissue sample M. For this reason, the description of the operation of the tissue sample analysis system 200A is omitted.
- the tissue sample analyzer according to the second embodiment may be used instead of the tissue sample analyzer 1 according to the first embodiment.
- the tissue sample analyzer 1 can quantify the tissue sample M at the cell level and form an image, thereby reducing the size and price of the device, simplifying the analysis work, and analyzing it.
- the work speed can be increased and the resolution of the entire region of the tissue sample M can be increased.
- the tissue sample analyzer 1 can instantly acquire distribution information of unevenly distributed chemical substances contained in the tissue sample M, which is a biological specimen, for example, in the manner of capturing the contents of a document with a scanner on a desk.
- tissue sample analyzer 1 Since the time required for analysis is short for the tissue sample analyzer 1, not only can a large tissue sample M be easily analyzed, but also a large amount of continuous tissue samples can be analyzed to construct a three-dimensional image. Can do.
- the analysis of the mouse brain takes about 30 minutes and the analysis of the human brain takes about 20 hours, but in the embodiment of the present invention, regardless of the size of the tissue sample M, One piece can be analyzed in a few minutes.
- the resolution of one measurement area (pixel in image data) can be increased from several tens of microns to several microns, and quantitative image data with fine grain can be obtained.
- region of the tissue sample M can be extracted easily, and a statistical process can be performed.
- the tissue sample analyzer 1 is a tissue sample analyzer for analyzing photometric information of a biological tissue sample M, and is a light source for irradiating the tissue sample M with light.
- the tissue 30 is disposed in opposition to the light source 30 and the tissue sample M is sandwiched between the light source 30 or the tissue sample is not sandwiched between the light source 30 and the tissue.
- a plate-shaped light receiving unit 31 that receives light from the sample M.
- the tissue sample M is in a state of being sandwiched between the light source unit and the light receiving unit or in a state of being disposed without sandwiching the tissue sample between the light source unit. Can be acquired in a short time. As described above, the tissue sample can be prevented from being deteriorated due to a change with time, and there is no variation in the technique of the operator of the experiment. In addition, since the tissue sample is disposed between the light source unit and the light receiving unit, even when the flatness of the tissue sample is poor, the tissue sample can be flattened for photometry.
- a fluorescent material is added to the tissue sample, and a bandpass filter that transmits light having a wavelength that shines the fluorescent material is disposed between the light source unit and the tissue sample, and between the tissue sample and the light receiving unit. Is provided with an absorption filter that transmits fluorescence from the fluorescent material of the tissue sample.
- the bandpass filter gives only the light of the wavelength that fluoresces the fluorescent material added to the tissue sample to the tissue sample, and the fluorescence emitted from the fluorescent material of the tissue sample passes through the absorption filter and is excited by other excitation. Light leakage light or the like is blocked by the absorption filter, so that only the fluorescence can be reliably received by the light receiving unit. For this reason, it becomes possible to quantify and image the chemical substance unevenly distributed in the tissue sample.
- the tissue sample analyzer 1 As a reagent, the tissue sample analyzer 1 according to the second embodiment having a transmission mode photometric system is used by adding a stain as a reagent to the tissue sample M. Accordingly, for example, a tissue sample M that is unsuitable for immunohistochemical staining such as lipid is stained with a general histochemical stain or the like, so that the light receiving unit 31 distributes the concentration distribution of the target substance in the tissue sample M. , Photometry can be performed as a transmittance distribution.
- the light source unit 30 is configured by two-dimensionally arranging a plurality of light emitting diodes
- the light receiving unit 31 is configured by two-dimensionally arranging solid-state imaging elements.
- a plurality of light emitting diodes are arranged two-dimensionally as a light source part, and a solid-state imaging device only needs to be arranged two-dimensionally as a light receiving part, so there is no need to use a large microscope or photomultiplier.
- the tissue sample analyzer can be greatly reduced in size and price.
- the light source unit 30 uses a plurality of LEDs (light emitting diodes), the present invention is not limited to this, and another example of the light source unit 30 is to configure EL (electroluminescence) in a flat plate shape. Also good. Even in this case, it is only necessary to configure the EL as a light source unit in a flat plate shape and to arrange a solid-state image pickup device two-dimensionally as the light receiving unit, and there is no need to use a large microscope or photomultiplier. Therefore, the tissue sample analyzer can be greatly reduced in size and price.
- EL electroluminescence
- a polarizing filter may be disposed between the upper surface 30 ⁇ / b> A of the light emitting unit 30 and the lower surface of the bandpass filter 40.
- a scanning stage capable of moving these in the vertical and horizontal directions may be attached to one or more of the light source unit 30, the light receiving unit 31, and the pedestal 55. When such a scanning stage is attached, the measurement range can be widened.
- the tissue sample analyzer 1 if the light source unit 30 and the light receiving unit 31 are large, the tissue sample analyzer 20 may become large or the cost may increase. In this case, the observation range may be secured or enlarged by reducing the area of one or more of the light source unit 30 and the light receiving unit 31 and fixing it to the moving stage.
- the tissue sample analyzer 1 may be provided with a protection mechanism for preventing damage due to contact between the light source unit 30 or the light receiving unit 31 and the tissue sample M or a preparation containing the tissue sample M.
- a spacer for example, a spacer, a restraint tool or the like is used.
- the spacer is sandwiched between the light source unit 30 or the light receiving unit 31 and the tissue sample M or a preparation containing the tissue sample M, thereby preventing direct contact and breakage thereof.
- a restraint tool is a means which restrict
- the distance between the light source unit 30, the light receiving unit 31, the bandpass filter 40, the absorption filter 41, the tissue sample M, and one or more members of the preparation including the tissue sample M For example, the interval c, the interval d, the interval e, the interval f, and the like can be arbitrarily set instead of the numerical range.
- tissue sample analysis system in addition to the effects of the tissue sample analysis apparatus according to the present invention, a quantitative image excellent in quantification and a high-resolution image with high resolution can be linked to the chemical substance in the tissue sample by coordinates. It is possible to analyze with a two-dimensional image complex attached and associated.
Landscapes
- Engineering & Computer Science (AREA)
- Health & Medical Sciences (AREA)
- General Physics & Mathematics (AREA)
- General Health & Medical Sciences (AREA)
- Physics & Mathematics (AREA)
- Life Sciences & Earth Sciences (AREA)
- Nuclear Medicine, Radiotherapy & Molecular Imaging (AREA)
- Pathology (AREA)
- Immunology (AREA)
- Biochemistry (AREA)
- Analytical Chemistry (AREA)
- Chemical & Material Sciences (AREA)
- Theoretical Computer Science (AREA)
- Molecular Biology (AREA)
- Biomedical Technology (AREA)
- Multimedia (AREA)
- Computer Vision & Pattern Recognition (AREA)
- Quality & Reliability (AREA)
- Radiology & Medical Imaging (AREA)
- Medical Informatics (AREA)
- Investigating, Analyzing Materials By Fluorescence Or Luminescence (AREA)
- Measuring Or Testing Involving Enzymes Or Micro-Organisms (AREA)
- Investigating Or Analysing Biological Materials (AREA)
- Investigating Or Analysing Materials By The Use Of Chemical Reactions (AREA)
- Apparatus Associated With Microorganisms And Enzymes (AREA)
- Investigating Or Analysing Materials By Optical Means (AREA)
Abstract
L'invention concerne un dispositif d'analyse d'échantillon de tissu 1 qui est un dispositif pour analyser de façon quantitative des informations photométriques obtenues par exposition d'un échantillon de tissu M collecté sur un corps vivant à une lumière, et qui comprend une unité de source de lumière 30 pour exposer l'échantillon de tissu M à la lumière et une unité de réception de lumière de type plaque plate 31 pour recevoir la lumière transmise à travers l'échantillon de tissu M ou la lumière émise à partir de l'échantillon de tissu M, l'échantillon de tissu M étant placé entre l'unité de source de lumière 30 et l'unité de réception de lumière 31.
Priority Applications (1)
| Application Number | Priority Date | Filing Date | Title |
|---|---|---|---|
| US15/743,085 US10444152B2 (en) | 2015-07-10 | 2016-07-06 | Tissue sample analysis device and tissue sample analysis system |
Applications Claiming Priority (2)
| Application Number | Priority Date | Filing Date | Title |
|---|---|---|---|
| JP2015138702 | 2015-07-10 | ||
| JP2015-138702 | 2015-07-10 |
Publications (1)
| Publication Number | Publication Date |
|---|---|
| WO2017010375A1 true WO2017010375A1 (fr) | 2017-01-19 |
Family
ID=57758164
Family Applications (1)
| Application Number | Title | Priority Date | Filing Date |
|---|---|---|---|
| PCT/JP2016/070019 WO2017010375A1 (fr) | 2015-07-10 | 2016-07-06 | Dispositif d'analyse d'échantillon de tissu et système d'analyse d'échantillon de tissu |
Country Status (3)
| Country | Link |
|---|---|
| US (1) | US10444152B2 (fr) |
| JP (1) | JP6457979B2 (fr) |
| WO (1) | WO2017010375A1 (fr) |
Families Citing this family (2)
| Publication number | Priority date | Publication date | Assignee | Title |
|---|---|---|---|---|
| JP7129730B2 (ja) | 2018-05-31 | 2022-09-02 | ソル・インコーポレイテッド | 映像基盤の大面積試料分析装置、媒質の特性差を用いた映像基盤の試料分析装置及びこれを用いて試料を測定して分析する方法 |
| JP2020041928A (ja) * | 2018-09-11 | 2020-03-19 | 株式会社東芝 | セルフチェックシステム |
Citations (5)
| Publication number | Priority date | Publication date | Assignee | Title |
|---|---|---|---|---|
| JPH04316478A (ja) * | 1991-04-12 | 1992-11-06 | Nec Corp | 生物試料観察装置、システムおよび方法 |
| JP2002525587A (ja) * | 1998-08-28 | 2002-08-13 | フェビット フェラリウス バイオテクノロジー ゲゼルシャフト ミット ベシュレンクテル ハフツング | 試料中の分析物を測定するための方法および装置 |
| JP2005227155A (ja) * | 2004-02-13 | 2005-08-25 | Nara Institute Of Science & Technology | 生体組織測定用イメージセンサ及び該センサを用いた生体組織測定方法 |
| JP2010276866A (ja) * | 2009-05-28 | 2010-12-09 | Nikon Corp | 画像取得装置と、これを有する顕微鏡装置 |
| JP2015084059A (ja) * | 2013-10-25 | 2015-04-30 | 株式会社キーエンス | 顕微鏡装置 |
Family Cites Families (5)
| Publication number | Priority date | Publication date | Assignee | Title |
|---|---|---|---|---|
| AU767606B2 (en) | 1999-02-19 | 2003-11-20 | Synthetic Genomics, Inc. | Method for producing polymers |
| JP2001013135A (ja) * | 1999-06-30 | 2001-01-19 | Aloka Co Ltd | 蛍光観測法及び蛍光観測装置 |
| JP2002228654A (ja) * | 2001-01-30 | 2002-08-14 | Yamato Scient Co Ltd | 組織マッピング方法及び組織マップ分析装置 |
| JP4405837B2 (ja) * | 2004-03-19 | 2010-01-27 | ヤマト科学株式会社 | 組織試料分析装置 |
| DE102009029831A1 (de) * | 2009-06-17 | 2011-01-13 | W.O.M. World Of Medicine Ag | Vorrichtung und Verfahren für die Mehr-Photonen-Fluoreszenzmikroskopie zur Gewinnung von Informationen aus biologischem Gewebe |
-
2016
- 2016-07-06 JP JP2016134195A patent/JP6457979B2/ja active Active
- 2016-07-06 WO PCT/JP2016/070019 patent/WO2017010375A1/fr active Application Filing
- 2016-07-06 US US15/743,085 patent/US10444152B2/en active Active
Patent Citations (5)
| Publication number | Priority date | Publication date | Assignee | Title |
|---|---|---|---|---|
| JPH04316478A (ja) * | 1991-04-12 | 1992-11-06 | Nec Corp | 生物試料観察装置、システムおよび方法 |
| JP2002525587A (ja) * | 1998-08-28 | 2002-08-13 | フェビット フェラリウス バイオテクノロジー ゲゼルシャフト ミット ベシュレンクテル ハフツング | 試料中の分析物を測定するための方法および装置 |
| JP2005227155A (ja) * | 2004-02-13 | 2005-08-25 | Nara Institute Of Science & Technology | 生体組織測定用イメージセンサ及び該センサを用いた生体組織測定方法 |
| JP2010276866A (ja) * | 2009-05-28 | 2010-12-09 | Nikon Corp | 画像取得装置と、これを有する顕微鏡装置 |
| JP2015084059A (ja) * | 2013-10-25 | 2015-04-30 | 株式会社キーエンス | 顕微鏡装置 |
Also Published As
| Publication number | Publication date |
|---|---|
| JP2017021020A (ja) | 2017-01-26 |
| US10444152B2 (en) | 2019-10-15 |
| US20190079012A1 (en) | 2019-03-14 |
| JP6457979B2 (ja) | 2019-01-23 |
Similar Documents
| Publication | Publication Date | Title |
|---|---|---|
| US7608840B2 (en) | System and method employing photokinetic techniques in cell biology imaging applications | |
| JP5316161B2 (ja) | 観察装置 | |
| CN109716199A (zh) | 具有选择性平面照明的光场显微镜 | |
| CN102023148A (zh) | 荧光纳米显微方法 | |
| JP5746161B2 (ja) | 顕微鏡画像における蛍光の評価方法 | |
| US20210382286A1 (en) | Sample observation device and sample observation method | |
| US20230314782A1 (en) | Sample observation device and sample observation method | |
| Marchetti et al. | Custom multiphoton/raman microscopy setup for imaging and characterization of biological samples | |
| JP6457979B2 (ja) | 組織試料分析装置及び組織試料分析システム | |
| JP2006275964A (ja) | 走査型蛍光顕微鏡のシェーディング補正方法 | |
| Gong et al. | A fully water coupled oblique light-sheet microscope | |
| JP6888779B2 (ja) | 多面画像取得システム、観察装置、観察方法、スクリーニング方法、および被写体の立体再構成方法 | |
| JP2019136023A (ja) | 細菌検出装置及び細菌検出方法 | |
| WO2012147492A1 (fr) | Dispositif de traitement d'images, procédé de traitement d'images, programme de traitement d'images et système de microscope virtuel | |
| US20220228968A1 (en) | Hyperspectral quantitative imaging cytometry system | |
| JP2017021020A5 (fr) | ||
| CN108627511A (zh) | 一种显微光学成像检测方法和装置 | |
| JP2020112378A (ja) | 評価システム及び評価方法 | |
| EP4137864A1 (fr) | Dispositif et procédé d'observation d'échantillon | |
| WO2022249583A1 (fr) | Dispositif de traitement d'informations, système d'observation d'échantillon biologique et procédé de production d'image | |
| KR102487927B1 (ko) | 고해상도 토모그래피 현미경 시스템 | |
| KR102490770B1 (ko) | LCoS를 이용한 환경오염 측정시스템 | |
| US20230222753A1 (en) | Sample observation device and sample observation method | |
| Daly et al. | Confocal fluorometer for diffusion tracking in 3D engineered tissue constructs | |
| Rana | Integration of hyperspectral imaging system for optimized data acquisition and control to revolutionize pathology applications |
Legal Events
| Date | Code | Title | Description |
|---|---|---|---|
| 121 | Ep: the epo has been informed by wipo that ep was designated in this application |
Ref document number: 16824355 Country of ref document: EP Kind code of ref document: A1 |
|
| DPE1 | Request for preliminary examination filed after expiration of 19th month from priority date (pct application filed from 20040101) | ||
| NENP | Non-entry into the national phase |
Ref country code: DE |
|
| 122 | Ep: pct application non-entry in european phase |
Ref document number: 16824355 Country of ref document: EP Kind code of ref document: A1 |