WO2015133635A1 - データ分析システム及び方法 - Google Patents
データ分析システム及び方法 Download PDFInfo
- Publication number
- WO2015133635A1 WO2015133635A1 PCT/JP2015/056739 JP2015056739W WO2015133635A1 WO 2015133635 A1 WO2015133635 A1 WO 2015133635A1 JP 2015056739 W JP2015056739 W JP 2015056739W WO 2015133635 A1 WO2015133635 A1 WO 2015133635A1
- Authority
- WO
- WIPO (PCT)
- Prior art keywords
- consumer
- data
- clusters
- cluster
- customer
- Prior art date
- Legal status (The legal status is an assumption and is not a legal conclusion. Google has not performed a legal analysis and makes no representation as to the accuracy of the status listed.)
- Ceased
Links
Images


Classifications
-
- G—PHYSICS
- G06—COMPUTING OR CALCULATING; COUNTING
- G06Q—INFORMATION AND COMMUNICATION TECHNOLOGY [ICT] SPECIALLY ADAPTED FOR ADMINISTRATIVE, COMMERCIAL, FINANCIAL, MANAGERIAL OR SUPERVISORY PURPOSES; SYSTEMS OR METHODS SPECIALLY ADAPTED FOR ADMINISTRATIVE, COMMERCIAL, FINANCIAL, MANAGERIAL OR SUPERVISORY PURPOSES, NOT OTHERWISE PROVIDED FOR
- G06Q50/00—Information and communication technology [ICT] specially adapted for implementation of business processes of specific business sectors, e.g. utilities or tourism
- G06Q50/06—Energy or water supply
-
- G—PHYSICS
- G06—COMPUTING OR CALCULATING; COUNTING
- G06Q—INFORMATION AND COMMUNICATION TECHNOLOGY [ICT] SPECIALLY ADAPTED FOR ADMINISTRATIVE, COMMERCIAL, FINANCIAL, MANAGERIAL OR SUPERVISORY PURPOSES; SYSTEMS OR METHODS SPECIALLY ADAPTED FOR ADMINISTRATIVE, COMMERCIAL, FINANCIAL, MANAGERIAL OR SUPERVISORY PURPOSES, NOT OTHERWISE PROVIDED FOR
- G06Q30/00—Commerce
- G06Q30/02—Marketing; Price estimation or determination; Fundraising
- G06Q30/0201—Market modelling; Market analysis; Collecting market data
- G06Q30/0202—Market predictions or forecasting for commercial activities
-
- H—ELECTRICITY
- H02—GENERATION; CONVERSION OR DISTRIBUTION OF ELECTRIC POWER
- H02J—CIRCUIT ARRANGEMENTS OR SYSTEMS FOR SUPPLYING OR DISTRIBUTING ELECTRIC POWER; SYSTEMS FOR STORING ELECTRIC ENERGY
- H02J3/00—Circuit arrangements for AC mains or AC distribution networks
-
- H—ELECTRICITY
- H02—GENERATION; CONVERSION OR DISTRIBUTION OF ELECTRIC POWER
- H02J—CIRCUIT ARRANGEMENTS OR SYSTEMS FOR SUPPLYING OR DISTRIBUTING ELECTRIC POWER; SYSTEMS FOR STORING ELECTRIC ENERGY
- H02J2203/00—Indexing scheme relating to details of circuit arrangements for AC mains or AC distribution networks
- H02J2203/20—Simulating, e g planning, reliability check, modelling or computer assisted design [CAD]
-
- Y—GENERAL TAGGING OF NEW TECHNOLOGICAL DEVELOPMENTS; GENERAL TAGGING OF CROSS-SECTIONAL TECHNOLOGIES SPANNING OVER SEVERAL SECTIONS OF THE IPC; TECHNICAL SUBJECTS COVERED BY FORMER USPC CROSS-REFERENCE ART COLLECTIONS [XRACs] AND DIGESTS
- Y02—TECHNOLOGIES OR APPLICATIONS FOR MITIGATION OR ADAPTATION AGAINST CLIMATE CHANGE
- Y02E—REDUCTION OF GREENHOUSE GAS [GHG] EMISSIONS, RELATED TO ENERGY GENERATION, TRANSMISSION OR DISTRIBUTION
- Y02E60/00—Enabling technologies; Technologies with a potential or indirect contribution to GHG emissions mitigation
-
- Y—GENERAL TAGGING OF NEW TECHNOLOGICAL DEVELOPMENTS; GENERAL TAGGING OF CROSS-SECTIONAL TECHNOLOGIES SPANNING OVER SEVERAL SECTIONS OF THE IPC; TECHNICAL SUBJECTS COVERED BY FORMER USPC CROSS-REFERENCE ART COLLECTIONS [XRACs] AND DIGESTS
- Y04—INFORMATION OR COMMUNICATION TECHNOLOGIES HAVING AN IMPACT ON OTHER TECHNOLOGY AREAS
- Y04S—SYSTEMS INTEGRATING TECHNOLOGIES RELATED TO POWER NETWORK OPERATION, COMMUNICATION OR INFORMATION TECHNOLOGIES FOR IMPROVING THE ELECTRICAL POWER GENERATION, TRANSMISSION, DISTRIBUTION, MANAGEMENT OR USAGE, i.e. SMART GRIDS
- Y04S40/00—Systems for electrical power generation, transmission, distribution or end-user application management characterised by the use of communication or information technologies, or communication or information technology specific aspects supporting them
- Y04S40/20—Information technology specific aspects, e.g. CAD, simulation, modelling, system security
-
- Y—GENERAL TAGGING OF NEW TECHNOLOGICAL DEVELOPMENTS; GENERAL TAGGING OF CROSS-SECTIONAL TECHNOLOGIES SPANNING OVER SEVERAL SECTIONS OF THE IPC; TECHNICAL SUBJECTS COVERED BY FORMER USPC CROSS-REFERENCE ART COLLECTIONS [XRACs] AND DIGESTS
- Y04—INFORMATION OR COMMUNICATION TECHNOLOGIES HAVING AN IMPACT ON OTHER TECHNOLOGY AREAS
- Y04S—SYSTEMS INTEGRATING TECHNOLOGIES RELATED TO POWER NETWORK OPERATION, COMMUNICATION OR INFORMATION TECHNOLOGIES FOR IMPROVING THE ELECTRICAL POWER GENERATION, TRANSMISSION, DISTRIBUTION, MANAGEMENT OR USAGE, i.e. SMART GRIDS
- Y04S50/00—Market activities related to the operation of systems integrating technologies related to power network operation or related to communication or information technologies
- Y04S50/14—Marketing, i.e. market research and analysis, surveying, promotions, advertising, buyer profiling, customer management or rewards
Definitions
- the present invention relates to a data analysis system and method, and is suitable for application to, for example, an energy sales system.
- Patent Literature 1 extracts feature amounts focused on the shape of time series data, arbitrarily classifies them based on the extracted feature amounts, and sets the attributes of time series data. And a similarity analysis evaluation system that performs a fitness evaluation based on classification results.
- Patent Document 2 a plurality of consumers are divided into groups having similar consumption patterns of resource amounts, and a standard load curve representing the consumption patterns of resources of the group is generated for each group.
- a load curve estimation system is disclosed that identifies a group to which a resource belongs, and estimates a resource consumption per unit time within an arbitrary period for an estimation target consumer using a standard load curve of the identified group.
- consumption pattern groups are set in advance, and, as in Patent Document 1, a consumer can use an appropriate number of resource consumption patterns according to actual conditions. There was a problem that could not be classified into groups.
- Patent Document 1 and Patent Document 2 when such feature amounts and consumption patterns cannot be classified into an appropriate number of clusters and groups according to the actual situation, adjustment of power generation amount performed based on the analysis result, power transaction Procurement of electric power from the market does not match the actual situation, and there is a risk of excess or deficiency with respect to the required amount of electric power.
- Patent Document 1 and Patent Document 2 a new customer who has not acquired time-series data or consumption patterns, or an existing customer who cannot acquire time-series data or consumption patterns is appropriately clustered. Another problem is that it cannot be classified into groups. As a result, as described above, the adjustment of the amount of power generated based on the analysis results and the procurement of power from the power trading market do not match the actual situation, and there is an excess or deficiency in the required amount of power. There is a risk.
- the present invention has been made in consideration of the above points, and intends to propose a data analysis system and method capable of performing highly reliable analysis processing that matches the actual situation.
- a server device that collects load data representing the power usage amount per unit time of each consumer and manages attribute information of each consumer; Categorizing the load data into a plurality of clusters in units of consumers based on the load data for each unit time periodically notified from the server device and the attribute information of each of the consumers And a data analysis device for generating a diagnostic decision tree for classifying the consumer into any of the clusters based on the attribute information of the customer.
- the intra-cluster suitability indicating the degree of separation and the intercluster average separation degree representing the degree of separation between the clusters are calculated, respectively, and the number of clusters when the load data is classified is determined based on the calculation result.
- load data representing the power usage per unit time of each consumer is collected, and a server device that manages attribute information of each consumer, and periodically notified from the server device.
- a data analysis apparatus for classifying the load data into a plurality of clusters in units of consumers based on the load data for each unit time of each consumer and the attribute information of each consumer
- the data analysis device In the data analysis method to be executed, the data analysis device generates a diagnostic decision tree for classifying the consumer into any of the clusters based on the attribute information of the consumer.
- the degree of grouping of the load data in each cluster when the data analysis apparatus assumes that the number of clusters is 1 to M (M is the number of consumers). And a first step of calculating an intra-cluster fitness representing the degree of separation and an inter-cluster average degree of separation representing the degree of separation between the clusters, and the data analysis device classifies the load data based on the calculation result And a second step for determining the number of clusters.
- new customers who have not acquired load data and existing customers who cannot acquire load data can be classified into appropriate clusters.
- the intra-cluster fitness and the inter-cluster average separation are actually calculated when the number of clusters is assumed to be 1 to M (M is the number of consumers). Since the number of clusters when classifying (clustering) the load data is determined based on the calculation result, appropriate clustering that matches the actual situation can be performed.
- A) to (D) are characteristic curve diagrams for explaining the optimum cluster number determination processing. It is a flowchart which shows the process sequence of a standard road curve outline data generation process.
- A) And (B) is a conceptual diagram which shows schematic structure of a diagnostic decision tree. It is a flowchart which shows the process sequence of a diagnostic decision tree production
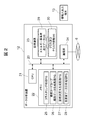
- reference numeral 1 denotes an energy sales system according to this embodiment as a whole.
- This energy sales system 1 includes an energy provider 2 meter data collection server 3, a customer information providing server 4, a sales information processing device 5, a transaction product information processing device 6, a corporate information processing device 7, and an energy business operator 2.
- the equipment control terminal 9 and the information input / output terminal 10 installed on each customer 8 side that receives the supply of power from the network, and the data analysis device 12 and the information input / output terminal 13 of the analysis operator 11 are connected via the network 14. It is configured by being connected.
- the equipment control terminal 9 on the customer 8 side is composed of a smart meter, for example.
- the equipment control terminal 9 measures the power consumption of the customer 8 and transmits the measurement result to the meter data collection server 3 of the energy company 2 as load data.
- the information input / output terminal 10 of each customer 8 is comprised from the personal computer by which the browser was mounted, for example.
- the information input / output terminal 10 is used by the customer 8 to access the information provider server 4 for the consumer of the energy provider 2.
- the meter data collection server 3 of the energy provider 2 is a server device having a function of accumulating and managing load data respectively transmitted from the equipment control terminal 9 of each customer 8.
- the meter data collection server 3 has the attribute information of each customer 8 registered in advance such as the geographical position, the contract fee menu, the system feeder number, the contracted power reception amount and the power receiving facility, together with the load data of each consumer 8. to manage. Then, the meter data collection server 3 periodically transmits the accumulated attribute information and load data of each customer 8 to the data analysis device 12 of the analysis operator 11.
- the information providing server 4 for consumers is composed of a general-purpose server device, and in response to a request from the customer 8, the future of the customer 8 estimated by the data analysis device 12 of the analysis provider 11 as will be described later.
- a power load curve (hereinafter referred to as a road curve) that represents a change in the amount of power used, a fee menu recommended to the customer 8 determined by the data analysis device 12 of the analysis provider 11, Information on facilities (district air-conditioning facilities, heat pump water heaters, regenerative heaters, etc.) is provided.
- the sales information processing device 5 is a computer device installed in the sales section of the energy business operator 2 and is used by the energy business operator 2 to acquire business analysis results from the data analysis device 12 of the analysis business operator 11. .
- the transaction product information processing device 6 is a computer device installed in the power generation procurement section of the energy company 2, and accesses a website for power transactions provided by, for example, a wholesale power exchange to obtain necessary power. Bid bids or sell surplus power.
- the corporate information processing device 7 is a computer device installed in the management section of the energy company 2.
- the data analysis device 12 of the analysis company 11 has a function of analyzing past power demand based on the load data and attribute information of each customer 8 transmitted from the meter data collection server 3 of the energy company 2. It is. Further, the information input / output terminal 13 of the analysis operator 11 is constituted by a personal computer on which a browser is mounted, for example. The information input / output terminal 13 is used when the analysis operator 11 performs maintenance of the data analysis device 12.
- FIG. 2 shows a schematic configuration of the data analysis device 12 of the analysis company.
- the data analysis device 12 includes a CPU (Central Processing Unit) 21, a memory 22, a storage device 23, and a communication unit 24 connected to each other via an internal bus 20.
- CPU Central Processing Unit
- the CPU 21 is a processor that controls the operation of the entire data analysis apparatus 12.
- the memory 22 is mainly used for temporarily storing various programs and data.
- a clustering processing program 25, a standard load curve outline data generation processing program 26, a diagnostic decision tree generation processing program 27, and a customer data analysis processing program 28, which will be described later, are also stored and held in the memory 22.
- the storage device 23 is composed of, for example, a hard disk device, and is used for holding programs and data for a long period of time.
- An energy provider sending data database 29 and a class and cluster information database 30 to be described later are stored and held in the storage device 23.
- the communication unit 24 communicates with the meter data collection server 3 of the energy company 2 via the network 14, the information providing server 4 for customers, the sales information processing device 5, the transaction product information processing device 6, or the corporate information processing device 7. Protocol control is performed during communication and communication with the information input / output terminal 13.
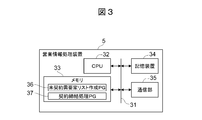
- FIG. 3 shows a schematic configuration of the sales information processing apparatus 5 of the energy provider 2.
- the sales information processing apparatus 5 includes a CPU 32, a memory 33, a storage device 34, and a communication unit 35 connected to each other via an internal bus 31.
- the CPU 32, the memory 33, the storage device 34, and the communication unit 35 have the same functions and configurations as the CPU 21, the memory 22, the storage device 23, and the communication unit 24 of the data analysis device 12 described above with reference to FIG. These descriptions are omitted.
- the memory 33 of the sales information processing apparatus 5 stores an uncontracted customer list creation program 36 and a contract conclusion processing program 37 which will be described later.
- the data analysis device 12 analyzes the past power demand based on the load data and attribute information of each customer 8 stored in the meter data collection server 3 of the energy provider 2, and A data analysis function for generating information useful for the business operator 2 and each customer 8 and providing the generated information to the energy business operator 2 is installed.
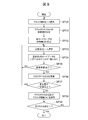
- FIG. 4 shows a flow of a series of processes executed in the energy sales system 1 in relation to such a data analysis function.
- the equipment control terminal 9 (FIG. 1) of each customer 8 periodically collects load data representing the amount of power used per unit time (for example, 30 minutes) and collects meter data of the energy company 2. It transmits to the server 3 (FIG. 1) (SP1).
- the meter data collection server 3 also stores load data for a predetermined period (for example, one year, hereinafter referred to as an analysis period) of the load data of each consumer 8 stored and held, and these consumers. 8 attribute information is periodically transmitted to the data analysis device 12 of the analysis company 11 (SP2).
- the data analysis device 12 executes a load data clustering process for classifying these load data into a plurality of clusters in units of customers (SP3). ). Accordingly, each customer 8 is also classified into a group (hereinafter referred to as a customer class) associated with a cluster to which the corresponding load data belongs.
- the data analyzer 12 thereafter loads a load curve (hereinafter referred to as a standard curve) that represents a change in power usage within a standard analysis period of the customer 8 belonging to the customer class corresponding to the cluster for each cluster.
- a load curve hereinafter referred to as a standard curve
- the normalization process may be executed before the load data clustering process so that the load data takes a value of average 0 and variance 1.
- the group of consumers matched with the cluster to which the load curve which makes a similar shape belongs can be obtained irrespective of the magnitude
- the data analysis device 12 executes customer data analysis processing for analyzing the power usage status of each customer 8 based on the load data and attribute information of each customer 8 acquired in step SP2 (SP5). . Specifically, the data analysis device 12 generates, for each customer 8, outline data of a load curve that represents a change in power consumption within the analysis period, and each of the generated outline data for the corresponding customer 8 is generated. It transmits to the information provision server 4 for consumers of the energy provider 2 as an estimated value of the future power consumption.
- the data analysis device 12 determines a recommended price menu and equipment for each customer 8 based on the outline data of the load curve within the analysis period for each customer 8 generated as described above, and other data Analysis processing is executed, and these determination results and analysis results are transmitted to the information provider server 4 for consumers of the energy provider 2.
- the data analysis device 12 determines, for each customer 8, the total power usage during the analysis period, the planned power outage, and the like.
- the incidental information such as the amount of power used when the power supply of the energy provider 2 is tight and the amount of increase in the amount of electric power used with respect to the temperature is calculated, and the additional information for each consumer 8 calculated as statistical information is shown in FIG. Stored in the attribute information table 30B (FIG. 7).
- the data analysis device 12 creates a new customer 8 that has not acquired load data based on the attribute information for each customer 8 acquired in step SP2 and the processing result of the load data clustering process in step SP3. Or any existing customer 8 that cannot acquire load data because the equipment control terminal 9 (FIG. 1) is not installed (hereinafter, these customers 8 are collectively referred to as a new customer 8).
- a diagnostic decision tree as shown in FIG. 14 for classifying into the customer class is generated (SP6).
- ID3 Intelligent Dichotomiser 3
- ID3 is used as an algorithm for creating these diagnosis decision trees as described later, but an algorithm other than ID3 can also be applied. Details of the diagnosis decision tree will be described later.
- the data analyzer 12 uses the diagnostic decision tree created in step SP6 to generate the new demand. It is diagnosed which consumer class the house 8 belongs to (precisely, it is estimated which cluster the load data of the new consumer 8 belongs to) (SP8).
- the data analyzer 12 uses the outline data of the standard load curve corresponding to the customer class diagnosed as the new customer 8 to belong as the estimation result of the future power consumption of the new customer 8. It transmits to the information provider server 4 for consumers of the energy company 2. Further, the data analyzer 12 determines the price menu and equipment recommended for the new customer 8 based on the outline data of the standard load curve, and executes other analysis processes, and the determination results and The analysis result is transmitted to the information provider server 4 for consumers of the energy provider 2. Further, the data analyzer 12 also estimates the incidental information of the new customer 8, and stores the estimated incidental information as statistical information in a class attribute information table 30B (FIG. 7) described later (SP9).
- a class attribute information table 30B FIG. 7 described later
- the information providing server 4 for consumers of the energy company 2 thereafter uses the information input / output terminal 10 (FIG. 1) of the existing or new consumer 8 for the consumers of the energy company 2.
- FIG. 1 the information input / output terminal 10
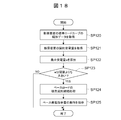
- the information providing server 4 When accessing the information providing server 4 and requesting the provision of information on the customer 8 (SP10), an outline of the standard load curve of the customer 8 given from the data analyzer 12 in step SP5 or step SP9 A load curve obtained based on the data is displayed as an estimation result of the future power consumption, and information such as a recommended fee menu and equipment determined by the data analysis device 12 is provided to the customer 8 (SP11).
- step SP11 when the customer 8 who has acquired information such as the recommended fee menu and equipment in step SP11 performs an operation for requesting the conclusion of a recommended fee menu based on this information, for example, And an uncontracted new customer 8 operates his / her information input / output terminal and applies for a new energy sales contract with the energy provider 2, the request is sent from the information input / output terminal to the energy business. Is transmitted to the sales information processing apparatus 5 of the person 2 (SP12).
- the sales information processing apparatus 5 of the energy company 2 performs a process for concluding a new energy sales contract with the requested fee menu for the existing customer 8, and has not yet contracted.
- the necessary processing for concluding the requested energy sales contract is executed (SP13).
- the memory 22 (FIG. 2) of the data analysis apparatus 12 has a diagram. As shown in FIG. 2, a clustering processing program 25, a standard road curve outline data generation processing program 26, a diagnostic decision tree generation processing program 27, and a customer data analysis processing program 28 are stored, and are stored in the storage device 23 of the data analysis device 12. Are stored with an energy provider sending data database 29 and a class and cluster information database 30.
- the clustering processing program 25 is a program having a function of classifying the load data for each customer 8 periodically transmitted from the meter data collection server 3 of the energy provider 2 into a plurality of clusters for each customer.
- the standard load curve outline data generation processing program 26 is a program having a function of generating outline data of the standard load curve of each cluster based on the processing result of the clustering processing program 25.
- the program 27 is a program having a function of generating the above-described diagnosis decision tree (FIG. 14) based on the processing result of the clustering processing program 25.
- the customer data analysis processing program 28 based on the load data and attribute information of the existing customer 8 periodically given from the meter data collection server 3 of the energy provider 2, the future data of the existing customer 8.
- the power consumption, the recommended fee menu and the equipment are determined, the consumer class of the new consumer 8 is determined based on the diagnosis decision tree generated by the diagnosis decision tree generation processing program 27, and the new This is a program having a function of determining the future power consumption of the customer 8, a recommended charge menu, and facilities.
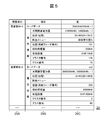
- the energy provider sending data database 29 is a database used to store and hold the load data and attribute information for each customer 8 given from the meter data collection server 3 of the energy provider 2. As shown in FIG. 5, the energy provider sending data database 29 has a table-like configuration including a customer ID column 29A, an item column 29B, and a value column 29C.
- the identification number of each customer 8 is stored in the customer ID column 29A, and the item name of the corresponding customer 8 load data and attribute information (“load data” is “load”). For “data” and attribute information, “monthly accumulated power”, “location (geography)”, “fee menu”, etc.) are stored. In the value column, the value of the corresponding item of the corresponding consumer is stored.
- the power consumption per unit time (“load data”) is “100.0 kW, 150 kW,.
- Electricity is “10000kWh, 14000kWh, "
- latitude and north latitude are "A + 30.0, B + 130.0" (A and B are predetermined constants)
- the current price menu is "Last-night discount type A ”
- the system feeder number is“ 101 ”
- the contracted power reception amount per hour is“ 500 kW ”
- the equipment is“ CHP: 10 kW ”
- the cluster number of the cluster of the load data classified by the above clustering is“ 170 ”. It is shown that the customer class of the customer himself is “70”.
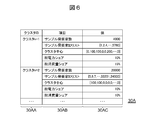
- the class and cluster information database 30 includes a cluster attribute information table 30A shown in FIG. 6 and a class attribute information table 30B shown in FIG.
- the cluster attribute information table 30A is a table used for managing each cluster obtained by clustering the load data of each customer 8 in step SP3 of FIG. 4, and as shown in FIG. And a cluster ID column 30AA, an item column 30AB, and a value column 30AC.
- cluster ID column 30AA identification numbers assigned to the respective clusters obtained by the clustering process are stored, and in the item column 30AB, item names (“number of sample customers”) of each information related to the corresponding cluster. , “Sample customer ID list”, “cluster center”, “total power share”, and “total consumption share”).
- value column 30AC the value of the corresponding item of the corresponding customer 8 is stored.
- the number of consumers belonging to the cluster is “4000”, and the IDs of these consumers 8 are “1,2,4,.
- the coordinates of the cluster center of the cluster are “[0,100,100,0,0,200,...
- the total ratio is “10%”, and the ratio of the total power consumption of each customer 8 belonging to the cluster to the total power consumption of all the consumers 8 is also “10%”.
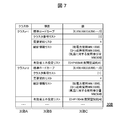
- the class attribute information table 30B is a table used for managing each customer class to which the customer 8 is distributed. As shown in FIG. 7, a class ID column 30BA, an item column 30BB, and a value column 30BC. Consists of
- the class ID column 30BA stores an identification number assigned to each customer class
- the item column 30BB stores item names (“standard road curve”, “cluster number” of each information related to the corresponding customer class. "List”, “customer ID list”, “statistical information list” and “effective energy saving investment list”) are stored.
- the value column 30BC stores the value of the corresponding item of the corresponding customer class.
- the identification number of the corresponding cluster is “1”
- the standard load curve of the customer class is the cluster of the corresponding cluster. It is shown that the center “[0,100,100,0,0,200,..., 0]” is an inverse Fourier transform.
- the customer belonging to the customer class is only the customer 8 whose ID is “4”, and the customer belonging to the customer class obtained by analyzing the load data of the customer 8.
- the total power consumption is “1000” MW
- the power usage is “5000” MW when the power supply state of the energy company 2 is tight, such as during a planned power outage
- the power usage against the temperature The amount of growth is “500” MW
- the recommended equipment for the customer 8 belonging to the customer class is “100kW” “CHP (Combined Heat Power)”
- the recommended price menu is “night type” Contract A ”is shown.
- the statistical information (supplementary information) about the customer class to which the identification number is assigned is not limited to the above, but includes the final demand inventory index, new job openings, complete unemployment rate, corporate tax revenue, etc. Information on the amount of increase in power usage with respect to the economic trend index may be stored.
- FIG. 8 is a process executed by the data analyzer 12 of the analysis operator 11 in step SP3 of the series of processes described above with reference to FIG. The details of the processing are shown.
- the load data clustering process is a process in which each customer 8 is classified into several clusters having similar features such as the outline of the load data, and the cluster center is calculated as information representing each cluster.
- the data analyzer 12 starts the load data clustering process shown in FIG.
- the cluster center set ⁇ C k : k 1, 2,..., N ⁇ when the load data is classified into 1 to M (M is the number of customers 8) clusters in units of customers. Obtain (SP20).
- the data analysis device 12 uses the k-means method to classify the load data into one cluster in units of consumers, and the cluster center set ⁇ C 1 ⁇ of the clusters, and the load data to the customers.
- the data analysis device 12 uses an index (hereinafter referred to as a validity evaluation value) for evaluating which of the number of clusters N is appropriate based on the processing result of the clustering process described above.
- the cluster number validity evaluation value calculation process to be calculated is executed (SP21).
- the data analysis apparatus 12 uses, as the validity evaluation value, the intra-cluster fitness indicating the degree of grouping of load data in each cluster and the inter-cluster average separation indicating the degree of separation between clusters. Calculate the degree.
- the data analyzer 12 determines the optimum number of clusters based on the intra-cluster fitness and the intercluster average separation calculated in step SP21 (SP22).
- each customer 8 is classified into a cluster having an appropriate number of clusters for each customer, and accordingly, each customer 8 is also classified into a customer class having an appropriate number of classes.
- FIG. 9 shows specific processing contents of the clustering process executed in step SP20 of the load data clustering process described above with reference to FIG. This clustering process is executed by the clustering process program 25 (FIG. 2).
- the initial value may be any value, and for example, the execution result of the previous clustering process can be applied.
- the result of Fourier transforming the load data for each customer i for the analysis period is the customer.
- i be the feature quantity S i .
- the above-described feature amount may be information other than the result of Fourier transform as long as it is information indicating the characteristics of the load data of each customer i, or may be time-series data itself of the load data, or an average value of load data (average Statistic information of load data such as demand amount and maximum value (maximum demand amount) may be used.
- the clustering processing program 25 selects one unprocessed customer i from each customer i that has received the load data (SP33). Then, the clustering processing program 25 calculates, for the customer i, the cluster center set ⁇ C k ⁇ of each cluster set in step SP31 and the feature value S i of the load data of the customer i acquired in step SP32. The Euclidean distance is calculated, and the load data of the customer i is allocated to the cluster set Xk of the nearest cluster (SP34).
- the clustering processing program 25 determines whether or not the processing of step SP34 has been completed for all the customers i (SP35), and if a negative result is obtained, returns to step SP33. Then, the clustering processing program 25 thereafter repeats the processing of step SP33 to step SP35 while sequentially switching the customer i selected in step SP33 to another customer i that has not been processed.
- the clustering processing program 25 eventually distributes the load data of each customer i to the cluster set ⁇ X k ⁇ of each cluster (SP35: YES), and sets the cluster center set ⁇ C k ⁇ of each cluster.
- Average values S k_ave ⁇ i s j, 1 / M, ⁇ i s i, 2 / M in a set of customers i (hereinafter referred to as cluster sets) ⁇ X k ⁇ respectively belonging to the corresponding clusters.
- cluster sets ⁇ i s i, 3 / M,... ⁇ (Where i ⁇ X k ) (SP36).
- the clustering processing program 25 determines whether or not the amount of change in step SP36 of the cluster center set ⁇ C k ⁇ of at least one cluster is greater than or equal to a preset threshold value (SP37). If the clustering processing program 25 obtains a positive result in this determination, it returns to step SP33, and thereafter repeats step SP33 to step SP37.
- SP37 a preset threshold value
- the clustering processing program 25 eventually sets the cluster center set ⁇ C k ⁇ of each cluster and the cluster set of each cluster. ⁇ X k ⁇ is stored in the memory 22 (FIG. 2) (SP38).
- the clustering processing program 25 determines whether or not the processing of step SP31 to step SP38 has been executed for all the cluster numbers N (SP39). If the clustering processing program 25 obtains a negative result in this determination, then it changes the number N of clusters selected in step SP30 to other unprocessed values (1 to M), and then performs the processing in steps SP30 to SP39. repeat.
- the clustering processing program 25 eventually acquires the cluster center set ⁇ C k ⁇ and cluster set ⁇ X i ⁇ of each cluster when the number of clusters is assumed to be 1 to M (SP39: YES). This clustering process is terminated.
- FIG. 10 shows specific processing contents of the cluster number validity evaluation value calculation process executed in step SP21 of the load data clustering process described above with reference to FIG. Show.
- This cluster number validity evaluation value calculation processing is executed by the clustering processing program 25.
- Cluster number validity table value calculation processing is based on the results of clustering for each of the cluster numbers 1 to M calculated in the load data clustering processing described above, and a plurality of distances such as the distance between the load data and the cluster center and the distance between each cluster. This is a process of evaluating the index and determining the number of clusters.
- the clustering processing program 25 ends the clustering processing described above with reference to FIG. 9, the cluster number validity evaluation value calculation processing shown in FIG. 10 is started.
- the cluster number N is set to 1 to M (M is all If any one of the number of consumers) is selected (SP40) and the number of clusters N is assumed to be the number selected in step SP40, the feature amount S i of each load data belonging to that cluster is assumed for each cluster.
- the cluster center C k of the cluster (hereinafter referred to as intra-cluster error) E k is calculated (SP41).
- the clustering processing program 25 calculates the intra-cluster error of one cluster as the total value of the distances between the feature amounts S i of the individual load data belonging to the cluster and the cluster center C k of the cluster. To do.
- the clustering program 25 based on the calculated cluster error E N in step SP41, the penalty coefficient for suppressing the number is too large clusters a, the number of feature dimensions as D, the following formula To calculate the intra-cluster fitness E (N) for each cluster (SP42).
- This intra-cluster fitness E (N) is an index representing the degree of grouping of individual load data in the cluster as described above. The larger the intra-cluster fitness E (N), the more load data is organized in the cluster. It represents that it is in a state.
- the clustering processing program 25 calculates the boundary surfaces g that can be separated from each other with a multi-class support vector machine (SP43), and then calculates the total value of margins (distances) between the clusters as MN.
- SP43 multi-class support vector machine
- the inter-cluster average separation degree B (N) is an index representing the degree of separation between clusters as described above, and the larger the cluster, the more separated the clusters are.
- the average degree of separation between clusters may be any index that increases as long as the average distance between the clusters is large.
- the average value of the distances between the cluster center sets ⁇ C k ⁇ may be used as an index. good.
- the clustering processing program 25 determines whether or not the intra-cluster fitness E (N) and the intercluster average separation B (N) have been calculated for all the numbers of clusters N (1 to M) (SP45). ). If the clustering processing program 25 obtains a negative result in this determination, it thereafter performs the processing of step SP40 to step SP45 while changing the number N of clusters selected in step SP40 to another value (1 to M) that has not been processed. repeat.
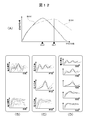
- FIG. 11 shows specific processing contents of the optimal cluster number determination process executed in step SP22 of the load data clustering process described above with reference to FIG. This optimum cluster number determination processing is also executed by the clustering processing program 25.
- the clustering processing program 25 finishes the cluster number validity evaluation value calculation process described above with reference to FIG. 10, it starts the optimum cluster number determination process shown in FIG. Based on the value of each intra-cluster fitness E (N) when the number of clusters N calculated in step 1 is assumed to be 1 to M, as shown in FIG.
- the minimum number of clusters in which the rate of change in E (N) is less than or equal to a preset first threshold is calculated as the optimum fitness cluster number CL1 (SP50).
- the clustering processing program 25 uses the values of the average degree of separation B (N) between the clusters when the number of clusters N calculated in the cluster number validity evaluation value calculation processing is 1 to M, as shown in FIG. As shown in A), the minimum number of clusters in which the ratio of the amount of change in the intercluster average separation degree B (N) with respect to the amount of change in the number of clusters is equal to or less than a preset second threshold is determined as the optimum number of clusters for the degree of separation. Calculated as CL2 (SP51).
- the degree of clustering of load data in each cluster is small, and the degree of separation between clusters is also small. Therefore, as shown in FIG. 12D, the difference in the general shape of the standard load curve of each cluster is small, and the characteristics of the power usage pattern of the customer 8 belonging to the class corresponding to each cluster (weekday daytime usage type) , Night use type, or specific time use type) is difficult to extract.
- the clustering processing program 25 thereafter calculates one cluster number from the number of clusters between the fitness degree optimal cluster number CL1 calculated in step SP50 and the separation degree optimal cluster number CL2 calculated in step SP51.
- the number of clusters is determined (SP52).
- the clustering processing program 25 randomly selects a cluster number closest to the median value or a random number from the cluster number. The number of clusters selected in is determined as the number of clusters this time. In addition, when there is no cluster number between the optimum fitness cluster number CL1 and the optimum separation degree cluster number CL2, the clustering processing program 25 selects any one of the optimum fitness cluster number CL1 and the optimum separation degree cluster number CL2. Either one of or a predetermined number is determined as the number of clusters this time.
- the clustering processing program 25 creates a cluster attribute information table 30A (FIG. 6) and a class attribute information table 30B based on the determination result of step SP52 (SP53), and then ends this cluster number determination process. .
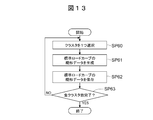
- FIG. 13 shows specific processing of standard load curve outline data generation processing executed by the data analyzer 12 in step SP4 of the series of processing described above with reference to FIG. Show the contents.
- This standard load curve outline data generation processing is executed by the standard load curve outline data generation processing program 26 (FIG. 2).
- the standard load curve outline data generation processing program 26 executes the standard load curve outline data generation processing shown in FIG. 13 when the clustering processing program 25 finishes the load data clustering processing described above with reference to FIGS. First, one cluster is selected from the clusters having the number of clusters determined in the optimum cluster number determination process (FIG. 11) described above (SP60).
- the standard load curve outline data generation processing program 26 generates outline data of the standard load curve for the cluster selected in step SP60 (SP61). Specifically, the standard load curve outline data generation processing program 26 acquires the cluster center of the cluster selected in step SP60 from the cluster attribute information table 30A (FIG. 6). If necessary, outline data of the standard load curve of the cluster is generated by correcting the center of the cluster with an error from the load curve of the customer 8 belonging to the cluster or a maximum value. For example, when the maximum demand is required, the standard load curve can be corrected by selecting the load curve of the customer belonging to the cluster that has a large excess (upward error) from the center of the cluster. The excess amount may be added to the center of the cluster, or the variance of the load curve of customers belonging to the cluster may be added as an error of the standard load curve.
- the standard road curve outline data generation processing program 26 stores the outline data of the standard road curve generated in step SP61 in the class attribute information table 30B (FIG. 7) (SP62), and thereafter for all clusters. It is determined whether or not the outline data of the standard load curve has been generated (SP63).
- step SP60 If the standard road curve outline data generation processing program 26 obtains a negative result in this determination, it then repeats the processing of step SP60 to step SP63 while sequentially switching the cluster selected in step SP60 to another cluster that has not been processed. .
- the standard load curve outline data generation processing program 26 eventually ends the standard load curve outline data generation process when generation of outline data of the standard load curve is completed for all the clusters (SP63: YES).
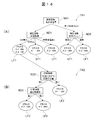
- FIG. 14 shows a schematic configuration of the diagnosis decision tree generated in step SP6 of the series of processes described above with reference to FIG.
- the diagnosis decision tree generation process is a process for integratively generating a diagnosis decision tree for estimating a cluster to which a consumer is associated from information held by each of the energy company and the analysis company.
- the diagnosis decision tree includes a first diagnosis decision tree TR1 shown in FIG. 14 (A) and a second diagnosis decision tree TR2 shown in FIG. 14 (B).
- the first diagnosis decision tree TR1 is only for the load data and attribute information for the analysis period of each customer 8 provided from the meter data collection server 3 (FIG. 1) of the energy provider 2 to the data analysis device 12. It is a diagnostic tree created based on this.
- the contents of each node ND1 are only related to the power usage status of the customer 8 recognized based on the load data and the attribute information of the customer 8, and the customer The customer 8 can be associated with one of the clusters based only on the eight attribute information.
- the leaf LF1 in which the distribution destination cluster is not clear among the leaves LF1 of the first diagnosis decision tree TR1 (the distribution destination cluster is not determined to be one) LF1
- the incidental information of these customers 8 obtained by analyzing the load data for the analysis period of the existing customers 8 distributed to the leaf LF1 (the attributes of the customer class to which these customers 8 belong) Information).
- the contents of each node ND2 are only related to the supplementary information of the customer 8, so that the consumer can be associated with any cluster based on the supplementary information. Has been made.
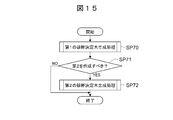
- FIG. 15 shows specific processing contents of the diagnostic decision tree generation process executed in step SP6 of the series of processes described above with reference to FIG. 4 in order to create such first and second diagnostic decision trees TR1 and TR2. Indicates.
- This diagnosis decision tree generation process is executed by the diagnosis decision tree generation process program 27 (FIG. 2).
- the diagnostic decision tree generation processing program 27 proceeds to step SP6 of the series of processing described above with reference to FIG. 4, it starts the diagnostic decision tree generation processing shown in FIG. With reference to FIG. 5) and the cluster attribute information table 30A (FIG. 6), the first diagnosis decision tree TR1 is generated (SP70).
- the diagnosis decision tree generation processing program 27 determines whether or not there is a leaf LF1 in which the distribution destination cluster is not determined as one in the first diagnosis decision tree TR1 (SP71). If the diagnosis decision tree generation processing program 27 obtains a negative result in this determination, it ends this diagnosis decision tree generation processing.
- diagnosis decision tree generation processing program 27 obtains a positive result in the determination at step SP71, it refers to the class attribute information table 30B and generates the second diagnosis decision tree TR2 (SP72). This diagnostic tree determination process is terminated.
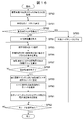
- FIG. 16 shows the specific processing contents of the diagnostic decision tree generation processing program 27 in step SP70 of the diagnostic tree decision processing (FIG. 15).
- the diagnosis decision tree generation processing program 27 proceeds to step SP70 of the diagnosis tree decision process, the diagnosis decision tree generation process 27 starts the first diagnosis decision tree creation process shown in FIG.
- the cluster information ⁇ X k ⁇ determined by the process and the attribute item ⁇ A i ⁇ of each customer are acquired (SP80), and the process is started from the root (highest node) of the diagnosis decision tree to be generated. (SP81).
- the diagnosis decision tree generation processing program 27 determines whether or not the attribute item ⁇ A i ⁇ acquired in step SP80 is an empty set (SP82). If the diagnosis decision tree generation processing program 27 obtains a negative result in this determination, it makes that node a leaf (terminal node) and then proceeds to step SP92 (SP83).
- the diagnosis decision tree generation processing program 27 obtains a negative result in the determination at step SP82, the average information amount H ( ⁇ X k ⁇ ) of the clusters in all the consumers included in the current cluster information is expressed by (SP84).
- is the number of consumers included in cluster k.
- the average information amount H ( ⁇ X k ⁇ ) of the cluster is large if the cluster belonging to the input customer 8 has a large variation, and takes a large value if the deviation is large. When all the inputted customers 8 belong to only one cluster, it becomes 0.
- the diagnostic decision tree generation processing program 27 from the input attribute item ⁇ A i ⁇ , 1 single attribute to select the item A i (SP85), the value a i, 1 included in the attribute fields A i selected,
- are calculated (SP86).
- the diagnosis decision tree generation processing program 27 calculates the information gain IG (A i ) for the selected attribute item as (SP87). It should be noted that the information gain IG (A i ) is the extent to which the variation of clusters belonging to the customer 8 divided into subsets by the attribute values a i, 1 , a i, 2 , ai , 3 . Is a parameter that represents
- diagnosis decision tree generation processing program 27 determines whether or not the information gain IG (A i ) has been calculated for all the input attribute items ⁇ A i ⁇ (SP88), and if a negative result is obtained. The process returns to step SP85. Thereafter, the diagnostic decision tree generation processing program 27 repeats the processing from step SP85 to step SP88.
- the diagnosis decision tree generation processing program 27 eventually obtains an affirmative result at step SP88 by completing the calculation of the information gain IG (A i ) for all the attribute items ⁇ A i ⁇ , the information obtained by the above processing is obtained. set the gain IG (a i) the current node in the diagnostic decision tree the most information gain IG (a i) is greater attribute item a i * from the (SP89), attribute item a i * attribute values a i * , 1 , ai * , 2 , ai * , 3 ,... Are created for each child node (SP90).
- the diagnostic decision tree generation processing program 27 the above-mentioned attribute item A i * attribute values a i *, 1, a i *, 2, a i *, 3, for ..., the attribute value a i * , J , the subset of clusters ⁇ Y K, j ⁇ is recorded as a new cluster set ⁇ X k ⁇ for the corresponding child node. Also, a subset ⁇ A i ⁇ A i * ⁇ of attribute items excluding the attribute item A i * having the largest information gain IG (A i ) is recorded as a new attribute set ⁇ A i ⁇ for each child node. (SP91).
- diagnosis decision tree generation processing program 27 determines whether or not the processing of steps SP81 to SP91 has been completed for all nodes (SP92), and if a negative result is obtained, it is selected in step SP81.
- the processing of step SP81 to step SP92 is repeated while sequentially switching the node to another unprocessed node.
- diagnosis decision tree generation processing program 27 eventually obtains a positive result in step SP92 by determining the corresponding attribute item A i * in all the nodes, the first diagnosis decision tree generation processing ends.
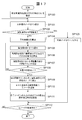
- FIG. 17 shows the specific processing contents of the diagnostic decision tree generation processing program 27 in step SP71 of the diagnostic tree decision processing (FIG. 15) described above with reference to FIG.
- the distribution destination cluster is not clear among the leaves LF1 of the diagnosis decision tree TR1 generated in FIG. 16 (the number of distribution destination clusters is one).
- the diagnostic decision tree generation processing program 27 creates the second diagnostic decision tree TR2 (FIG. 14B) using the incidental information of the customer 8 as the attribute item ⁇ B i ⁇ . Executed. Since the processing content of the second diagnosis decision tree generation process is the same as the first diagnosis decision tree generation process described above with reference to FIG. 16 except that the incidental information is used as an input item, detailed description thereof is omitted.
- the first diagnosis decision tree generation process described above with reference to FIG. 16 and the second diagnosis decision tree generation process described above with reference to FIG. 17 are based on ID3, but any method can be used as long as it can generate a decision tree that can diagnose a cluster. Either method may be used, and the generation methods of the first and second diagnosis decision trees TR1 and TR2 may not be the same.
- FIG. 18 shows a customer whose energy sales contract is not contracted in step SP13 of the series of processing described above with reference to FIG.
- the processing contents of the base load sales contract conclusion process executed by the sales information processing apparatus 5 (FIG. 3) that has received an application for an energy sales contract for the base load portion of the used power from FIG.
- This base load sales contract conclusion processing is executed by a contract conclusion processing program 37 (FIG. 3) stored in the memory 33 of the sales information processing apparatus 5.
- the contract conclusion processing program 37 when the contract conclusion processing program 37 receives an application for such an energy sales contract from the non-contracted customer 8 via the network 14, the contract conclusion processing program 37 starts the base load sales contract conclusion processing shown in FIG.
- a request to estimate the future power consumption of the non-contracted customer 8 is transmitted to the data analysis apparatus 12 together with the attribute information of the non-contracted customer 8 input at the time of application.
- the data analysis device 12 uses the diagnosis decision tree described above with reference to FIG. 14 based on the attribute information of the non-contracted customer 8 to estimate that the non-contracted customer 8 belongs.
- the house class is determined, the outline data of the standard load curve of the customer class is read out from the class attribute information table 30B (FIG. 7), and this is the load representing the future power consumption estimated for the non-contracted consumer. It is transmitted to the sales information processing apparatus 5 as curve outline data (SP120).
- the contract conclusion processing program 37 is based on the outline data of the load curve of the non-contracted customer acquired in step SP120, and the non-contracted customer is currently contracting with another energy provider.
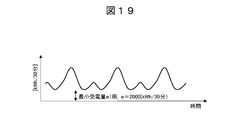
- the estimated power reception amount is estimated (SP121), and the minimum power reception amount (hereinafter referred to as the minimum power reception amount) e (FIG. 21) of the non-contracted consumer is calculated (SP122).
- the customer 8 inputs / outputs information about the maximum amount of power received (kW) for a predetermined period contracted with another energy provider and the amount of power received (kWh) for a predetermined period to the processing equipment of the analyzer 11 and the energy provider 2 It may be transmitted via the terminal 10, or may be estimated by multiplying the building area of the customer 8 and the number of power receiving facilities by a predetermined coefficient. In this way, even when the outline data of the load curve is obtained from the normalized load data, the approximate value of the load curve is obtained using the two values of the maximum received power and the received power for a predetermined period.
- the load data of unsigned consumers can be estimated from the shape data, and the minimum amount of received power e of the unsigned consumers can be calculated.
- the contract conclusion processing program 37 determines whether or not the minimum power reception amount e calculated in step SP122 is larger than a predetermined threshold (SP123). If the contract conclusion processing program 37 obtains a negative result in this determination, the contract conclusion processing program 37 transmits a message to the effect that the energy sales contract is not concluded to the non-contracted customer, and then ends the base load sales contract conclusion processing. Therefore, in this case, such an energy sales contract with the non-contracted consumer is not concluded.
- the contract conclusion processing program 37 executes a predetermined process for concluding such an energy sales contract with the uncontracted consumer (SP124).
- SP124 the contract conclusion processing program 37 executes a predetermined process for concluding such an energy sales contract with the uncontracted consumer (SP124).
- SP124 Instruct the transaction merchandise information processing apparatus 6 to procure power for the minimum amount of power received e calculated in step SP122 (SP125), and thereafter end the base load sales contract conclusion process.
- unsigned Customer List presentation processing executed in the energy sales system 1 will be described separately from the series of processing described above with reference to FIG.
- the data analysis device 12 holds a list of all power consumers who receive power supply from any of a plurality of existing energy providers 2 (hereinafter referred to as an all-customer list). It is assumed that attribute information of all registered electric power consumers is posted in the all consumer list.
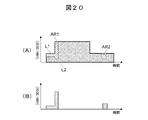
- the area surrounded by the solid line L1 indicates the amount of power in a certain future period that has already been procured by the power generation procurement section of the energy company 2, and the area enclosed by the broken line L2 is the analysis company 11
- the electric power demand in the period estimated by the data analyzer 12 is shown.
- the “procured power amount” here means not only the amount of power purchased and reserved by the power generation procurement section in the power trading market, but also the power generation procurement section generates power when the energy company 2 has power generation facilities. This refers to the total amount of power, including the amount of power generated by the facility. The same applies to the following.
- FIG. 20A there is a possibility that the power amounts in the hatched areas AR1 and AR2 become the surplus power amount.
- An uncontracted customer list presentation function for presenting a list (hereinafter referred to as an uncontracted customer list) posted as candidates to be concluded is installed.
- FIG. 21 shows a processing procedure of unsigned customer list presentation processing executed in the sales information processing apparatus 5 in relation to such an unsigned customer list presentation function.
- This unsigned customer list presentation process is executed by the unsigned customer list creation program 36 stored in the memory 33 (FIG. 3) of the sales information processing apparatus 5.
- the unsigned customer list creation program 36 starts the unsigned customer list presentation process shown in FIG. 21 in response to a predetermined operation on the sales information processing apparatus 5 (FIG. 1).
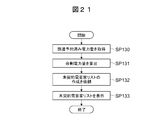
- Data representing the amount of power already procured for a predetermined period is acquired from the device 6 (FIG. 1) (SP130), and the amount of power already procured recognized based on the acquired data and the data analysis device 12 as described above.
- a comparison is made with the amount of future power demand in the notified energy provider 2.
- the uncontracted consumer list creation program 36 is expected to occur within the predetermined period by calculating the difference between the amount of electric power already procured and the estimated value of the future demand electric energy based on the comparison result.
- the amount of surplus power to be calculated is calculated (SP131).
- the uncontracted consumer list creation program 36 thereafter generates surplus electric energy data calculated in step SP131 for the above-mentioned unsigned consumer list creation request (hereinafter referred to as an uncontracted consumer list creation request).
- the data is transmitted to the data analyzer 12 of the analyzer 2 (SP132).
- the data analysis apparatus 12 that has received this uncontracted consumer list creation request has a consumer class (hereinafter referred to as a specific consumer class) having a standard load curve similar to the temporal change of the surplus power. Is detected with reference to the class attribute information table 30B (FIG. 7).
- the data analysis device 12 assigns the unsigned customer 8 among the customers 8 registered in the above-described all customer list to each customer class using the diagnosis decision tree described above with reference to FIG. Classify.
- the data analyzer 12 creates the above-mentioned unsigned consumer list in which each unsigned consumer 8 classified into the specific consumer class at this time is posted as a sales expansion destination candidate, and data of the created unsigned consumer list (Hereinafter referred to as unsigned customer list data) is transmitted to the sales information processing apparatus 5.
- the unsigned customer list creation program 36 of the business information processing apparatus 5 displays an unsigned customer list based on the unsigned customer list data (SP133). Thereafter, the unsigned customer list presentation process is terminated.
- the sales information processing device 5 adds the generated outline data of the load curve within the analysis period for each customer 8 as the sales power amount, calculates the power generation procurement amount necessary for each time slot within the analysis period, You may perform the process which instruct
- the intra-cluster fitness indicating the degree of grouping of load data in each cluster
- each consumer Eight load data can be clustered into the number of clusters that match the actual situation.
- the customers 8 can be appropriately classified into a plurality of customer classes, and the subsequent data analysis processing can be performed more reliably based on the classification results. .
- the diagnostic decision tree like FIG. 14 which makes the last unit of profiling of each customer 8 the segmentation result is created. Therefore, the new customer 8 who has not acquired the load data and the existing customer 8 (new customer 8) who cannot acquire the load data because the equipment control terminal 9 (FIG. 1) is not installed. Can also be classified into appropriate clusters.
- the present invention can be widely applied to a data analysis system that performs various data analysis based on load data and attribute information of each consumer who receives power supply from an energy provider.
Landscapes
- Business, Economics & Management (AREA)
- Engineering & Computer Science (AREA)
- Strategic Management (AREA)
- Accounting & Taxation (AREA)
- Development Economics (AREA)
- Economics (AREA)
- Finance (AREA)
- General Business, Economics & Management (AREA)
- Theoretical Computer Science (AREA)
- Entrepreneurship & Innovation (AREA)
- Marketing (AREA)
- Physics & Mathematics (AREA)
- Health & Medical Sciences (AREA)
- General Physics & Mathematics (AREA)
- Data Mining & Analysis (AREA)
- Game Theory and Decision Science (AREA)
- Public Health (AREA)
- Water Supply & Treatment (AREA)
- General Health & Medical Sciences (AREA)
- Human Resources & Organizations (AREA)
- Primary Health Care (AREA)
- Tourism & Hospitality (AREA)
- Power Engineering (AREA)
- Management, Administration, Business Operations System, And Electronic Commerce (AREA)
- Supply And Distribution Of Alternating Current (AREA)
- Remote Monitoring And Control Of Power-Distribution Networks (AREA)
Priority Applications (3)
| Application Number | Priority Date | Filing Date | Title |
|---|---|---|---|
| JP2016506204A JP6474782B2 (ja) | 2014-03-07 | 2015-03-06 | データ分析システム及び方法 |
| US15/123,746 US10664931B2 (en) | 2014-03-07 | 2015-03-06 | Data analyzing system and method |
| EP15759029.0A EP3115959B1 (en) | 2014-03-07 | 2015-03-06 | Data analysis system and method |
Applications Claiming Priority (2)
| Application Number | Priority Date | Filing Date | Title |
|---|---|---|---|
| JP2014045749 | 2014-03-07 | ||
| JP2014-045749 | 2014-03-07 |
Publications (1)
| Publication Number | Publication Date |
|---|---|
| WO2015133635A1 true WO2015133635A1 (ja) | 2015-09-11 |
Family
ID=54055432
Family Applications (1)
| Application Number | Title | Priority Date | Filing Date |
|---|---|---|---|
| PCT/JP2015/056739 Ceased WO2015133635A1 (ja) | 2014-03-07 | 2015-03-06 | データ分析システム及び方法 |
Country Status (4)
| Country | Link |
|---|---|
| US (1) | US10664931B2 (cg-RX-API-DMAC7.html) |
| EP (1) | EP3115959B1 (cg-RX-API-DMAC7.html) |
| JP (2) | JP6474782B2 (cg-RX-API-DMAC7.html) |
| WO (1) | WO2015133635A1 (cg-RX-API-DMAC7.html) |
Cited By (8)
| Publication number | Priority date | Publication date | Assignee | Title |
|---|---|---|---|---|
| JP2017182266A (ja) * | 2016-03-29 | 2017-10-05 | 株式会社東芝 | 電力需要予測装置 |
| WO2017199578A1 (ja) * | 2016-05-20 | 2017-11-23 | 株式会社日立製作所 | 需要予測システム及び需要予測方法 |
| CN108475257A (zh) * | 2015-12-17 | 2018-08-31 | 苏伊士集团 | 处理远程仪表读取数据以分析消耗量模式 |
| CN111737001A (zh) * | 2020-06-24 | 2020-10-02 | 国网电力科学研究院有限公司 | 一种计算系统负载均衡方法、装置及存储介质 |
| CN112906790A (zh) * | 2021-02-20 | 2021-06-04 | 国网江苏省电力有限公司营销服务中心 | 一种基于用电数据的独居老人识别方法和系统 |
| JP2021105811A (ja) * | 2019-12-26 | 2021-07-26 | 川崎重工業株式会社 | エネルギー需要変動パターンの分類方法及びシステム |
| JP2021163010A (ja) * | 2020-03-31 | 2021-10-11 | 株式会社日立製作所 | 電力需要マッチングシステム及び方法 |
| JP2022131430A (ja) * | 2021-02-26 | 2022-09-07 | 三菱電機株式会社 | 需給管理装置、取引支援装置、需給管理方法および需給管理プログラム |
Families Citing this family (19)
| Publication number | Priority date | Publication date | Assignee | Title |
|---|---|---|---|---|
| US10628456B2 (en) | 2015-10-30 | 2020-04-21 | Hartford Fire Insurance Company | Universal analytical data mart and data structure for same |
| US11244401B2 (en) * | 2015-10-30 | 2022-02-08 | Hartford Fire Insurance Company | Outlier system for grouping of characteristics |
| JP2017093193A (ja) * | 2015-11-12 | 2017-05-25 | 富士通株式会社 | 電力調達調整プログラム、電力調達調整装置および電力調達調整方法 |
| US10509459B2 (en) * | 2016-05-19 | 2019-12-17 | Scenera, Inc. | Scene-based sensor networks |
| CN108550053B (zh) * | 2018-04-12 | 2022-05-13 | 南京海丽尔信息技术有限公司 | 基于平台技术的用户消费数据采集分析系统及方法 |
| CN109636101A (zh) * | 2018-11-02 | 2019-04-16 | 国网辽宁省电力有限公司朝阳供电公司 | 基于大数据的开放售电环境下大用户用电行为分析方法 |
| CN109684673B (zh) * | 2018-12-03 | 2023-03-24 | 三峡大学 | 一种电力系统暂态稳定结果的特征提取和聚类分析方法 |
| JP7157681B2 (ja) * | 2019-03-01 | 2022-10-20 | 東京瓦斯株式会社 | 属性推定装置、方法、およびプログラム |
| CN113853629A (zh) * | 2019-05-29 | 2021-12-28 | 西门子股份公司 | 电网用户分类方法、装置和计算机可读存储介质 |
| CN110264251B (zh) * | 2019-05-31 | 2021-08-10 | 杭州博钊科技有限公司 | 表征现金流的数据组织形式与基于多任务学习的预测方法 |
| US12393860B2 (en) * | 2019-07-29 | 2025-08-19 | Oracle International Corporation | Systems and methods for optimizing machine learning models by summarizing list characteristics based on multi-dimensional feature vectors |
| CN111125630B (zh) * | 2019-12-27 | 2023-12-22 | 北京工业大学 | 一种基于l1/2范数和同质性约束的能源分解方法 |
| JP7544482B2 (ja) * | 2020-01-20 | 2024-09-03 | 東京瓦斯株式会社 | エネルギー消費量予測システム、エネルギー消費量予測支援システム、エネルギー消費量予測方法、及びプログラム |
| FR3117283B1 (fr) * | 2020-12-04 | 2024-11-29 | Electricite De France | Système pour la détermination d’une puissance électrique |
| JP7423505B2 (ja) * | 2020-12-21 | 2024-01-29 | 株式会社日立製作所 | データ分析システムおよび方法 |
| CN113988661A (zh) * | 2021-11-01 | 2022-01-28 | 南方电网科学研究院有限责任公司 | 一种专变终端的用电分配方法、装置和设备 |
| US12452799B2 (en) | 2022-02-28 | 2025-10-21 | Samsung Electronics Co., Ltd. | Electronic apparatus and controlling method thereof |
| CN115146881B (zh) * | 2022-09-05 | 2023-01-13 | 广东电网有限责任公司江门供电局 | 一种低压分布式光伏系统不良数据检测方法和系统 |
| CN116632807A (zh) * | 2023-01-03 | 2023-08-22 | 国网北京市电力公司 | 柔性负荷识别方法及装置 |
Citations (8)
| Publication number | Priority date | Publication date | Assignee | Title |
|---|---|---|---|---|
| JP2002169613A (ja) * | 2000-12-04 | 2002-06-14 | Hitachi Ltd | 電力ロードカーブの分析方法およびシステム |
| JP2003162787A (ja) * | 2001-08-03 | 2003-06-06 | Matsushita Electric Ind Co Ltd | エネルギー管理システム |
| JP2003189471A (ja) * | 2001-12-12 | 2003-07-04 | Mitsubishi Electric Corp | 電力需要家データ分析方法 |
| JP2004226223A (ja) * | 2003-01-22 | 2004-08-12 | Chugoku Electric Power Co Inc:The | 電力供給サービス方法およびシステム、電力量計、並びに、プログラム |
| JP2006011715A (ja) * | 2004-06-24 | 2006-01-12 | Tokyo Electric Power Co Inc:The | 資源消費量の推定方法及び装置 |
| JP2009277136A (ja) * | 2008-05-16 | 2009-11-26 | Mitsubishi Electric Corp | 類似度分析評価システム |
| JP2012048503A (ja) * | 2010-08-26 | 2012-03-08 | Panasonic Electric Works Co Ltd | 電気量管理システムおよびセンタサーバ |
| JP2013240154A (ja) * | 2012-05-11 | 2013-11-28 | Toshiba Corp | 電力需給調整装置及びその方法 |
Family Cites Families (11)
| Publication number | Priority date | Publication date | Assignee | Title |
|---|---|---|---|---|
| JP2001134577A (ja) | 1999-11-01 | 2001-05-18 | Fujitsu Ltd | データ分析装置、方法、およびそのコンピュータプログラムを記憶した記憶媒体 |
| SG135048A1 (en) * | 2000-10-18 | 2007-09-28 | Johnson & Johnson Consumer | Intelligent performance-based product recommendation system |
| US9785953B2 (en) * | 2000-12-20 | 2017-10-10 | International Business Machines Corporation | System and method for generating demand groups |
| JP4971811B2 (ja) | 2007-01-25 | 2012-07-11 | パナソニック株式会社 | 関数データベース生成方法及び関数データベース生成装置 |
| US20100332373A1 (en) * | 2009-02-26 | 2010-12-30 | Jason Crabtree | System and method for participation in energy-related markets |
| JP2012113625A (ja) * | 2010-11-26 | 2012-06-14 | Sony Corp | 情報処置装置、情報処置方法およびプログラム |
| CN103336770B (zh) * | 2012-02-28 | 2017-03-01 | 国际商业机器公司 | 用于标识互补数据对象的方法和系统 |
| JP5909555B2 (ja) | 2012-08-27 | 2016-04-26 | 株式会社日立製作所 | 需要家協調支援装置 |
| JP6181360B2 (ja) | 2012-08-30 | 2017-08-16 | アクセンチュア グローバル サービシズ リミテッド | マーケティング装置、マーケティング方法、プログラム、及び記録媒体 |
| KR101768438B1 (ko) * | 2013-10-30 | 2017-08-16 | 삼성에스디에스 주식회사 | 데이터 분류 장치 및 방법과 이를 이용한 데이터 수집 시스템 |
| US20150161233A1 (en) * | 2013-12-11 | 2015-06-11 | The Board Of Trustees Of The Leland Stanford Junior University | Customer energy consumption segmentation using time-series data |
-
2015
- 2015-03-06 WO PCT/JP2015/056739 patent/WO2015133635A1/ja not_active Ceased
- 2015-03-06 US US15/123,746 patent/US10664931B2/en active Active
- 2015-03-06 EP EP15759029.0A patent/EP3115959B1/en active Active
- 2015-03-06 JP JP2016506204A patent/JP6474782B2/ja active Active
-
2018
- 2018-11-13 JP JP2018212892A patent/JP6854270B2/ja active Active
Patent Citations (8)
| Publication number | Priority date | Publication date | Assignee | Title |
|---|---|---|---|---|
| JP2002169613A (ja) * | 2000-12-04 | 2002-06-14 | Hitachi Ltd | 電力ロードカーブの分析方法およびシステム |
| JP2003162787A (ja) * | 2001-08-03 | 2003-06-06 | Matsushita Electric Ind Co Ltd | エネルギー管理システム |
| JP2003189471A (ja) * | 2001-12-12 | 2003-07-04 | Mitsubishi Electric Corp | 電力需要家データ分析方法 |
| JP2004226223A (ja) * | 2003-01-22 | 2004-08-12 | Chugoku Electric Power Co Inc:The | 電力供給サービス方法およびシステム、電力量計、並びに、プログラム |
| JP2006011715A (ja) * | 2004-06-24 | 2006-01-12 | Tokyo Electric Power Co Inc:The | 資源消費量の推定方法及び装置 |
| JP2009277136A (ja) * | 2008-05-16 | 2009-11-26 | Mitsubishi Electric Corp | 類似度分析評価システム |
| JP2012048503A (ja) * | 2010-08-26 | 2012-03-08 | Panasonic Electric Works Co Ltd | 電気量管理システムおよびセンタサーバ |
| JP2013240154A (ja) * | 2012-05-11 | 2013-11-28 | Toshiba Corp | 電力需給調整装置及びその方法 |
Cited By (12)
| Publication number | Priority date | Publication date | Assignee | Title |
|---|---|---|---|---|
| CN108475257A (zh) * | 2015-12-17 | 2018-08-31 | 苏伊士集团 | 处理远程仪表读取数据以分析消耗量模式 |
| JP2017182266A (ja) * | 2016-03-29 | 2017-10-05 | 株式会社東芝 | 電力需要予測装置 |
| WO2017199578A1 (ja) * | 2016-05-20 | 2017-11-23 | 株式会社日立製作所 | 需要予測システム及び需要予測方法 |
| JP2021105811A (ja) * | 2019-12-26 | 2021-07-26 | 川崎重工業株式会社 | エネルギー需要変動パターンの分類方法及びシステム |
| JP7458183B2 (ja) | 2019-12-26 | 2024-03-29 | 川崎重工業株式会社 | エネルギー需要変動パターンの分類方法及びシステム |
| JP2021163010A (ja) * | 2020-03-31 | 2021-10-11 | 株式会社日立製作所 | 電力需要マッチングシステム及び方法 |
| JP7296337B2 (ja) | 2020-03-31 | 2023-06-22 | 株式会社日立製作所 | 電力需要マッチングシステム及び方法 |
| CN111737001A (zh) * | 2020-06-24 | 2020-10-02 | 国网电力科学研究院有限公司 | 一种计算系统负载均衡方法、装置及存储介质 |
| CN112906790A (zh) * | 2021-02-20 | 2021-06-04 | 国网江苏省电力有限公司营销服务中心 | 一种基于用电数据的独居老人识别方法和系统 |
| CN112906790B (zh) * | 2021-02-20 | 2023-08-18 | 国网江苏省电力有限公司营销服务中心 | 一种基于用电数据的独居老人识别方法和系统 |
| JP2022131430A (ja) * | 2021-02-26 | 2022-09-07 | 三菱電機株式会社 | 需給管理装置、取引支援装置、需給管理方法および需給管理プログラム |
| JP7630299B2 (ja) | 2021-02-26 | 2025-02-17 | 三菱電機株式会社 | 需給管理装置、取引支援装置、需給管理方法および需給管理プログラム |
Also Published As
| Publication number | Publication date |
|---|---|
| US20170018038A1 (en) | 2017-01-19 |
| JPWO2015133635A1 (ja) | 2017-04-06 |
| US10664931B2 (en) | 2020-05-26 |
| EP3115959A4 (en) | 2017-11-01 |
| EP3115959B1 (en) | 2020-06-03 |
| JP2019023937A (ja) | 2019-02-14 |
| JP6474782B2 (ja) | 2019-02-27 |
| JP6854270B2 (ja) | 2021-04-07 |
| EP3115959A1 (en) | 2017-01-11 |
Similar Documents
| Publication | Publication Date | Title |
|---|---|---|
| JP6474782B2 (ja) | データ分析システム及び方法 | |
| JP6895416B2 (ja) | エネルギー需要予測システム及びエネルギー需要予測方法 | |
| JP6837949B2 (ja) | 予測システム及び方法 | |
| JP7319757B2 (ja) | データ処理システム及びデータ処理方法 | |
| US20190279239A1 (en) | Power Trading Assistance Device and Market Price Prediction Information Generation Method | |
| US9753477B2 (en) | Load forecasting for residential sector demand response | |
| CN108389073A (zh) | 商品售价的自动计算方法及系统、电子设备及存储介质 | |
| Welisch et al. | Assessment of RES technology market values and the merit-order effect–an econometric multi-country analysis | |
| JP2018092439A5 (cg-RX-API-DMAC7.html) | ||
| WO2018105341A1 (ja) | 予測システム及び予測方法 | |
| CN110826886A (zh) | 一种基于聚类算法和主成分分析的电力客户画像构建方法 | |
| US20190370673A1 (en) | Data prediction system, data prediction method, and data prediction apparatus | |
| JP2021512421A (ja) | 負荷形状分析に基づく、エネルギープログラム通信制御システムおよび方法 | |
| US20160321750A1 (en) | Commodity price forecasting | |
| KR20210085863A (ko) | 클라우드 시스템에서 원자재 그룹 구매 추천 장치 및 방법 | |
| WO2002027621A1 (en) | Genetic algorithm method for aggregating electricity consumption and optimizing electric buying groups | |
| CN115705578A (zh) | 投放区域确定方法、装置及存储介质 | |
| Kim et al. | Short-term electric load forecasting using data mining technique | |
| CN113743838A (zh) | 目标用户识别方法、装置、计算机设备和存储介质 | |
| CN118278886A (zh) | 基于便捷化数据处理的跨境服务贸易管理平台 | |
| WO2016185919A1 (ja) | エネルギー需要予測システム及びエネルギー需要予測方法 | |
| CN116029638A (zh) | 配送模式的确定方法、装置、电子设备及存储介质 | |
| Döhrn | Weather, the forgotten factor in business cycle analyses | |
| CN118917930B (zh) | 一种私域流量分销拓客SaaS系统及方法 | |
| JP2020095462A (ja) | 需要家選定システム、需要家の提示方法及びプログラム |
Legal Events
| Date | Code | Title | Description |
|---|---|---|---|
| 121 | Ep: the epo has been informed by wipo that ep was designated in this application |
Ref document number: 15759029 Country of ref document: EP Kind code of ref document: A1 |
|
| ENP | Entry into the national phase |
Ref document number: 2016506204 Country of ref document: JP Kind code of ref document: A |
|
| REEP | Request for entry into the european phase |
Ref document number: 2015759029 Country of ref document: EP |
|
| WWE | Wipo information: entry into national phase |
Ref document number: 15123746 Country of ref document: US Ref document number: 2015759029 Country of ref document: EP |
|
| NENP | Non-entry into the national phase |
Ref country code: DE |