WO2018105341A1 - 予測システム及び予測方法 - Google Patents
予測システム及び予測方法 Download PDFInfo
- Publication number
- WO2018105341A1 WO2018105341A1 PCT/JP2017/041168 JP2017041168W WO2018105341A1 WO 2018105341 A1 WO2018105341 A1 WO 2018105341A1 JP 2017041168 W JP2017041168 W JP 2017041168W WO 2018105341 A1 WO2018105341 A1 WO 2018105341A1
- Authority
- WO
- WIPO (PCT)
- Prior art keywords
- data
- curve
- prediction
- module
- value
- Prior art date
Links
Images


Classifications
-
- G—PHYSICS
- G06—COMPUTING; CALCULATING OR COUNTING
- G06Q—INFORMATION AND COMMUNICATION TECHNOLOGY [ICT] SPECIALLY ADAPTED FOR ADMINISTRATIVE, COMMERCIAL, FINANCIAL, MANAGERIAL OR SUPERVISORY PURPOSES; SYSTEMS OR METHODS SPECIALLY ADAPTED FOR ADMINISTRATIVE, COMMERCIAL, FINANCIAL, MANAGERIAL OR SUPERVISORY PURPOSES, NOT OTHERWISE PROVIDED FOR
- G06Q30/00—Commerce
- G06Q30/02—Marketing; Price estimation or determination; Fundraising
- G06Q30/0201—Market modelling; Market analysis; Collecting market data
- G06Q30/0202—Market predictions or forecasting for commercial activities
-
- G—PHYSICS
- G06—COMPUTING; CALCULATING OR COUNTING
- G06Q—INFORMATION AND COMMUNICATION TECHNOLOGY [ICT] SPECIALLY ADAPTED FOR ADMINISTRATIVE, COMMERCIAL, FINANCIAL, MANAGERIAL OR SUPERVISORY PURPOSES; SYSTEMS OR METHODS SPECIALLY ADAPTED FOR ADMINISTRATIVE, COMMERCIAL, FINANCIAL, MANAGERIAL OR SUPERVISORY PURPOSES, NOT OTHERWISE PROVIDED FOR
- G06Q10/00—Administration; Management
- G06Q10/04—Forecasting or optimisation specially adapted for administrative or management purposes, e.g. linear programming or "cutting stock problem"
-
- G—PHYSICS
- G06—COMPUTING; CALCULATING OR COUNTING
- G06Q—INFORMATION AND COMMUNICATION TECHNOLOGY [ICT] SPECIALLY ADAPTED FOR ADMINISTRATIVE, COMMERCIAL, FINANCIAL, MANAGERIAL OR SUPERVISORY PURPOSES; SYSTEMS OR METHODS SPECIALLY ADAPTED FOR ADMINISTRATIVE, COMMERCIAL, FINANCIAL, MANAGERIAL OR SUPERVISORY PURPOSES, NOT OTHERWISE PROVIDED FOR
- G06Q10/00—Administration; Management
- G06Q10/06—Resources, workflows, human or project management; Enterprise or organisation planning; Enterprise or organisation modelling
-
- G—PHYSICS
- G06—COMPUTING; CALCULATING OR COUNTING
- G06Q—INFORMATION AND COMMUNICATION TECHNOLOGY [ICT] SPECIALLY ADAPTED FOR ADMINISTRATIVE, COMMERCIAL, FINANCIAL, MANAGERIAL OR SUPERVISORY PURPOSES; SYSTEMS OR METHODS SPECIALLY ADAPTED FOR ADMINISTRATIVE, COMMERCIAL, FINANCIAL, MANAGERIAL OR SUPERVISORY PURPOSES, NOT OTHERWISE PROVIDED FOR
- G06Q50/00—Systems or methods specially adapted for specific business sectors, e.g. utilities or tourism
- G06Q50/06—Electricity, gas or water supply
-
- H—ELECTRICITY
- H02—GENERATION; CONVERSION OR DISTRIBUTION OF ELECTRIC POWER
- H02J—CIRCUIT ARRANGEMENTS OR SYSTEMS FOR SUPPLYING OR DISTRIBUTING ELECTRIC POWER; SYSTEMS FOR STORING ELECTRIC ENERGY
- H02J3/00—Circuit arrangements for ac mains or ac distribution networks
-
- H—ELECTRICITY
- H02—GENERATION; CONVERSION OR DISTRIBUTION OF ELECTRIC POWER
- H02J—CIRCUIT ARRANGEMENTS OR SYSTEMS FOR SUPPLYING OR DISTRIBUTING ELECTRIC POWER; SYSTEMS FOR STORING ELECTRIC ENERGY
- H02J3/00—Circuit arrangements for ac mains or ac distribution networks
- H02J3/003—Load forecast, e.g. methods or systems for forecasting future load demand
Definitions
- the present invention relates to a system and method for predicting a predetermined target such as the future supply and demand of power, for example, a prediction that predicts a future power demand and uses this for management of power supply and demand.
- the present invention relates to a system and a method thereof.
- an electric utility must supply electricity to a user based on an electricity supply contract.
- An electric power company can create a necessary amount of electricity by power generation by itself, but if the amount of electricity is likely to be insufficient, it procures electricity from other electric power companies in advance and supplies it to the user.
- the amount of electricity procured exceeds the amount of electricity sold, it will be a burden to the electricity supplier, and the electricity supplier will make sure that the amount of electricity procured and the amount of electricity sold match each other as much as possible at the settlement time.
- the amount of procurement is adjusted. Therefore, it is important to accurately predict the total power demand of the entire user.
- Patent Document 1 selects a power demand pattern according to the environmental conditions of the day on which power demand should be predicted, and obtains the maximum and minimum values of the power demand at the predicted temperature on the forecast date from the power demand data by temperature And the demand prediction model which calculates the electric power demand amount in each unit time of a prediction day using these is disclosed.
- Patent Document 1 Even if the power demand is predicted, an error occurs with respect to the actual power demand.
- Patent Document 1 a power demand pattern corresponding to the environmental condition of the day on which the power demand is to be predicted is selected. In this way, the error was reduced.
- Patent Document 1 is insufficient to eliminate the error in the predicted value of power demand.
- an object of the present invention is to provide a prediction system and a method thereof that can reduce the error of the predicted value as much as possible compared to the conventional one.
- a prediction system that calculates a prediction value related to a prediction target for a prediction target that adapts prediction in an arbitrary period, and is used to calculate a prediction value.
- the control device calculates a prediction value related to the prediction target, and the control device calculates a prediction value.
- a plurality of data used for the storage is read from the storage device, a predetermined calculation model is applied to the plurality of data, a predicted value is calculated, and the calculation model is changed based on time attribute information of each of the plurality of data. I made it.
- FIG. 1 shows a hardware block diagram of the supply / demand management system.
- the supply and demand management system 1 accurately predicts values such as the amount of power demand in the future for a predetermined period based on the past amount of power demand, thereby creating and adjusting the operation plan of the generator, etc. This makes it possible to manage the supply and demand of electric power, such as the formulation and adjustment of electric power procurement transaction plans from electric utilities.
- the supply and demand management system 1 includes a system operator system module 7, a transaction market operator system module 8, a public information provider system module 9, and a customer system module 10, each of which is mainly a terminal device such as a computer, Are connected to each other so that they can communicate with each other.
- the electric power company system module 2 includes a supply and demand manager system module 3, a sales manager system module 4, a transaction manager system module 5, and a facility manager system module 6.
- the demand-and-supply manager system module 3 predicts a demand amount in a predetermined period in the future for every calculation time unit of, for example, 30 minutes based on a sales plan held by the demand-supply manager or a future sales plan.
- the sales manager system module 4 is used by a department or a person in charge who develops a long-term or short-term electricity sales plan, concludes a new electric supply contract with a customer, and manages an existing electric supply contract.
- the system includes a sales management device 40 that manages information on consumers who have concluded a planned sales plan and an electricity supply contract.
- the transaction manager system module 5 is a system used by a department or a person in charge who plans and executes a transaction for procurement of electricity through a direct contract with another electric power company or through an exchange. Yes, it includes a transaction management device 50 for managing information on electricity procurement transaction plans and contracted electricity procurement contracts and exchanging telegrams relating to transactions with other electric utilities and exchanges.
- the facility manager system module 6 is a system used by a department or a person in charge for planning and executing an operation plan for a power generation facility owned by the company or a power generation facility not owned by the company that can be incorporated into the company's own electricity procurement plan.
- a control device 61 for receiving a control signal from the equipment management device 60 and the equipment management device 60 and actually executing control of the power generation equipment.
- the facility management device 60 performs management of power generation facility information, planning of an operation plan of the power generation facility, and transmission of control signals for execution of the operation plan.
- the grid operator system module 7 is a system used by a business operator that manages transmission / distribution system facilities across a wide area and stores measured values obtained by measuring the actual demand of each local customer.
- the system information management apparatus 70 for delivering a demand actual value of a consumer is provided.
- the transaction market operator system module 8 is a system used by a business operator that comprehensively manages information and procedures necessary for conducting a power transaction with respect to a plurality of power business operators. And a market operation management device 80 for performing the process of adding orders received from each electric power company.
- the public information provider system module 9 is a system used by a provider that provides past observation information and future forecast information related to weather such as temperature, humidity, and solar radiation, and distributes weather observation information and forecast information.
- a public information distribution device 90 is provided.
- the customer system module 10 is a system used by individuals or corporations having load facilities and power generation facilities.
- the customer system module 10 includes, in the electric utility system module 2 or the grid operator system module 7, owned equipment, owned facilities, business type, presence, etc. It includes an information input / output terminal 101 for transmitting information that may affect demands such as the number of people, location, etc. and power generation trends, and a measuring device 100 for measuring the actual amount of demand and power generation.
- the supply and demand management system 1 is equipped with a prediction function for predicting the power demand.
- FIG. 2 shows a prediction system 12 according to the present embodiment that constitutes a part of the supply and demand management system 1.
- the prediction system 12 of the present embodiment is a system that predicts power demand, is equipped with a prediction function, and includes a prediction calculation device 30 and a sales management device 40.
- the prediction computation device 30 increases or decreases the demand value over time in an arbitrary future period set in advance based on the attribute performance information 311 and the attribute prediction information 312 and the demand performance information 406 held by the sales management device 40.
- the data indicating the characteristics of the change (hereinafter referred to as a curve indicating a time transition) is calculated, the predicted value is calculated by correcting the calculated curve, and the predicted value is held in the prediction result information 313.
- the prediction result information 313 includes at least information on the predicted value calculated by correcting the curve indicating the time transition of the demand value in the calculated future period and the curve. Then, the prediction calculation device 30 transmits the prediction result information 313 calculated in this way to the facility management device 60 and the transaction management device 50.
- the sales management device 40 holds demand record information 406 and sales contract forecast information 407.
- the demand record information 406 is information composed of the past demand record information 406 of the contracted consumer and the contract target consumer acquired from the measuring device 100 and the grid information management device 70, for example, The actual value of the power demand every 30 minutes in the past several years of each customer system module 10 is included.
- the sales contract forecast information 407 is information created by the sales management device 40 or the sales manager system module 4.
- the sales contract forecast information 407 includes information on existing contracts in units of days, weeks, months, or years over an arbitrary period in the past and future. It includes information on supply start, supply end date and contract power capacity of each customer system module 10 or each customer system module 10 scheduled to be contracted.
- the predictive arithmetic device 30 is composed of an information processing device such as a personal computer, a server computer, or a handheld computer, for example, and a CPU (Central Processing Unit) 301 that is a control device that comprehensively controls the operation of the predictive arithmetic device 30, an input device 302, an output device 303, a communication device 304, and a storage device 305.
- a CPU Central Processing Unit
- the input device 302 is composed of a keyboard, a mouse, or a combination thereof
- the output device 303 is composed of a display, a printer, or a combination thereof.
- the communication device 304 includes a NIC (Network Interface Card) for connecting to a wireless LAN or a wired LAN.
- the storage device 305 includes a RAM (Random Access Memory) and a ROM (Read Only Memory) storage medium.
- the storage device 305 stores various computer programs such as a timeliness index value setting module 306, a reliability index value setting module 307, a representative curve calculation module 308, a correction value calculation module 309, and a representative curve correction module 310.
- the reliability index value setting module 307 evaluates the reliability of various estimation data calculated in the middle of the process in the prediction arithmetic unit 30 such as the fluctuation range of the estimation result, and the reliability corresponding to each of the various estimation data. It is a program having a function of calculating an index value indicating sex.
- the representative curve calculation module 308 calculates a curve indicating the time transition of the prediction target in the future period to be set as the prediction target by using the attribute result information 311, the demand record information 406, the sales contract prediction information 407, or a combination thereof. It is a program having a function to perform.
- the correction value calculation module 309 is calculated by the representative curve calculation module 308 based on the sample data used for prediction of the attribute performance information 311 and the demand performance information 406 and the index value indicating the timeliness calculated by the timelinessiness index value setting module 306. This is a program having a function of calculating a correction value (hereinafter referred to as correction data) for changing the amplitude or frequency of the curve.
- the representative curve correction module 310 uses the correction data calculated by the correction value calculation module 309 and the representative curve calculation module 308 based on the index values indicating the reliability of the correction data calculated by the reliability index value setting module 307. It is a program having a function of changing the amplitude or frequency of the calculated curve.
- the storage device 305 stores a database of attribute result information 311, attribute forecast information 312, and prediction result information 313.
- the attribute result information 311 is a database in which past measurement data of attribute information that can explain the shape of the curve indicating the time transition of the power demand to be predicted and the increase / decrease in the demand scale is stored.
- the attribute result information 311 includes calendar date information, weather information, information indicating the occurrence of a typhoon and a sudden occurrence of an event, or information on industrial dynamics information indicating the actual conditions of various industries that may affect power demand.
- the history information is day type information indicating year, month, day of the week, weekday, holiday, or a combination thereof
- the weather information is temperature, humidity, amount of solar radiation, sunshine duration, atmospheric pressure, wind speed, or a combination thereof.
- the attribute forecast information 312 is a database that stores forecast data in a preset future period for each of the various attribute information stored in the attribute performance information 311.
- the prediction result information 313 is a database in which the final prediction result calculated by the prediction calculation device 30 or intermediate data in the calculation process is stored, and the prediction result data of the prediction target in the preset future period, the prediction target during the same period Curve data representing the time transition of the curve, correction data for correcting the curve, or information of an operation model (hereinafter referred to as a model) which is an operation expression used for calculating these data.
- a model an operation model
- the sales management device 40 is configured by an information processing device such as a personal computer, a server computer, or a handheld computer, for example, and a CPU 401, an input device 402, an output device 403, and a communication device that collectively control the operation of the sales management device 40. 404 and a storage device 405.
- an information processing device such as a personal computer, a server computer, or a handheld computer, for example, and a CPU 401, an input device 402, an output device 403, and a communication device that collectively control the operation of the sales management device 40. 404 and a storage device 405.
- the input device 402 is composed of a keyboard, a mouse, or a combination thereof, and the output device 403 is composed of a display or a printer.
- the communication device 404 includes a NIC for connecting to a wireless LAN or a wired LAN.
- the storage device 405 is composed of RAM and ROM storage media, and stores a database of demand record information 406 and sales contract forecast information 407.
- the demand result information 406 is a database in which information received and acquired from the measuring device 100 and the system information management device 70 is stored, and the past demand of the customer system module 10 that has already been contracted or the customer system module 10 that is scheduled to be contracted. Various information including the result information is stored.
- the granularity of the performance information is, for example, a unit of 30 minutes, and the period is several days to several years.
- the sales contract forecast information 407 is a database that stores information on the schedule and results of the sales plan of electricity created by the sales manager system module 4, and includes days, weeks, months, or years over an arbitrary period in the past and future. It includes information such as the supply start date, supply end date and time, and contract power capacity of each customer system module 10 already contracted or each customer system module 10 scheduled to be contracted.
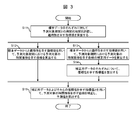
- FIG. 3 shows a processing procedure of prediction processing in the prediction system 12. This process is a process that starts when the prediction arithmetic device 30 accepts an input operation from the supply and demand manager system module 3 and a preset time interval or time, and is executed by the prediction arithmetic device 30 from step S11. The process of step S15 is executed.
- processing is executed based on various computer programs stored in the CPU 301 and the storage device 305 of the prediction arithmetic device 30.
- the processing main body will be described as various computer programs included in the prediction calculation device 30.
- the timeliness index value setting module 306 extracts a sample data set used for prediction from the demand record information 406 and the attribute record information 311. For each sample data in the sample data set, timeliness, which is a measure of the degree of temporal correlation with the prediction target period, is evaluated, and an index value indicating timeliness is calculated (S11).
- the evaluation of temporal correlation between each sample data in the sample data set and the prediction target period is, for example, evaluation of the sample data closer in time to the prediction target period as a strong correlation.
- the index value indicating the timeliness calculated based on this evaluation is calculated as a function of time, for example, as the reciprocal of the number of days from the prediction target period or the elapsed interval. In this case, the larger the index value, the stronger the correlation with the prediction target period.
- the evaluation of the temporal correlation between each sample data in the sample data set and the prediction target period may be an evaluation based on the temporal periodic fluctuation tendency of the prediction target. For example, if the forecast target has a seasonal periodic fluctuation trend, the previous year sample data of the same season as the forecast period is evaluated as a strong correlation, and the index value indicating timeliness is obtained using a trigonometric function on the time axis. Calculated.
- the sample data of the same day as the prediction target period is evaluated as a strong correlation, and the index value indicating the timeliness is the sample data of the same day of the prediction target period as “ Sample data for other days of the week is set to “0”.
- the representative curve calculation module 308 calculates a curve indicating the time transition of the prediction target value using the demand record information 406, the attribute record information 311 and the attribute forecast information 312 (S12).
- the index value indicating the timeliness calculated by the timelinessiness index value setting module 306 is used. Specifically, each sample data is multiplied by an index value indicating timeliness as a weighting factor, and then a curve is calculated. As a result, a curve that gives more importance to sample data having a strong temporal correlation with the prediction target period can be calculated, and a curve closer to the shape of the curve predicted to be observed in the prediction target period can be calculated.
- the correction value calculation module 309 calculates correction data for correcting the curve calculated by the representative curve calculation module 308 using the demand record information 406, the attribute record information 311, and the attribute forecast information 312 ( S13).
- the curve correction specifically means a change in amplitude that is a scale correction on the quantity axis of the curve or a change in frequency that is a scale correction on the time axis of the curve. Therefore, the correction data is a predicted value of a prediction target at an arbitrary time within the prediction target period, a predicted value of a maximum value or a minimum value, or a predicted value of an integrated value in an arbitrary period within the prediction target period.
- an index value indicating the timeliness calculated by the timelinessiness index value setting module 306 is used. Specifically, each sample data is multiplied by an index value indicating timeliness as a weighting factor, and then the prediction value of the prediction target at any time within the prediction target period as the correction data, the prediction target period The predicted value of the maximum value or the minimum value or the predicted value of the integrated value in any given period is calculated.
- the reliability index value setting module 307 calculates the correction data, the predicted value of the prediction target at an arbitrary time within the prediction target period, and the predicted value of the maximum value or the minimum value of the arbitrary period within the prediction target period.
- an index value indicating the reliability is calculated (S14).
- the index value indicating the reliability is, for example, a confidence interval or a prediction interval of each correction data.
- the representative curve correction module 310 uses the curve indicating the time transition of the prediction target in the prediction target period calculated by the representative curve calculation module 308 and the correction data of the curve calculated by the correction value calculation module 309 to use the curve amplitude. The frequency or both are changed, and the correction result is stored in the prediction result information 313 as a prediction value (S15).
- an index value indicating the reliability for each correction data calculated by the reliability index value setting module 307 is used. Specifically, the correction value of the curve is controlled by using an index value indicating reliability as a weighting coefficient at the time of correction.
- FIG. 4 shows a first embodiment of the representative curve calculation module 308 in the prediction system 12.
- the representative curve calculation module 308 includes a time unit clustering module 308A1 and a time unit profiling processing module 308A2.
- the representative curve calculation module 308 in the present embodiment uses the demand record information 406, the attribute record information 311 and the attribute forecast information 312 as input value samples, which are demand value data, as a prediction target in a future period set as a preset prediction target.
- a curve 308B indicating the time transition of is calculated.
- the time unit clustering module 308A1 classifies the sample data extracted from the demand record information 406 based on the feature quantity indicating the periodic variation of the prediction target.
- the time unit clustering module 308A1 divides the sample data extracted from the demand performance information 406 at a preset time granularity, and sets a new second sample value (hereinafter referred to as second sample data) (first sample data). 2 sample data sets).
- a feature amount indicating a periodic feature is calculated by using frequency analysis of Fourier transform or wavelet transform for each of the divided sample data. Then, clustering processing is performed on the calculated feature amount, and for example, sample data having similar waveform shapes in units of 24 hours are classified as clusters (hereinafter referred to as time clusters).
- a known method may be applied to the algorithm used for the clustering process using such a cluster.
- Known techniques include k-means, EM algorithm, and spectral clustering, which are unsupervised clustering algorithms for neighborhood optimization.
- unsupervised SVM Small Vector Vector
- VQ algorithm VQ algorithm
- SOM Self-Organizing Map
- each sample data is normalized such that the average is 0 and the standard deviation is 1, for example.
- the standard deviation is 1, for example.
- Time unit profiling module 308A2 specifies a common attribute and calculates a value range for each time cluster calculated by the time unit clustering module 308A1. By doing so, a discriminator for identifying each time cluster is identified.
- a supervised learning algorithm using a sample data set in which each of the attribute information stored in the teacher label and the attribute performance information 311 is a predictor is used as a number and a name identifier for identifying each time cluster. Identify the discriminator that is most compatible with the sample data set.
- the indices for measuring the adaptability are index values indicating the degree of identification of the sample data set such as entropy and Gini coefficient, and test errors at the time of cross-validation performed in the process of classifier identification.
- the discriminator is one of the elements constituting the calculation model for calculating the curve indicating the temporal transition of the prediction target.
- an index value indicating the timeliness for each sample data calculated by the timelinessiness index value setting module 306 is used as a weighting coefficient.
- a discriminator reflecting a change (hereinafter referred to as a secular change) every time a year to be predicted is reflected can be calculated.
- the structure of the discriminator which is a model for calculating a curve indicating the temporal transition of the prediction target, can be changed according to the index value indicating timeliness.
- the time cluster predicted to belong to the curve indicating the time transition of the prediction target in the prediction target period is identified.
- a method of calculating a curve indicating a temporal transition of a prediction target from an identified time cluster is a method of calculating as an arithmetic average of sample data groups belonging to the identified time cluster, for example.
- the weighted average is calculated using the all-time cluster affiliation probability calculated from the classifier as a weighting coefficient. Note that the processing part in which the curve indicating the time transition of the prediction target is calculated from the identified time cluster is one of the other elements constituting the calculation model for calculating the curve indicating the time transition of the prediction target.
- a known method may be applied to the classifier calculation algorithm.
- Known techniques include CART, ID3, random forest decision tree learning algorithm and SVM (Support Vector Vector Machine) discrimination plane learning algorithm.
- Timeliness index value setting module 306 is a measure of the degree of temporal correlation between each sample data in the sample data set and the prediction target period for each sample data in the sample data set. Is evaluated, and an index value indicating timeliness is calculated.
- a sample data set used for prediction is extracted from the demand record information 406 and the attribute record information 311.
- timeliness which is a measure of the degree of temporal correlation with the prediction target period, is evaluated, and an index value indicating timeliness is calculated.
- the index value indicating timeliness calculated based on this evaluation is calculated as a function of time, and may be calculated as, for example, the number of days from the prediction target period or the reciprocal of the elapsed interval. In this case, the larger the index value, the stronger the correlation with the prediction target period.
- the evaluation of the temporal correlation with the prediction target period may be an evaluation based on the temporal periodic fluctuation tendency of the prediction target. For example, if the forecast target has a seasonal periodic fluctuation trend, the sample data of the previous year in the same period as the forecast period is evaluated as a strong correlation, and the index value indicating timeliness is obtained using a trigonometric function on the time axis. Calculated.
- the sample data of the same day as the forecast target period is evaluated as a strong correlation, and the index value indicating the timeliness is that the sample data of the same day of the forecast target period is “ Sample data for other days of the week are set to “0”.
- the index value indicating the timeliness calculated by the timelinessiness index value setting module 306 is used as a weighting factor in the discriminator calculation process in the time unit profiling processing module 308A2, as described above. In addition to this, it is also used in the calculation in the correction value calculation module 309. In both cases, the effect obtained is the same, and it is possible to perform learning processing with emphasis on sample data that has a strong temporal correlation with the prediction target period, so the calculated data shows the secular change of the prediction target. More accurate data reflected.
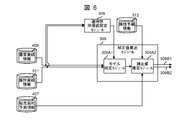
- FIG. 6 shows a first embodiment of the correction value calculation module 309 in the prediction system 12.
- the correction value calculation module 309 includes a model identification module 309A1 and a correction value estimation module 309A2.
- the correction value calculation module 309 in the present embodiment calculates correction data for correcting the curve calculated by the representative curve calculation module 308, using the demand record information 406, the attribute record information 311, and the attribute forecast information 312. .
- the curve correction specifically means a change in amplitude that is a scale correction on the quantity axis of the curve or a change in frequency that is a scale correction on the time axis of the curve. Therefore, the correction data is a predicted value of a prediction target at an arbitrary time within the prediction target period, a predicted value of a maximum value or a minimum value, or a predicted value of an integrated value in an arbitrary period within the prediction target period. These predicted values are used as correction reference points.
- model identification module 309A1 uses the demand record information 406 and the attribute record information 311, and the prediction value of the prediction target at an arbitrary time within the prediction target period, which is correction data, A model to be used for calculation of calculation of a predicted value of a maximum value or a minimum value or a predicted value of an integrated value in an arbitrary period within a prediction target period is identified.
- the prediction value of the prediction target at an arbitrary time within the prediction target period which is the correction data, the maximum or minimum predicted value or the predicted value of the integrated value at an arbitrary period within the prediction target period,
- the explanatory variable is x, it is assumed that the following relationship holds between y and x.
- x1 and x2 are, for example, the average temperature and the actual value of y on the previous day, and specific numerical values are stored in the attribute actual information 311.
- the model identification module identifies the operation model by estimating the coefficients a, b, c, and d described in the equation (1) so that the compatibility between x and y is the highest.
- the coefficient is estimated by, for example, the least square method.
- the index for measuring the adaptability is the residual sum of squares of the identified model and sample data. The highest adaptability means that the residual sum of squares is the smallest.
- an index value indicating the timeliness for each sample data calculated by the timelinessiness index value setting module 306 is used.
- coefficients a, b, c, and d are estimated by a weighted least square method using an index value indicating timeliness as a weight coefficient, and calculated as a model identification result used for calculation of correction data. Is done. Thereby, more accurate correction data reflecting the secular change of y can be calculated.
- the correction value estimation module 309A2 is an explanatory variable x stored in the attribute forecast information 312 in a model used for calculation of correction data calculated by the model identification module 309A1. Is input as the correction data, the correction value of the curve indicating the time transition in the prediction target period is calculated.
- the correction data includes at least two types of information: information on the correction value itself (correction data 309B1) and information on the time range of each correction value (correction data 309B2).
- the information regarding the time range of each correction value is a time range in which each value appears when, for example, the maximum value or the minimum value in an arbitrary period within the prediction target period is used as the correction data.
- the correction value estimation module 309A2 calculates the sample error data at the time of calculation of the least square method as a part of the correction data.
- This data is data used when the reliability index value setting module 307 calculates an index value indicating reliability. Further, this data is the result of the least squares calculation performed to identify the model used for calculation of correction data calculated by the model identification module 309A1 or the model used by the model identification module 309A1 for calculation of correction data. It is data of.
- the correction data 309B1 calculated by the correction value estimation module 309A2 is once divided by the current total contract power capacity to calculate the basic unit correction value per contract power capacity.
- the basic unit correction value is multiplied by the total contract power capacity in the prediction target period, and correction data 309B1 is newly calculated. Thereby, even when the number of contract customers increases or decreases, more accurate curve correction data can be calculated.
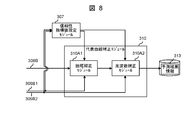
- FIG. 8 shows a first embodiment of the representative curve correction module 310 in the prediction system 12.
- the representative curve correction module 310 includes an amplitude correction module 310A1 and a frequency correction module 310A2.
- the representative curve correction module 310 in the present embodiment changes the amplitude or frequency of the curve calculated by the representative curve calculation module 308 using the correction data calculated by the correction value calculation module 309. At this time, an index value indicating the reliability of each correction data calculated by the reliability index value setting module 307 is used, whereby a more accurate predicted value is calculated.
- the amplitude correction module 310A1 uses the correction data 309B1 calculated by the correction value calculation module 309 to calculate the prediction target time in the prediction target period calculated by the representative curve calculation module 308.
- the amplitude of the curve 308B indicating the transition is changed.
- the corrected curve f ⁇ (t) is given by the following equation.
- f (t) is a curve indicating the time transition of the prediction target in the prediction target period, and is a function of time t.
- ⁇ and ⁇ are change coefficients of the curve f (t).
- the amplitude correction module 310A1 predicts the prediction value of the prediction target at any time within the prediction target period, which is the correction data 309B1, the prediction value of the maximum value or the minimum value or the integrated value at any time within the prediction target period. Processing for estimating the change coefficients ⁇ and ⁇ is performed so that the residual sum of squares of each value and the corrected curve f ⁇ (t) is minimized.
- an index value indicating the reliability for each correction data calculated by the reliability index value setting module 307 is used. Specifically, the index value indicating the quantitative reliability for each correction data is multiplied as a weighting coefficient for each correction data value and the residual of the curve f ⁇ (t), and then changed. The coefficients ⁇ and ⁇ are estimated.
- a curve is given with priority given to reducing the residual between the correction data calculated by the reliability index value setting module 307 and the correction data value having higher reliability than the correction data having low reliability.
- f (t) is corrected, which improves the final prediction accuracy.
- the frequency correction module 310A2 uses the correction data 309B2 calculated by the correction value calculation module 309, and the time transition of the prediction target in the prediction target period calculated by the representative curve calculation module 308 The frequency of the curve 308B showing is changed.
- the correction data is a predicted value of the maximum value or the minimum value in an arbitrary period within the prediction target period
- the average value or mode value of each appearance time range stored in the correction data 309B2 and
- the frequency of the curve f (t) is changed so that the time of the corrected curve f ⁇ (t) coincides with the time or the residual sum of squares is minimized.
- the corrected curve f ⁇ (t) is calculated as the prediction value of the prediction target in the prediction target period and stored in the prediction result information 313.
- an index value indicating the reliability for each correction data calculated by the reliability index value setting module 307 is used. Specifically, an index value indicating temporal reliability for each correction data is multiplied as a weighting factor for the residual between each correction data value and the curve f ⁇ (t), and then corrected. Processing is performed. Accordingly, a curve is given with priority given to reducing the residual between the correction data calculated by the reliability index value setting module 307 and the correction data value having higher reliability than the correction data having low reliability. f (t) is corrected, and the final prediction accuracy is improved at this point.
- the reliability index value setting module 307 is a prediction value of the prediction target at an arbitrary time within the prediction target period, which is the calculated correction data, and an arbitrary value within the prediction target period. For each of the predicted value of the maximum value, the minimum value, or the predicted value of the integrated value in this period, two types of reliability, quantitative and temporal, are evaluated, and an index value indicating the reliability is calculated.
- each correction is performed from the model error data included in the correction data 309B1 calculated by the correction value estimation module 309A2 or the sample error data calculated in the process of model identification.
- the confidence interval and prediction interval of the estimated value of the data for use, the variance of the sample error, and the standard deviation are calculated and calculated as an index value indicating quantitative reliability.
- the confidence interval or the prediction interval on the time axis of each correction data or The variance and standard deviation of the information in the time range are calculated and calculated as an index value indicating temporal reliability.
- the representative curve correction module 310 uses the index values indicating the reliability, the prediction accuracy of the finally calculated prediction value can be improved.
- the operation plan of the power generation facility that can be operated by the facility management device 60 is calculated and transmitted to the control device 61.
- the control device 61 that has received the operation plan calculates a specific control value of the power generation facility and executes actual control.
- the transaction management device 50 creates a transaction plan related to the buying and selling of electric power with other electric power companies and the transaction market, and transmits a trade order or an order cancellation message to the market operation management device 80.
- the timeliness index value setting module 306 calculates the calculation result of the curve indicating the time transition of the prediction target in the prediction target period output from the representative curve calculation module 308. It differs depending on whether or not an index value indicating the timeliness of each sample data to be used is used.
- the graph 501 in FIG. 11 shows the transition of the average temperature for each day in a certain year.
- the two time clusters shown in the graph 502 and the graph 503 in FIG. 11 are candidate time clusters to be identified.
- the curve indicating the time transition of the prediction target has changed from the curve shown in the graph 502 to the curve shown in the graph 503 after one year.
- the index value indicating the timeliness of each sample data is not used in the above-described classifier calculation process.
- the time clusters in the graph 502 and the graph 503 in FIG. 11 are identified with almost the same probability. Therefore, the curve indicating the time transition of the prediction target in the prediction target period is calculated as an average curve of both time clusters as shown in the graph 504 in FIG. 11, and the secular change of the curve cannot be captured.
- the index value indicating the timeliness of each sample data is also used in the correction value calculation module 309, and the effect and principle are the same as those described above.
- FIG. 12 also shows a correction that is a final prediction result calculated by the representative curve correction module 310 when an index value indicating the reliability of the curve correction data calculated by the reliability index value setting module 307 is used. The effect on the later curve is shown.
- the index value indicating the reliability of the curve correction data calculated by the reliability index value setting module 307 includes an index value indicating at least two types of reliability, that is, quantitative reliability and temporal reliability. To do.
- the graph 601 in FIG. 12 conceptually shows quantitative reliability.
- the minimum value in the early morning, the maximum value after noon, and the maximum value around the evening are used as the correction data for the curve.
- the index values indicating the respective reliability are defined as variances on the probability density functions shown in the graphs 602, 603, and 604 of FIG.
- the index value is expressed by binary values of high and low.
- the reliability of the minimum value in the early morning and the maximum value around the evening is high, and the reliability of the maximum value after noon is low. Therefore, the change in the amplitude of the curve, as shown in the graph 609 of FIG. 12, allows the residual on the quantity axis of the curve and the maximum value after noon to expand, and then increases the minimum value of the curve and the early morning. Correction is performed so as to minimize the residual on the quantity axis and the residual on the quantity axis of the curve and the maximum value before and after evening.
- the graph 605 in FIG. 12 conceptually shows temporal reliability.
- the minimum value in the early morning, the maximum value after noon, and the maximum value in the evening are used as the correction data for the curve.
- the index values indicating the respective reliability are defined as ranges of past observed values shown in the graph 606, the graph 607, and the graph 608 of FIG.
- the index value is expressed by binary values of high and low.
- the reliability of the minimum value in the early morning and the maximum value after noon is high, and the reliability of the maximum value in the evening is low. Therefore, the change in the amplitude of the curve allows the residual of the curve and the maximum value before and after evening to expand on the time axis as shown in the graph 610 of FIG. Correction is performed so as to minimize the residual on the time axis and the residual on the time axis of the curve and the maximum value after noon.
- the corrected curve that is the final predicted value can be made more likely.
- the prediction target data stored in the demand record information 406 is one data measured by one measuring instrument or a plurality of measuring instruments.
- the present invention is not limited to this.
- prediction target data is installed for each power consumer. Further, more accurate prediction may be realized as each measurement data of the measuring device.
- the representative curve calculation module 308 further includes a metric unit clustering module 308A3.
- the weighing unit clustering module 308A3 extracts the data for each measuring instrument stored in the demand record information 406 as, for example, the same period for the past 365 days, and uses the meter data for each consumer as input sample data.
- measuring instrument clusters For example, sample data having similar waveform shapes in units of 365 days (8760 hours) are classified as clusters (hereinafter referred to as measuring instrument clusters).
- the time clustering process and the time unit profiling process similar to those of the first embodiment of the representative curve calculation module 308 described above are performed on the representative waveform of each measuring instrument cluster.
- the calculation method of the representative waveform of each measuring instrument cluster is, for example, the arithmetic average of each measuring instrument cluster.
- the sample variance in the sample data can be reduced, and the prediction target calculated by the subsequent processing
- the accuracy of the curve indicating the time transition of the prediction target in the period can be improved.
- a curve indicating the temporal transition of the prediction target in the prediction target period is represented by the prediction target period. Curve so that the predicted value of the prediction target at any time in the range, the maximum value, the minimum value, or the predicted value of the integrated value in any period within the prediction target period is the same or the sum of the respective residuals is minimized.
- the present invention is not limited to this.
- the change coefficients ⁇ and ⁇ shown in equation (2) are handled as correction data, and the change coefficients are directly used as correction data. You may make it handle.
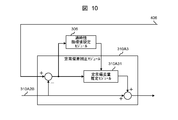
- the correction value calculation module 309 further includes a correction coefficient calculation module 309A3 as shown in FIG. 7, and directly predicts the correction coefficient of the curve.
- the correction coefficient calculation module 309A3 calculates sample data of the change coefficients ⁇ and ⁇ using the sample data extracted from the demand record information 406.
- the model identification module 309A1 identifies a model used for calculation of the change coefficients ⁇ and ⁇ , and the explanatory variable value extracted from the attribute forecast information 312 to the identified model.
- the correction value estimation module 309A2 input by the correction value estimation module 309A2, and the change coefficients ⁇ and ⁇ of the curve indicating the time transition of the prediction target in the prediction target period are calculated.
- the index value indicating the timeliness calculated by the timelinessiness index value setting module 306 is used as described with reference to FIG. .
- the present invention is not limited to this, and, for example, arbitrary calculation forms and explanatory variables to be used are used.
- the explanatory variable may be, for example, a square value of the average temperature, and may be used as a planning matrix including these variables.
- a non-linear relationship existing between the prediction target and the attribute can be expressed as a model.
- the third sample value is calculated from the second sample value in the same manner as the second sample value is calculated from the sample value.
- the case where the attribute used as the explanatory variable is set uniquely in advance has been described.
- a method in which explanatory variables are automatically selected such as an elastic net, may be employed.
- a method of calculating a new component from explanatory variables of principal component regression or partial least squares may be employed, or a method of using a nonlinear model of a neural network may be employed.
- the index value indicating the timeliness calculated by the timelinessiness index value setting module 306 may be used at the time of model identification, and thereby the same effect as described with reference to FIG. As well as an explanatory variable corresponding to timeliness can be automatically selected. In other words, this can change the model used for the calculation of the correction data.
- the prediction value of the prediction target at any time within the prediction target period which is correction data, the maximum value in any period within the prediction target period
- the present invention is not limited to this, for example, reliability index value setting It may be automatically set based on an index value indicating the reliability calculated by the module 307.
- the reliability index values for the respective correction data may be compared, and the correction data up to a preset order in descending order of reliability may be used in the subsequent representative curve correction module 310.
- standardize the index value indicating the reliability of each correction data so that the index value indicating the highest reliability is “1” and the index value indicating the lowest reliability is “0”. These correction data may be used in the representative curve correction module 310 thereafter.
- the correction data whose index value is “0” is not used for the curve correction as a result, and therefore automatic selection of the correction data is achieved. Further, correction may be made based on an extreme difference between the index values indicating the reliability with the power of the index value of each correction data as a new index value. In this case, since the smallest index value is relatively equal to “0” with respect to the largest index value, as in the case where the above-described index value is “0”, as a result, the smallest index value is used for curve correction. The value is not practically used, so automatic selection of correction data is achieved.
- the corrected curve calculated through the amplitude correction module 310A1 and the frequency correction module 310A2 is output as the final predicted value.
- the correction module 310A3 corrects the above-described steady deviation by using the corrected curve and the demand record information 406 observed later, and stores it in the prediction result information 313 as a final predicted value.
- the representative curve correction module 310 corrects errors that occur constantly in advance.
- the representative curve correction module 310 further includes a steady deviation correction module 310A3.
- the steady deviation correction module 310A3 calculates a deviation which is a difference between the corrected curve 310A2B and the demand record information 406 observed afterwards.
- the steady deviation amount estimation module 310A31 identifies a model that explains the residual, and calculates an estimated value of the residual that can occur in the prediction target period by the identified model.
- the final estimated value is calculated by adding the estimated value of the calculated residual to the corrected curve 310A2B.
- the algorithm used in the steady deviation estimation module 310A31 may be, for example, the algorithm of the representative curve calculation module 308 described with reference to FIG. That is, the input actual demand information 406 is replaced with a deviation which is a difference between the corrected curve 310A2B and the actual demand information 406 observed afterwards.
- This algorithm calculates a residual curve that may occur in the prediction target period through the same processing as the time unit clustering processing module 308A1 and the time unit profiling processing module 308A2.
- the output residual curve becomes the estimated residual itself including quantity information.
- a residual curve that may occur in the prediction target period may be calculated using a time series analysis technique represented by an AR model or an ARIMA model.
- the steady-state deviation correction module 310A3 can correct minute fluctuations in the prediction target that cannot be explained in the prediction system.
- an index value indicating the timeliness calculated by the timelinessiness index value setting module 306 may be used when the model is identified by the steady deviation amount estimation module 310A31.
- the input to the timeliness index value setting module 306 here is the above residual.
- the index values indicating timeliness and reliability are calculated by the timeliness index value setting module 306 and the reliability index value setting module 307, respectively.
- the present invention is not limited to this, and for example, preset values may be directly used for each of the index values of timeliness and reliability.
- the time-series data observed with time transition includes, for example, the amount of power generated by solar power generation and wind power generation, the contract price of electric power products sold and sold at the power exchange, and the volume.
Abstract
任意期間における予測を適応する予測対象について、当該予測対象に関連する予測値を算出する予測システムであって、予測値を算出するために利用される複数のデータを記録する記憶装置と、所定の演算モデルを備え、当該演算モデルに複数のデータを適用して予測値を算出する制御装置とを備え、制御装置は、複数のデータそれぞれの時間属性の情報に基づいて、演算モデルを変更するようにした。
Description
本発明は、電力の将来の需給など、所定の対象についての予測を行うシステム及びその方法に係り、例えば、将来の電力需要を予測し、これを、電力の需給の管理に役立てるようにした予測システム及びその方法に関するものである。
従来この種のシステムが、電力事業分野において実施されている。例えば、電気事業者は、電気供給契約に基づいて、ユーザに電気を供給しなければならない。電気事業者は、必要な電気量を自ら発電によって創出することができるものの、電気量が不足しそうな場合には、他の電気事業者から電気を事前に調達してユーザに供給する。
電力の調達量が電気の販売量を越えると、電気事業者には負担になるために、電気事業者は、電気の調達量と販売量とが清算時間ごとで極力一致するように、電気の調達量を調整するようにしている。その為に、ユーザ全体の総電力需要を的確に予測することが重要である。
特許文献1には、電力需要を予測すべき日の環境条件に応じた電力需要パターンを選択し、気温別電力需要量データから予測日の予想気温における電力需要量の最大値及び最小値を取得し、これらを用いて、予測日の各単位時間における電力需要量を算出する需要予測モデルが開示されている。
電力需要量を予測しても、実際の電力需要量に対して、誤差が発生するために、特許文献1では、電力需要量を予測すべき日の環境条件に応じた電力需要パターンを選択するようにして、誤差を少なくするようにしていた。
しかしながら、特許文献1の発明は、電力需要量の予測値の誤差を解消するには不十分であった。
そこで、本願発明は、予測値の誤差を、従来よりも極力小さくすることができる予測システムおよびその方法を提供することを目的とするものである。
かかる課題を解決するため本発明においては、任意期間における予測を適応する予測対象について、当該予測対象に関連する予測値を算出する予測システムであって、予測値を算出するために利用される複数のデータを記録する記憶装置と、所定の演算モデルを備え、当該演算モデルに複数のデータを適用して予測値を算出する制御装置とを備え、制御装置は、複数のデータそれぞれの時間属性の情報に基づいて、演算モデルを変更するようにした。
また本発明においては、任意期間における予測を適応する予測対象について、当該予測対象に関連する予測値を制御装置が算出するようにした予測方法であって、制御装置は、予測値を算出するために利用される複数のデータを記憶装置から読み出し、複数のデータに所定の演算モデルを適用して予測値を算出し、複数のデータそれぞれの時間属性の情報に基づいて、演算モデルを変更するようにした。
本発明によれば、予測値の誤差を、従来よりも極力小さくすることができる予測システムおよびその方法を実現できる。
以下図面について、本発明の一実施の形態を詳述する。
(1)本実施の形態による需給管理システムの構成
図1に、需給管理システムのハードウェアブロック図を示す。需給管理システム1は、過去の電力需要の実績量に基づいて将来の所定期間の電力の需要量などの値を精度良く予測し、これによって、発電機の運転計画の策定や調整、そして、他の電気事業者からの電力の調達取引計画の策定や調整など電力の需給管理を可能にするものである。
図1に、需給管理システムのハードウェアブロック図を示す。需給管理システム1は、過去の電力需要の実績量に基づいて将来の所定期間の電力の需要量などの値を精度良く予測し、これによって、発電機の運転計画の策定や調整、そして、他の電気事業者からの電力の調達取引計画の策定や調整など電力の需給管理を可能にするものである。
需給管理システム1は、系統運用者システムモジュール7、取引市場運用者システムモジュール8、公共情報提供者システムモジュール9、及び、需要家システムモジュール10がそれぞれ所有する、主として計算機などの端末装置と、これらを相互通信可能に接続する、LANなどのネットワーク(111、112)を備える。なお、電気事業者システムモジュール2は、需給管理者システムモジュール3、営業管理者システムモジュール4、取引管理者システムモジュール5及び設備管理者システムモジュール6を備える。
需給管理者システムモジュール3は、需給管理者が保有する販売計画や今後の販売計画に基づいて、例えば30分単位の演算時間単位ごとに将来の所定期間の需要量を予測し、予測した需要量を充足できるよう電力の調達量を管理する部署又は担当者が使用するシステムであり、需要の予測値を算出するための予測演算装置30及び装置とデータのやり取りを行うための情報入出力端末31を備える。
営業管理者システムモジュール4は、長期又は短期での電気の販売計画の立案や需要家に対しての電気供給の新規の契約締結及び既存の電気供給契約の管理を行う部署又は担当者が使用するシステムであり、立案した販売計画及び電気供給契約を締結した需要家の情報を管理する販売管理装置40を備える。
取引管理者システムモジュール5は、他の電気事業者との直接的な契約を通じて、又は、取引所を介して、電気を調達するための取引を計画し実行する部署又は担当者が使用するシステムであり、電気の調達取引計画及び契約済みの電気の調達契約の情報を管理し、他の電気事業者及び取引所との取引に関する電文をやり取りするための取引管理装置50を備える。
設備管理者システムモジュール6は、自社が保有する発電設備又は自社の電気調達計画に組み入れることが可能な自社保有外の発電設備の運転計画の立案と実行を行う部署又は担当者が使用するシステムであり、設備管理装置60及び設備管理装置60から制御信号を受信し実際に発電設備の制御を実行するための制御装置61を備える。設備管理装置60は、発電設備の情報の管理、発電設備の運転計画の立案及び運転計画の実行のための制御信号の送信を行う。
一方、系統運用者システムモジュール7は、広範囲の地域にまたがる送配電系統設備の管理及び地域の需要家それぞれの需要実績を計測した計測値の保管を行う事業者が使用するシステムであり、計測した需要家の需要実績値を配信するための系統情報管理装置70を備える。
また取引市場運用者システムモジュール8は、複数の電気事業者に対して、電力の取引を行うために必要な情報や手続きを統括的に管理する事業者が使用するシステムであり、電力取引に関する情報を配信し、各電気事業者から受け付けた注文の付け合せ処理を行うための市場運用管理装置80を備える。
公共情報提供者システムモジュール9は、気温、湿度、日射量などの気象に関する過去の観測情報と将来の予報情報を提供する事業者が使用するシステムであり、気象の観測情報及び予報情報を配信するための公共情報配信装置90を備える。
需要家システムモジュール10は、負荷設備や発電設備を有する個人又は法人が使用するシステムであり、電気事業者システムモジュール2又は系統運用者システムモジュール7に、所有する設備、所有する施設、業種、在室人数、所在地などの需要や発電の傾向に影響を与え得る情報を送信するための情報入出力端末101と、需要及び発電の実績量を計測するための計測装置100とを備える。
(2)本実施の形態による予測機能
次に、本実施の形態の需給管理システム1に実装された予測機能について説明する。本需給管理システム1には電力需要量を予測する予測機能が搭載されている。
次に、本実施の形態の需給管理システム1に実装された予測機能について説明する。本需給管理システム1には電力需要量を予測する予測機能が搭載されている。
図2は、需給管理システム1の一部を構成する本実施の形態による予測システム12を示す。本実施の形態の予測システム12は、電力需要を予測するシステムで、予測機能が搭載され、予測演算装置30及び販売管理装置40を備える。
予測演算装置30は、属性実績情報311及び属性予報情報312と、販売管理装置40が保持する需要実績情報406とに基づいて、予め設定した任意の将来期間における需要値の経時的な増加や減少などの変化の特性を示すデータ(以降、時間推移を示す曲線と呼称)を算出し、算出した曲線を補正することで予測値を算出し、予測値を予測結果情報313に保持する。
ここで予測結果情報313は、少なくとも、算出した将来期間における需要値の時間推移を示す曲線及び曲線を補正することで算出した予測値の情報を含む。そして予測演算装置30は、このようにして算出した予測結果情報313を設備管理装置60及び取引管理装置50に送信する。
販売管理装置40は、需要実績情報406及び販売契約予実情報407を保持する。このうち需要実績情報406は、計測装置100及び系統情報管理装置70から取得される契約済みの需要家及び契約締結対象の需要家の過去の需要実績情報406で構成される情報であり、例えば、各需要家システムモジュール10の過去数年間の30分ごとの電力需要の実績値を含む。
また販売契約予実情報407は、販売管理装置40又は営業管理者システムモジュール4が作成する情報であり、例えば、過去及び未来の任意の期間に亘る日、週、月又は年単位での既契約の各需要家システムモジュール10又は契約予定の各需要家システムモジュール10の供給開始、供給終了日時及び契約電力容量の情報を含む。
予測演算装置30は、例えばパーソナルコンピュータ、サーバコンピュータ、ハンドヘルドコンピュータなどの情報処理装置から構成され、予測演算装置30の動作を統括的に制御する制御装置であるCPU(Central Processing Unit)301、入力装置302、出力装置303、通信装置304及び記憶装置305を備える。
入力装置302は、キーボード、マウス又はそれらの組み合わせから構成され、出力装置303は、ディスプレイ、プリンタ又はそれらの組み合わせから構成される。また通信装置304は、無線LAN又は有線LANに接続するためのNIC(Network Interface Card)を備えて構成される。さらに記憶装置305は、RAM(Random Access Memory)及びROM(Read Only Memory)の記憶媒体から構成される。
記憶装置305には、適時性指標値設定モジュール306、信頼性指標値設定モジュール307、代表曲線算出モジュール308、補正値算出モジュール309及び代表曲線補正モジュール310の各種コンピュータプログラムが格納される。
適時性指標値設定モジュール306は、属性実績情報311及び需要実績情報406の予測に用いるデータである標本値(以下、標本データとする)それぞれについて、予め設定した予測対象とする将来期間と時間的な相関を有するか否かの適時性を評価し、標本データそれぞれに対応した適時性を示す指標値を算出する機能を有するプログラムである。
信頼性指標値設定モジュール307は、予測演算装置30での処理過程の中間において算出される各種推定データについて、推定結果の変動範囲などの信頼性を評価し、各種推定データのそれぞれに対応した信頼性を示す指標値を算出する機能を有するプログラムである。
代表曲線算出モジュール308は、属性実績情報311、需要実績情報406、販売契約予実情報407又はそれらの組み合わせを用いて、予め設定した予測対象とする将来期間における予測対象の時間推移を示す曲線を算出する機能を有するプログラムである。
補正値算出モジュール309は、属性実績情報311及び需要実績情報406の予測に用いる標本データ並びに適時性指標値設定モジュール306が算出した適時性を示す指標値に基づいて、代表曲線算出モジュール308が算出した曲線の振幅又は周波数を変更するための補正値(以下、補正用データ)を算出する機能を有するプログラムである。
代表曲線補正モジュール310は、補正値算出モジュール309が算出した補正用データ及び信頼性指標値設定モジュール307が算出した補正用データそれぞれの信頼性を示す指標値に基づいて、代表曲線算出モジュール308が算出した曲線の振幅又は周波数を変更する機能を有するプログラムである。
また記憶装置305には、属性実績情報311、属性予報情報312及び予測結果情報313のデータベースが格納されている。
属性実績情報311は、予測対象である電力需要の時間推移を示す曲線の形状及び需要の規模の増減を説明し得る属性情報の過去の計測データが格納されるデータベースである。
属性実績情報311は、暦日情報、気象情報、台風及びイベントの突発事象の発生有無を示す情報又は電力需要に影響を及ぼし得る各種産業の実態を示す産業動態情報の情報を含む。歴日情報は、年、月、曜日、平日、休日又はそれらの組み合わせを示す日種別の情報とし、気象情報は気温、湿度、日射量、日照時間、気圧、風速又はそれらの組み合わせとする。
属性予報情報312は、属性実績情報311に格納されている各種属性情報それぞれについての、予め設定した将来期間における予報データが格納されるデータベースである。
予測結果情報313は、予測演算装置30が算出した最終的な予測結果又は計算過程における中間データが格納されるデータベースであり、予め設定した将来期間における予測対象の予測結果データ、同期間における予測対象の時間推移を表す曲線データ、曲線を補正するための補正用データ又はこれらデータの算出の演算に用いる演算式である演算モデル(以下、モデルとする)の情報を含む。
他方、販売管理装置40は、例えばパーソナルコンピュータ、サーバコンピュータ、ハンドヘルドコンピュータなどの情報処理装置から構成され、販売管理装置40の動作を統括的に制御するCPU401、入力装置402、出力装置403、通信装置404及び記憶装置405を備える。
入力装置402は、キーボード、マウス又はそれらの組み合わせから構成され、出力装置403は、ディスプレイ又はプリンタから構成される。また通信装置404は、無線LAN又は有線LANに接続するためのNICを備えて構成される。
記憶装置405は、RAM及びROMの記憶媒体から構成され、需要実績情報406、及び販売契約予実情報407のデータベースが格納されている。
需要実績情報406は、計測装置100及び系統情報管理装置70から受信し取得した情報が格納されるデータベースであり、既契約の需要家システムモジュール10又は契約予定の需要家システムモジュール10の過去の需要実績情報を含む各種情報が格納される。実績情報の粒度は例えば30分単位であり、また期間は数日から数年である。
販売契約予実情報407は、営業管理者システムモジュール4が作成した電気の販売計画の予定及び実績の情報が格納されるデータベースであり、過去及び未来の任意の期間に亘る日、週、月又は年単位での既契約の各需要家システムモジュール10又は契約予定の各需要家システムモジュール10の供給開始、供給終了日時、契約電力容量などの情報を含む。
(3)予測処理
図3は、予測システム12における予測処理の処理手順を示す。この処理は、予測演算装置30が需給管理者システムモジュール3からの入力操作を受け付けたこと、予め設定された時間間隔又は時刻を契機として開始される処理であり、予測演算装置30によりステップS11からステップS15の処理が実行される。
図3は、予測システム12における予測処理の処理手順を示す。この処理は、予測演算装置30が需給管理者システムモジュール3からの入力操作を受け付けたこと、予め設定された時間間隔又は時刻を契機として開始される処理であり、予測演算装置30によりステップS11からステップS15の処理が実行される。
なお実際には、予測演算装置30のCPU301及び記憶装置305に格納されている各種コンピュータプログラムに基づいて処理が実行される。説明の便宜上、処理主体を予測演算装置30が有する各種コンピュータプログラムとして説明する。
まず適時性指標値設定モジュール306が、需要実績情報406及び属性実績情報311より、予測のために用いる標本データセットを抽出する。そして標本データセット内の各標本データについて、予測対象期間との時間的な相関の程度尺度である適時性を評価し、適時性を示す指標値を算出する(S11)。
ここで標本データセット内の各標本データ及び予測対象期間の時間的な相関の評価とは、例えば予測対象期間に対して時間的により近い標本データを強相関と評価する。そしてこの評価に基づいて算出する適時性を示す指標値とは、時間の関数として算出され、例えば予測対象期間からの日数や経過の間隔の逆数として算出される。この場合、指標値が大きい程、予測対象期間との相関が強いことを意味する。
標本データセット内の各標本データ及び予測対象期間の時間的な相関の評価は、予測対象の時間周期的な変動傾向に基づいた評価であってもよい。例えば予測対象が季節性の周期的変動傾向を有する場合、予測対象期間と同季節の前年標本データを強相関と評価し、適時性を示す指標値は、時間軸上での三角関数を用いて算出される。
例えば予測対象が曜日性の周期的変動傾向を有する場合、予測対象期間と同曜日の標本データが強相関と評価され、適時性を示す指標値は、予測対象期間と同曜日の標本データを“1”、それ以外の曜日の標本データを“0”とされる。これは曜日の他、例えば平日や休日を示す日種別に基づいた周期的変動傾向を有する場合であっても同様である。
次に代表曲線算出モジュール308が、需要実績情報406、属性実績情報311及び属性予報情報312を用いて、予測対象の値の時間推移を示す曲線を算出する(S12)。
予測対象の値の時間推移を示す曲線の算出に際しては、適時性指標値設定モジュール306が算出した適時性を示す指標値を用いる。具体的には、各標本データに対して、適時性を示す指標値が重み係数として乗算された上で、曲線が算出される。これにより、予測対象期間と時間的相関が強い標本データをより重視した曲線が算出され、予測対象期間に観測されると予測される曲線の形状により近い曲線が算出され得る。
また他方で、補正値算出モジュール309が、需要実績情報406、属性実績情報311及び属性予報情報312を用いて、代表曲線算出モジュール308が算出した曲線を補正するための補正用データを算出する(S13)。
ここで曲線の補正とは、具体的には、曲線の量軸上でのスケール補正である振幅の変更又は曲線の時間軸上でのスケール補正である周波数の変更を意味する。従って補正用データは、予測対象期間内の任意の時刻における予測対象の予測値、予測対象期間内の任意の期間における最大値や最小値の予測値又は積算値の予測値である。
補正用データの算出に際しては、適時性指標値設定モジュール306が算出した適時性を示す指標値が用いられる。具体的には、各標本データに対して、適時性を示す指標値を重み係数として乗算した上で、補正用データである予測対象期間内の任意の時刻における予測対象の予測値、予測対象期間内の任意の期間における最大値や最小値の予測値又は積算値の予測値が算出される。
これにより、予測対象期間と時間的相関が強い標本データをより重視した補正用データが算出され、予測対象期間に観測されると予測される予測対象の値により近い予測値を算出するような曲線に補正され得る。
次に信頼性指標値設定モジュール307が、算出した補正用データである予測対象期間内の任意の時刻における予測対象の予測値、予測対象期間内の任意の期間における最大値や最小値の予測値又は積算値の予測値のそれぞれについて、量的及び時間的の2種の信頼性を評価し、信頼性を示す指標値を算出する(S14)。信頼性を示す指標値とは、例えば、各補正用データの信頼区間や予測区間である。
最後に代表曲線補正モジュール310が、代表曲線算出モジュール308が算出した予測対象期間における予測対象の時間推移を示す曲線及び補正値算出モジュール309が算出した曲線の補正用データを用いて、曲線の振幅、周波数又はその両方の変更を行い、補正結果を予測値として予測結果情報313に格納する(S15)。
なお補正を行う際には、信頼性指標値設定モジュール307が算出した各補正用データに対する信頼性を示す指標値が用いられる。具体的には、信頼性を示す指標値が補正時の重み係数として用いられることで、曲線の補正量を制御する。以上の処理を以って、本実施形態における予測処理が終了する。
(4)各処理モジュールの詳細
(4-1)代表曲線算出モジュールの第1の実施の形態
図4は、予測システム12における代表曲線算出モジュール308の第1の実施の形態を示す。代表曲線算出モジュール308は、時間単位クラスタリングモジュール308A1及び時間単位プロファイリング処理モジュール308A2を備える。
(4-1)代表曲線算出モジュールの第1の実施の形態
図4は、予測システム12における代表曲線算出モジュール308の第1の実施の形態を示す。代表曲線算出モジュール308は、時間単位クラスタリングモジュール308A1及び時間単位プロファイリング処理モジュール308A2を備える。
本実施形態における代表曲線算出モジュール308は、需要値データである、需要実績情報406、属性実績情報311及び属性予報情報312を入力標本として用いて、予め設定した予測対象とする将来期間における予測対象の時間推移を示す曲線308Bを算出する。
(4-1-1)時間単位クラスタリングモジュール
時間単位クラスタリングモジュール308A1は、予測対象の周期的な変動を示す特徴量に基づいて、需要実績情報406から抽出した標本データを分類する。
時間単位クラスタリングモジュール308A1は、予測対象の周期的な変動を示す特徴量に基づいて、需要実績情報406から抽出した標本データを分類する。
まず、時間単位クラスタリングモジュール308A1は、予め設定した時間粒度で需要実績情報406から抽出した標本データを分割し、新たな第2の標本値(以下、第2の標本データとする)のセット(第2の標本データセット)を算出する。分割した標本データのそれぞれに対してフーリエ変換又はウェーブレット変換の周波数解析を用いることで周期的な特徴を示す特徴量が算出される。そして算出した特徴量に対してクラスタリング処理が行われ、例えば24時間単位の波形形状が類似する標本データ同士がクラスタ(以降、時間クラスタと呼称)として分類される。
なおこのようなクラスタを用いるクラスタリング処理に用いるアルゴリズムには、公知の手法が適用されてもよい。公知の手法としては、近傍の最適化の教師なしクラスタリングアルゴリズムであるk-means、EMアルゴリズム及びスペクトラルクラスタリングが挙げられる。また、識別面の最適化の教師なしのクラスタリングアルゴリズムである教師なしSVM(Support Vector Machine)、VQアルゴリズム及びSOM(Self-Organizing Maps)も公知の手法として挙げられる。
また特徴量の算出に当たって、標本データのそれぞれは、例えば平均が0、標準偏差が1となるように正規化される。正規化が施されることにより、各標本データの値の規模の大小に依存しない周期的な特徴のみが抽出される。
(4-1-2)時間単位プロファイリングモジュール
時間単位プロファイリング処理モジュール308A2は、時間単位クラスタリングモジュール308A1が算出した各時間クラスタのそれぞれについて、共通的に存在する属性の特定及びその値の範囲の算出を行うことで、各時間クラスタを識別する識別器を同定する。
時間単位プロファイリング処理モジュール308A2は、時間単位クラスタリングモジュール308A1が算出した各時間クラスタのそれぞれについて、共通的に存在する属性の特定及びその値の範囲の算出を行うことで、各時間クラスタを識別する識別器を同定する。
具体的には、各時間クラスタを特定する番号及び名称の識別子を教師ラベル及び属性実績情報311に格納されている属性情報のそれぞれを予測子とする標本データセットを用いた教師有り学習アルゴリズムを用い、標本データセットとの適合性が最も高くなるような識別器を同定する。なおここで適合性を計る指標は、エントロピーやジニ係数などの標本データセットの識別度合いを示す指標値や、識別器同定の過程において行う交差検定時のテスト誤差やなどである。またこの識別器は、予測対象の時間推移を示す曲線を算出する演算モデルを構成する要素の一つである。
この算出の際、適時性指標値設定モジュール306が算出した各標本データに対する適時性を示す指標値が重み係数として利用される。これにより、予測対象の年を経るごとの変化(以下、経年変化とする)などが反映された識別器が算出され得る。換言すれば、予測対象の時間推移を示す曲線を算出するモデルである識別器の構造は、適時性を示す指標値に応じて変更され得る。
算出された識別器に対して属性予報情報312を入力することで、予測対象期間における予測対象の時間推移を示す曲線が所属すると予測される時間クラスタが識別される。識別された時間クラスタから予測対象の時間推移を示す曲線が算出される方法は、例えば識別された時間クラスタに所属する標本データ群の算術平均として算出される方法である。又は、識別器から算出される全時間クラスタの所属確率を重み係数とした加重平均にて算出される。なおこの識別された時間クラスタから予測対象の時間推移を示す曲線が算出する処理部分が、予測対象の時間推移を示す曲線を算出する演算モデルを構成するもう要素の一つである。
なお識別器算出アルゴリズムは公知の手法が適用されてもよい。公知の手法としては、例えば、CART、ID3、ランダムフォレストの決定木学習アルゴリズム及びSVM(Support Vector Machine)の識別平面学習アルゴリズムが挙げられる。
(4-2)適時性指標値設定モジュール
適時性指標値設定モジュール306は、標本データセット内の各標本データについて、標本データセット内の各標本データ及び予測対象期間の時間的な相関の程度尺度である適時性を評価し、適時性を示す指標値を算出する。
適時性指標値設定モジュール306は、標本データセット内の各標本データについて、標本データセット内の各標本データ及び予測対象期間の時間的な相関の程度尺度である適時性を評価し、適時性を示す指標値を算出する。
具体的には、需要実績情報406及び属性実績情報311より、予測のために用いる標本データセットが抽出される。そして標本データセット内の各標本データについて、予測対象期間との時間的な相関の程度尺度である適時性が評価され、適時性を示す指標値が算出される。
ここで予測対象期間との時間的な相関の評価は、例えば予測対象期間に対して時間的により近い標本データを強相関と評価される。そしてこの評価に基づいて算出する適時性を示す指標値とは、時間の関数として算出されるものであり、例えば予測対象期間からの日数又は経過の間隔の逆数として算出されてもよい。この場合、指標値が大きい程、予測対象期間との相関が強くなる。
予測対象期間との時間的な相関の評価は、予測対象の時間周期的な変動傾向に基づいた評価であってもよい。例えば予測対象が季節性の周期的変動傾向を有する場合、予測対象期間と同季節の前年標本データが強相関と評価され、適時性を示す指標値は、時間軸上での三角関数を用いて算出される。
また予測対象が曜日性の周期的変動傾向を有する場合、予測対象期間と同曜日の標本データが強相関と評価され、適時性を示す指標値は、予測対象期間と同曜日の標本データが“1”、それ以外の曜日の標本データが“0”とされる。これは曜日の他、例えば平日や休日を示す日種別に基づいた周期的変動傾向を有する場合であっても同様である。
適時性指標値設定モジュール306が算出した適時性を示す指標値は、上述のように、時間単位プロファイリング処理モジュール308A2での識別器算出過程において、重み係数として用いられる。またこの他に、補正値算出モジュール309での演算においても用いられる。いずれにおいても得られる効果は同様であり、予測対象期間と時間的な相関が強い標本データに重きを置いた学習処理を施すことが可能となり、従って算出されるデータは、予測対象の経年変化を反映したより正確なデータとなる。
(4-3)補正値算出モジュールの第1の実施の形態
図6は、予測システム12における補正値算出モジュール309の第1の実施の形態を示す。補正値算出モジュール309は、モデル同定モジュール309A1及び補正値推定モジュール309A2を備える。
図6は、予測システム12における補正値算出モジュール309の第1の実施の形態を示す。補正値算出モジュール309は、モデル同定モジュール309A1及び補正値推定モジュール309A2を備える。
本実施形態における補正値算出モジュール309は、需要実績情報406と属性実績情報311及び属性予報情報312とを用いて、代表曲線算出モジュール308が算出した曲線を補正するための補正用データを算出する。
ここで曲線の補正とは、具体的には、曲線の量軸上でのスケール補正である振幅の変更又は曲線の時間軸上でのスケール補正である周波数の変更を意味する。従って補正用データは、予測対象期間内の任意の時刻における予測対象の予測値、予測対象期間内の任意の期間における最大値や最小値の予測値又は積算値の予測値である。これらの予測値が補正基準点として用いられる。
(4-3-1)モデル同定モジュール
まずモデル同定モジュール309A1は、需要実績情報406と属性実績情報311を用いて、補正用データである予測対象期間内の任意の時刻における予測対象の予測値、予測対象期間内の任意の期間における最大値や最小値の予測値又は積算値の予測値の算出の演算に用いるモデルを同定する。
まずモデル同定モジュール309A1は、需要実績情報406と属性実績情報311を用いて、補正用データである予測対象期間内の任意の時刻における予測対象の予測値、予測対象期間内の任意の期間における最大値や最小値の予測値又は積算値の予測値の算出の演算に用いるモデルを同定する。
例えば、補正用データである予測対象期間内の任意の時刻における予測対象の予測値、予測対象期間内の任意の期間における最大値や最小値の予測値又は積算値の予測値をy、yの説明変数をxとしたとき、yとxの間に次式の関係が成り立つとする。

ここでx1、x2は、例えば平均気温や前日のyの実績値であり、具体的な数値は属性実績情報311に格納されている。モデル同定モジュールは、(1)式に記載の係数a、b、c、dを、xとyとの適合性が最も高くなるように推定することで、演算モデルを同定する。具体的には、例えば最小二乗法により係数を推定する。その際、適合性を計る指標は、同定したモデルと標本データの残差二乗和であり、適合性が最も高くなるとは、残差二乗和が最も小さくなることを意味する。
なお係数を推定するにあたっては、適時性指標値設定モジュール306が算出した各標本データに対する適時性を示す指標値が用いられる。具体的には、適時性を示す指標値を重み係数とした、重み付き最小二乗法により係数a、b、c、dが推定され、補正用データの算出の演算に用いるモデルの同定結果として算出される。これにより、yの経年変化を反映したより的確な補正用データが算出され得る。
(4-3-2)補正値推定モジュール
そして補正値推定モジュール309A2は、モデル同定モジュール309A1が算出した補正用データの算出の演算に用いるモデルに、属性予報情報312に格納されている説明変数xの予報値が入力されることで、予測対象期間における時間推移を示す曲線の補正値を、補正用データとして算出する。
そして補正値推定モジュール309A2は、モデル同定モジュール309A1が算出した補正用データの算出の演算に用いるモデルに、属性予報情報312に格納されている説明変数xの予報値が入力されることで、予測対象期間における時間推移を示す曲線の補正値を、補正用データとして算出する。
ここで補正用データには、補正値そのものの情報(補正用データ309B1)及び各補正値の時刻範囲に関する情報(補正用データ309B2)の、少なくとも2種類の情報が含まれる。各補正値の時刻範囲に関する情報とは、例えば予測対象期間内の任意の期間における最大値又は最小値を補正用データとする場合は、それぞれの値が出現する時刻の範囲である。
加えて補正値推定モジュール309A2は、最小二乗法の計算時の標本誤差データを補正用データの一部として算出する。このデータは、信頼性指標値設定モジュール307が信頼性を示す指標価を算出する際に使用するデータである。またこのデータは、モデル同定モジュール309A1が算出した補正用データの算出の演算に用いるモデル又はモデル同定モジュール309A1が補正用データの算出の演算に用いるモデルを同定するため行った最小二乗法の計算結果のデータである。
なお、電力の販売契約の予実情報である販売契約予実情報407が使用できる場合、さらに的確な予測がされ得る。具体的には、補正値推定モジュール309A2が算出した補正用データ309B1が、一度、現時点での総契約電力容量で除算され、1契約電力容量あたりの原単位補正値が算出される。
そしてこの原単位補正値に対して、予測対象期間における総契約電力容量が乗算され、新たに補正用データ309B1が算出される。これにより、契約需要家数が増減する場合においても、より的確な曲線補正用データが算出され得る。
(4-4)代表曲線補正モジュールの第1の実施の形態
図8は、予測システム12における代表曲線補正モジュール310の第1の実施の形態を示す。代表曲線補正モジュール310は、振幅補正モジュール310A1及び周波数補正モジュール310A2を備える。
図8は、予測システム12における代表曲線補正モジュール310の第1の実施の形態を示す。代表曲線補正モジュール310は、振幅補正モジュール310A1及び周波数補正モジュール310A2を備える。
本実施形態における代表曲線補正モジュール310は、補正値算出モジュール309が算出した補正用データを用いて、代表曲線算出モジュール308が算出した曲線の振幅もしくは周波数を変更する。このとき、信頼性指標値設定モジュール307が算出した補正用データそれぞれの信頼性を示す指標値が用いられることで、より的確な予測値が算出される。
(4-4-1)振幅補正モジュール
まず、振幅補正モジュール310A1が、補正値算出モジュール309が算出した補正用データ309B1を用いて、代表曲線算出モジュール308が算出した予測対象期間における予測対象の時間推移を示す曲線308Bの振幅を変更する。具体的には補正後の曲線f^(t)は次式で与えられる。

まず、振幅補正モジュール310A1が、補正値算出モジュール309が算出した補正用データ309B1を用いて、代表曲線算出モジュール308が算出した予測対象期間における予測対象の時間推移を示す曲線308Bの振幅を変更する。具体的には補正後の曲線f^(t)は次式で与えられる。
ここで、f(t)は、予測対象期間における予測対象の時間推移を示す曲線であり、時刻tの関数である。またα及びβは、曲線f(t)の変更係数である。すなわち振幅補正モジュール310A1は、補正用データ309B1である予測対象期間内の任意の時刻における予測対象の予測値、予測対象期間内の任意の期間における最大値や最小値の予測値又は積算値の予測値それぞれと、補正後の曲線f^(t)との残差平方和が最小となるように、変更係数α及びβを推定する処理を行う。
なおα及びβの推定においては、信頼性指標値設定モジュール307が算出した各補正用データに対する信頼性を示す指標値が用いられる。具体的には、それぞれの補正用データに対する量的な信頼性を示す指標値が、それぞれの補正用データの値及び曲線f^(t)の残差に対する重み係数として乗算された上で、変更係数α及びβが推定される。
これにより、信頼性指標値設定モジュール307が算出した各補正用データと、信頼性の低い補正用データよりも信頼性の高い補正用データの値との残差をより小さくすることを優先として曲線f(t)が補正され、このことで最終的な予測精度が向上する。
(4-4-2)周波数補正モジュール
そして周波数補正モジュール310A2は、補正値算出モジュール309が算出した補正用データ309B2を用いて、代表曲線算出モジュール308が算出した予測対象期間における予測対象の時間推移を示す曲線308Bの周波数を変更する。
そして周波数補正モジュール310A2は、補正値算出モジュール309が算出した補正用データ309B2を用いて、代表曲線算出モジュール308が算出した予測対象期間における予測対象の時間推移を示す曲線308Bの周波数を変更する。
例えば、補正用データが予測対象期間内の任意の期間における最大値や最小値の予測値である場合、補正用データ309B2に格納されているそれぞれの出現時刻範囲の平均値又は最頻値と、補正後の曲線f^(t)の当該時刻とが一致又は残差平方和が最小となるように、曲線f(t)の周波数が変更される。そして補正後の曲線f^(t)が、予測対象期間における予測対象の予測値として算出され、予測結果情報313に格納される。
なお補正においては、信頼性指標値設定モジュール307が算出した各補正用データに対する信頼性を示す指標値が用いられる。具体的には、それぞれの補正用データに対する時間的な信頼性を示す指標値を、それぞれの補正用データの値と曲線f^(t)との残差に対する重み係数として乗算した上で、補正処理が行われる。これにより、信頼性指標値設定モジュール307が算出した各補正用データと、信頼性の低い補正用データよりも信頼性の高い補正用データの値との残差をより小さくすることを優先として曲線f(t)が補正され、このとこで最終的な予測精度が向上する。
(4-4-3)信頼性指標値設定モジュール
信頼性指標値設定モジュール307は、算出した補正用データである予測対象期間内の任意の時刻における予測対象の予測値、予測対象期間内の任意の期間における最大値や最小値の予測値又は積算値の予測値のそれぞれについて、量的及び時間的の2種の信頼性を評価し、信頼性を示す指標値を算出する。
信頼性指標値設定モジュール307は、算出した補正用データである予測対象期間内の任意の時刻における予測対象の予測値、予測対象期間内の任意の期間における最大値や最小値の予測値又は積算値の予測値のそれぞれについて、量的及び時間的の2種の信頼性を評価し、信頼性を示す指標値を算出する。
具体的には、補正値推定モジュール309A2が算出した補正用データ309B1に含まれている、各補正用データの算出の演算に用いるモデル又はモデル同定の過程で算出した標本誤差データから、それぞれの補正用データの推定値の信頼区間や予測区間又は標本誤差の分散や標準偏差が算出され、量的な信頼性を示す指標値として算出される。
また補正値推定モジュール309A2が算出した補正用データ309B2に含まれている、各補正用データの値の出現する時刻範囲の情報から、それぞれの補正用データの時間軸上の信頼区間や予測区間又は時刻範囲の情報の分散や標準偏差が算出され、時間的な信頼性を示す指標値として算出される。
上述した様に、これら信頼性を示す指標値を代表曲線補正モジュール310が使用することで、最終的に算出される予測値の予測精度が向上し得る。
以上までに説明した予測処理によって算出された予測結果情報313に基づいて、設備管理装置60が運用可能な発電設備の運転計画を算出し、制御装置61に送信する。運転計画を受信した制御装置61は、発電設備の具体的な制御値を算出し、実際の制御を実行する。
また取引管理装置50は、他の電気事業者や取引市場との電力の売買にかかわる取引計画を作成し、市場運用管理装置80に対して売買注文や注文取消しの電文を送信する。
(5)本実施の形態の効果
図11に示すように、代表曲線算出モジュール308が出力する予測対象期間における予測対象の時間推移を示す曲線の算出結果は、適時性指標値設定モジュール306が算出する標本データそれぞれの適時性を示す指標値を用いた場合及びそうでない場合で異なる。
図11に示すように、代表曲線算出モジュール308が出力する予測対象期間における予測対象の時間推移を示す曲線の算出結果は、適時性指標値設定モジュール306が算出する標本データそれぞれの適時性を示す指標値を用いた場合及びそうでない場合で異なる。
まず図11のグラフ501は、ある1年間における日ごとの平均気温の推移を示している。ここで、仮に代表曲線算出モジュール308における時間単位プロファイリング処理モジュール308A2が算出した時間クラスタの識別器において、最も主要な属性が日平均気温であった場合、予測対象期間と同一の平均気温の標本データが所属する時間クラスタが、予測対象期間に観測されると予測される時間推移を示す曲線が所属する時間クラスタとして識別される。
具体的には、図11のグラフ502及びグラフ503に示す2つの時間クラスタが、識別される候補の時間クラスタである。ここでは、予測対象の時間推移を示す曲線は、1年を経て、グラフ502に示す曲線から、グラフ503に示す曲線に変化しているとする。
ここで上記の識別器の算出の過程において、仮に、標本データそれぞれの適時性を示す指標値を使用しなかったとする。その場合に算出される識別器では、図11のグラフ502及びグラフ503の時間クラスタはほぼ同確率として識別される。従って、予測対象期間における予測対象の時間推移を示す曲線は、図11のグラフ504に示す様に、両時間クラスタの平均的な曲線として算出され、曲線の経年変化を捉えることができない。
一方、標本データそれぞれの適時性を示す指標値を使用した場合、図11のグラフ505に示す様に、経年変化を経た直近の曲線により近い形状として、予測対象期間における予測対象の時間推移を示す曲線が算出される。従って、最終的な予測精度を向上することができる。
標本データそれぞれの適時性を示す指標値は、補正値算出モジュール309においても使用され、その効果及び原理は、上記で説明した内容と同様である。
また図12は、信頼性指標値設定モジュール307が算出する、曲線の補正用データに対する信頼性を示す指標値を使用したときの、代表曲線補正モジュール310が算出する最終的な予測結果である補正後の曲線への影響を示す。
信頼性指標値設定モジュール307が算出する曲線の補正用データに対する信頼性を示す指標値には、量的な信頼性及び時間的な信頼性の、少なくとも2種類の信頼性を示す指標値が存在する。
まず図12のグラフ601には、量的な信頼性を概念的に示している。ここでは、曲線の補正用データとして、例えば、早朝の最小値、正午前後の最大値及び夕方前後の最大値が使用される。
このとき、それぞれの信頼性を示す指標値は、それぞれ図12のグラフ602、グラフ603及びグラフ604に示す確率密度関数上の分散として定義される。なお説明を簡単にするため、指標値を高低の二値で表す。
ここでは、早朝の最小値及び夕方前後の最大値の信頼性が高く、正午前後の最大値の信頼性が低い。従って曲線の振幅の変更は、図12のグラフ609に示す様に、曲線及び正午前後の最大値の量軸上での残差が拡大することを許容した上で、曲線及び早朝の最小値の量軸上での残差と曲線及び夕方前後の最大値の量軸上での残差とを最小化するように補正を行う。
他方、図12のグラフ605には、時間的な信頼性を概念的に示している。ここでは上記と同様に、曲線の補正用データとして、早朝の最小値、正午前後の最大値及び夕方前後の最大値を使用していることとする。
このとき、それぞれの信頼性を示す指標値は、それぞれ図12のグラフ606、グラフ607及びグラフ608に示す過去の観測値の範囲として定義しているとする。なお説明を簡単にするため、指標値を高低の二値で表す。
ここでは、早朝の最小値及び正午前後の最大値の信頼性が高く、夕方前後の最大値の信頼性が低い。従って曲線の振幅の変更は、図12のグラフ610に示す様に、曲線及び夕方前後の最大値の時間軸上での残差が拡大することを許容した上で、曲線及び早朝の最小値の時間軸上での残差と曲線及び正午前後の最大値の時間軸上での残差とを最小化するように補正を行う。
以上のように、信頼性の高い補正用データを優先した曲線補正を行うことで、最終的な予測値である補正後の曲線を、よりもっともらしい曲線とすることができる。つまり、予測における標本値及び処理途中で得られる加工データそれぞれの信頼性などの有用性を考慮した予測値を得ることができる。
(6)各モジュールの他の実施形態
(6-1)代表曲線算出モジュールの第2の実施の形態
上述の代表曲線算出モジュール308の第1の実施の形態においては、予測対象期間における予測対象の時間推移を示す曲線を算出する方法として、予測対象の周期的な変動の特徴を示す特徴量を用いたクラスタリングアルゴリズムを利用した場合について述べたが、本発明はこれに限らず、例えば、代表曲線算出モジュール308は予測対象日と同一日種別の過去数日分を標本データとして、その算術平均にて曲線を算出するようにしてもよい。
(6-1)代表曲線算出モジュールの第2の実施の形態
上述の代表曲線算出モジュール308の第1の実施の形態においては、予測対象期間における予測対象の時間推移を示す曲線を算出する方法として、予測対象の周期的な変動の特徴を示す特徴量を用いたクラスタリングアルゴリズムを利用した場合について述べたが、本発明はこれに限らず、例えば、代表曲線算出モジュール308は予測対象日と同一日種別の過去数日分を標本データとして、その算術平均にて曲線を算出するようにしてもよい。
また上述の代表曲線算出モジュール308の第1の実施の形態においては、需要実績情報406に格納されている予測対象のデータは、1つの計量器にて計測された1つのデータ又は複数の計量器で計測された複数のデータを合計した1つのデータとした場合について述べたが、本発明はこれに限らず、例えば、電力需要データの場合、予測対象のデータを電力の需要家ごとに設置された計量器のそれぞれの計測データとしてより正確な予測を実現するようにしてもよい。
具体的には、図5に示すように、代表曲線算出モジュール308は計量単位クラスタリングモジュール308A3をさらに備える。計量単位クラスタリングモジュール308A3は、需要実績情報406に格納されている計量器ごとのデータを、それぞれ例えば過去365日分の同一期間分として抽出し、需要家ごとのメータデータを入力標本データとする。
そして各標本データに対してフーリエ変換やウェーブレット変換の周波数解析が施されることで、周期的な特徴を示す特徴量が算出される。そして算出された特徴量に対してクラスタリング処理が行われることで、例えば365日(8760時間)単位の波形形状が類似する標本データ同士がクラスタ(以降、計量器クラスタと呼称)として分類される。
以降は上述の代表曲線算出モジュール308の第1の実施の形態と同様の時間クラスタリング処理及び時間単位プロファイリング処理が、各計量器クラスタの代表波形に対して施される。なお各計量器クラスタの代表波形の算出方法は、例えば、各計量器クラスタの算術平均とする。
このように、長期間における予測対象の値の変動が類似する計量点ごとに予めデータが分類されることで、標本データにおける標本分散を減少させることができ、以降の処理により算出される予測対象期間における予測対象の時間推移を示す曲線の精度を向上させることができる。
(6-2)補正値算出モジュールの第2の実施の形態
上述の補正値算出モジュール309の第1の実施の形態においては、予測対象期間における予測対象の時間推移を示す曲線を、予測対象期間内の任意の時刻における予測対象の予測値、予測対象期間内の任意の期間における最大値や最小値又は積算値の予測値に対して一致又はそれぞれの残差和が最小となるように、曲線の振幅又は周波数を補正した場合について述べたが、本発明はこれに限らず、例えば、(2)式で示す変更係数αとβを補正用データとして扱うなど、変更係数を補正用データとして直接扱うようにしてもよい。
上述の補正値算出モジュール309の第1の実施の形態においては、予測対象期間における予測対象の時間推移を示す曲線を、予測対象期間内の任意の時刻における予測対象の予測値、予測対象期間内の任意の期間における最大値や最小値又は積算値の予測値に対して一致又はそれぞれの残差和が最小となるように、曲線の振幅又は周波数を補正した場合について述べたが、本発明はこれに限らず、例えば、(2)式で示す変更係数αとβを補正用データとして扱うなど、変更係数を補正用データとして直接扱うようにしてもよい。
本実施の形態による補正値算出モジュール309は、図7に示すように補正係数算出モジュール309A3をさらに備え、曲線の補正係数を直接予測する。補正係数算出モジュール309A3が、需要実績情報406から抽出した標本データを用いて、変更係数αとβの標本データを算出する。
次に図6を用いて説明した処理と同様に、モデル同定モジュール309A1によって変更係数α及びβの算出の演算に用いるモデルが同定され、同定されたモデルに属性予報情報312から抽出した説明変数値が補正値推定モジュール309A2によって入力されることで、予測対象期間における予測対象の時間推移を示す曲線の変更係数α及びβが算出される。
またモデル同定モジュール309A1における変更係数α及びβの算出の演算に用いるモデル同定においては、図6を用いて説明したとおり、適時性指標値設定モジュール306が算出した適時性を示す指標値が用いられる。
また上述の補正値算出モジュール309の第1の実施の形態においては、補正用データの算出の演算に用いるモデルを(1)式に示すモデルを用いるようにした場合について述べたが、本発明はこれに限らず、例えば計算式の形態や使用する説明変数は任意のものが用いられる。
説明変数は、例えば平均気温の二乗値であってもよく、さらにこれら変数を含めた計画行列として用いられてもよい。これにより、モデルは線形式とされつつも、予測対象及び属性の間に存在する非線形な関係がモデルとして表現され得る。具体的には、標本値から第2の標本値を算出するのと同様に、第2の標本値から第3の標本値を算出する。
また上述の補正値算出モジュール309の第1の実施の形態においては、説明変数として使用する属性を予め一意に設定した場合について述べたが、本発明はこれに限らず、例えばリッジ回帰やラッソ回帰又はエラスティックネットなど、説明変数が自動的に選択される方法を採用してもよい。なお、主成分回帰や部分最小二乗法の説明変数から新たな成分を算出するような方法を採用してもよいし、ニューラルネットワークの非線形なモデルを使用する方法を採用してもよい。
何れの方法を採用する場合においても、適時性指標値設定モジュール306が算出する適時性を示す指標値はモデル同定時に使用されてもよく、これにより図11を用いて説明したものと同様の効果を得ることができるのみならず、適時性に応じた説明変数が自動選択され得る。換言すれば、このことで補正用データの算出の演算に用いるモデルの変更が行われ得る。
また上述の補正値算出モジュール309の第1の実施の形態においては、補正用データである予測対象期間内の任意の時刻における予測対象の予測値、予測対象期間内の任意の期間における最大値や最小値の予測値又は積算値の予測値のうち、何れかが使用されるかは予め設定されるようにした場合について述べたが、本発明はこれに限らず、例えば、信頼性指標値設定モジュール307が算出した信頼性を示す指標値に基づいて、自動的に設定されるようにしてもよい。
具体的には、各補正用データに対する信頼性の指標値を比較し、信頼性が高い順に予め設定した順位までの補正用データを、以降の代表曲線補正モジュール310で使用するとしてもよい。また、最も高い信頼性を示す指標値を“1”に、最も低い信頼性を示す指標値を“0”になるように各補正用データの信頼性を示す指標値を標準化した上で、すべての補正用データを以降の代表曲線補正モジュール310で使用するとしてもよい。
この場合、指標値が“0”である補正用データは、結果として曲線補正には使用されることは無く、従って補正用データの自動的な選択が達成される。また各補正用データの指標値のべき乗を新たな指標値とする信頼性を示す指標値の大小の差を極端なもとのする補正がされてもよい。この場合、最も大きい指標値に対し、最も小さい指標値は相対的に“0”と等しくなるため、前述の指標値が“0”の場合と同様に、結果として曲線補正には、最も小さい指標値は現実的には使用されず、従って補正用データの自動的な選択が達成される。
(6-3)代表曲線補正モジュールの第2の実施の形態
上述の代表曲線補正モジュール310の第1の実施の形態においては、予測対象の時間推移を示す曲線の振幅、周波数又はその両方の変更のみを代表曲線補正モジュール310が行う補正処理とするようにした場合について述べたが、本発明はこれに限らず、例えば、振幅、周波数又はその両方の変更によって算出された最終的な予測値に、季節特異な、又は、曜日特異な誤差が定常的に発生する場合、これは予測系に残存する潜在的な偏差であることから、この定常的な偏差を補正する処理を加えるようにしてもよい。
上述の代表曲線補正モジュール310の第1の実施の形態においては、予測対象の時間推移を示す曲線の振幅、周波数又はその両方の変更のみを代表曲線補正モジュール310が行う補正処理とするようにした場合について述べたが、本発明はこれに限らず、例えば、振幅、周波数又はその両方の変更によって算出された最終的な予測値に、季節特異な、又は、曜日特異な誤差が定常的に発生する場合、これは予測系に残存する潜在的な偏差であることから、この定常的な偏差を補正する処理を加えるようにしてもよい。
図8では、振幅補正モジュール310A1及び周波数補正モジュール310A2を経て算出された補正後の曲線を最終的な予測値として出力していたが、本実施の形態では、図9に示すように、定常偏差補正モジュール310A3が、補正後の曲線と事後的に観測される需要実績情報406を用いて、上記の定常的な偏差の補正を行い、最終的な予測値として予測結果情報313に格納する。このことで、代表曲線補正モジュール310は定常的に発生する誤差を事前に補正する。
具体的には、図10に示すように、代表曲線補正モジュール310は定常偏差補正モジュール310A3をさらに備える。定常偏差補正モジュール310A3は、補正後の曲線310A2B及び事後的に観測される需要実績情報406の差である偏差を算出する。そして定常偏差量推定モジュール310A31は、残差を説明するモデルを同定し、同定したモデルによって、予測対象期間において発生し得る残差の推定値を算出する。算出された残差の推定値が補正後の曲線310A2Bに加算されることで、最終的な予測値が算出される。
ここで、定常偏差量推定モジュール310A31で使用されるアルゴリズムは、例えば、図4を用いて説明した代表曲線算出モジュール308のアルゴリズムでもよい。すなわち、入力としていた需要実績情報406を、補正後の曲線310A2B及び事後的に観測される需要実績情報406の差である偏差に置き換える。
このアルゴリズムによって、時間単位クラスタリング処理モジュール308A1及び時間単位プロファイリング処理モジュール308A2と同様の処理を経て、予測対象期間において発生し得る残差の曲線が算出される。
この際、入力される残差に対する正規化処理は省くことで、出力される残差の曲線は量の情報を含んだ推定残差そのものとなる。また、ARモデルやARIMAモデルで代表される時系列解析の手法を用いて、予測対象期間において発生し得る残差の曲線が算出されてもよい。以上の様に、定常偏差補正モジュール310A3は、予測系において説明しきれていない予測対象の微細な変動を補正することができる。
さらに定常偏差量推定モジュール310A31におけるモデル同定の際に、適時性指標値設定モジュール306が算出した適時性を示す指標値が使用されてもよい。ただしここでの適時性指標値設定モジュール306への入力は、上記の残差とする。
すなわち、過去に発生した残差それぞれの適時性を示す指標値を適用することで、予測対象期間に発生し得る定常偏差としてよりもっともらしい値が算出され得る。換言すれば、適時性に応じて補正の演算に用いるモデルが適宜変更されることで、最終的な予測精度を向上することができる。
(7)他の実施の形態
なお上述の実施形態においては、適時性及び信頼性を示す指標値は、それぞれ適時性指標値設定モジュール306及び信頼性指標値設定モジュール307で算出されるようにした場合について述べたが、本発明はこれに限らず、例えば、適時性及び信頼性の指標値のそれぞれについて、予め設定した値が直接的に使用されるようにしてもよい。
なお上述の実施形態においては、適時性及び信頼性を示す指標値は、それぞれ適時性指標値設定モジュール306及び信頼性指標値設定モジュール307で算出されるようにした場合について述べたが、本発明はこれに限らず、例えば、適時性及び信頼性の指標値のそれぞれについて、予め設定した値が直接的に使用されるようにしてもよい。
また上述の実施形態においては、説明を簡単にするために、表示部を省略するようにした場合について述べたが、本発明はこれに限らず、例えば、各処理モジュールの算出結果や各処理モジュールの中間結果が、ディスプレイやプリンタの出力装置を通じて、適宜表示されてもよい。
さらに上述の実施形態においては、電力の需要を予測するようにした場合について述べたが、本発明はこれに限らず、時間推移を伴って観測される時系列データが存在する対象であれば適用してもよい。時間推移を伴って観測される時系列データとは、例えば太陽光発電や風力発電の発電量、電力取引所で売買される電力商品の約定価格、出来高などである。
また電力の分野に限らず、例えば通信事業における基地局の通信量、ある局所的な車両や人の通行量など同じく時間推移を伴って観測される時系列データが存在する分野を対象に広く適用することができる。
1……需給管理システム、2……電気事業者システムモジュール、3……需給管理者システムモジュール、4……営業管理者システムモジュール、5……取引管理者システムモジュール、6……設備管理者システムモジュール、7……系統運用者システムモジュール、8……取引市場運用者システムモジュール、9……公共情報提供者システムモジュール、10……需要家システムモジュール、30……予測演算装置、31……情報入出力端末、40……販売管理装置、50……取引管理装置、60……設備管理装置、61……制御装置、70……系統情報管理装置、80……市場運用管理装置、90……公共情報配信装置、111……ネットワーク、112……ネットワーク。
Claims (15)
- 任意期間における予測を適応する予測対象について、当該予測対象に関連する予測値を算出する予測システムであって、
前記予測値を算出するために利用される複数のデータを記録する記憶装置と、
所定の演算モデルを備え、当該演算モデルに前記複数のデータを適用して前記予測値を算出する制御装置と
を備え、
前記制御装置は、
前記複数のデータそれぞれの時間属性の情報に基づいて決定されたデータを用いて、前記演算モデルを変更するようにした
予測システム。 - 前記制御装置は、
前記複数のデータそれぞれの変動範囲の情報に基づいて、前記演算モデルに適用するデータを変更する
請求項1記載の予測システム。 - 前記制御装置は、
前記任意期間における前記予測対象の前記予測値の時間推移を示す曲線を算出する第1のモジュールと、
前記曲線を補正することに基づいて、前記予測値を算出する第2のモジュールと、
前記時間属性の情報又は前記複数のデータそれぞれの変動範囲の情報に基づいて、前記曲線を補正するための前記演算モデルである曲線補正演算モデル、前記曲線を算出するための前記演算モデルである曲線算出演算モデル及び前記曲線の補正値を算出するための前記演算モデルである補正値算出演算モデルの少なくとも一つを変更する第3のモジュールと
を備えることを特徴とする請求項2記載の予測システム。 - 前記第2のモジュールは、前記予測対象の前記予測値の時間推移を示す前記曲線を変更することを、前記曲線の振幅及び前記曲線の周波数の少なくとも一方に基づいて実行する、請求項3記載の予測システム。
- 前記第3のモジュールは、
前記複数のデータそれぞれの変動範囲の情報を、前記予測対象の特性を示すデータの時間推移を示す前記曲線を補正するための補正値の量的な変動幅及び時間的な変動幅の少なくとも一方の変動幅からなるようにした
請求項3記載の予測システム。 - 前記第3のモジュールは、
補正値それぞれの変動範囲の情報を用いて、前記補正値それぞれの変動範囲が最も小さい前記補正値に対して適合するように、前記曲線補正演算モデルを変更する
請求項3記載の予測システム。 - 前記制御装置は、
前記時間属性の情報に基づいて決定されたデータを前記曲線又は前記補正値のそれぞれの算出に用いて、予測対象期間との時間的な相関関係を示すようにした
請求項3記載の予測システム。 - 前記第1のモジュールは、
前記時間属性の情報に基づいて、前記曲線を算出するための前記データを選別及び前記曲線の算出に対する前記データの影響度合いの重み付けの少なくとも一方を行うことで新たな第2のデータを算出し、
前記第3のモジュールは、
算出した前記第2のデータに対する適合性が最も高くなるように、前記曲線算出演算モデルを変更する
請求項3記載の予測システム。 - 前記第1のモジュールは、
前記時間属性の情報に基づいて、前記曲線を算出するための前記データの選別及び前記曲線の算出に対する前記データの影響度合いの重み付けの少なくとも一方を行うことで新たな第2のデータを算出し、
前記第3のモジュールは、
算出した前記第2のデータに対する適合性が最も高くなるように、前記補正値算出演算モデルを変更する
請求項3記載の予測システム。 - 前記第1のモジュールは、
前記補正値算出演算モデルにおいて用いる変数のうち、任意の一部の変数又はすべての変数を任意の線形又は非線形な関数に入力することで変数値を算出し、
前記変数値による第2のデータを算出し、
前記第2のデータそれぞれの前記時間属性の情報に基づいて、前記曲線を算出するための前記第2のデータの選別及び前記曲線の算出に対する前記データの影響度合いの重み付けの少なくとも一方を行うことで新たな第3のデータを算出し、
前記第3のモジュールは、
算出した前記第3のデータに対する適合性が最も高くなるように、前記曲線算出演算モデルを変更する
請求項3記載の予測システム。 - 前記第3のモジュールは、
前記複数のデータそれぞれの変動範囲の情報に基づいて、前記複数のデータそれぞれの変動範囲が小さい前記補正値算出演算モデルの選別及び重み付けの少なくとも一方を行うことで、前記補正値算出演算モデルを変更する
請求項3記載の予測システム。 - 前記補正値は、
予測対象期間内の任意の期間それぞれにおける最大値及び最小値の少なくとも一方についての量及び時間の少なくとも一方並びに前記複数のデータそれぞれの変動範囲の少なくとも1つで構成される
請求項3記載の予測システム。 - 前記補正値は、
予測対象期間内の任意の時刻それぞれにおける前記予測対象の前記予測値及び前記複数のデータそれぞれの変動範囲の少なくとも一方で構成される
請求項3記載の予測システム。 - 前記補正値は、
前記第2のモジュールにおいて使用される前記曲線を補正するための係数値及び前記変動範囲の少なくとも一方で構成される
請求項3記載の予測システム。 - 任意期間における予測を適応する予測対象について、当該予測対象に関連する予測値を制御装置が算出するようにした予測方法であって、
前記制御装置は、前記予測値を算出するために利用される複数のデータを記憶装置から読み出し、
前記複数のデータに所定の演算モデルを適用して前記予測値を算出し、
前記複数のデータそれぞれの時間属性の情報に基づいて、前記演算モデルを変更する
予測方法。
Priority Applications (2)
| Application Number | Priority Date | Filing Date | Title |
|---|---|---|---|
| US16/332,054 US11107094B2 (en) | 2016-12-05 | 2017-11-15 | Prediction system and prediction method |
| EP17877683.7A EP3550499A4 (en) | 2016-12-05 | 2017-11-15 | PREDICTION SYSTEM AND PREDICTION METHOD |
Applications Claiming Priority (2)
| Application Number | Priority Date | Filing Date | Title |
|---|---|---|---|
| JP2016-236189 | 2016-12-05 | ||
| JP2016236189A JP6735219B2 (ja) | 2016-12-05 | 2016-12-05 | 予測システム及び予測方法 |
Publications (1)
| Publication Number | Publication Date |
|---|---|
| WO2018105341A1 true WO2018105341A1 (ja) | 2018-06-14 |
Family
ID=62490894
Family Applications (1)
| Application Number | Title | Priority Date | Filing Date |
|---|---|---|---|
| PCT/JP2017/041168 WO2018105341A1 (ja) | 2016-12-05 | 2017-11-15 | 予測システム及び予測方法 |
Country Status (4)
| Country | Link |
|---|---|
| US (1) | US11107094B2 (ja) |
| EP (1) | EP3550499A4 (ja) |
| JP (1) | JP6735219B2 (ja) |
| WO (1) | WO2018105341A1 (ja) |
Families Citing this family (11)
| Publication number | Priority date | Publication date | Assignee | Title |
|---|---|---|---|---|
| JP6735219B2 (ja) | 2016-12-05 | 2020-08-05 | 株式会社日立製作所 | 予測システム及び予測方法 |
| US11137926B1 (en) * | 2018-03-30 | 2021-10-05 | Veritas Technologies Llc | Systems and methods for automatic storage tiering |
| US11080726B2 (en) * | 2018-08-30 | 2021-08-03 | Oracle International Corporation | Optimization of demand forecast parameters |
| US11727335B2 (en) * | 2019-01-11 | 2023-08-15 | Johnson Controls Tyco IP Holdings LLP | Systems and methods for managing energy usage intensity of buildings |
| JP7157683B2 (ja) * | 2019-03-12 | 2022-10-20 | 株式会社東芝 | 情報処理装置、情報処理方法及びコンピュータプログラム |
| CN111179111B (zh) * | 2019-12-06 | 2023-11-14 | 国网辽宁省电力有限公司经济技术研究院 | 基于基尼系数公平性的火电机组年度电量计划制定方法 |
| JP7474623B2 (ja) * | 2020-03-27 | 2024-04-25 | 本田技研工業株式会社 | 電力算出装置 |
| CN112381669B (zh) * | 2020-11-20 | 2023-01-24 | 广东电网有限责任公司电力科学研究院 | 一种台风下配网系统的安全预警方法及装置 |
| CN114066079B (zh) * | 2021-11-22 | 2022-11-25 | 北京白龙马云行科技有限公司 | 一种基于多租户的网约车供需差预测方法及装置 |
| CN114757722B (zh) * | 2022-06-09 | 2023-11-14 | 荣耀终端有限公司 | 一种电子设备的销量预测方法和装置 |
| CN117371339B (zh) * | 2023-12-08 | 2024-03-26 | 西电济南变压器股份有限公司 | 基于物联网的变压器运行监测系统 |
Citations (4)
| Publication number | Priority date | Publication date | Assignee | Title |
|---|---|---|---|---|
| JP2007199862A (ja) * | 2006-01-24 | 2007-08-09 | Nippon Telegr & Teleph Corp <Ntt> | エネルギー需要予測方法、予測装置、プログラム、および記録媒体 |
| JP2014180187A (ja) * | 2013-03-15 | 2014-09-25 | Toshiba Corp | 電力需要予測装置、方法及びプログラム並びに需要抑制計画策定装置 |
| JP2015090691A (ja) * | 2013-11-07 | 2015-05-11 | 株式会社エヌ・ティ・ティ・データ | 予測装置、予測方法、及びプログラム |
| WO2016088370A1 (ja) * | 2014-12-05 | 2016-06-09 | 日本電気株式会社 | 情報処理装置、モデル構築方法及びプログラム記録媒体 |
Family Cites Families (19)
| Publication number | Priority date | Publication date | Assignee | Title |
|---|---|---|---|---|
| DE69520934T2 (de) * | 1994-09-26 | 2001-10-04 | Toshiba Kawasaki Kk | Methode und system zur optimierung der nützlichkeit einer anlage |
| US6032123A (en) * | 1997-05-12 | 2000-02-29 | Jameson; Joel | Method and apparatus for allocating, costing, and pricing organizational resources |
| US7343311B2 (en) * | 2002-03-01 | 2008-03-11 | I2 Technologies Us, Inc. | Generating an optimized supplier allocation plan |
| US7072723B2 (en) * | 2002-10-23 | 2006-07-04 | Clearsight Systems Inc. | Method and system for optimization of general problems |
| JP5029822B2 (ja) * | 2007-07-31 | 2012-09-19 | 東芝ライテック株式会社 | 光源および照明装置 |
| US9137815B2 (en) * | 2009-06-17 | 2015-09-15 | Qualcomm Incorporated | Multi-user multiple input multiple output wireless communications |
| JP5618501B2 (ja) * | 2009-07-14 | 2014-11-05 | 株式会社東芝 | 需要予測装置、プログラムおよび記録媒体 |
| US8880202B2 (en) * | 2010-07-09 | 2014-11-04 | Emerson Process Management Power & Water Solutions, Inc. | Optimization system using an iteratively coupled expert engine |
| US8370283B2 (en) * | 2010-12-15 | 2013-02-05 | Scienergy, Inc. | Predicting energy consumption |
| US9792568B2 (en) * | 2011-12-23 | 2017-10-17 | Hewlett Packard Enterprise Development Lp | Generating a capacity schedule for a facility |
| WO2015087470A1 (ja) * | 2013-12-10 | 2015-06-18 | パナソニックIpマネジメント株式会社 | 需要予測装置、プログラム |
| JP6334177B2 (ja) * | 2014-01-16 | 2018-05-30 | 株式会社東芝 | 運転計画作成装置、制御装置、運転計画作成方法、およびプログラム |
| CN106796618A (zh) * | 2014-10-21 | 2017-05-31 | 株式会社日立制作所 | 时序预测装置和时序预测方法 |
| CN104573879B (zh) * | 2015-01-30 | 2017-07-25 | 河海大学 | 基于最优相似日集的光伏电站出力预测方法 |
| JP6408451B2 (ja) | 2015-05-21 | 2018-10-17 | 株式会社日立製作所 | エネルギー需要予測システム及びエネルギー需要予測方法 |
| JP6720562B2 (ja) * | 2016-02-10 | 2020-07-08 | 富士電機株式会社 | 制御装置、制御システム、制御プログラム、及び制御方法 |
| JP6735219B2 (ja) | 2016-12-05 | 2020-08-05 | 株式会社日立製作所 | 予測システム及び予測方法 |
| JP7319757B2 (ja) | 2016-12-05 | 2023-08-02 | 株式会社日立製作所 | データ処理システム及びデータ処理方法 |
| JP6831280B2 (ja) | 2017-03-24 | 2021-02-17 | 株式会社日立製作所 | 予測システム、及び、予測方法 |
-
2016
- 2016-12-05 JP JP2016236189A patent/JP6735219B2/ja active Active
-
2017
- 2017-11-15 WO PCT/JP2017/041168 patent/WO2018105341A1/ja active Application Filing
- 2017-11-15 EP EP17877683.7A patent/EP3550499A4/en not_active Withdrawn
- 2017-11-15 US US16/332,054 patent/US11107094B2/en active Active
Patent Citations (4)
| Publication number | Priority date | Publication date | Assignee | Title |
|---|---|---|---|---|
| JP2007199862A (ja) * | 2006-01-24 | 2007-08-09 | Nippon Telegr & Teleph Corp <Ntt> | エネルギー需要予測方法、予測装置、プログラム、および記録媒体 |
| JP2014180187A (ja) * | 2013-03-15 | 2014-09-25 | Toshiba Corp | 電力需要予測装置、方法及びプログラム並びに需要抑制計画策定装置 |
| JP2015090691A (ja) * | 2013-11-07 | 2015-05-11 | 株式会社エヌ・ティ・ティ・データ | 予測装置、予測方法、及びプログラム |
| WO2016088370A1 (ja) * | 2014-12-05 | 2016-06-09 | 日本電気株式会社 | 情報処理装置、モデル構築方法及びプログラム記録媒体 |
Non-Patent Citations (1)
| Title |
|---|
| See also references of EP3550499A4 * |
Also Published As
| Publication number | Publication date |
|---|---|
| US20190370832A1 (en) | 2019-12-05 |
| JP6735219B2 (ja) | 2020-08-05 |
| EP3550499A1 (en) | 2019-10-09 |
| US11107094B2 (en) | 2021-08-31 |
| JP2018092445A (ja) | 2018-06-14 |
| EP3550499A4 (en) | 2020-05-27 |
Similar Documents
| Publication | Publication Date | Title |
|---|---|---|
| WO2018105341A1 (ja) | 予測システム及び予測方法 | |
| JP6837949B2 (ja) | 予測システム及び方法 | |
| JP7319757B2 (ja) | データ処理システム及びデータ処理方法 | |
| JP6895416B2 (ja) | エネルギー需要予測システム及びエネルギー需要予測方法 | |
| US11593690B2 (en) | Data prediction system and data prediction method | |
| JP2018092439A5 (ja) | ||
| US20190228329A1 (en) | Prediction system and prediction method | |
| US8374903B2 (en) | Information criterion-based systems and methods for constructing combining weights for multimodel forecasting and prediction | |
| Aytac et al. | Characterization of demand for short life-cycle technology products | |
| Park et al. | A framework for baseline load estimation in demand response: Data mining approach | |
| Feng et al. | Toward scalable stochastic unit commitment. Part 1: load scenario generation | |
| Mařík et al. | Decision support tools for advanced energy management | |
| Dvorkin Jr et al. | Electricity market equilibrium under information asymmetry | |
| WO2017212880A1 (ja) | データ予測システムおよびデータ予測方法 | |
| WO2016185919A1 (ja) | エネルギー需要予測システム及びエネルギー需要予測方法 | |
| KR102266494B1 (ko) | 수요반응을 위한 딥러닝 기반 고객 분류 장치 및 방법 | |
| Gajowniczek et al. | Seasonal peak demand classification with machine learning techniques | |
| WO2024014035A1 (ja) | データ予測支援方法およびデータ予測システム | |
| Oliveira et al. | Long-Term Energy Consumption Forecast for a Commercial Virtual Power Plant Using a Hybrid K-means and Linear Regression Algorithm | |
| US20240146580A1 (en) | Estimation system and estimation method | |
| Konda | Peak Load Forecast using Long Short Term Memory Networks. | |
| Li et al. | Research on load forecasting of integrated energy system based on multi-dimensional factor uncertainty | |
| Zhao | Research on E-Commerce Retail Demand Forecasting Based on SARIMA Model and K-means Clustering Algorithm | |
| Ouyang et al. | Trending Device Readiness and Device Return Rate | |
| Kumar et al. | A deep clustering framework for load pattern segmentation |
Legal Events
| Date | Code | Title | Description |
|---|---|---|---|
| 121 | Ep: the epo has been informed by wipo that ep was designated in this application |
Ref document number: 17877683 Country of ref document: EP Kind code of ref document: A1 |
|
| NENP | Non-entry into the national phase |
Ref country code: DE |
|
| WWE | Wipo information: entry into national phase |
Ref document number: 2017877683 Country of ref document: EP |