WO2015083284A1 - 粒度分布測定用データ処理装置及びこれを備えた粒度分布測定装置、並びに、粒度分布測定用データ処理方法及び粒度分布測定用データ処理プログラム - Google Patents
粒度分布測定用データ処理装置及びこれを備えた粒度分布測定装置、並びに、粒度分布測定用データ処理方法及び粒度分布測定用データ処理プログラム Download PDFInfo
- Publication number
- WO2015083284A1 WO2015083284A1 PCT/JP2013/082804 JP2013082804W WO2015083284A1 WO 2015083284 A1 WO2015083284 A1 WO 2015083284A1 JP 2013082804 W JP2013082804 W JP 2013082804W WO 2015083284 A1 WO2015083284 A1 WO 2015083284A1
- Authority
- WO
- WIPO (PCT)
- Prior art keywords
- particle size
- distribution data
- refractive index
- size distribution
- light intensity
- Prior art date
- Legal status (The legal status is an assumption and is not a legal conclusion. Google has not performed a legal analysis and makes no representation as to the accuracy of the status listed.)
- Ceased
Links
Images


Classifications
-
- G—PHYSICS
- G01—MEASURING; TESTING
- G01N—INVESTIGATING OR ANALYSING MATERIALS BY DETERMINING THEIR CHEMICAL OR PHYSICAL PROPERTIES
- G01N15/00—Investigating characteristics of particles; Investigating permeability, pore-volume or surface-area of porous materials
- G01N15/02—Investigating particle size or size distribution
- G01N15/0205—Investigating particle size or size distribution by optical means
- G01N15/0211—Investigating a scatter or diffraction pattern
-
- G—PHYSICS
- G01—MEASURING; TESTING
- G01N—INVESTIGATING OR ANALYSING MATERIALS BY DETERMINING THEIR CHEMICAL OR PHYSICAL PROPERTIES
- G01N15/00—Investigating characteristics of particles; Investigating permeability, pore-volume or surface-area of porous materials
- G01N15/02—Investigating particle size or size distribution
- G01N2015/0277—Average size only
Definitions
- the present invention includes a data processing device for particle size distribution measurement for generating particle size distribution data based on light intensity distribution data obtained by receiving diffraction scattered light from a sample with a plurality of light receiving elements, and the same.
- the present invention relates to a particle size distribution measuring apparatus, a particle size distribution measuring data processing method, and a particle size distribution measuring data processing program.
- a particle size distribution measuring device for generating particle size distribution data by measuring the relationship between the particle size and the amount of particles contained in a sample is known (for example, see Patent Document 1 below).
- the diffraction scattered light of the light irradiated on the sample is received by a plurality of light receiving elements, and the light intensity distribution data obtained thereby is calculated using a refractive index. Particle size distribution data can be generated.
- the refractive index as described above is generally preset by an operator. In order to obtain accurate particle size distribution data, it is necessary to set the refractive index accurately. However, if the operator does not know the refractive index, it is difficult to set the refractive index accurately. Even if the operator obtains the refractive index according to the particle material from the literature, the diffraction scattered light changes even if the refractive index is the same depending on the particle shape, etc. It is not always accurate.
- Patent Document 1 proposes a technique for automatically determining a refractive index range by performing calculation using a plurality of refractive indexes for one light intensity distribution data. Specifically, by performing calculation using a plurality of refractive indexes for one light intensity distribution data, the particle size distribution data corresponding to each refractive index is converted, and then the particle size distribution data is converted into the light intensity distribution. The refractive index range is automatically determined based on the degree of coincidence between the inversely converted light intensity distribution data and the original light intensity distribution data.
- the optimum refractive index range is surely determined. Not limited to this, when the same sample is measured a plurality of times, different refractive index ranges may be determined.
- the refractive index range determined by each measurement may be different.
- the refractive index range determined by the measurement may be different.
- the present invention has been made in view of the above circumstances, and a data processing device for particle size distribution measurement capable of determining a more optimal refractive index, a particle size distribution measuring device including the same, and data for particle size distribution measurement
- An object is to provide a processing method and a data processing program for particle size distribution measurement.
- the particle size distribution measuring apparatus includes a data input receiving unit, a particle size distribution data generating unit, and a refractive index determining unit.
- the data input receiving unit receives input of a plurality of light intensity distribution data obtained by receiving diffraction scattered light from the same sample a plurality of times by a plurality of light receiving elements.
- the particle size distribution data generation unit generates particle size distribution data corresponding to each refractive index by performing an operation using a plurality of refractive indexes on the plurality of light intensity distribution data.
- the refractive index determination unit determines an optimal refractive index based on a plurality of refractive indexes used when generating particle size distribution data.
- particle size distribution data corresponding to each refractive index is generated by performing calculations using a plurality of refractive indexes on a plurality of light intensity distribution data obtained from the same sample.
- the optimum refractive index can be determined based on the plurality of refractive indexes used at that time.
- a more optimal refractive index can be determined by determining the refractive index based on a plurality of light intensity distribution data instead of a single light intensity distribution data.
- the particle size distribution data generation unit performs a calculation using a plurality of common refractive indexes on the plurality of light intensity distribution data, thereby obtaining a particle size corresponding to the plurality of refractive indexes for each light intensity distribution data.
- Distribution data may be generated.
- the particle size distribution measuring apparatus may further include a data comparison unit that compares particle size distribution data calculated from different light intensity distribution data using a common refractive index.
- the refractive index determination unit may determine an optimal refractive index from the plurality of refractive indexes based on a comparison result by the data comparison unit.
- a calculation using a plurality of common refractive indexes is performed, and by comparing each particle size distribution data generated thereby, a plurality of An optimum refractive index can be determined from the refractive indexes.
- the particle size distribution data calculated from different light intensity distribution data using a common refractive index are compared, and for example, the refractive index used when generating the particle size distribution data having the highest degree of coincidence is used as the optimum refractive index. Therefore, a more optimal refractive index can be determined.
- the particle size distribution data generation unit performs an operation on the plurality of light intensity distribution data using a plurality of refractive indexes selected within a predetermined numerical value range, thereby obtaining the light intensity distribution data for each light intensity distribution data. Particle size distribution data corresponding to a plurality of refractive indexes may be generated.
- calculation is performed on a plurality of light intensity distribution data using only a plurality of refractive indexes selected within a predetermined numerical range according to components in the sample.
- the optimum refractive index can be determined based on the plurality of refractive indexes used in the above. Since the numerical range of the refractive index is determined to some extent depending on the components in the sample, the optimum refractive index can be efficiently determined by using only a plurality of refractive indexes selected within the numerical range.
- the particle size distribution measuring apparatus may further include a refractive index calculating unit that automatically calculates a refractive index corresponding to each of the plurality of light intensity distribution data.
- the particle size distribution data generation unit uses a plurality of refractive indexes including a refractive index corresponding to each light intensity distribution data calculated by the refractive index calculation unit, for the plurality of light intensity distribution data. By performing the calculation, particle size distribution data corresponding to the plurality of refractive indexes may be generated for each light intensity distribution data.
- calculation is performed on a plurality of light intensity distribution data using only a plurality of refractive indexes including a refractive index corresponding to each light intensity distribution data calculated automatically, and used at that time.
- An optimum refractive index can be determined based on a plurality of refractive indexes.
- the refractive index determination unit may determine an average refractive index value corresponding to each light intensity distribution data calculated by the refractive index calculation unit as an optimal refractive index.
- the average refractive index value corresponding to each automatically calculated light intensity distribution data is determined as the optimum refractive index.
- the refractive index values can be narrowed down to some extent, and by calculating the average value thereof, the optimal refractive index can be determined efficiently.
- the refractive index determination unit may determine the refractive index having the highest appearance frequency as the optimum refractive index among the refractive indexes corresponding to the respective light intensity distribution data calculated by the refractive index calculation unit.
- the refractive index having the highest appearance frequency among the refractive indexes corresponding to each light intensity distribution data automatically calculated is determined as the optimal refractive index.
- the value of the refractive index can be narrowed down to some extent, so by selecting the refractive index with the highest appearance frequency from among them, the optimal refractive index can be determined efficiently. it can.
- a particle size distribution measuring apparatus includes a light source that irradiates a sample with light, a plurality of light receiving elements that receive diffraction scattered light from the sample, and the data processing apparatus for particle size distribution measurement.
- the particle size distribution data processing method includes a data input reception step, a particle size distribution data generation step, and a refractive index determination step.
- the data input receiving step input of a plurality of light intensity distribution data obtained by receiving diffraction scattered light from the same sample by a plurality of light receiving elements a plurality of times is received.
- the particle size distribution data generation step particle size distribution data corresponding to each refractive index is generated by performing an operation using a plurality of refractive indexes on the plurality of light intensity distribution data.
- an optimum refractive index is determined based on a plurality of refractive indexes used when generating the particle size distribution data.
- the particle size distribution data processing program causes a computer to function as a data input receiving unit, a particle size distribution data generating unit, and a refractive index determining unit.
- the data input receiving unit receives input of a plurality of light intensity distribution data obtained by receiving diffraction scattered light from the same sample a plurality of times by a plurality of light receiving elements.
- the particle size distribution data generation unit generates particle size distribution data corresponding to each refractive index by performing an operation using a plurality of refractive indexes on the plurality of light intensity distribution data. In the refractive index determination, an optimum refractive index is determined based on a plurality of refractive indexes used when generating the particle size distribution data.
- the present invention it is possible to determine a more optimal refractive index by determining the refractive index based on a plurality of light intensity distribution data instead of one light intensity distribution data.
- FIG. 1 is a diagram showing a configuration example of a particle size distribution measuring apparatus according to the first embodiment of the present invention.
- This particle size distribution measuring apparatus is for generating particle size distribution data by measuring the relationship between the particle size and the amount of particles of a particle group contained in a sample, and is a measuring unit 1 for measuring a sample. It has.
- the measurement unit 1 includes a light source 11, a condensing lens 12, a spatial filter 13, a collimator lens 14, a flow cell 15, a condensing lens 16, a photodiode array 17, and the like.
- a sample to be measured is supplied to the flow cell 15 from a supply source such as a circulation sampler 2 in which an ultrasonic transducer is incorporated.
- the light source 11 is composed of, for example, a laser light source, and the measurement light emitted from the light source 11 becomes parallel light by passing through the condenser lens 12, the spatial filter 13, and the collimator lens 14.
- the measurement light thus converted into parallel light is applied to the flow cell 15 to which the sample is supplied, diffracted and scattered by the particle group included in the sample in the flow cell 15, and then passed through the condenser lens 16 to obtain a photo.
- Light is received by the diode array 17.
- the photodiode array 17 constitutes a detector for detecting diffraction scattered light from the sample.
- a plurality of (for example, 64) light receiving elements in which ring-shaped or semi-ring-shaped detection surfaces having different radii are formed are arranged concentrically around the optical axis of the condenser lens 16.
- the detection signal of each light receiving element of the photodiode array 17 represents the intensity of light at each diffraction scattering angle.
- the detection signals of the respective light receiving elements of the photodiode array 17 are converted from analog signals to digital signals by the A / D converter 3 and then input to the data processing device 5 via the communication unit 4. .
- light intensity distribution data in which the element number of each light receiving element of the photodiode array 17 is associated with the detected intensity in each light receiving element is input to the data processing device 5.
- the data processing device 5 constitutes a data processing device for particle size distribution measurement for processing data when measuring the particle size distribution of the sample.
- the data processing device 5 is configured by a computer, for example, and includes a control unit 51, an operation unit 52, a display unit 53, a storage unit 54, and the like.
- the control unit 51 includes, for example, a CPU (Central Processing Unit), and each unit such as an operation unit 52, a display unit 53, and a storage unit 54 is electrically connected.
- the operation unit 52 includes, for example, a keyboard and a mouse, and the user can perform input work and the like by operating the operation unit 52.
- the display unit 53 can be configured by, for example, a liquid crystal display, and the user can work while confirming the display content of the display unit 53.
- the storage unit 54 can be configured by, for example, a ROM (Read Only Memory), a RAM (Random Access Memory), a hard disk, and the like.
- FIG. 2 is a block diagram for explaining a specific configuration of the data processing device 5 of FIG.
- the control unit 51 includes a data input reception unit 511, a particle size distribution data generation unit 512, a refractive index selection unit 513, a data comparison unit 514, a refractive index determination unit 515, and a display process when the CPU executes a program. It functions as the unit 516 or the like.
- a light intensity distribution data storage unit 541 and a particle size distribution data storage unit 542 are allocated to the storage unit 54.
- the light intensity distribution data storage unit 541 stores light intensity distribution data input from the measurement unit 1.
- the control unit 51 generates a plurality of particle size distribution data based on the plurality of light intensity distribution data stored in the light intensity distribution data storage unit 541, and stores the particle size distribution data in the particle size distribution data storage unit 542.
- a plurality of light intensity distribution data are obtained by performing measurement a plurality of times by the measurement unit 1. Specifically, an operation of introducing a sample into the circulation sampler 2 and performing measurement a plurality of times (for example, three times) using the sample is performed a plurality of times (for example, by replacing the same sample with the circulation sampler 2). 3 times) Repeatedly. As a result, diffracted and scattered light from the same sample is received by the light receiving elements of the photodiode array 17 a plurality of times, and a plurality (9 in this example) of light intensity distribution data is stored in the light intensity distribution data storage unit 541.
- the measurement unit 1 Specifically, an operation of introducing a sample into the circulation sampler 2 and performing measurement a plurality of times (for example, three times) using the sample is performed a plurality of times (for example, by replacing the same sample with the circulation sampler 2). 3 times) Repeatedly.
- diffracted and scattered light from the same sample is received by the light receiving elements of the
- the data input receiving unit 511 receives input of a plurality of light intensity distribution data stored in the light intensity distribution data storage unit 541 when generating the particle size distribution data.
- the particle size distribution data generation unit 512 generates particle size distribution data corresponding to each refractive index by performing a calculation using a plurality of refractive indexes on the plurality of light intensity distribution data.
- the generated plurality of particle size distribution data is stored in the particle size distribution data storage unit 542.
- the refractive index selection unit 513 selects a plurality of refractive indexes used when the particle size distribution data generation unit 512 generates the particle size distribution data.
- the refractive index selection unit 513 selects a plurality of refractive indexes within a predetermined numerical range, and the particle size distribution data generation unit 512 generates particle size distribution data using these refractive indexes. ing.
- the refractive index selection unit 513 can select a plurality of refractive indexes by, for example, extracting a refractive index at predetermined intervals within the above numerical range.
- the numerical range may be, for example, a numerical range input by operating the operation unit 52 or a numerical range determined based on a component in the sample input by operating the operating unit 52. Good.
- s, q and A are represented by the following formulas (2) to (4).
- the s is light intensity distribution data (vector).
- the q is particle size distribution data (vector) expressed as a frequency distribution%.
- the particle size range to be measured maximum particle size is x 1 , minimum particle size is x n + 1
- each particle size interval is [x j , x j + 1 ]
- J 1, 2,..., N
- A is a coefficient matrix for converting the particle size distribution data q into the light intensity distribution data s.
- each element a i, j in A can be theoretically calculated in advance using the refractive index.
- the particle diameter is sufficiently larger than the wavelength of the measurement light from the light source 11 (for example, 10 times or more), it can be calculated using Fraunhofer diffraction theory.
- the particle diameter is about the same as or smaller than the wavelength of the measurement light from the light source 11, it can be calculated using Mie scattering theory.
- the particle size distribution data q can be obtained by the following equation (6) based on the equation (1).
- AT is a transposed matrix of A.
- FIG. 3 is a diagram for explaining an aspect when generating particle size distribution data.
- calculation using a plurality of common refractive indexes A, B, C,... Is performed for a plurality of light intensity distribution data a, b,.
- the data comparison unit 514 compares the particle size distribution data calculated from different light intensity distribution data using a common refractive index.
- the particle size distribution data a-1, b-1,... Calculated from the different light intensity distribution data a, b,.
- the particle size distribution data a-2, b-2,... Calculated from the different light intensity distribution data a, b,.
- the particle size distribution data a-3, b-3,... Calculated from the different light intensity distribution data a, b,.
- Such processing is performed for all the refractive indexes A, B, C.
- the refractive index determination unit 515 determines an optimum refractive index based on the plurality of refractive indexes A, B, C... Used when generating the particle size distribution data.
- an optimum refractive index can be determined from a plurality of refractive indexes A, B, C... Based on the comparison result by the data comparison unit 514. For example, if the data comparison unit 514 is configured to calculate the degree of coincidence between the particle size distribution data to be compared, the refractive index used when generating the particle size distribution data having the highest degree of coincidence is set to the optimum refraction. What is necessary is just to determine as a rate.
- the display processing unit 516 controls display on the display unit 53.
- the display processing unit 516 may cause the display unit 53 to display the optimal refractive index determined by the refractive index determination unit 515, and display the particle size distribution data corresponding to the determined optimal refractive index on the display unit 53. It may be displayed.
- FIG. 4 is a flowchart showing an example of processing by the control unit 51 when determining the refractive index.
- each light intensity distribution data obtained from the same sample is input from the light intensity distribution data storage unit 541 (step S101: data input receiving step).
- particle size distribution data corresponding to each refractive index is generated by performing calculation using a plurality of refractive indexes for each light intensity distribution data (step S102: particle size distribution data generation step).
- step S103 data comparison step
- step S104 the particle size distribution data having the highest degree of coincidence
- step S105 refractive index determination step
- a plurality of refractive indexes A, B, C,... are obtained for a plurality of light intensity distribution data a, b,.
- particle size distribution data corresponding to each refractive index A, B, C... Is generated, and optimum based on a plurality of refractive indexes A, B, C.
- the refractive index can be determined.
- a more optimal refractive index can be determined.
- calculation is performed on a plurality of light intensity distribution data a, b,... Using a plurality of common refractive indexes A, B, C.
- an optimum refractive index can be determined from among a plurality of refractive indexes A, B, C.
- the particle size distribution data calculated from different light intensity distribution data using a common refractive index is compared, and the refractive index used when generating the particle size distribution data having the highest degree of coincidence is set to the optimum refractive index.
- a more optimal refractive index can be determined.
- a plurality of light intensity distribution data using only a plurality of refractive indexes A, B, C... Selected within a predetermined numerical range according to, for example, components in the sample. .. are calculated, and an optimum refractive index can be determined based on a plurality of refractive indexes A, B, C... used at that time. Since the numerical range of the refractive index is determined to some extent according to the components in the sample, the optimum refractive index can be efficiently obtained by using only a plurality of refractive indexes A, B, C... Selected within the numerical range. Can be well determined.
- FIG. 5 is a block diagram for explaining a specific configuration of the data processing device 5 according to the second embodiment of the present invention.
- the control unit 51 executes a program executed by the CPU, so that the data input reception unit 511, the particle size distribution data generation unit 512, the data comparison unit 514, the refractive index determination unit 515, the display processing unit 516, and the refractive index calculation. It functions as the section 517 and the like.
- the particle size distribution data generation unit 512 performs a calculation using a plurality of refractive indexes on a plurality of light intensity distribution data received from the light intensity distribution data storage unit 541 by the data input reception unit 511. Thus, particle size distribution data corresponding to each refractive index is generated. At this time, by using the relationship of the above formula (6), the particle size distribution data can be generated in the same manner as in the first embodiment.
- the refractive index calculation unit 517 automatically calculates a refractive index corresponding to each of the plurality of light intensity distribution data based on the particle size distribution data generated by the particle size distribution data generation unit 512. Specifically, by using the same coefficient matrix A as the coefficient matrix A corresponding to each refractive index when generating the particle size distribution data, the relationship of the above formula (1) is used to convert each particle size distribution data into light. It converts into intensity distribution data, and compares the converted light intensity distribution data with the original light intensity distribution data. As a result, the refractive index corresponding to the coefficient matrix A used when converting the light intensity distribution data having the highest degree of coincidence is automatically calculated as the refractive index corresponding to the light intensity distribution data.
- the particle size distribution data generation unit 512 uses the refractive index corresponding to each light intensity distribution data calculated by the refractive index calculation unit 517 to perform an operation on each light intensity distribution data again, thereby obtaining each refractive index. Generate particle size distribution data corresponding to. Also in this case, by using the relationship of the above formula (6), the particle size distribution data can be generated in the same manner as in the first embodiment. The generated plurality of particle size distribution data is stored in the particle size distribution data storage unit 542.
- the particle size distribution data generation unit 512 is not limited to a configuration that generates particle size distribution data using only the refractive index corresponding to each light intensity distribution data calculated by the refractive index calculation unit 517. That is, the particle size distribution data generation unit 512 uses a plurality of refractive indexes including a refractive index corresponding to each light intensity distribution data calculated by the refractive index calculation unit 517 and other refractive indexes, to obtain particle size distribution data. May be configured to generate.
- FIG. 6 is a diagram for explaining the process of automatically calculating the refractive index in the second embodiment.
- light intensity distribution data a is obtained by performing calculations using a plurality of refractive indexes for a plurality of light intensity distribution data a, b,. , B,..., Particle size distribution data corresponding to a plurality of refractive indexes is generated.
- the generated particle size distribution data is converted by using each refractive index when generating the particle size distribution data, and the converted light intensity distribution data and the original light intensity distribution data a and b are converted. , ... are compared.
- the refractive indexes A, B,... Corresponding to the light intensity distribution data a, b,.
- a ′, A ′′, and the like represent refractive index candidates that are used as comparison targets when the optimum refractive index A is automatically found from the light intensity distribution data a.
- the refractive indexes A, B,... Automatically calculated in this way are used for processing by the particle size distribution data generation unit 512.
- the particle size distribution data generation unit 512 generates particle size distribution data in the same manner as in FIG. 3 using the refractive indexes A, B,.
- the data comparison unit 514 compares the particle size distribution data in the same manner as in FIG. 3, and the refractive index used when generating the particle size distribution data having the highest degree of coincidence is optimized by the refractive index determination unit 515.
- the refractive index is determined.
- FIG. 7 is a flowchart showing an example of processing by the control unit 51 in the second embodiment.
- each light intensity distribution data obtained from the same sample is input from the light intensity distribution data storage unit 541 (step S201: data input receiving step).
- particle size distribution data corresponding to each refractive index is generated by performing calculation using a plurality of refractive indexes for each light intensity distribution data (step S202: particle size distribution data generation step).
- each particle size distribution data is converted, and the converted light intensity distribution data is compared with the original light intensity distribution data, so that the refractive index corresponding to each light intensity distribution data is automatically calculated based on the comparison result.
- Step S203 Refractive index calculation step.
- the subsequent processing is the same as the processing after step S102 in FIG.
- the refractive index by determining the refractive index based on a plurality of light intensity distribution data a, b,.
- the rate can be determined.
- the particle size distribution data calculated from different light intensity distribution data using a common refractive index are compared, and the refraction used when generating the particle size distribution data having the highest degree of coincidence.
- an optimum refractive index can be determined based on the plurality of refractive indexes A, B,.
- the refractive index value can be narrowed down to some extent, so that the optimum refractive index can be efficiently determined from them.
- FIG. 8 is a block diagram for explaining a specific configuration of the data processing device 5 according to the third embodiment of the present invention.
- the control unit 51 in the present embodiment functions as a data input reception unit 511, a particle size distribution data generation unit 512, a refractive index determination unit 515, a display processing unit 516, a refractive index calculation unit 517, and the like when the CPU executes a program. To do.
- the refractive index determining unit 515 determines the average value of the refractive index corresponding to each light intensity distribution data calculated by the refractive index calculating unit 517 as an optimal refractive index.
- the data input reception unit 511, the particle size distribution data generation unit 512, the processing by the display processing unit 516 and the refractive index calculation unit 517, the data stored in the light intensity distribution data storage unit 541 and the particle size distribution data storage unit 542, etc. Is the same as in the case of the second embodiment. Therefore, about the same structure, the same code
- FIG. 9 is a diagram for explaining the process of calculating the average value of the refractive index in the third embodiment.
- calculations using a plurality of refractive indexes are performed on a plurality of light intensity distribution data a, b,.
- the generated particle size distribution data is converted, and the converted light intensity distribution data is compared with the original light intensity distribution data a, b,.
- Refractive indexes A, B,... Corresponding to the data a, b,.
- a ′, A ′′, and the like represent refractive index candidates that are used as comparison targets when the optimum refractive index A is automatically found from the light intensity distribution data a.
- B ′, B ′′, etc. This is a candidate for a refractive index to be compared when automatically finding the optimum refractive index B from the light intensity distribution data b.
- the refractive indexes A, B,... Automatically calculated in this way are used for processing by the refractive index determining unit 515.
- the refractive index determination unit 515 determines the average value of the refractive indexes A, B,. By automatically calculating the refractive indexes A, B,..., The refractive index values can be narrowed down to some extent. By calculating the average value thereof, the optimum refractive index can be determined efficiently. it can.
- FIG. 10 is a flowchart showing an example of processing by the control unit 51 in the third embodiment.
- each light intensity distribution data obtained from the same sample is input from the light intensity distribution data storage unit 541 (step S301: data input receiving step).
- particle size distribution data corresponding to each refractive index is generated by performing calculation using a plurality of refractive indexes for each light intensity distribution data (step S302: particle size distribution data generation step).
- each particle size distribution data is converted, and the converted light intensity distribution data is compared with the original light intensity distribution data, so that the refractive index corresponding to each light intensity distribution data is automatically calculated based on the comparison result.
- Step S303 Refractive index calculation step
- step S304 refractive index determination step
- FIG. 11 is a flowchart showing an example of processing by the control unit 51 of the data processing device 5 according to the fourth embodiment of the present invention.
- the processing by the refractive index determination unit 515 is different from the third embodiment, and the other processing and configuration are the same as those of the third embodiment.
- each light intensity distribution data obtained from the same sample is input from the light intensity distribution data storage unit 541 (step S401: data input receiving step).
- particle size distribution data corresponding to each refractive index is generated by performing calculation using a plurality of refractive indexes for each light intensity distribution data (step S402: particle size distribution data generation step).
- each particle size distribution data is converted, and the converted light intensity distribution data is compared with the original light intensity distribution data, so that the refractive index corresponding to each light intensity distribution data is automatically calculated based on the comparison result.
- Step S403 Refractive index calculation step.
- the refractive index having the highest appearance frequency is determined as the optimal refractive index (step S404: refractive index determination step).
- the optimum refractive index can be efficiently obtained by selecting the refractive index having the highest appearance frequency from among them. Can be well determined.
- the appearance frequency means a ratio calculated as, for example, a refractive index value, and a refractive index value itself with a high calculated ratio may be determined or calculated as an optimal refractive index. An optimum refractive index may be determined within the range of the refractive index having a high ratio.
- the configuration in which the data processing device 5 for generating the particle size distribution data is provided in the particle size distribution measuring device has been described.
- the configuration is not limited to such a configuration, and a configuration in which the data processing device 5 is provided separately from the particle size distribution measuring device may be used.
- the data output from the measuring unit 1 of the particle size distribution measuring device may be configured to be input to the data processing device 5 via wired communication or wireless communication, or may be a storage medium (not shown). The data may be once stored in () and then input to the data processing device 5 from the storage medium.
- the computer functions as the data processing device for particle size distribution measurement.
- the program may be provided in a state stored in a storage medium, or may be configured such that the program itself is provided via wired communication or wireless communication. .
Landscapes
- Chemical & Material Sciences (AREA)
- Dispersion Chemistry (AREA)
- Physics & Mathematics (AREA)
- Health & Medical Sciences (AREA)
- Life Sciences & Earth Sciences (AREA)
- Analytical Chemistry (AREA)
- Biochemistry (AREA)
- General Health & Medical Sciences (AREA)
- General Physics & Mathematics (AREA)
- Immunology (AREA)
- Pathology (AREA)
- Investigating Or Analysing Materials By Optical Means (AREA)
Abstract
同一の試料から得られる複数の光強度分布データa,b,・・・に対して、それぞれ複数の屈折率A,B,・・・を用いた演算を行うことにより、各屈折率A,B,・・・に対応する粒度分布データを生成し、その際に用いた複数の屈折率A,B,・・・に基づいて最適な屈折率を決定する。このように、1つの光強度分布データではなく、複数の光強度分布データa,b,・・・に基づいて屈折率を決定することによって、より最適な屈折率を決定することができる。
Description
本発明は、試料からの回折散乱光を複数の受光素子で受光することにより得られる光強度分布データに基づいて、粒度分布データを生成するための粒度分布測定用データ処理装置及びこれを備えた粒度分布測定装置、並びに、粒度分布測定用データ処理方法及び粒度分布測定用データ処理プログラムに関するものである。
試料に含まれる粒子群の粒子径と粒子量との関係を測定することにより、粒度分布データを生成するための粒度分布測定装置が知られている(例えば、下記特許文献1参照)。この種の粒度分布測定装置では、試料に照射した光の回折散乱光を複数の受光素子で受光し、これにより得られた光強度分布データに対して屈折率を用いた演算を行うことにより、粒度分布データを生成することができる。
上記のような屈折率は、一般的に、作業者によって予め設定される。正確な粒度分布データを得るためには屈折率を正確に設定する必要があるが、作業者が屈折率を把握していない場合には、屈折率を正確に設定することが困難である。また、仮に作業者が、粒子の素材に応じた屈折率を文献などから入手していたとしても、粒子形状などに応じて同じ屈折率であっても回折散乱光は変化するため、その値が正確であるとは限らない。
そこで、下記特許文献1には、1つの光強度分布データに対して複数の屈折率を用いて演算を行い、屈折率の範囲を自動的に決定するような技術が提案されている。具体的には、1つの光強度分布データに対して複数の屈折率を用いて演算を行うことにより、各屈折率に応じた粒度分布データに変換した後、それらの粒度分布データを光強度分布データに逆変換し、逆変換された光強度分布データと元の光強度分布データとの一致度に基づいて、屈折率の範囲を自動的に決定するようになっている。
しかしながら、上記のような従来の方法では、1回の測定で得られた1つの光強度分布データを用いて演算を行っているため、最適な屈折率の範囲が確実に決定されているとは限らず、同一の試料に対して測定を複数回行った場合には、異なる屈折率の範囲が決定される場合もある。
すなわち、粒度分布測定装置に試料を導入し、その試料を用いて測定を複数回行った場合、それぞれの測定により決定される屈折率の範囲が異なる結果となる場合がある。また、同一の試料を粒度分布測定装置に入れ替えて測定を行った場合にも、その測定により決定される屈折率の範囲が異なる結果となる場合がある。
本発明は、上記実情に鑑みてなされたものであり、より最適な屈折率を決定することができる粒度分布測定用データ処理装置及びこれを備えた粒度分布測定装置、並びに、粒度分布測定用データ処理方法及び粒度分布測定用データ処理プログラムを提供することを目的とする。
本発明に係る粒度分布測定装置は、データ入力受付部と、粒度分布データ生成部と、屈折率決定部とを備える。前記データ入力受付部は、同一の試料からの回折散乱光を複数の受光素子で複数回受光することにより得られる複数の光強度分布データの入力を受け付ける。前記粒度分布データ生成部は、前記複数の光強度分布データに対して、それぞれ複数の屈折率を用いた演算を行うことにより、各屈折率に対応する粒度分布データを生成する。前記屈折率決定部は、粒度分布データを生成する際に用いた複数の屈折率に基づいて、最適な屈折率を決定する。
このような構成によれば、同一の試料から得られる複数の光強度分布データに対して、それぞれ複数の屈折率を用いた演算を行うことにより、各屈折率に対応する粒度分布データを生成し、その際に用いた複数の屈折率に基づいて最適な屈折率を決定することができる。このように、1つの光強度分布データではなく、複数の光強度分布データに基づいて屈折率を決定することによって、より最適な屈折率を決定することができる。
前記粒度分布データ生成部は、前記複数の光強度分布データに対して、それぞれ共通の複数の屈折率を用いた演算を行うことにより、光強度分布データごとに前記複数の屈折率に対応する粒度分布データを生成するものであってもよい。この場合、前記粒度分布測定装置は、共通の屈折率を用いて異なる光強度分布データから算出された粒度分布データ同士を比較するデータ比較部をさらに備えていてもよい。また、前記屈折率決定部が、前記データ比較部による比較結果に基づいて、前記複数の屈折率の中から最適な屈折率を決定してもよい。
このような構成によれば、複数の光強度分布データに対して、それぞれ共通の複数の屈折率を用いた演算を行い、これにより生成された各粒度分布データ同士を比較することにより、複数の屈折率の中から最適な屈折率を決定することができる。このとき、共通の屈折率を用いて異なる光強度分布データから算出された粒度分布データ同士を比較し、例えば一致度が最も高い粒度分布データを生成する際に用いた屈折率を最適な屈折率に決定すれば、より最適な屈折率を決定することができる。
前記粒度分布データ生成部は、予め定められた数値範囲内で選択された複数の屈折率を用いて、前記複数の光強度分布データに対して演算を行うことにより、光強度分布データごとに前記複数の屈折率に対応する粒度分布データを生成してもよい。
このような構成によれば、例えば試料中の成分などに応じて予め定められた数値範囲内で選択された複数の屈折率のみを用いて、複数の光強度分布データに対する演算を行い、その際に用いた複数の屈折率に基づいて最適な屈折率を決定することができる。屈折率の数値範囲は、試料中の成分に応じてある程度定まるため、その数値範囲内で選択された複数の屈折率のみを用いることにより、最適な屈折率を効率よく決定することができる。
前記粒度分布測定装置は、前記複数の光強度分布データにそれぞれ対応する屈折率を自動で算出する屈折率算出部をさらに備えていてもよい。この場合、前記粒度分布データ生成部は、前記屈折率算出部により算出された各光強度分布データに対応する屈折率を含む複数の屈折率を用いて、前記複数の光強度分布データに対して演算を行うことにより、光強度分布データごとに前記複数の屈折率に対応する粒度分布データを生成してもよい。
このような構成によれば、自動で算出された各光強度分布データに対応する屈折率を含む複数の屈折率のみを用いて、複数の光強度分布データに対する演算を行い、その際に用いた複数の屈折率に基づいて最適な屈折率を決定することができる。自動で屈折率を算出することにより、屈折率の値をある程度絞り込むことができるため、それらの中から最適な屈折率を効率よく決定することができる。
前記屈折率決定部は、前記屈折率算出部により算出された各光強度分布データに対応する屈折率の平均値を最適な屈折率に決定してもよい。
このような構成によれば、自動で算出された各光強度分布データに対応する屈折率の平均値が最適な屈折率に決定される。自動で屈折率を算出することにより、屈折率の値をある程度絞り込むことができるため、それらの平均値を算出することにより、最適な屈折率を効率よく決定することができる。
前記屈折率決定部は、前記屈折率算出部により算出された各光強度分布データに対応する屈折率のうち、出現頻度が最も高い屈折率を最適な屈折率に決定してもよい。
このような構成によれば、自動で算出された各光強度分布データに対応する屈折率のうち、出現頻度が最も高い屈折率が最適な屈折率に決定される。自動で屈折率を算出することにより、屈折率の値をある程度絞り込むことができるため、それらの中から出現頻度が最も高い屈折率を選択することにより、最適な屈折率を効率よく決定することができる。
本発明に係る粒度分布測定装置は、試料に光を照射する光源と、試料からの回折散乱光を受光する複数の受光素子と、前記粒度分布測定用データ処理装置とを備える。
本発明に係る粒度分布データ処理方法は、データ入力受付ステップと、粒度分布データ生成ステップと、屈折率決定ステップとを備える。前記データ入力受付ステップでは、同一の試料からの回折散乱光を複数の受光素子で複数回受光することにより得られる複数の光強度分布データの入力を受け付ける。前記粒度分布データ生成ステップでは、前記複数の光強度分布データに対して、それぞれ複数の屈折率を用いた演算を行うことにより、各屈折率に対応する粒度分布データを生成する。前記屈折率決定ステップでは、粒度分布データを生成する際に用いた複数の屈折率に基づいて、最適な屈折率を決定する。
本発明に係る粒度分布データ処理プログラムは、データ入力受付部と、粒度分布データ生成部と、屈折率決定部としてコンピュータを機能させる。前記データ入力受付部は、同一の試料からの回折散乱光を複数の受光素子で複数回受光することにより得られる複数の光強度分布データの入力を受け付ける。前記粒度分布データ生成部は、前記複数の光強度分布データに対して、それぞれ複数の屈折率を用いた演算を行うことにより、各屈折率に対応する粒度分布データを生成する。前記屈折率決定は、粒度分布データを生成する際に用いた複数の屈折率に基づいて、最適な屈折率を決定する。
本発明によれば、1つの光強度分布データではなく、複数の光強度分布データに基づいて屈折率を決定することによって、より最適な屈折率を決定することができる。
<第1実施形態>
図1は、本発明の第1実施形態に係る粒度分布測定装置の構成例を示した図である。この粒度分布測定装置は、試料に含まれる粒子群の粒子径と粒子量との関係を測定することにより、粒度分布データを生成するためのものであり、試料の測定を行うための測定部1を備えている。
図1は、本発明の第1実施形態に係る粒度分布測定装置の構成例を示した図である。この粒度分布測定装置は、試料に含まれる粒子群の粒子径と粒子量との関係を測定することにより、粒度分布データを生成するためのものであり、試料の測定を行うための測定部1を備えている。
測定部1には、光源11、集光レンズ12、空間フィルタ13、コリメータレンズ14、フローセル15、集光レンズ16及びフォトダイオードアレイ17などが備えられている。測定対象となる試料は、例えば超音波振動子が内蔵された循環式サンプラ2などの供給源からフローセル15に供給されるようになっている。
光源11は、例えばレーザ光源からなり、当該光源11から照射された測定光が、集光レンズ12、空間フィルタ13及びコリメータレンズ14を通過することにより平行光となる。このようにして平行光とされた測定光は、試料が供給されているフローセル15に照射され、フローセル15内の試料に含まれる粒子群で回折及び散乱した後、集光レンズ16を通ってフォトダイオードアレイ17により受光されるようになっている。
フォトダイオードアレイ17は、試料からの回折散乱光を検出するための検出器を構成している。フォトダイオードアレイ17は、互いに異なる半径を有するリング状又は半リング状の検出面が形成された複数(例えば、64個)の受光素子を、集光レンズ16の光軸を中心として同心円状に配置することにより構成されており、各受光素子には、それぞれの位置に応じた回折散乱角度の光が入射する。したがって、フォトダイオードアレイ17の各受光素子の検出信号は、各回折散乱角度の光の強度を表すことになる。
フォトダイオードアレイ17の各受光素子の検出信号は、A/D変換器3によりアナログ信号からデジタル信号に変換された後、通信部4を介してデータ処理装置5に入力されるようになっている。これにより、フォトダイオードアレイ17の各受光素子の素子番号と各受光素子における検出強度とが対応付けられた光強度分布データが、データ処理装置5に入力される。
データ処理装置5は、試料の粒度分布を測定する際のデータを処理するための粒度分布測定用データ処理装置を構成している。データ処理装置5は、例えばコンピュータにより構成され、制御部51、操作部52、表示部53及び記憶部54などを備えている。
制御部51は、例えばCPU(Central Processing Unit)を含む構成であり、操作部52、表示部53及び記憶部54などの各部が電気的に接続されている。操作部52は、例えばキーボード及びマウスを含む構成であり、ユーザが操作部52を操作することにより入力作業などを行うことができるようになっている。
表示部53は、例えば液晶表示器などにより構成することができ、ユーザが表示部53の表示内容を確認しながら作業を行うことができるようになっている。記憶部54は、例えばROM(Read Only Memory)、RAM(Random Access Memory)及びハードディスクなどにより構成することができる。
図2は、図1のデータ処理装置5の具体的構成について説明するためのブロック図である。本実施形態における制御部51は、CPUがプログラムを実行することにより、データ入力受付部511、粒度分布データ生成部512、屈折率選択部513、データ比較部514、屈折率決定部515及び表示処理部516などとして機能する。
記憶部54には、光強度分布データ記憶部541と粒度分布データ記憶部542とが割り当てられている。光強度分布データ記憶部541には、測定部1から入力される光強度分布データが記憶される。制御部51は、光強度分布データ記憶部541に記憶されている複数の光強度分布データに基づいて、複数の粒度分布データを生成し、それらの粒度分布データを粒度分布データ記憶部542に記憶させる。
本実施形態では、測定部1で複数回の測定を行うことにより、複数の光強度分布データが得られる。具体的には、試料を循環式サンプラ2に導入し、その試料を用いて測定を複数回(例えば3回)行うといった作業が、同一の試料を循環式サンプラ2に入れ替えることにより複数回(例えば3回)繰り返して行われる。これにより、同一の試料からの回折散乱光がフォトダイオードアレイ17の各受光素子で複数回受光され、複数(この例では9つ)の光強度分布データが光強度分布データ記憶部541に記憶される。
データ入力受付部511は、粒度分布データを生成する際に、光強度分布データ記憶部541に記憶されている複数の光強度分布データの入力を受け付ける。粒度分布データ生成部512は、これらの複数の光強度分布データに対して、それぞれ複数の屈折率を用いた演算を行うことにより、各屈折率に対応する粒度分布データを生成する。生成された複数の粒度分布データは、粒度分布データ記憶部542に記憶される。
屈折率選択部513は、粒度分布データ生成部512が粒度分布データを生成する際に用いる複数の屈折率を選択する。本実施形態では、屈折率選択部513が予め定められた数値範囲内で複数の屈折率を選択し、それらの屈折率を用いて粒度分布データ生成部512が粒度分布データを生成するようになっている。
屈折率選択部513は、例えば上記数値範囲内で所定の間隔ごとに屈折率を抽出することにより、複数の屈折率を選択することができる。上記数値範囲は、例えば操作部52の操作により入力された数値範囲であってもよいし、操作部52の操作により入力された試料中の成分などに基づいて決定された数値範囲であってもよい。
粒度分布データを生成する際には、下記式(1)の関係を用いることができる。

ここで、s、q及びAは、下記式(2)~(4)で表される。
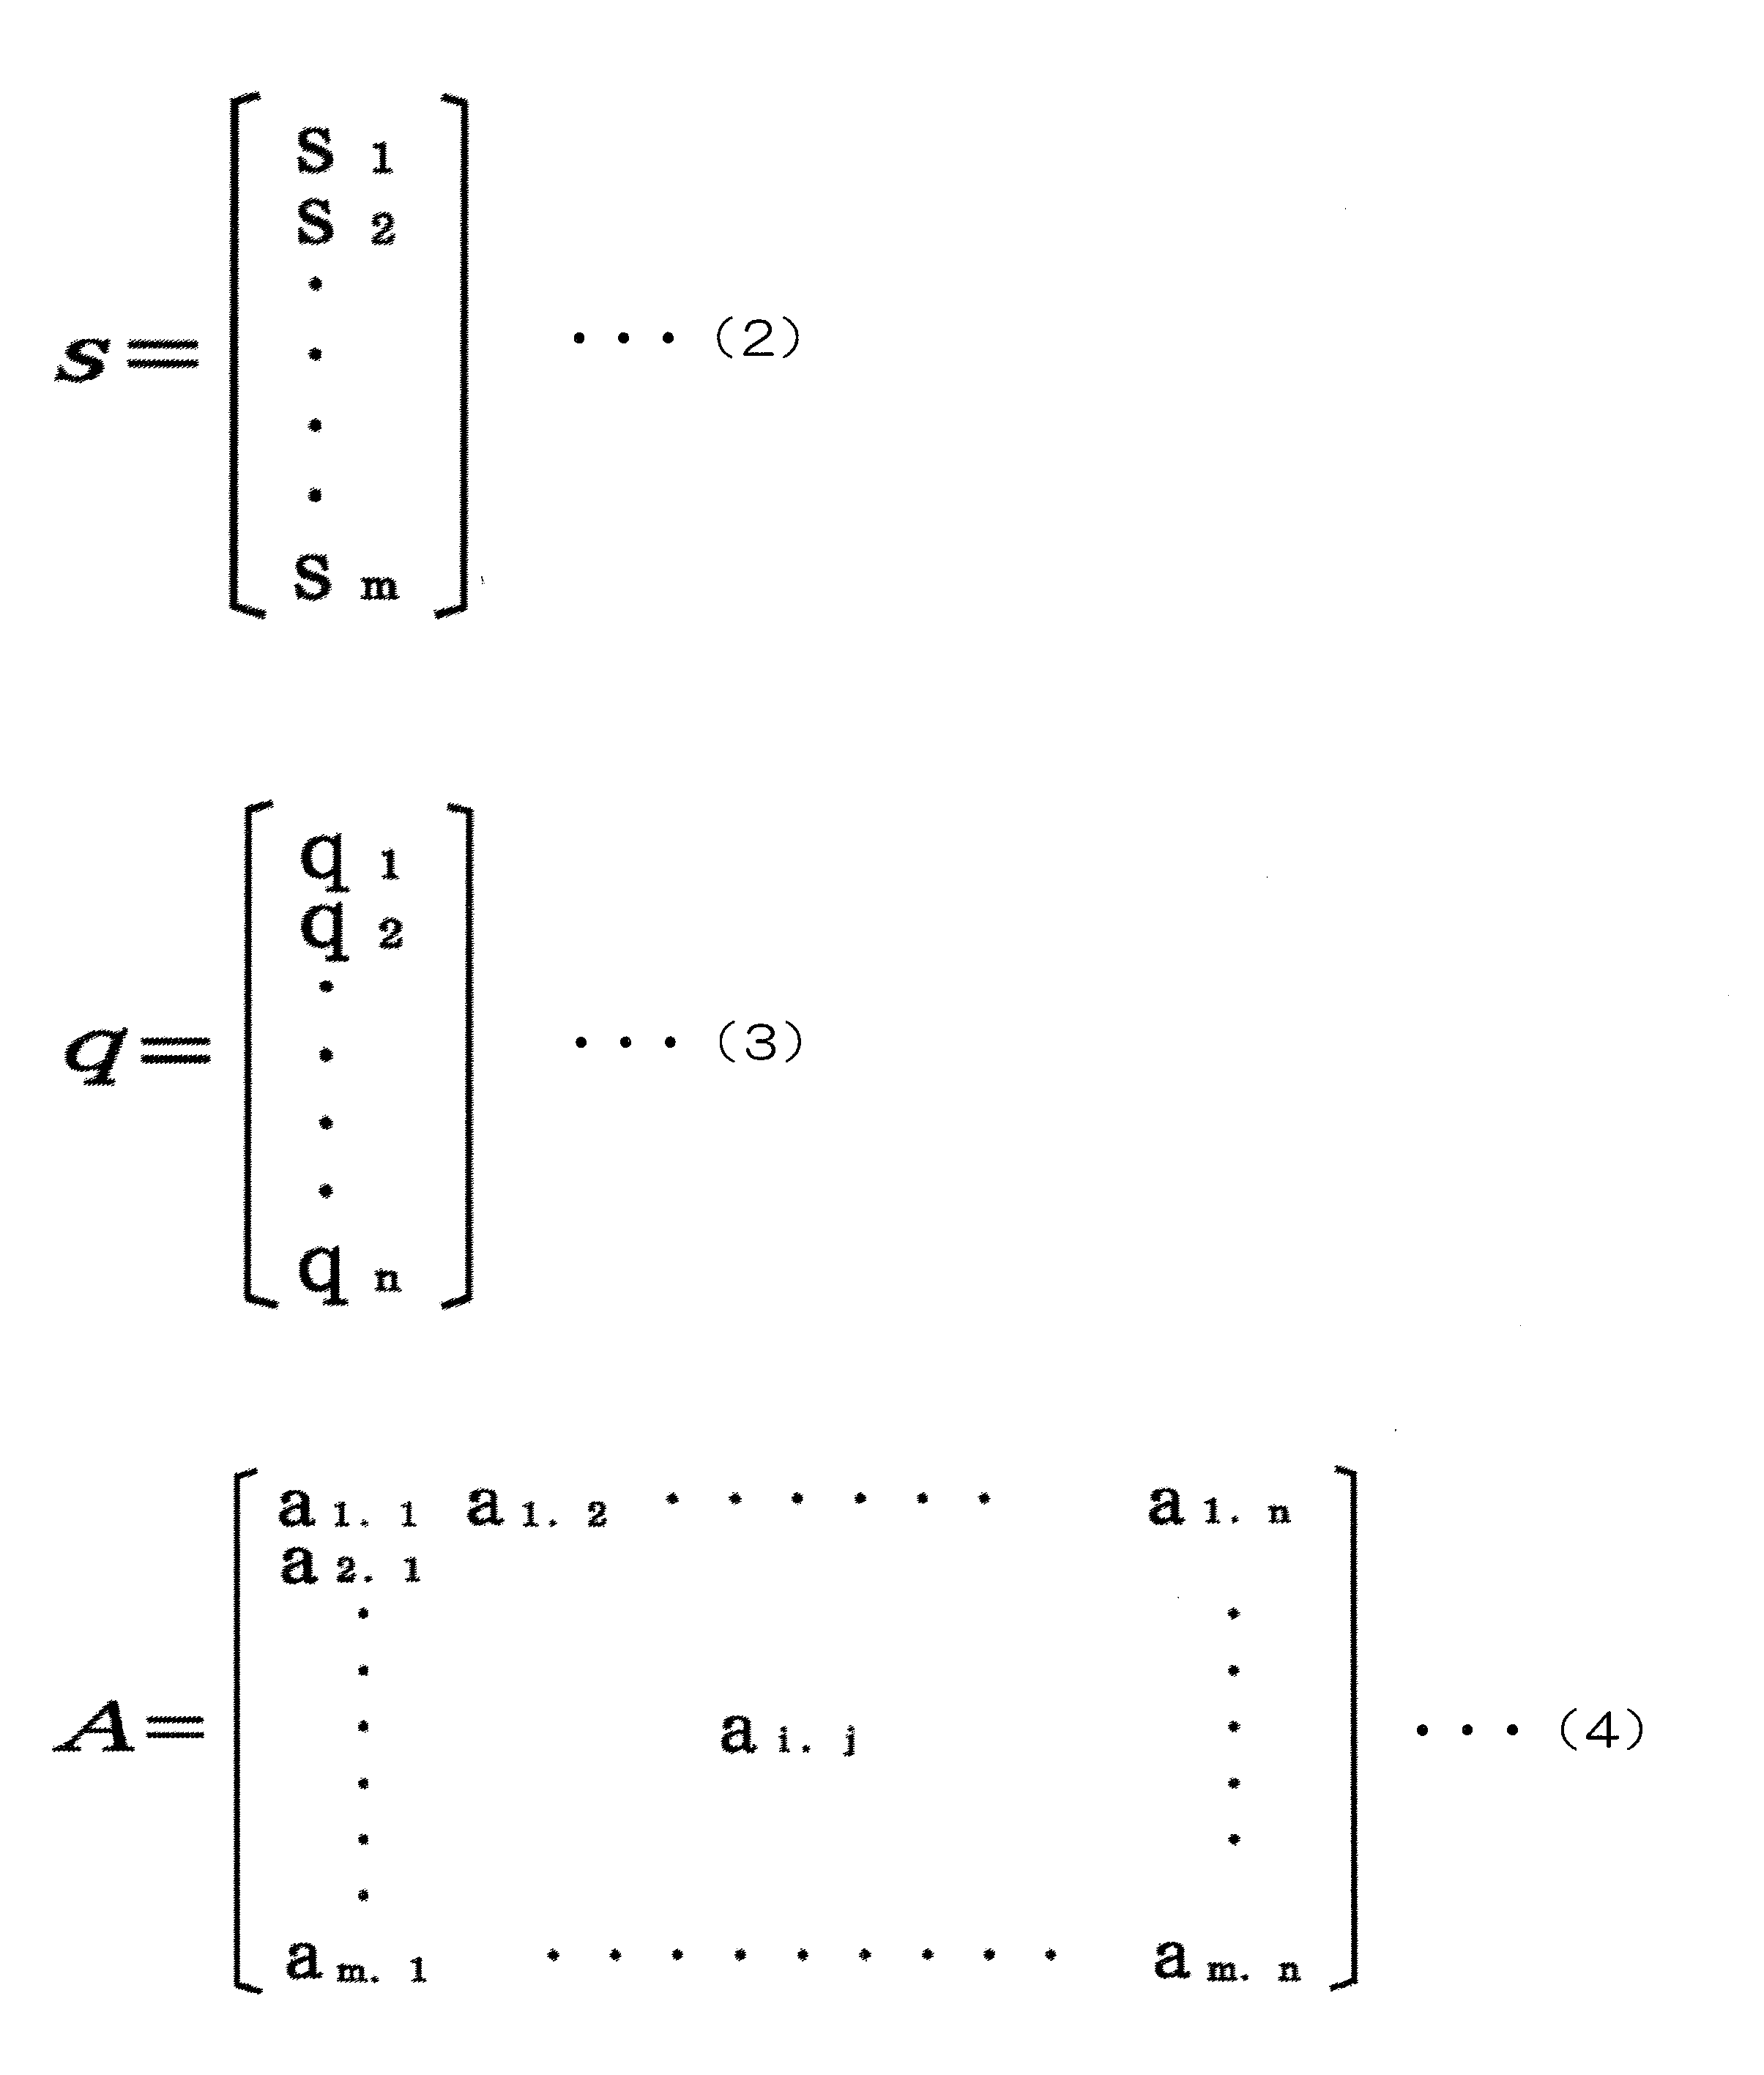
上記sは、光強度分布データ(ベクトル)である。上記sにおける各要素si(i=1,2,・・・,m)は、フォトダイオードアレイ17の各受光素子、並びに、側方散乱光センサ及び後方散乱光センサ(いずれも図示せず)における検出強度である。
上記qは、頻度分布%として表現される粒度分布データ(ベクトル)である。測定対象となる粒子径範囲(最大粒子径がx1、最小粒子径がxn+1)をn分割し、それぞれの粒子径区間を[xj,xj+1]とすると、上記qにおける各要素qj(j=1,2,・・・,n)は、各粒子径区間[xj,xj+1]に対応する粒子量である。
通常は、体積基準が用いられ、下記式(5)を満たすように、すなわち各要素qjの合計が100%となるように正規化が行われる。

上記Aは、粒度分布データqを光強度分布データsに変換する係数行列である。上記Aにおける各要素ai,j(i=1,2,・・・,m、j=1,2,・・・,n)は、各粒子径区間[xj,xj+1]に属する単位粒子量の粒子群によって回折及び散乱した光のi番目の素子における検出強度である。
上記Aにおける各要素ai,jの値は、屈折率を用いて予め理論的に計算することができる。例えば、粒子径が光源11からの測定光の波長に比べて十分に大きい場合(例えば10倍以上)には、フラウンホーファ回折理論を用いて計算することができる。一方、粒子径が光源11からの測定光の波長と同程度、又は、それより小さい場合には、ミー散乱理論を用いて計算することができる。
このようにして上記Aにおける各要素ai,jの値を求めれば、上記式(1)に基づいて、下記式(6)により粒度分布データqを求めることができる。ただし、ATはAの転置行列である。

図3は、粒度分布データを生成する際の態様について説明するための図である。この図3に示すように、本実施形態では、複数の光強度分布データa,b,・・・に対して、それぞれ共通の複数の屈折率A,B,C・・・を用いた演算が行われることにより、光強度分布データa,b,・・・ごとに複数の屈折率A,B,C・・・に対応する粒度分布データが生成されるようになっている。
データ比較部514は、共通の屈折率を用いて異なる光強度分布データから算出された粒度分布データ同士を比較する。図3の例では、共通の屈折率Aを用いて異なる光強度分布データa,b,・・・から算出された粒度分布データa-1,b-1,・・・が互いに比較される。同様に、共通の屈折率Bを用いて異なる光強度分布データa,b,・・・から算出された粒度分布データa-2,b-2,・・・が互いに比較され、共通の屈折率Cを用いて異なる光強度分布データa,b,・・・から算出された粒度分布データa-3,b-3,・・・が互いに比較される。このような処理が、全ての屈折率A,B,C・・・について行われる。
その後、屈折率決定部515が、粒度分布データを生成する際に用いた複数の屈折率A,B,C・・・に基づいて、最適な屈折率を決定する。このとき、データ比較部514による比較結果に基づいて、複数の屈折率A,B,C・・・の中から最適な屈折率を決定することができる。例えば、データ比較部514が、比較する粒度分布データ同士の一致度を算出するような構成であれば、その一致度が最も高い粒度分布データを生成する際に用いた屈折率を、最適な屈折率として決定すればよい。
表示処理部516は、表示部53に対する表示を制御する。この表示処理部516は、屈折率決定部515により決定された最適な屈折率を表示部53に表示させてもよいし、決定された最適な屈折率に対応する粒度分布データを表示部53に表示させてもよい。
図4は、屈折率を決定する際の制御部51による処理の一例を示したフローチャートである。屈折率を決定する際には、まず、同一の試料から得られた各光強度分布データが光強度分布データ記憶部541から入力される(ステップS101:データ入力受付ステップ)。そして、各光強度分布データに対して、それぞれ複数の屈折率を用いた演算を行うことにより、各屈折率に対応する粒度分布データが生成される(ステップS102:粒度分布データ生成ステップ)。
その後、共通の屈折率を用いて異なる光強度分布データから算出された粒度分布データ同士が比較される(ステップS103:データ比較ステップ)。その結果、一致度が最も高い粒度分布データが特定され(ステップS104)、その粒度分布データを生成する際に用いた屈折率が、最適な屈折率として決定される(ステップS105:屈折率決定ステップ)。
本実施形態では、図3に示したように、同一の試料から得られる複数の光強度分布データa,b,・・・に対して、それぞれ複数の屈折率A,B,C・・・を用いた演算を行うことにより、各屈折率A,B,C・・・に対応する粒度分布データを生成し、その際に用いた複数の屈折率A,B,C・・・に基づいて最適な屈折率を決定することができる。このように、1つの光強度分布データではなく、複数の光強度分布データa,b,・・・に基づいて屈折率を決定することによって、より最適な屈折率を決定することができる。
また、本実施形態では、複数の光強度分布データa,b,・・・に対して、それぞれ共通の複数の屈折率A,B,C・・・を用いた演算を行い、これにより生成された各粒度分布データ同士を比較することにより、複数の屈折率A,B,C・・・の中から最適な屈折率を決定することができる。このとき、共通の屈折率を用いて異なる光強度分布データから算出された粒度分布データ同士を比較し、一致度が最も高い粒度分布データを生成する際に用いた屈折率を最適な屈折率に決定することによって、より最適な屈折率を決定することができる。
特に、本実施形態では、例えば試料中の成分などに応じて予め定められた数値範囲内で選択された複数の屈折率A,B,C・・・のみを用いて、複数の光強度分布データa,b,・・・に対する演算を行い、その際に用いた複数の屈折率A,B,C・・・に基づいて最適な屈折率を決定することができる。屈折率の数値範囲は、試料中の成分に応じてある程度定まるため、その数値範囲内で選択された複数の屈折率A,B,C・・・のみを用いることにより、最適な屈折率を効率よく決定することができる。
<第2実施形態>
図5は、本発明の第2実施形態に係るデータ処理装置5の具体的構成について説明するためのブロック図である。本実施形態における制御部51は、CPUがプログラムを実行することにより、データ入力受付部511、粒度分布データ生成部512、データ比較部514、屈折率決定部515、表示処理部516及び屈折率算出部517などとして機能する。
図5は、本発明の第2実施形態に係るデータ処理装置5の具体的構成について説明するためのブロック図である。本実施形態における制御部51は、CPUがプログラムを実行することにより、データ入力受付部511、粒度分布データ生成部512、データ比較部514、屈折率決定部515、表示処理部516及び屈折率算出部517などとして機能する。
なお、データ入力受付部511、データ比較部514、屈折率決定部515及び表示処理部516による処理、並びに、光強度分布データ記憶部541及び粒度分布データ記憶部542に記憶されるデータなどは、第1実施形態の場合と同様である。そのため、同様の構成については、図に同一符号を付して詳細な説明を省略する。
粒度分布データ生成部512は、データ入力受付部511により光強度分布データ記憶部541からの入力が受け付けられた複数の光強度分布データに対して、それぞれ複数の屈折率を用いた演算を行うことにより、各屈折率に対応する粒度分布データを生成する。このとき、上記式(6)の関係を用いることにより、第1実施形態の場合と同様の態様で粒度分布データを生成することができる。
屈折率算出部517は、粒度分布データ生成部512により生成された粒度分布データに基づいて、複数の光強度分布データにそれぞれ対応する屈折率を自動で算出する。具体的には、粒度分布データを生成する際の各屈折率に対応する係数行列Aと同一の係数行列Aを用いて、上記式(1)の関係を用いることにより、各粒度分布データを光強度分布データに変換し、その変換された光強度分布データと元の光強度分布データとを比較する。その結果、一致度が最も高い光強度分布データの変換時に使用した係数行列Aに対応する屈折率が、その光強度分布データに対応する屈折率として自動で算出される。
粒度分布データ生成部512は、屈折率算出部517により算出された各光強度分布データに対応する屈折率を用いて、再度、各光強度分布データに対して演算を行うことにより、各屈折率に対応する粒度分布データを生成する。この際にも、上記式(6)の関係を用いることにより、第1実施形態の場合と同様の態様で粒度分布データを生成することができる。生成された複数の粒度分布データは、粒度分布データ記憶部542に記憶される。
ただし、粒度分布データ生成部512は、屈折率算出部517により算出された各光強度分布データに対応する屈折率のみを用いて粒度分布データを生成するような構成に限らない。すなわち、粒度分布データ生成部512は、屈折率算出部517により算出された各光強度分布データに対応する屈折率と、それ以外の屈折率とを含む複数の屈折率を用いて、粒度分布データを生成するような構成であってもよい。
図6は、第2実施形態において屈折率を自動で算出する過程を説明するための図である。この図6に示すように、本実施形態では、複数の光強度分布データa,b,・・・に対して、それぞれ複数の屈折率を用いた演算が行われることにより、光強度分布データa,b,・・・ごとに複数の屈折率に対応する粒度分布データが生成されるようになっている。
そして、生成された各粒度分布データに対して、それらの粒度分布データを生成する際の各屈折率を用いて変換を行い、変換された光強度分布データと元の光強度分布データa,b,・・・とを比較する。この比較結果に基づいて、各光強度分布データa,b,・・・に対応する屈折率A,B,・・・が自動で算出される。ここで、A’、A”などは光強度分布データaから最適な屈折率Aを自動で見つける際に比較対象とした屈折率の候補を表している。同様に、B’、B”などは光強度分布データbから最適な屈折率Bを自動で見つける際に比較対象とした屈折率の候補である。
このようにして自動で算出された各屈折率A,B,・・・は、粒度分布データ生成部512による処理に用いられる。粒度分布データ生成部512は、各屈折率A,B,・・・を用いて、図3と同様の態様で粒度分布データを生成する。そして、データ比較部514により、図3と同様の態様で粒度分布データ同士が比較され、一致度が最も高い粒度分布データを生成する際に用いられた屈折率が、屈折率決定部515により最適な屈折率として決定される。
図7は、第2実施形態における制御部51による処理の一例を示したフローチャートである。まず、同一の試料から得られた各光強度分布データが光強度分布データ記憶部541から入力される(ステップS201:データ入力受付ステップ)。そして、各光強度分布データに対して、それぞれ複数の屈折率を用いた演算を行うことにより、各屈折率に対応する粒度分布データが生成される(ステップS202:粒度分布データ生成ステップ)。
その後、各粒度分布データに対する変換を行い、変換された光強度分布データと元の光強度分布データとを比較することにより、その比較結果に基づいて各光強度分布データに対応する屈折率が自動で算出される(ステップS203:屈折率算出ステップ)。その後の処理は、図4におけるステップS102以降の処理と同様である。
本実施形態では、第1実施形態と同様に、1つの光強度分布データではなく、複数の光強度分布データa,b,・・・に基づいて屈折率を決定することによって、より最適な屈折率を決定することができる。また、第1実施形態と同様に、共通の屈折率を用いて異なる光強度分布データから算出された粒度分布データ同士を比較し、一致度が最も高い粒度分布データを生成する際に用いた屈折率を最適な屈折率に決定することによって、より最適な屈折率を決定することができる。
特に、本実施形態では、自動で算出された各光強度分布データa,b,・・・に対応する複数の屈折率A,B,・・・のみを用いて、複数の光強度分布データa,b,・・・に対する演算を行い、その際に用いた複数の屈折率A,B,・・・に基づいて最適な屈折率を決定することができる。自動で屈折率A,B,・・・を算出することにより、屈折率の値をある程度絞り込むことができるため、それらの中から最適な屈折率を効率よく決定することができる。
<第3実施形態>
図8は、本発明の第3実施形態に係るデータ処理装置5の具体的構成について説明するためのブロック図である。本実施形態における制御部51は、CPUがプログラムを実行することにより、データ入力受付部511、粒度分布データ生成部512、屈折率決定部515、表示処理部516及び屈折率算出部517などとして機能する。
図8は、本発明の第3実施形態に係るデータ処理装置5の具体的構成について説明するためのブロック図である。本実施形態における制御部51は、CPUがプログラムを実行することにより、データ入力受付部511、粒度分布データ生成部512、屈折率決定部515、表示処理部516及び屈折率算出部517などとして機能する。
本実施形態では、屈折率決定部515が、屈折率算出部517により算出された各光強度分布データに対応する屈折率の平均値を最適な屈折率に決定するようになっている。なお、データ入力受付部511、粒度分布データ生成部512、表示処理部516及び屈折率算出部517による処理、並びに、光強度分布データ記憶部541及び粒度分布データ記憶部542に記憶されるデータなどは、第2実施形態の場合と同様である。そのため、同様の構成については、図に同一符号を付して詳細な説明を省略する。
図9は、第3実施形態において屈折率の平均値を算出する過程を説明するための図である。本実施形態では、図6に示した第2実施形態の場合と同様に、複数の光強度分布データa,b,・・・に対して、それぞれ複数の屈折率を用いた演算が行われる。そして、生成された各粒度分布データに対して変換が行われ、変換された光強度分布データと元の光強度分布データa,b,・・・とが比較されることにより、各光強度分布データa,b,・・・に対応する屈折率A,B,・・・が自動で算出される。ここで、A’、A”などは光強度分布データaから最適な屈折率Aを自動で見つける際に比較対象とした屈折率の候補を表している。同様に、B’、B”などは光強度分布データbから最適な屈折率Bを自動で見つける際に比較対象とした屈折率の候補である。
このようにして自動で算出された各屈折率A,B,・・・は、屈折率決定部515による処理に用いられる。本実施形態では、屈折率決定部515が、各屈折率A,B,・・・の平均値を最適な屈折率に決定する。自動で屈折率A,B,・・・を算出することにより、屈折率の値をある程度絞り込むことができるため、それらの平均値を算出することにより、最適な屈折率を効率よく決定することができる。
図10は、第3実施形態における制御部51による処理の一例を示したフローチャートである。まず、同一の試料から得られた各光強度分布データが光強度分布データ記憶部541から入力される(ステップS301:データ入力受付ステップ)。そして、各光強度分布データに対して、それぞれ複数の屈折率を用いた演算を行うことにより、各屈折率に対応する粒度分布データが生成される(ステップS302:粒度分布データ生成ステップ)。
その後、各粒度分布データに対する変換を行い、変換された光強度分布データと元の光強度分布データとを比較することにより、その比較結果に基づいて各光強度分布データに対応する屈折率が自動で算出される(ステップS303:屈折率算出ステップ)。そして、自動で算出された各光強度分布データに対応する屈折率の平均値が算出されることにより、その平均値が最適な屈折率に決定される(ステップS304:屈折率決定ステップ)。
<第4実施形態>
図11は、本発明の第4実施形態に係るデータ処理装置5の制御部51による処理の一例を示したフローチャートである。本実施形態では、屈折率決定部515による処理のみが第3実施形態とは異なり、他の処理及び構成については第3実施形態と同様である。
図11は、本発明の第4実施形態に係るデータ処理装置5の制御部51による処理の一例を示したフローチャートである。本実施形態では、屈折率決定部515による処理のみが第3実施形態とは異なり、他の処理及び構成については第3実施形態と同様である。
本実施形態において、まず、同一の試料から得られた各光強度分布データが光強度分布データ記憶部541から入力される(ステップS401:データ入力受付ステップ)。そして、各光強度分布データに対して、それぞれ複数の屈折率を用いた演算を行うことにより、各屈折率に対応する粒度分布データが生成される(ステップS402:粒度分布データ生成ステップ)。
その後、各粒度分布データに対する変換を行い、変換された光強度分布データと元の光強度分布データとを比較することにより、その比較結果に基づいて各光強度分布データに対応する屈折率が自動で算出される(ステップS403:屈折率算出ステップ)。そして、自動で算出された各光強度分布データに対応する屈折率のうち、出現頻度が最も高い屈折率が最適な屈折率に決定される(ステップS404:屈折率決定ステップ)。
本実施形態では、自動で屈折率を算出することにより、屈折率の値をある程度絞り込むことができるため、それらの中から出現頻度が最も高い屈折率を選択することにより、最適な屈折率を効率よく決定することができる。なお、上記出現頻度は、例えば屈折率の値として算出される割合を意味しており、算出される割合が高い屈折率の値そのものが最適な屈折率に決定されてもよいし、算出される割合が高い屈折率の範囲内で最適な屈折率が決定されてもよい。
以上の実施形態では、粒度分布データを生成するためのデータ処理装置5が、粒度分布測定装置に備えられた構成について説明した。しかし、このような構成に限らず、粒度分布測定装置とは別にデータ処理装置5が設けられた構成であってもよい。この場合、粒度分布測定装置の測定部1から出力されるデータは、有線通信又は無線通信を介してデータ処理装置5に入力されるような構成であってもよいし、記憶媒体(図示せず)に一旦記憶された後、当該記憶媒体からデータ処理装置5に入力されるような構成などであってもよい。
また、上記実施形態に係るデータ処理装置5のように、粒度分布データを生成するための粒度分布測定用データ処理装置を提供することができるだけでなく、粒度分布測定用データ処理装置としてコンピュータを機能させるためのプログラム(粒度分布測定用データ処理プログラム)を提供することも可能である。この場合、前記プログラムは、記憶媒体に記憶された状態で提供されるような構成であってもよいし、有線通信又は無線通信を介してプログラム自体が提供されるような構成であってもよい。
1 測定部
2 循環式サンプラ
3 A/D変換器
4 通信部
5 データ処理装置
11 光源
12 集光レンズ
13 空間フィルタ
14 コリメータレンズ
15 フローセル
16 集光レンズ
17 フォトダイオードアレイ
51 制御部
52 操作部
53 表示部
54 記憶部
511 データ入力受付部
512 粒度分布データ生成部
513 屈折率選択部
514 データ比較部
515 屈折率決定部
516 表示処理部
517 屈折率算出部
541 光強度分布データ記憶部
542 粒度分布データ記憶部
2 循環式サンプラ
3 A/D変換器
4 通信部
5 データ処理装置
11 光源
12 集光レンズ
13 空間フィルタ
14 コリメータレンズ
15 フローセル
16 集光レンズ
17 フォトダイオードアレイ
51 制御部
52 操作部
53 表示部
54 記憶部
511 データ入力受付部
512 粒度分布データ生成部
513 屈折率選択部
514 データ比較部
515 屈折率決定部
516 表示処理部
517 屈折率算出部
541 光強度分布データ記憶部
542 粒度分布データ記憶部
Claims (9)
- 同一の試料からの回折散乱光を複数の受光素子で複数回受光することにより得られる複数の光強度分布データの入力を受け付けるデータ入力受付部と、
前記複数の光強度分布データに対して、それぞれ複数の屈折率を用いた演算を行うことにより、各屈折率に対応する粒度分布データを生成する粒度分布データ生成部と、
粒度分布データを生成する際に用いた複数の屈折率に基づいて、最適な屈折率を決定する屈折率決定部とを備えたことを特徴とする粒度分布測定用データ処理装置。 - 前記粒度分布データ生成部は、前記複数の光強度分布データに対して、それぞれ共通の複数の屈折率を用いた演算を行うことにより、光強度分布データごとに前記複数の屈折率に対応する粒度分布データを生成するものであり、
共通の屈折率を用いて異なる光強度分布データから算出された粒度分布データ同士を比較するデータ比較部をさらに備えるとともに、
前記屈折率決定部が、前記データ比較部による比較結果に基づいて、前記複数の屈折率の中から最適な屈折率を決定することを特徴とする請求項1に記載の粒度分布測定用データ処理装置。 - 前記粒度分布データ生成部は、予め定められた数値範囲内で選択された複数の屈折率を用いて、前記複数の光強度分布データに対して演算を行うことにより、光強度分布データごとに前記複数の屈折率に対応する粒度分布データを生成することを特徴とする請求項2に記載の粒度分布測定用データ処理装置。
- 前記複数の光強度分布データにそれぞれ対応する屈折率を自動で算出する屈折率算出部をさらに備え、
前記粒度分布データ生成部は、前記屈折率算出部により算出された各光強度分布データに対応する屈折率を含む複数の屈折率を用いて、前記複数の光強度分布データに対して演算を行うことにより、光強度分布データごとに前記複数の屈折率に対応する粒度分布データを生成することを特徴とする請求項2に記載の粒度分布測定用データ処理装置。 - 前記複数の光強度分布データにそれぞれ対応する屈折率を自動で算出する屈折率算出部をさらに備え、
前記屈折率決定部は、前記屈折率算出部により算出された各光強度分布データに対応する屈折率の平均値を最適な屈折率に決定することを特徴とする請求項1に記載の粒度分布測定用データ処理装置。 - 前記複数の光強度分布データにそれぞれ対応する屈折率を自動で算出する屈折率算出部をさらに備え、
前記屈折率決定部は、前記屈折率算出部により算出された各光強度分布データに対応する屈折率のうち、出現頻度が最も高い屈折率を最適な屈折率に決定することを特徴とする請求項1に記載の粒度分布測定用データ処理装置。 - 試料に光を照射する光源と、
試料からの回折散乱光を受光する複数の受光素子と、
請求項1~6のいずれかに記載の粒度分布測定用データ処理装置とを備えたことを特徴とする粒度分布測定装置。 - 同一の試料からの回折散乱光を複数の受光素子で複数回受光することにより得られる複数の光強度分布データの入力を受け付けるデータ入力受付ステップと、
前記複数の光強度分布データに対して、それぞれ複数の屈折率を用いた演算を行うことにより、各屈折率に対応する粒度分布データを生成する粒度分布データ生成ステップと、
粒度分布データを生成する際に用いた複数の屈折率に基づいて、最適な屈折率を決定する屈折率決定ステップとを備えたことを特徴とする粒度分布測定用データ処理方法。 - 同一の試料からの回折散乱光を複数の受光素子で複数回受光することにより得られる複数の光強度分布データの入力を受け付けるデータ入力受付部と、
前記複数の光強度分布データに対して、それぞれ複数の屈折率を用いた演算を行うことにより、各屈折率に対応する粒度分布データを生成する粒度分布データ生成部と、
粒度分布データを生成する際に用いた複数の屈折率に基づいて、最適な屈折率を決定する屈折率決定部としてコンピュータを機能させることを特徴とする粒度分布測定用データ処理プログラム。
Priority Applications (2)
| Application Number | Priority Date | Filing Date | Title |
|---|---|---|---|
| PCT/JP2013/082804 WO2015083284A1 (ja) | 2013-12-06 | 2013-12-06 | 粒度分布測定用データ処理装置及びこれを備えた粒度分布測定装置、並びに、粒度分布測定用データ処理方法及び粒度分布測定用データ処理プログラム |
| JP2015551355A JP6065127B2 (ja) | 2013-12-06 | 2013-12-06 | 粒度分布測定用データ処理装置及びこれを備えた粒度分布測定装置、並びに、粒度分布測定用データ処理方法及び粒度分布測定用データ処理プログラム |
Applications Claiming Priority (1)
| Application Number | Priority Date | Filing Date | Title |
|---|---|---|---|
| PCT/JP2013/082804 WO2015083284A1 (ja) | 2013-12-06 | 2013-12-06 | 粒度分布測定用データ処理装置及びこれを備えた粒度分布測定装置、並びに、粒度分布測定用データ処理方法及び粒度分布測定用データ処理プログラム |
Publications (1)
| Publication Number | Publication Date |
|---|---|
| WO2015083284A1 true WO2015083284A1 (ja) | 2015-06-11 |
Family
ID=53273076
Family Applications (1)
| Application Number | Title | Priority Date | Filing Date |
|---|---|---|---|
| PCT/JP2013/082804 Ceased WO2015083284A1 (ja) | 2013-12-06 | 2013-12-06 | 粒度分布測定用データ処理装置及びこれを備えた粒度分布測定装置、並びに、粒度分布測定用データ処理方法及び粒度分布測定用データ処理プログラム |
Country Status (2)
| Country | Link |
|---|---|
| JP (1) | JP6065127B2 (ja) |
| WO (1) | WO2015083284A1 (ja) |
Cited By (1)
| Publication number | Priority date | Publication date | Assignee | Title |
|---|---|---|---|---|
| WO2020073862A1 (zh) | 2018-10-10 | 2020-04-16 | 深圳市塔吉瑞生物医药有限公司 | 一种二氢咪唑并吡嗪酮化合物及包含该化合物的组合物及其用途 |
Citations (1)
| Publication number | Priority date | Publication date | Assignee | Title |
|---|---|---|---|---|
| JP2012063169A (ja) * | 2010-09-14 | 2012-03-29 | Shimadzu Corp | 粒度分布測定装置 |
Family Cites Families (2)
| Publication number | Priority date | Publication date | Assignee | Title |
|---|---|---|---|---|
| JP3633169B2 (ja) * | 1997-01-08 | 2005-03-30 | 株式会社島津製作所 | 回折/散乱光の光強度分布データの比較方法、および粒度分布測定装置 |
| JP5088288B2 (ja) * | 2008-10-21 | 2012-12-05 | 株式会社島津製作所 | 粒度分布測定装置および粒度分布測定プログラム |
-
2013
- 2013-12-06 JP JP2015551355A patent/JP6065127B2/ja active Active
- 2013-12-06 WO PCT/JP2013/082804 patent/WO2015083284A1/ja not_active Ceased
Patent Citations (1)
| Publication number | Priority date | Publication date | Assignee | Title |
|---|---|---|---|---|
| JP2012063169A (ja) * | 2010-09-14 | 2012-03-29 | Shimadzu Corp | 粒度分布測定装置 |
Cited By (1)
| Publication number | Priority date | Publication date | Assignee | Title |
|---|---|---|---|---|
| WO2020073862A1 (zh) | 2018-10-10 | 2020-04-16 | 深圳市塔吉瑞生物医药有限公司 | 一种二氢咪唑并吡嗪酮化合物及包含该化合物的组合物及其用途 |
Also Published As
| Publication number | Publication date |
|---|---|
| JPWO2015083284A1 (ja) | 2017-03-16 |
| JP6065127B2 (ja) | 2017-01-25 |
Similar Documents
| Publication | Publication Date | Title |
|---|---|---|
| Waddington et al. | The LBDS Hercules sample of mJy radio sources at 1.4 GHz–II. Redshift distribution, radio luminosity function, and the high-redshift cut-off | |
| JP4915369B2 (ja) | 粒度分布測定装置及びそれを用いた体積濃度算出方法 | |
| JP5913787B2 (ja) | 粒度分布測定装置 | |
| JP2016048185A (ja) | 気泡径分布測定方法及び気泡径分布測定装置 | |
| JP6880059B2 (ja) | 粒子径分布測定装置及び粒子径分布測定装置用プログラム | |
| JP5088288B2 (ja) | 粒度分布測定装置および粒度分布測定プログラム | |
| JP6264229B2 (ja) | 気泡径分布測定方法及び気泡径分布測定装置 | |
| JP6579059B2 (ja) | データ処理方法、データ処理装置及びデータ処理プログラム | |
| JP6555164B2 (ja) | 粒子径分布測定装置、データ処理方法及びデータ処理プログラム | |
| JP6065127B2 (ja) | 粒度分布測定用データ処理装置及びこれを備えた粒度分布測定装置、並びに、粒度分布測定用データ処理方法及び粒度分布測定用データ処理プログラム | |
| JP6277973B2 (ja) | 気泡径分布測定方法及び気泡径分布測定装置 | |
| JP6112025B2 (ja) | 粒度分布測定用データ処理装置及びこれを備えた粒度分布測定装置、並びに、粒度分布測定用データ処理方法及び粒度分布測定用データ処理プログラム | |
| JP6189985B2 (ja) | 粒度分布測定装置 | |
| JP2016211945A (ja) | 粒子径分布測定装置、粒子径分布測定方法及び粒子径分布測定プログラム | |
| JP5381941B2 (ja) | 粒度分布測定装置 | |
| US20160131526A1 (en) | Spectroscopic Analysis System and Method | |
| JP4835389B2 (ja) | 回折・散乱光の光強度分布データの比較方法、および粒度分布測定装置 | |
| JPWO2014041620A1 (ja) | 粒度分布データ処理装置及びこれを備えた粒度分布測定装置、並びに、粒度分布データ処理方法及び粒度分布データ処理プログラム | |
| JP6729724B2 (ja) | データ処理装置及びデータ処理プログラム | |
| JP6787278B2 (ja) | 粒子径分布測定装置及び粒子径分布測定方法 | |
| JP5353626B2 (ja) | 粒度分布測定装置 | |
| JP6695553B2 (ja) | 表示制御装置及び粒子径分布測定装置 | |
| Ekberg | Shedding Light on Optical Scattering: A Detector-Centric Expedition in Prototype Development | |
| JP5549394B2 (ja) | 粒度分布測定装置 | |
| JPWO2018042752A1 (ja) | 信号分析装置、信号分析方法、コンピュータプログラム、測定装置及び測定方法 |
Legal Events
| Date | Code | Title | Description |
|---|---|---|---|
| 121 | Ep: the epo has been informed by wipo that ep was designated in this application |
Ref document number: 13898634 Country of ref document: EP Kind code of ref document: A1 |
|
| ENP | Entry into the national phase |
Ref document number: 2015551355 Country of ref document: JP Kind code of ref document: A |
|
| NENP | Non-entry into the national phase |
Ref country code: DE |
|
| 122 | Ep: pct application non-entry in european phase |
Ref document number: 13898634 Country of ref document: EP Kind code of ref document: A1 |