WO2014141862A1 - Procédé de mesure de quantité d'écart positionnel et dispositif d'enregistrement d'image - Google Patents
Procédé de mesure de quantité d'écart positionnel et dispositif d'enregistrement d'image Download PDFInfo
- Publication number
- WO2014141862A1 WO2014141862A1 PCT/JP2014/054370 JP2014054370W WO2014141862A1 WO 2014141862 A1 WO2014141862 A1 WO 2014141862A1 JP 2014054370 W JP2014054370 W JP 2014054370W WO 2014141862 A1 WO2014141862 A1 WO 2014141862A1
- Authority
- WO
- WIPO (PCT)
- Prior art keywords
- recording
- head
- density profile
- repetition period
- dot pattern
- Prior art date
Links
Images


Classifications
-
- B—PERFORMING OPERATIONS; TRANSPORTING
- B41—PRINTING; LINING MACHINES; TYPEWRITERS; STAMPS
- B41J—TYPEWRITERS; SELECTIVE PRINTING MECHANISMS, i.e. MECHANISMS PRINTING OTHERWISE THAN FROM A FORME; CORRECTION OF TYPOGRAPHICAL ERRORS
- B41J29/00—Details of, or accessories for, typewriters or selective printing mechanisms not otherwise provided for
- B41J29/38—Drives, motors, controls or automatic cut-off devices for the entire printing mechanism
- B41J29/393—Devices for controlling or analysing the entire machine ; Controlling or analysing mechanical parameters involving printing of test patterns
-
- B—PERFORMING OPERATIONS; TRANSPORTING
- B41—PRINTING; LINING MACHINES; TYPEWRITERS; STAMPS
- B41J—TYPEWRITERS; SELECTIVE PRINTING MECHANISMS, i.e. MECHANISMS PRINTING OTHERWISE THAN FROM A FORME; CORRECTION OF TYPOGRAPHICAL ERRORS
- B41J2/00—Typewriters or selective printing mechanisms characterised by the printing or marking process for which they are designed
- B41J2/005—Typewriters or selective printing mechanisms characterised by the printing or marking process for which they are designed characterised by bringing liquid or particles selectively into contact with a printing material
- B41J2/01—Ink jet
- B41J2/21—Ink jet for multi-colour printing
- B41J2/2132—Print quality control characterised by dot disposition, e.g. for reducing white stripes or banding
- B41J2/2135—Alignment of dots
-
- B—PERFORMING OPERATIONS; TRANSPORTING
- B41—PRINTING; LINING MACHINES; TYPEWRITERS; STAMPS
- B41J—TYPEWRITERS; SELECTIVE PRINTING MECHANISMS, i.e. MECHANISMS PRINTING OTHERWISE THAN FROM A FORME; CORRECTION OF TYPOGRAPHICAL ERRORS
- B41J2/00—Typewriters or selective printing mechanisms characterised by the printing or marking process for which they are designed
- B41J2/005—Typewriters or selective printing mechanisms characterised by the printing or marking process for which they are designed characterised by bringing liquid or particles selectively into contact with a printing material
- B41J2/01—Ink jet
- B41J2/21—Ink jet for multi-colour printing
- B41J2/2132—Print quality control characterised by dot disposition, e.g. for reducing white stripes or banding
- B41J2/2146—Print quality control characterised by dot disposition, e.g. for reducing white stripes or banding for line print heads
-
- B—PERFORMING OPERATIONS; TRANSPORTING
- B41—PRINTING; LINING MACHINES; TYPEWRITERS; STAMPS
- B41J—TYPEWRITERS; SELECTIVE PRINTING MECHANISMS, i.e. MECHANISMS PRINTING OTHERWISE THAN FROM A FORME; CORRECTION OF TYPOGRAPHICAL ERRORS
- B41J2/00—Typewriters or selective printing mechanisms characterised by the printing or marking process for which they are designed
- B41J2/005—Typewriters or selective printing mechanisms characterised by the printing or marking process for which they are designed characterised by bringing liquid or particles selectively into contact with a printing material
- B41J2/01—Ink jet
- B41J2/21—Ink jet for multi-colour printing
- B41J2/2132—Print quality control characterised by dot disposition, e.g. for reducing white stripes or banding
- B41J2/2142—Detection of malfunctioning nozzles
-
- B—PERFORMING OPERATIONS; TRANSPORTING
- B41—PRINTING; LINING MACHINES; TYPEWRITERS; STAMPS
- B41J—TYPEWRITERS; SELECTIVE PRINTING MECHANISMS, i.e. MECHANISMS PRINTING OTHERWISE THAN FROM A FORME; CORRECTION OF TYPOGRAPHICAL ERRORS
- B41J29/00—Details of, or accessories for, typewriters or selective printing mechanisms not otherwise provided for
- B41J29/38—Drives, motors, controls or automatic cut-off devices for the entire printing mechanism
- B41J29/393—Devices for controlling or analysing the entire machine ; Controlling or analysing mechanical parameters involving printing of test patterns
- B41J2029/3935—Devices for controlling or analysing the entire machine ; Controlling or analysing mechanical parameters involving printing of test patterns by means of printed test patterns
Definitions
- the present invention relates to a positional deviation amount measuring method for measuring a positional deviation amount of a recording position of a plurality of head modules of a recording head, and an image recording apparatus for measuring the positional deviation amount using this method.
- a line method is known in which an image is recorded in one drawing pass by a line head as the recording medium is conveyed.
- a long line head (recording head) is used along the width direction (main scanning direction) of the recording medium orthogonal to the conveyance direction (sub-scanning direction) of the recording medium. It is not practical to integrally form this line head with a silicon wafer, glass or the like due to problems such as yield, heat generation, and cost. Therefore, in the line method, it is usual to use a line head in which head modules in which nozzles are two-dimensionally arranged are arranged in the width direction of the recording medium.
- a line pattern extending in the width direction of the recording medium by one of the adjacent head modules is set to n pixels in the sub-scanning direction around the reference line.
- the first line group is formed by recording at intervals.
- the second head module forms the second line group by recording the line pattern at intervals of n + 1 pixels in the sub-scanning direction with the reference line as the center.
- the first line group and the second line group are compared, and the first line pattern of the first line group and the second line pattern of the second line group, which have the same position in the transport direction, are respectively identified. .
- the positional deviation amount is calculated as [k ⁇ ((n + 1) ⁇ n)] pixels.
- the amount of misregistration of the recording position between the head modules can be measured in units of pixels, so that the amount of misalignment can be corrected in units of pixels.
- the image quality of the recorded image is degraded unless the positional deviation amount of the recording position between the head modules is within about ⁇ 5 ⁇ m. For this reason, for example, when the recording resolution is 1200 dpi, it is necessary to measure the positional deviation amount of the recording position between the head modules with an accuracy of about 1/4 pixel.
- the test chart recorded by each head module is analyzed by the read image read by the image sensor of the image scanner, but the misalignment amount is measured with about 1/4 pixel. In order to do so, a high-resolution image sensor is required. As a result, the manufacturing cost of the apparatus for measuring the amount of displacement increases.
- An object of the present invention relates to a positional deviation amount measuring method capable of measuring a positional deviation amount of a recording position between head modules with high accuracy, and an image recording apparatus for measuring the positional deviation amount using this method.
- a positional deviation amount measuring method for achieving the object of the present invention includes a recording head formed by arranging a plurality of head modules having a plurality of recording elements in a first direction, and a recording medium orthogonal to the first direction. While relatively moving in the second direction, each of the first head module and the second head module of the plurality of head modules causes a dot pattern having a shape extending in the first direction to advance in the second direction.
- a recording step of recording on the recording medium at a predetermined interval, a reading step of optically reading the dot pattern recorded on the recording medium in the recording step, and a second image of the read image of the dot pattern read in the reading step A density profile calculation step for calculating a density profile indicating a change in density in the direction, and a calculation result of the density profile calculation step. Based on the calculation result of the repetition cycle calculation step and the repetition cycle calculation step that calculates the repetition cycle of the waveform corresponding to each dot pattern in the profile, the density profile data is integrated for each repetition cycle to obtain the integrated density profile.
- the peak position of the waveform corresponding to each dot pattern in the integrated density profile is obtained, and the first head module of the first head module is calculated based on each peak position.
- a positional deviation amount calculating step for calculating a positional deviation amount in the second direction between the recording position and the recording position of the second head module.
- the positional deviation amount in the second direction of the recording position between the head modules based on the read image of the dot pattern recorded on the recording medium at a predetermined interval in the second direction for each head module. Therefore, the amount of positional deviation in the second direction of the recording position between the head modules can be measured with high accuracy without using a high-resolution image sensor.
- the density profile calculating step corresponds to the first density profile corresponding to the first dot pattern recorded by the first head module and the second dot pattern recorded by the second head module as the density profile.
- Each of the second density profiles to be calculated, and the repetition period calculating step includes a first repetition period of a waveform corresponding to the first dot pattern as a repetition period based on the first and second density profiles; A second repetition period indicating a repetition period of a waveform corresponding to the second dot pattern is calculated, and the integrated density profile calculation step uses the first density profile data as the integrated density profile for the first repetition period.
- a first integrated concentration profile that is integrated every time, and a second integrated concentration profile A second integrated density profile obtained by integrating the degree profile data every second repetition period is calculated, and the positional deviation amount calculating step corresponds to the first dot pattern in the first integrated density profile.
- a first peak position of the waveform and a second peak position of the waveform corresponding to the second dot pattern in the second integrated density profile are respectively obtained, and a difference between the first peak position and the second peak position is obtained. It is preferable to calculate the amount of displacement based on the above. As a result, the positional deviation amount in the second direction of the recording position between the head modules can be measured with high accuracy.
- the first head module and the second head module are adjacent to each other in the first direction.
- the inclination of the recording head rotational displacement of the recording head about the direction perpendicular to the recording medium surface
- the error in the conveyance speed of the recording medium the deformation of the recording medium
- the error in reading the read image of the dot pattern etc. Therefore, the positional deviation amount can be measured with higher accuracy.
- the recording step records in a recording area other than the overlapping area. It is preferable to record the first dot pattern and the second dot pattern respectively by the recording elements of the first and second head modules to be performed. As a result, even when the recording areas of the head modules adjacent in the first direction overlap, it is possible to measure the positional deviation amount of the recording position between the head modules in the second direction with high accuracy.
- the recording step is performed as a dot pattern in the overlapping recording area.
- a third repetition period indicating the repetition period of the waveform corresponding to the pattern is calculated.
- the positional deviation amount calculating step includes the first integrated density profile.
- the first peak position of the waveform corresponding to the dot pattern and the second peak position of the waveform corresponding to the second dot pattern are respectively obtained, and the difference between the first peak position and the second peak position is obtained. Based on this, the amount of displacement is calculated.
- the repetition cycle calculation step is a temporary integration concentration profile calculation step for calculating the provisional integrated concentration profile by integrating the concentration profile data for each provisional repetition cycle, and the provisional integration concentration profile calculation while changing the provisional repetition cycle.
- the maximum value is maximized by comparing the repetitive step of repeatedly executing the step to calculate the provisional integrated concentration profile for each provisional repetition period and the maximum value of the provisional integrated concentration profile for each provisional repetition period.
- a determination step for determining a provisional repetition period as a repetition period. Thereby, the repetition period can be calculated more accurately.
- the density profile calculating step further includes a complementing process step that performs a complementing process on the density profile calculated to increase the resolution in the second direction of the density profile, and the repetition period calculating step is subjected to the complementing process. It is preferable to calculate the repetition period based on the concentration profile. Thereby, it is possible to calculate the positional deviation amount with higher accuracy.
- the first direction is preferably the width direction of the recording medium.
- the recording head is preferably an inkjet head.
- An image recording apparatus for achieving an object of the present invention includes a recording head in which a plurality of head modules each having a plurality of recording elements are arranged in a first direction, and the recording head and the recording medium orthogonal to the first direction.
- the relative movement unit that relatively moves in the second direction, the recording head, and the relative movement unit are controlled, and each of the first head module and the second head module among the plurality of head modules controls the first.
- the calculation result of the density profile calculation unit and the density profile calculation unit Based on the calculation result of the repetition cycle calculation unit that calculates the repetition cycle of the waveform corresponding to each dot pattern in the density profile, and the calculation result of the repetition cycle calculation unit, Based on the calculation result of the integrated density profile calculation unit and the integrated density profile calculation unit that integrates the density profile data every repetition cycle to calculate the integrated density profile, the waveform corresponding to each dot pattern in the integrated density profile
- a positional deviation amount calculation unit that obtains a peak position and calculates a positional deviation amount in the second direction between the recording position of the first head module and the recording position of the second head module based on each peak position.
- the positional deviation amount measuring method and the image recording apparatus of the present invention can measure the positional deviation amount of the recording position between the head modules with high accuracy.
- FIG. 1 is a schematic diagram of an inkjet printer according to a first embodiment.
- FIG. 3 is a top view of the recording head according to the first embodiment. It is explanatory drawing for demonstrating the position shift of the recording position of 1st Embodiment. It is a functional block diagram of CPU of 1st Embodiment. It is the schematic of the test chart of 1st Embodiment.
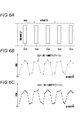
- FIGS. 6A and 6B are diagrams for explaining the calculation of the first density profile, and FIG. 6C is an explanatory diagram for explaining the complementing process.
- FIG. 7A is a diagram for explaining the calculation of the repetitive cycle length
- FIG. 7B is a diagram for explaining the calculation of the first integrated density profile
- FIG. 7C is a diagram for explaining the calculation of the reference positional deviation amount ⁇ y1. It is the flowchart which showed the flow of the calculation process of repetition period length. It is explanatory drawing for demonstrating the process of step S9 in FIG. It is the flowchart which showed the flow of the calculation process of reference
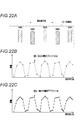
- FIG. 22A and 22B are diagrams for explaining the calculation of the third density profile
- FIG. 22C is an explanatory diagram for explaining the complementing process.
- FIG. 23A is a diagram for explaining the calculation of the repetition period length
- FIG. 23B is a diagram for explaining the calculation of the third integrated density profile
- FIG. It is the flowchart which showed the flow of the calculation process of positional offset amount (DELTA) Y. It is explanatory drawing for demonstrating concretely calculation of positional offset amount (DELTA) Y. It is the flowchart which showed the flow of the positional offset amount measurement process of 3rd Embodiment.
- It is the schematic of the inkjet printer of another example. It is the schematic which shows the structural example of an inkjet head. It is sectional drawing of an inkjet head.
- FIG. 1 An ink jet printer (hereinafter simply referred to as a printer) 10 corresponding to the image recording apparatus of the present invention is connected to an external host computer 11.
- This printer 10 has a recording paper 13 from a recording head 14 to a recording paper (recording medium, see FIG. 2) 13 conveyed by a conveying mechanism (relative movement unit) 12 based on image data input from the host computer 11.
- An image is recorded by ejecting ink droplets on the top.
- FIG. 1 shows only a part mainly related to image data processing.
- the printer 10 includes an image scanner (reading unit) 16, a host interface (I / F) unit 17, an image page memory 18, an image buffer memory write control unit 19, an image, in addition to the transport mechanism 12 and the recording head 14 described above.
- a buffer memory 20, a post-processing operation unit 21, a transfer control unit 22, a head driver 23, a CPU 24, and the like are provided.
- the host I / F unit 17, the image page memory 18, the image buffer memory write control unit 19, and the CPU 24 are connected via a bus 25.
- the transport mechanism 12 moves the recording paper 13 relative to the recording head 14 in the sub-scanning direction (second direction) perpendicular to the width direction and passes under the recording head 14.
- the recording head 14 ejects ink from the nozzles 27 arranged on the lower surface (nozzle surface) thereof, and forms an image on the recording paper 13 that is moving relatively.
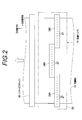
- FIG. 2 is a top view of the recording head 14 and illustrates the recording head 14 through the nozzles 27 arranged on the bottom surface.
- the arrangement of the nozzles 27 is simplified in order to prevent the drawing from becoming complicated.
- the recording head 14 is a line head that extends in the main scanning direction (first direction) parallel to the width direction of the recording paper 13 and has a length corresponding to the width of the recording paper 13. .
- the recording head 14 is provided for each recording color (CMYK).
- the recording head 14 includes three replaceable head modules (two, or four or more) of the first head module 28A, the second head module 28B, and the third head module 28C, and the head modules 28A to 28A. And a frame 29 for holding 28C.
- the head modules 28A to 28C are arranged in a staggered pattern along the main scanning direction. The end portions of two head modules adjacent to each other (adjacent) in each of the head modules 28A to 28C overlap each other.
- the nozzles 27 of the head modules 28A to 28C are arranged so that they can be handled equivalently to those arranged in a straight line at a substantially constant pitch in the main scanning direction. Therefore, the ink droplets adjacent to the main scanning direction (here, the right direction in FIG. 2) of the ink droplets ejected by the nozzle 27 on the rightmost side in FIG. 2 of the first head module 28A are the same as those in the second head module 28B. Drops can be ejected by the nozzle 27 on the left end side in FIG. Further, the ink droplets adjacent to the main scanning direction (here, the right direction in FIG. 2) of the ink droplets ejected by the nozzle 27 on the rightmost side in FIG. 2 of the second head module 28B are the same as those in the third head module 28C. Drops can be ejected by the nozzle 27 on the left end side in FIG.
- the image scanner 16 is disposed at a position downstream of the recording head 14 in the recording sheet conveyance direction and at a position facing the recording surface of the recording sheet 13.
- the image scanner 16 extends in the main scanning direction and has a length corresponding to the width of the recording paper 13.
- the image scanner 16 optically reads a test chart 31 (see FIG. 5) recorded on the recording surface of the recording paper 13 by the recording head 14, and reads test chart read image data 32 (hereinafter referred to as a read image of the present invention).
- a read image data see FIG.
- the image scanner 16 a scanner having a resolution in the sub-scanning direction of about 100 dpi is used. That is, in this embodiment, the test chart 31 is read without using a high-resolution image scanner.
- the host I / F unit 17 is a communication interface that receives image data sent from the host computer 11, and various serial interfaces and parallel interfaces can be used.
- the host I / F unit 17 sends the received image data to the image page memory 18.
- the image page memory 18 stores image data input from the host I / F unit 17, and a DRAM having a storage capacity capable of storing print data for one page is used.
- the image buffer memory writing control unit 19 reads out the print data for one line from the image page memory 18 line by line and transfers it to the image buffer memory 20.
- the print data for one line is transferred to the image buffer memory 20 and stored at successive addresses on the image buffer memory 20.
- the image buffer memory 20 stores print data for a plurality of lines.
- the post-processing computing unit 21 performs post-processing (correction) on the image buffer memory 20, such as mask processing (droplet ejection prohibiting processing) for abnormal nozzles, shading correction processing (processing for adjusting the droplet ejection rate for each nozzle), and the like. Process).
- the post-processed data is written back to the image buffer memory 20.
- the transfer control unit 22 reads the print data for one droplet ejection (for all the nozzles of each head module 28A to 28C) from the image buffer memory 20, and transfers this print data to the head driver 23.
- the transfer control unit 22 performs division processing for dividing print data for one droplet ejection for each of the head modules 28A to 28C and transmitting the print data to the head driver 23, and transfer format adjustment.
- the head driver 23 includes three drivers (not shown) that individually control the driving of the head modules 28A to 28C.
- the head driver 23 controls the driving of actuators (not shown) corresponding to the nozzles 27 of the head modules 28A to 28C based on the print data for the head modules 28A to 28C input from the transfer control unit 22, Ink droplets are ejected from each nozzle 27.
- An image is formed on the recording surface of the recording paper 13 by controlling ink ejection from each of the head modules 28A to 28C in synchronization with the conveyance speed of the recording paper 13.
- the CPU 24 performs overall control of each unit of the printer 10 by sequentially executing various programs and data read from the memory 34 based on an input signal from an operation unit (not shown).
- test chart data 35 (see FIG. 4) which is image data of the test chart 31 is stored in addition to the above-described various programs.
- the RAM area of the memory 34 is also used as a development area for programs executed by the CPU 24 and an arithmetic work area for the CPU 24.
- the CPU 24 analyzes the read image data 32 input from the image scanner 16, and calculates a positional deviation amount ⁇ Y in the sub-scanning direction of the recording position between any two head modules of the head modules 28A to 28C. Calculate (see FIG. 13). Further, the CPU 24 executes a positional deviation correction process for correcting the recording position between the head modules based on the detection result of the positional deviation amount ⁇ Y.
- positional deviation in the sub-scanning direction is simply referred to as “positional deviation”.
- the displacement of the recording position between the head modules occurs due to the actual displacement of the head modules 28A to 28C, for example. Further, although not shown in the figure, the recording position is also displaced by the flying bend of the ink droplets 36 ejected from the nozzles 27 of the head modules 28A to 28C.
- the CPU 24 reads out and executes a program relating to the measurement of the positional deviation amount ⁇ Y and the positional deviation correction from the memory 34, thereby executing a test chart recording control unit (recording control unit) 38 and density profile data calculation.
- the test chart recording control unit 38 is used when the printer 10 is turned on, when any of the head modules 28A to 28C is replaced, when a misregistration amount ⁇ Y is measured, when a predetermined number of sheets are recorded, when a predetermined time elapses, etc.
- the test chart 31 is recorded at a predetermined timing.
- the test chart recording control unit 38 outputs the test chart data 35 read from the memory 34 to the image page memory 18 at the predetermined timing described above, and the image buffer memory write control unit 19, the transfer control unit 22, and the head.
- the driver 23 is operated. As a result, print data corresponding to one droplet ejection based on the test chart data 35 is sequentially transferred to the head through the image buffer memory write control unit 19, the image buffer memory 20, the post-processing calculation unit 21, and the transfer control unit 22. It is transferred to the driver 23.
- the head driver 23 controls ink ejection from the nozzles 27 of the head modules 28A to 28C based on the print data.
- a test chart 31 is recorded on the recording surface of the recording paper 13 by ejecting ink droplets 36 by the head modules 28A to 28C while transporting the recording paper 13 by the transport mechanism 12.
- the ink discharge timings of the head modules 28A to 28C are set to predetermined values so that the test chart 31 recorded on the recording surface has substantially the same shape as the test chart data 35. It is desirable to record.
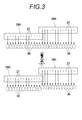
- the test chart 31 includes a first dot pattern group 48A, a second dot pattern group 48B, and a third dot pattern group (not shown) recorded by each of the head modules 28A to 28C.
- first dot pattern group 48A for example, 150 first dot patterns 50A having a shape extending long in the main scanning direction (for example, 5 pixl ⁇ 64 pixl) are recorded at a predetermined pattern interval W1 (repetition period) in the sub scanning direction.
- the “pattern interval W1” here is an interval between the center positions of the dot patterns adjacent to each other in the sub-scanning direction, an interval between the center positions, and an interval between specific dots.
- second dot pattern group 48B for example, 150 second dot patterns 50B having the same shape as the first dot pattern 50A are recorded at a pattern interval W1 (repetition cycle) in the sub-scanning direction.
- Each second dot pattern 50B is recorded with a deviation in the sub-scanning direction by an amount corresponding to the positional deviation of the first and second head modules 28A and 28B with respect to each first dot pattern 50A.
- the third dot pattern group also has a third dot pattern (not shown) having the same shape as the first dot pattern 50A at a pattern interval W1 in the sub-scanning direction. For example, 150 are recorded.
- Such a test chart 31 is read by the image scanner 16.
- the read image data 32 is output from the image scanner 16 to the density profile data calculation unit 39.
- each of the units 39 to 44 from the density profile data calculating unit 39 to the positional deviation amount calculating unit 44 is based on the read image data 32, and between two adjacent head modules of the head modules 28A to 28C.
- the positional deviation amount ⁇ Y of the recording position is calculated.
- the first and second head modules 28A and 28B correspond to the first head module and the second head module of the present invention
- the first and second dot patterns 50A and 50B correspond to the first dot pattern and the second head module of the present invention. This corresponds to a dot pattern of 2.
- the positional deviation amount ⁇ Y is calculated by calculating the deviation amounts of the recording positions of the first and second head modules 28A and 28B from predetermined reference positions (hereinafter referred to as reference positional deviation amounts), respectively. It is calculated by comparing the amount of deviation.
- the calculation of the reference position deviation amount is executed by each of the units 39 to 43 from the density profile data calculation unit 39 to the reference position deviation amount calculation unit 43.
- calculation of the reference position deviation amount of the recording position of the first head module 28A will be described.
- the density profile data calculation unit 39 analyzes the read image data 32 and density in the sub-scanning direction of the image area where the first dot pattern group 48A is recorded. A first density profile 53A indicating a change is calculated.
- the first concentration profile 53A based on the reference position X 0 a predetermined shows the density change of the image region along the sub-scanning direction from the reference position X 0.
- the density at the position corresponding to each first dot pattern 50A is high, and conversely, the density at the position corresponding to between the first dot patterns 50A is low.
- Reference position X 0 for example, the first dot pattern 50A located at one end portion in the sub-scanning direction of the first dot pattern group 48A, a direction parallel to the sub scanning direction and in a direction away from the first dot pattern group 48A
- the position is at most (W1) / 2 apart.
- the reference position X 0 may be changed as appropriate, it may be between for example the first dot pattern 50A.
- the resolution in the sub-scanning direction of the image scanner 16 (for example, 100 dpi) is lower than the resolution in the sub-scanning direction of the test chart 31 (for example, 600 dpi), so the resolution in the sub-scanning direction of the first density profile 53A. Becomes lower. That is, the interval in the sub-scanning direction between the measurement points of the first density profile 53A is increased.
- the density profile data calculation unit 39 outputs the first density profile 53A to the complement processing unit 40.
- the complement processing unit 40 complements linear interpolation data (also referred to as interpolation) between measurement values at each measurement point of the first density profile 53A (linear interpolation processing). To increase the resolution in the sub-scanning direction of the first density profile 53A from 100 dpi to 10000 dpi.
- the resolution of the image sensor of the image scanner 16 is “R m ”
- the resolution when the resolution is increased is “R h ”
- the measurement value (density value) at an arbitrary measurement point i is “D i ”
- the linear interpolation data “D i (j) ” is expressed by the following equation (1).
- j is an integer of 1 to ((R h ⁇ R m ) ⁇ 1).
- the complement processing unit 40 outputs the first resolution profile 53A1 with high resolution to the repetition period calculation unit 41.
- D i (j) (((R h ⁇ R m ) ⁇ 1) ⁇ D i + j ⁇ D i + 1 ) ⁇ (R h ⁇ R m ) (1)
- the repetition cycle calculation unit 41 is based on the first density profile 53A1 and repeats the density change repetition cycle corresponding to the first dot pattern 50A (that is, how long the peak of the density value is).
- the repetition period length W2 is calculated.
- the repetition cycle length W2 does not completely coincide with the above-described pattern interval W1, and is repeatedly caused by resolution fluctuation factors such as an error in the conveyance speed of the recording paper 13, deformation of the recording paper 13, and reading error of the image scanner 16. An error of about several percent occurs between the cycle length W2 and the pattern interval W1.
- the repetition cycle length W2 is not accurately obtained, the peak value corresponding to each first dot pattern 50A is averaged during integration averaging by an integration density profile calculation unit 42, which will be described later. It cannot be performed and an accurate peak position (see FIG. 11) cannot be obtained. Therefore, the repetition period calculation unit 41 accurately calculates the repetition period length W2 by the following method.
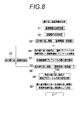
- the repetition period calculation unit 41 first calculates an approximate period (for example, a repetition period when the above-described resolution variation factors such as the above-described pattern interval W1 are ignored) as a temporary repetition.
- the cycle is determined as a reference cycle (high resolution value) (step S1).
- the repetition period calculation unit 41 determines a value from several percent to 10% of the reference period as the fluctuation width of the provisional repetition period (step S2). That is, the provisional repetition period is changed stepwise between (reference period ⁇ variation range) to (reference period + variation range).
- the repetition period calculation unit 41 sets the first provisional repetition period to “reference period—variation width” (step S3). After this setting, the repetition cycle calculation unit 41 calculates a temporary integrated concentration profile obtained by averaging the concentration values of the first concentration profile 53A1 for each temporary repetition cycle (step S4, temporary integrated concentration profile calculation step). .
- the provisional cumulative density profile is basically the same as a first cumulative density profile 56A (see FIG. 7B) described later. Then, the repetition period calculation unit 41 obtains the maximum value (maximum amplitude, intensity) of the provisional cumulative concentration profile (step S5).
- the repetition period calculation unit 41 determines a period obtained by increasing the initial provisional repetition period by several percent of the above-described fluctuation range as a new provisional repetition period (NO in step S6, step S7). Then, the repetition period calculation unit 41 repeatedly executes the calculation of the temporary integrated density profile and the calculation of the maximum value based on the new temporary repetition period (steps S4 and S5). Similarly, the repetition period calculation unit 41 repeats the processes of steps S7, S4, and S5 until the maximum value of the provisional integrated density profile corresponding to the final provisional repetition period (reference period + variation width) is calculated. Execute (NO in step S6, repeat step).
- the repetition period calculation unit 41 calculates the temporary integrated concentration profile for each temporary repetition period after calculating the maximum value of the temporary integration density profile corresponding to all temporary repetition periods (YES in step S ⁇ b> 6). Are compared (step S8).
- the repetition period calculation unit 41 determines the period length of the provisional repetition period having the maximum maximum value as the repetition period length W2 (step S9, determination step). Thereby, the repetition cycle length W2 can be accurately calculated.
- the repetition cycle calculation unit 41 outputs the calculation result of the repetition cycle length W2 to the integrated concentration profile calculation unit 42 together with the first concentration profile 53A1 described above.
- the integrated concentration profile calculation unit 42 averages the concentration values of the first concentration profile 53A1 for each repetition period length W2, and thereby calculates the first integrated concentration profile. 56A is calculated.
- the integrated density profile calculation unit 42 outputs the first integrated density profile 56 ⁇ / b> A to the reference position deviation amount calculation unit 43.
- the reference position deviation amount calculation unit 43 analyzes the first integrated density profile 56A and calculates the reference position deviation amount ⁇ y1 of the recording position of the first head module 28A.
- a method for calculating the reference position deviation amount ⁇ y1 will be specifically described.
- the reference position deviation amount calculation unit 43 determines the threshold value Th of the data of the first integrated density profile 56A using, for example, the following equation (2). Then, the reference position deviation amount calculation unit 43 extracts data exceeding the threshold value Th from the data of the first integrated density profile 56A (step S12).
- Threshold value Th (maximum value ⁇ minimum value) ⁇ f + minimum value: (f is 0.5, for example) (2)
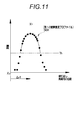
- the peak position is the position where the waveform of the integrated density profile is maximum. For example, in the case of the integrated density profile where the data corresponding to the portion where the dot pattern is not recorded is maximum, the waveform is the waveform.
- the position at which is minimized is the peak position (the same applies to other embodiments). Then, the reference positional deviation amount calculation unit 43 outputs the calculation result of the reference positional deviation amount ⁇ y1 to the positional deviation amount calculation unit 44. Thus, the calculation of the reference position deviation amount ⁇ y1 of the recording position of the first head module 28A is completed.
- the units 39 to 43 from the density profile data calculation unit 39 to the reference position deviation amount calculation unit 43 calculate the reference position deviation amount ⁇ y2 of the recording position of the second head module 28B.
- the calculation process of the reference position deviation amount ⁇ y2 is basically the same as the calculation process of the reference position deviation amount ⁇ y1 described above.
- the density profile data calculation unit 39 analyzes the read image data 32 and calculates a second density profile 53B indicating a change in density in the sub-scanning direction of the image area where the second dot pattern group 48B is recorded.
- the second concentration profile 53B based on the reference position X 0 as defined in the calculation of the first concentration profile 53A described above, a density change of the image region along the sub-scanning direction from the reference position X 0 It is shown. That is, the first and second concentration profile 53A, 53B shows the concentration variation along the sub-scanning direction from a common reference position X 0.
- the complement processing unit 40 performs linear complement processing on the second density profile 53B to increase the resolution of the second density profile 53B in the sub-scanning direction from 100 dpi to 10000 dpi. As a result, a high-resolution second density profile 53B1 is generated.
- the repetition period calculation unit 41 uses the method shown in FIGS. 8 and 9 described above, and based on the second density profile 53B1, the repetition period length W2 indicating the repetition period of the density change corresponding to the second dot pattern 50B. Is calculated.
- the integrated concentration profile calculation unit 42 calculates the second integrated concentration profile 56B by averaging the data of the second concentration profile 53B1 every repetition cycle length W2.
- Reference position deviation amount calculating section 43 as shown in FIGS. 10 and 11 described above, to calculate the peak position X P of the second cumulative concentration profiles 56B, based on the peak position X P, the second head module A reference position deviation amount ⁇ y2 of the recording position 28B is calculated. Then, the reference position deviation amount calculation unit 43 outputs the calculation result of the reference position deviation amount ⁇ y2 to the position deviation amount calculation unit 44.
- position shift amount calculation unit 44 calculates the position deviation amount [Delta] Y.
- Each reference position deviation amount .DELTA.y1, .DELTA.y2 (each peak position X P), since it is calculated as each reference a common reference position X 0, the first and second head modules 28A by taking the difference between the two, 28B It is possible to calculate the positional deviation amount ⁇ Y of the recording position between.
- the positional deviation amount calculation unit 44 outputs the calculation result of the positional deviation amount ⁇ Y to the positional deviation correction processing unit 45.
- the positional deviation amount ⁇ Y includes a deviation amount from the design position shown in FIG. 3, a deviation amount due to the staggered arrangement, and an error in ink ejection timing set in each head module at the time of test chart recording. This is the amount of positional deviation.
- the misregistration correction processing unit 45 performs misregistration correction processing for correcting the recording position between the first and second head modules 28A and 28B based on the detection result of the misregistration amount ⁇ Y.
- the misalignment correction processing unit 45 controls the post-processing calculation unit 21 to perform misalignment correction processing on the print data, and sets the recording start timing of one of the first and second head modules 28A and 28B to the other. Accelerate or delay against Thereby, the displacement of the recording position between the first and second head modules 28A, 28B is corrected.
- Various methods are known as misregistration correction methods for correcting the misregistration of the recording position between the head modules, and any of these may be used.
- each unit 39 of the CPU 24 is displayed. ⁇ 45 are activated to start the measurement process of the positional deviation amount ⁇ Y (step S20).
- Test chart recording process As shown in FIG. 15, after the test chart data 35 in the memory 34 is output to the image page memory 18 under the control of the test chart recording control unit 38, the image buffer memory write control unit 19 and the image buffer memory 20 are output.
- the print data for one droplet ejection based on the test chart data 35 is sequentially transferred to the head driver 23 via the transfer control unit 22.
- the head driver 23 controls ink ejection from the nozzles 27 of the head modules 28A to 28C based on the print data.
- the test chart 31 is recorded on the recording surface of the recording paper 13 by ejecting ink droplets 36 by the head modules 28A to 28C while conveying the recording paper 13 in the sub-scanning direction by the transport mechanism 12. (Step S21, recording step).
- the CPU 24 After recording the test chart 31, the CPU 24 tracks the test chart 31 based on the known conveyance speed information of the recording paper 13. Then, the CPU 24 starts reading by the image scanner 16 in accordance with the timing when the test chart 31 passes the image scanner 16. As a result, the test chart 31 is read by the image scanner 16, and the read image data 32 is output from the image scanner 16 to the density profile data calculation unit 39 (step S22, reading step).
- the density profile data calculation unit 39 identifies two head modules, that is, the first and second head modules 28A and 28B that are the measurement targets of the positional deviation amount ⁇ Y (step S23). Next, a calculation process of the reference position deviation amount ⁇ y1 of the recording position of the first head module 28A is started (step S24).
- the density profile data calculation unit 39 analyzes the read image data 32 to calculate the first density profile 53A as shown in FIG. 6B (step S26, density profile calculation). Step).
- the first density profile 53A is output from the density profile data calculation unit 39 to the complement processing unit 40.
- the complement processing unit 40 performs linear complement processing on the first density profile 53A, thereby generating the first density profile 53A1 having a higher resolution as shown in FIG. 6C (step S27). , Complementary processing step).
- the reference positional deviation amount ⁇ y1 that is, the positional deviation amount ⁇ Y
- the first density profile 53A1 is output from the complement processing unit 40 to the repetition period calculation unit 41.
- the repetition period calculation unit 41 executes the processing from step S1 to step S9 shown in FIG. 8 to thereby repeat the density change repetition period corresponding to the first dot pattern 50A as shown in FIG. 7A. Is calculated (step S28, repetition cycle calculation step). By accurately calculate the repetition period length W2, it is possible to accurately calculate the peak position X P of the first integration density profile 56A.
- the calculation result of the repetition cycle length W2 is output from the repetition cycle calculation unit 41 to the integrated concentration profile calculation unit 42 together with the first concentration profile 53A1.
- the integrated concentration profile calculation unit 42 calculates the first integrated concentration profile 56A by integrating and averaging the data of the first concentration profile 53A1 for each repetition period length W2.
- Step S29 integrated density profile calculation step).
- the first integrated density profile 56A is output from the integrated density profile calculation unit 42 to the reference position deviation amount calculation unit 43.
- the reference position deviation amount calculation unit 43 executes the processing from step S12 to step S14 shown in FIG. 10, so that the recording position of the first head module 28 ⁇ / b> A is obtained as shown in FIG. 7C and FIG. 11.
- the reference position deviation amount ⁇ y1 is calculated (step S30).
- the calculation result of the reference positional deviation amount ⁇ y1 is output from the reference positional deviation amount calculation unit 43 to the positional deviation amount calculation unit 44. This completes the calculation processing of the reference position deviation amount ⁇ y1 (see step S24, FIG. 15).
- Positional deviation amount calculating section 44 calculates the positional deviation amount [Delta] Y (step S33, positional deviation amount calculating step).
- the calculation result of the positional deviation amount ⁇ Y is output from the positional deviation amount calculation unit 44 to the positional deviation correction processing unit 45. This completes the positional deviation amount measurement process (step S20, see FIG. 14).
- Step S36 when a print start operation is performed by an operation unit (not shown) or the like (step S36), image data sent from the host computer 11 is stored in the image page memory 18 via the host I / F unit 17. (Step S37). Then, under the control of the CPU 24, print data for one droplet ejection based on the image data is sequentially transferred to the head driver 23. At this time, the misregistration correction processing unit 45 controls the post-processing calculation unit 21 based on the detection result of the misregistration amount ⁇ Y, and performs misregistration correction processing on the print data. Thereby, the displacement of the recording position between the first and second head modules 28A, 28B is corrected (step S38).
- the head driver 23 controls ink ejection from the nozzles 27 of the head modules 28A to 28C based on the print data. Then, while transporting the recording paper 13 in the sub-scanning direction by the transport mechanism 12, ink droplets 36 are ejected by the head modules 28A to 28C. Thereby, an image based on the image data is recorded on the recording surface of the recording paper 13 (step S39).
- step S40 When printing is performed again based on other image data (YES in step S40), the above-described processing from step S37 to step S39 is repeatedly executed.
- step S41, step S42 the measurement processing of the positional deviation amount ⁇ Y is executed again (YES in step S41, step S42). Thereby, the processing from step S21 to step S30 shown in FIG. 15 and FIG. 16 is repeatedly executed, and a new positional deviation amount ⁇ Y is measured.
- the first and second integrated density profiles 56A and 56B are calculated based on the read image of the test chart 31, and the positional deviation amount ⁇ Y is measured based on the first and second integrated density profiles 56A and 56B. Without using a sensor, it is possible to measure the amount of displacement of the recording position between the head modules with low cost and high accuracy.
- the printer 70 according to the second embodiment of the present invention will be described with reference to FIG.
- the recording areas where the head modules 28A to 28C perform recording on the recording paper 13 do not overlap, but in the printer 70, the recording areas of the head modules adjacent to each other overlap.
- the printer 70 has basically the same configuration as the printer 10 of the first embodiment, except that the printer 70 includes a recording head 72 different from that of the first embodiment. For this reason, the same reference numerals are given to the same functions and configurations as those in the first embodiment, and the description thereof is omitted.
- the recording head 72 includes three replaceable head modules (two, or four or more) of the first head module 73A, the second head module 73B, and the third head module 73C, and the frame body 29. I have.
- the head modules 73A to 73C are arranged in a staggered pattern along the main scanning direction. The ends of two head modules adjacent to each other in each of the head modules 73A to 73C overlap each other.
- Each of the head modules 73A to 73C corresponds to a first head module and a second head module of the present invention, respectively.
- Some nozzles 27a of the first head module 73A and the second head module 73B are arranged so that the positions in the main scanning direction overlap. Further, some of the nozzles 27a of the second head module 73B and the third head module 73C are also arranged so that the positions in the main scanning direction overlap. As a result, a part of the recording area of the first head module 73A and the recording area of the second head module 73B overlap, and one of the recording area of the second head module 73B and the recording area of the third head module 73C. Parts overlap.
- an overlap recording area is referred to as an “overlap recording area”
- a recording area other than the overlap recording area is referred to as a “non-overlapping recording area”.
- the positional deviation of the recording position between the head modules 73A to 73C is omitted as in the first embodiment shown in FIG. 3, and the positional deviation of the head modules 73A to 73C is omitted. Is generated by the flying bend of the ink droplet 36.
- Such a measurement method of the positional deviation amount ⁇ Y of the recording position of each of the head modules 73A to 73C is the same as that of the first embodiment except that a test chart 75 (see FIG. 19) different from the first embodiment is recorded on the recording paper 13. This is basically the same as the measurement method described in the embodiment.
- the test chart recording control unit 38 outputs the test chart data 35 to the image page memory 18 as in the first embodiment, and operates the image buffer memory write control unit 19, the transfer control unit 22, and the head driver 23.
- the test chart 75 is recorded. However, at this time, the test chart recording control unit 38 prohibits (stops) the ejection of the ink droplets 36 from the nozzles 27a. That is, the test chart 75 is recorded in the non-overlapping recording area only by the nozzles 27 of the head modules 73A to 73C.
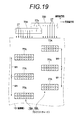
- the test chart 75 includes a first dot pattern group 76A, a second dot pattern group 76B, and a third dot pattern group (illustrated) recorded by only the nozzles 27 of the head modules 73A to 73C. Is omitted).
- the first dot pattern group 76A is obtained by recording, for example, 150 first dot patterns 77A having a shape extending in the main scanning direction at a pattern interval W1 (repetition period) in the sub scanning direction.
- the second dot pattern group 76B for example, 150 second dot patterns 77B having the same shape as the first dot pattern 77A are recorded at a pattern interval W1 (repetition cycle) in the sub-scanning direction.
- Each second dot pattern 50B is recorded with a deviation in the sub-scanning direction by an amount corresponding to the positional deviation of the first and second head modules 73A and 73B with respect to each first dot pattern 50A.
- third dot patterns for example, 150 third dot patterns (not shown) having the same shape as the first dot pattern 77A are recorded at the pattern interval W1 in the sub-scanning direction.
- the dot patterns 77A and 77B correspond to the first dot pattern and the second dot pattern of the present invention.
- test chart 75 is the same as the test chart 31 of the first embodiment except that the lengths of the first and second dot patterns 77A and 77B in the main scanning direction are different. Therefore, as in the first embodiment, the processing from step S21 to step S33 shown in FIG. 15 and FIG. A positional deviation amount ⁇ Y of the recording position can be calculated. In addition, it is possible to correct the positional deviation based on the calculation result of the positional deviation amount ⁇ Y. Thereby, the effect similar to the said 1st Embodiment is acquired.
- the printer 80 according to the third embodiment of the present invention will be described with reference to FIG.
- the test chart 75 is recorded only by the nozzles 27 of the head modules 73A to 73C.
- the test chart 81 is recorded in the overlap recording area of the recording paper 13 using only the nozzles 27a of the head modules 73A to 73C, and the positional deviation is based on the read image of the test chart 81.
- the quantity ⁇ Y is measured.
- the printer 80 has basically the same configuration as the printer 10 of the first embodiment except that the printer 80 includes a CPU 83 and a recording head 72 different from those of the first embodiment. Further, the recording head 72 of the printer 80 has the same configuration as the recording head 72 of the second embodiment. Therefore, the same functions and configurations as those of the first and second embodiments are denoted by the same reference numerals, and the description thereof is omitted.
- the CPU 83 reads out and executes a program related to the measurement of the positional deviation amount ⁇ Y and the positional deviation correction from the memory 34, thereby executing a test chart recording control unit (recording control unit) 85, a density profile data calculation unit 86, and a complementary processing unit 87. , Function as a repetition period calculation unit 88, an integrated density profile calculation unit 89, a positional deviation amount calculation unit 90, and a positional deviation correction processing unit 45.
- Test chart recording The test chart recording control unit 85 outputs the test chart data 35 to the image page memory 18 as well as the image buffer memory write control unit 19 and the transfer control unit 22, similarly to the test chart recording control unit 38 of the first embodiment. And the head driver 23 is operated to record the test chart 81. However, at this time, the test chart recording control unit 85 prohibits (stops) the ejection of the ink droplets 36 from the nozzles 27. That is, the test chart 81 is recorded in the overlap recording area OLA (see FIG. 21) only by the nozzles 27a of the head modules 73A to 73C.
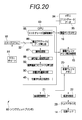
- the test chart 81 includes a first dot pattern 94A recorded by the nozzle 27a of the first head module 73A, a second dot pattern 94B recorded by the nozzle 27a of the second head module 73B, A third dot pattern (not shown) recorded by the nozzles 27a of the third head module 73C is included.
- Each of the dot patterns 94A and 94B has a shape extending in the main scanning direction and corresponds to the first dot pattern and the second dot pattern of the present invention.
- 150 first and second dot patterns 94A and 94B are recorded at a pattern interval W1 (repetition period) in the sub-scanning direction.
- W1 repetition period
- the first and second dot patterns 94A and 94B are alternately recorded along the sub-scanning direction.
- the density profile data calculation unit 86 analyzes the read image data 32 of the test chart 81 acquired from the image scanner 16 and overlaps the recording area OLA of the recording paper 13.
- a third density profile 96 indicating the density change in the sub-scanning direction is calculated.
- the density at the position corresponding to the first and second dot patterns 94A and 94B is high, and conversely, the density at the position corresponding to between the first and second dot patterns 94A and 94B is high. Lower.
- the resolution of the image scanner 16 in the sub-scanning direction is low, the resolution of the third density profile 96 in the sub-scanning direction is also low.
- the density profile data calculation unit 86 outputs the third density profile 96 to the complement processing unit 87.
- the complement processing unit 87 performs linear complement processing similar to that of the first embodiment on the third density profile 96, and the third density profile 96 in the sub-scanning direction.
- the resolution is increased from, for example, 100 dpi to 10000 dpi.
- the complement processing unit 40 outputs the high-resolution third density profile 96a to the repetition period calculation unit 88.
- the repetition period calculation unit 88 is based on the third density profile 96 and indicates the repetition period of the density change corresponding to the first and second dot patterns 94A and 94B adjacent to each other.
- the period length W3 is calculated.
- a temporary integrated concentration profile for each temporary repetition cycle is calculated, and the maximum values of the temporary integrated concentration profiles are compared. It can be calculated based on the result.
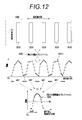
- the “maximum value” of each provisional integrated density profile is a total value of two peak values shown in FIG.
- the repetition cycle calculation unit 88 outputs the calculation result of the repetition cycle length W3 to the integrated concentration profile calculation unit 89 together with the above-described third concentration profile 96a.
- the integrated concentration profile calculation unit 89 calculates the third integrated concentration profile 98 by averaging the data of the third concentration profile 96a for each repetition cycle length W3.
- the integrated density profile calculation unit 89 outputs the third integrated density profile 98 to the positional deviation amount calculation unit 90.
- the positional deviation amount calculation unit 90 analyzes the third integrated density profile 98 to determine the position between the recording position of the first head module 73A and the recording position of the second head module 73B. A deviation amount ⁇ Y is calculated.
- a method for calculating the positional deviation amount ⁇ Y based on the third integrated density profile 98 will be specifically described.
- the misregistration amount calculation unit 90 determines the threshold value Th of the data of the third integrated density profile 98 using the equation (2) described in the first embodiment. Then, the positional deviation amount calculation unit 90 extracts data that exceeds the threshold value Th from the data of the third integrated density profile 98 (step S50).
- the positional deviation amount calculation unit 90 obtains an average value of the X values (integrated phase value: position within the repetition period) of the data exceeding the threshold value Th, and sets the data whose X value is smaller than the average value as “group 1”. Conversely, data larger than the average value is set as “group 2” (step S51).
- group 1 is data corresponding to the first dot pattern 94A
- group 2 is data corresponding to the second dot pattern 94B.
- the positional deviation amount calculation unit 90 calculates an approximate curve for the data of group 2, and calculates the peak position X P2 of the approximate curve (step S53).
- positional deviation amount calculating section 90 the peak position X P1, the peak position X P2, and resolution R m of the image scanner 16, based on the resolution R h when the high resolution, the following formula (5) , (6) is used to calculate the positional deviation amount ⁇ Y (step S54). That is, based on the difference between the peak position X P2 of the peak position X P1 corresponding to the first dot pattern 94A corresponding to the second dot pattern 94B, and calculates the positional deviation amount [Delta] Y.
- the positional deviation amount calculation unit 90 outputs the calculation result of the positional deviation amount ⁇ Y to the positional deviation correction processing unit 45.
- the positional deviation amount ⁇ Y includes a deviation amount from the design position shown in FIG. 18, a deviation amount due to the staggered arrangement, and an error in ink ejection timing set in each head module during test chart recording. This is the amount of positional deviation.
- each part of the CPU 83 is used. 85 to 90 are actuated to start the measurement process of the positional deviation amount ⁇ Y (step S20).
- test chart recording control unit 85 Under the control of the test chart recording control unit 85, similarly to the first embodiment, print data for one droplet ejection based on the test chart data 35 is sequentially transferred to the head driver 23.
- the head driver 23 controls ink ejection from the nozzles 27a of the head modules 73A to 73C based on the print data.
- the test chart 81 is recorded in the overlap recording area OLA by ejecting the ink droplets 36 by the head modules 73A to 73C while transporting the recording paper 13 in the sub-scanning direction by the transport mechanism 12. S58, recording step).
- test chart 81 After recording the test chart 81, the test chart 81 is read by the image scanner 16 and the read image data 32 is output from the image scanner 16 to the density profile data calculation unit 86, as in the first embodiment (step S59, read). Step).
- the density profile data calculation unit 86 identifies two head modules, that is, the first and second head modules 73A and 73B that are to be measured for the positional deviation amount ⁇ Y (step S60).
- the density profile data calculation unit 86 analyzes the read image data 32 and calculates a third density profile 96 as shown in FIG. 22B (step S61, density profile calculation step).
- the third density profile 96 is output from the density profile data calculation unit 86 to the complement processing unit 87.
- the complement processing unit 87 performs a linear complement process on the third density profile 96, thereby generating a third density profile 96a having a higher resolution as shown in FIG. 22C (step S62). , Complementary processing step).
- the third density profile 96a is output from the complement processing unit 87 to the repetition period calculation unit 88.
- the repetition cycle calculation unit 88 executes basically the same processing as the processing from step S1 to step S9 shown in FIG. 8, calculates temporary integrated concentration profiles for each temporary repetition cycle, and each temporary integrated concentration profile.
- the maximum values total values of group 1 and group 2 are compared.
- the repetition period length W3 as shown in FIG. 23A is calculated by the repetition period calculation unit 41 (step S63, repetition period calculation step).
- the calculation result of the repetition period length W3 is output from the repetition period calculation unit 88 to the integrated concentration profile calculation unit 89 together with the third concentration profile 96a.
- the integrated concentration profile calculation unit 89 calculates the third integrated concentration profile 98 by averaging the third concentration profile 96a every repetition cycle length W3 (step S64). , Integrated concentration profile calculation step).
- the third integrated density profile 98 is output from the integrated density profile calculation unit 89 to the positional deviation amount calculation unit 90.
- the positional deviation amount calculation unit 90 executes the processing from step S50 to step S54 shown in FIG. Thereby, positional deviation amount calculating section 90, as shown in FIG. 23 (C) and FIG. 25, based on the difference between the peak position X P1 and the peak position X P2, the first and second head modules 73A, 73B A positional deviation amount ⁇ Y between the recording positions is calculated (step S65). This completes the positional deviation amount measurement process.
- the reference position deviation amounts ⁇ y1 and ⁇ y2 for each head module are calculated by analyzing the test chart 81 recorded in the overlap recording area OLA as in the first embodiment. Without this, the positional deviation amount ⁇ Y can be directly calculated. Thereby, the time required for calculating the positional deviation amount ⁇ Y can be shortened. Further, similarly to the first embodiment, it is possible to measure the displacement amount of the recording position between the head modules with low cost and high accuracy without using a high resolution image sensor.
- the printer 100 ejects ink of a plurality of colors from the recording head 250 (configured by CMYK ink jet heads 172M, 172K, 172C, and 172Y) onto the recording paper 13 held on the drawing drum 170.
- This is a direct drawing type ink jet printer that forms a desired color image.
- the printer 100 applies a processing liquid (here, an aggregating processing liquid) to the recording paper 13 before the ink is ejected, and reacts the processing liquid and the ink liquid to form an image on the recording paper 13 (a two-liquid reaction ( The aggregation method is applied.
- a processing liquid here, an aggregating processing liquid
- the printer 100 mainly includes a paper feeding unit 112, a processing liquid application unit 114, a recording unit 116, a drying unit 118, a fixing unit 120, and a paper discharge unit 122.
- recording paper 13 which is a sheet is stacked.
- the recording sheets 13 are fed one by one from the sheet feeding tray 150 of the sheet feeding unit 112 to the processing liquid applying unit 114.
- a sheet cut paper
- a configuration in which continuous paper (roll paper) is cut to a required size and fed is also possible.
- the processing liquid application unit 114 is a mechanism that applies a processing liquid to the surface of the recording paper 13.
- the treatment liquid contains a color material aggregating agent that agglomerates the color material (pigment in this example) applied in the recording unit 116, and the ink comes into contact with the treatment liquid when the treatment liquid comes into contact with the ink. And the solvent are promoted.
- the processing liquid application unit 114 includes a paper feed cylinder 152, a processing liquid drum 154, and a processing liquid coating device 156.
- the processing liquid drum 154 includes a claw-shaped holding means (gripper) 155 on the outer peripheral surface thereof, and the recording paper 13 is sandwiched between the claw of the holding means 155 and the peripheral surface of the processing liquid drum 154. The tip can be held.
- a suction hole may be provided on the outer peripheral surface of the treatment liquid drum 154, and a suction unit that performs suction from the suction hole may be connected. As a result, the recording paper 13 can be held in close contact with the peripheral surface of the treatment liquid drum 154.
- a treatment liquid coating device 156 is disposed to face the peripheral surface of the treatment liquid drum 154.
- the treatment liquid coating device 156 includes a treatment liquid container in which the treatment liquid is stored, an anix roller partially immersed in the treatment liquid in the treatment liquid container, and the recording paper 13 on the anix roller and the treatment liquid drum 154. And a rubber roller that transfers the measured processing liquid to the recording paper 13.
- the processing liquid application device 156 the processing liquid can be applied to the surface of the recording paper 13 while being measured.
- the configuration in which the application method using the roller is exemplified, but the present invention is not limited to this. For example, various methods such as a spray method and an ink jet method can be applied.
- the recording paper 13 to which the processing liquid is applied is transferred from the processing liquid drum 154 to the drawing drum 170 of the recording unit 116 via the intermediate conveyance unit 126.
- the recording unit 116 includes a drawing drum 170, a paper sheet pressing roller 174, and an ink jet head 250 (ink jet heads 172M, 172K, 172C, 172Y). Similar to the treatment liquid drum 154, the drawing drum 170 includes a claw-shaped holding means (gripper) 171 on the outer peripheral surface thereof.
- the inkjet heads 172M, 172K, 172C, and 172Y are full-line inkjet inkjet heads each having a length corresponding to the maximum width of the image formation region on the recording paper 13, and image formation is performed on the ink ejection surface.
- a nozzle row in which a plurality of nozzles for ink ejection are arranged over the entire width of the region is formed.
- Each inkjet head 172M, 172K, 172C, 172Y is installed so as to extend in a direction (first direction) orthogonal to the conveyance direction of the recording paper 13 (the rotation direction of the drawing drum 170, the second direction).
- Corresponding color ink droplets are ejected from the inkjet heads 172M, 172K, 172C, and 172Y of the inkjet head 250 arranged on the surface side toward the surface of the recording paper 13 held in close contact with the drawing drum 170.
- the ink comes into contact with the treatment liquid applied to the recording surface in advance by the treatment liquid application unit 114, and the color material (pigment) dispersed in the ink is aggregated to form a color material aggregate.
- the color material flow on the recording paper 13 is prevented, and an image is formed on the surface of the recording paper 13.
- the recording paper 13 is transported at a constant speed by the drawing drum 170, and the operation of relatively moving the recording paper 13 and the respective ink jet heads 172M, 172K, 172C, 172Y in this transport direction is performed only once ( That is, an image can be recorded in the image forming area on the surface of the recording paper 13 in one sub-scanning.
- the recording paper 13 on which the image is formed is transferred from the drawing drum 170 to the drying drum 176 of the drying unit 118 via the intermediate conveyance unit 128.
- the drying unit 118 is a mechanism for drying moisture contained in the solvent separated by the color material aggregating action, and includes a drying drum 176 and a solvent drying device 178. Similar to the treatment liquid drum 154, the drying drum 176 includes a claw-shaped holding means (gripper) 177 on the outer peripheral surface thereof, and the holding means 177 can hold the leading end of the recording paper 13.
- a drying drum 176 Similar to the treatment liquid drum 154, the drying drum 176 includes a claw-shaped holding means (gripper) 177 on the outer peripheral surface thereof, and the holding means 177 can hold the leading end of the recording paper 13.
- the solvent drying device 178 is disposed at a position facing the outer peripheral surface of the drying drum 176, and includes a plurality of halogen heaters 180 and hot air jet nozzles 182 respectively disposed between the halogen heaters 180.
- the recording paper 13 that has been dried by the drying unit 118 is transferred from the drying drum 176 to the fixing drum 184 of the fixing unit 120 via the intermediate conveyance unit 130.
- the fixing unit 120 includes a fixing drum 184, a halogen heater 186, a fixing roller 188, and an inline sensor 190.
- the fixing drum 184 includes a claw-shaped holding unit (gripper) 185 on its outer peripheral surface, and the holding unit 185 can hold the leading end of the recording paper 13.
- the recording surface (both sides) of the recording paper 13 is preheated by the halogen heater 186, fixed by the fixing roller 188, and inspected by the inline sensor 190.
- the fixing roller 188 is a roller member that heats and pressurizes the dried ink to weld the self-dispersing polymer fine particles in the ink to form a film of the ink, and is configured to heat and press the recording paper 13.
- the Specifically, the fixing roller 188 is disposed so as to be in pressure contact with the fixing drum 184 and constitutes a nip roller with the fixing drum 184.
- the recording paper 13 is sandwiched between the fixing roller 188 and the fixing drum 184 and nipped with a predetermined nip pressure, and a fixing process is performed.
- the fixing roller 188 is constituted by a heating roller incorporating a halogen lamp or the like, and is controlled to a predetermined temperature.
- the in-line sensor (reading unit) 190 is a means for reading an image formed on the recording paper 13 and detecting image density, image defect, and the like, and a CCD line sensor or the like is applied.
- the inline sensor 190 is basically the same as the image scanner 16 described above.
- the latex particles in the thin image layer formed by the drying unit 118 are heated and pressurized by the fixing roller 188 and melted, so that the ink can be fixed and fixed on the recording paper 13.
- the surface temperature of the fixing drum 184 is set to 50 ° C. or higher.
- the printer 100 includes a UV exposure unit that exposes ink on the recording paper 13 to UV light instead of the heat-pressure fixing unit (fixing roller 188) using a heat roller.
- a UV exposure unit that exposes ink on the recording paper 13 to UV light
- an actinic ray such as a UV lamp or an ultraviolet LD (laser diode) array is used instead of the fixing roller 188 for heat fixing. Means for irradiating are provided.
- a paper discharge unit 122 is provided.
- the paper discharge unit 122 includes a discharge tray 192, and a transfer drum 194, a conveyance belt 196, and a stretching roller 198 are provided between the discharge tray 192 and the fixing drum 184 of the fixing unit 120.
- the recording paper 13 is sent to the transport belt 196 by the transfer drum 194 and discharged to the discharge tray 192.
- the details of the paper transport mechanism by the transport belt 196 are not shown in the drawing, the recording paper 13 after printing is held at the front end of the paper by a gripper (not shown) gripped between the endless transport belt 196, and the transport belt 196. Is carried above the discharge tray 192.
- the printer 100 has an ink storage / loading unit that supplies ink to the inkjet heads 172M, 172K, 172C, and 172Y and a processing liquid application unit 114 in addition to the above-described configuration.
- a head maintenance unit that includes means for supplying a processing liquid and performs cleaning (nozzle surface wiping, purging, nozzle suction, etc.) of each of the inkjet heads 172M, 172K, 172C, and 172Y, and the position of the recording paper 13 on the paper transport path
- the inkjet head 250 includes a nozzle 251 that is an ink discharge port, a pressure chamber 252 that communicates with each nozzle 251, and a supply port 254 that communicates a common channel (not shown) and each pressure chamber 252.
- a plurality of ink chamber units (droplet discharge elements as recording element units) 253 are arranged in a matrix.
- the ink jet head 250 increases the density of the substantial nozzle interval (projection nozzle pitch shown by the symbol Pn) projected so as to be aligned along the main scanning direction that is the longitudinal direction of the ink jet head 250. Have achieved.
- the planar shape of the pressure chamber 252 communicating with the nozzle 251 is approximately square, the nozzle 251 is provided at one of the diagonal corners, and the supply port 254 is provided at the other.
- the shape of the pressure chamber 252 is not limited to this example, and the planar shape may have various forms such as a quadrangle (rhombus, rectangle, etc.), a pentagon, a hexagon, other polygons, a circle, and an ellipse.
- the ink chamber unit 253 including the nozzles 251 and the pressure chambers 252 is arranged in a row direction along the main scanning direction and an oblique column direction having a constant angle ⁇ (0 ° ⁇ ⁇ 90 °) that is not orthogonal to the main scanning direction.
- the high-density nozzle head of the present example is realized by arranging the matrix in a fixed arrangement pattern along (shown with reference symbol Sa).
- the projected nozzle pitch Pn of the nozzles projected in the main scanning direction is g ⁇ . cos ⁇ .
- each nozzle 251 can be handled equivalently as a linear arrangement with a constant pitch Pn.
- the inkjet head 250 has a structure in which a nozzle plate 251A in which nozzles 251 are formed and a flow path plate 252P in which flow paths such as a pressure chamber 252 and a common flow path 255 are formed are laminated and joined. Become.
- the flow path plate 252P forms a side wall of the pressure chamber 252 and a flow path that forms a supply port 254 as a narrowed portion (most narrowed portion) of an individual supply path that guides ink from the common flow path 255 to the pressure chamber 252. It is a forming member.
- the flow path plate 252P has a structure in which one or a plurality of substrates are stacked, although it is illustrated in a simplified manner in FIG.
- the nozzle plate 251A and the flow path plate 252P can be processed into a required shape by a semiconductor manufacturing process using silicon as a material.
- the common channel 255 communicates with an ink tank (not shown) as an ink supply source, and the ink supplied from the ink tank is supplied to each pressure chamber 252 via the common channel 255.
- a piezoelectric actuator 258 including an individual electrode 257 is joined to a diaphragm 256 constituting a part of the pressure chamber 252 (the top surface in FIG. 29).
- the diaphragm 256 of this example is made of silicon (Si) with a nickel (Ni) conductive layer functioning as a common electrode 259 corresponding to the lower electrode of the piezoelectric actuator 258, and is arranged corresponding to each pressure chamber 252. It also serves as a common electrode for the actuator 258. It is also possible to form the diaphragm with a non-conductive material such as resin. In this case, a common electrode layer made of a conductive material such as metal is formed on the surface of the diaphragm member. Moreover, you may comprise the diaphragm which serves as a common electrode with metals (conductive material), such as stainless steel (SUS).
- conductive material such as stainless steel (SUS).
- the piezoelectric actuator 258 By applying a driving voltage to the individual electrode 257, the piezoelectric actuator 258 is deformed and the volume of the pressure chamber 252 is changed, and ink is ejected from the nozzle 251 due to the pressure change accompanying this. When the piezoelectric actuator 258 returns to its original state after ink ejection, new ink is refilled into the pressure chamber 252 from the common flow channel 255 through the supply port 254.
- the printer 100 to which the impression cylinder conveyance method is applied is illustrated, but the conveyance method of the recording paper 13 is not limited to the impression cylinder conveyance method, and the belt that sucks and holds the recording paper 13 on the conveyance belt. It is also possible to select a transport method and other transport methods as appropriate.
- the arrangement form of the nozzles 251 is not limited to the illustrated example, and various nozzle arrangement structures can be applied.
- a linear array of lines, a V-shaped nozzle array, a zigzag-shaped nozzle array (such as a W-shape) having a V-shaped array as a repeating unit, and the like are also possible.
- the positional deviation amount ⁇ Y of the recording position between the head modules adjacent to each other is calculated.
- the positional deviation amount ⁇ Y of the recording position between any non-adjacent head modules is also calculated in the same manner. can do. Note that as the interval in the main scanning direction between the head modules for measuring the amount of positional deviation increases, the inclination of the recording head 72 (rotational displacement of the recording head 72 about the direction perpendicular to the surface of the recording paper 13), the recording paper The error of the conveyance speed 13, the deformation of the recording paper 13, the reading error of the image scanner 16, etc. affect the measurement result of the positional deviation amount. For this reason, the positional deviation amount ⁇ Y can be measured with higher accuracy by selecting the head modules adjacent to each other as the measurement target for measuring the positional deviation amount ⁇ Y.
- linear interpolation processing is performed on each density profile by the complement processing units 40 and 87, but the complement method is not particularly limited as long as each density profile can be highly resolved in the sub-scanning direction. Further, the calculation method of the repetition period lengths W2 and W3 of each concentration profile is not particularly limited to the method shown in FIGS. 8 and 9, and various known methods may be used.
- the pattern interval W1 (period length) is arbitrarily set, but this pattern interval W1 is preferably a non-integer multiple of the resolution of the image scanner 16 in the sub-scanning direction of the image sensor.
- the reading position of the image sensor with respect to each of the dot patterns arranged in the sub-scanning direction gradually shifts.
- various measurement points in the sub-scanning direction in the first density profile 53A in FIG. The data at is obtained.
- a more accurate waveform of the first integrated concentration profile 56A shown in FIG. 7B can be obtained, so that the peak position can be accurately determined.
- the first to third density profiles 53A, 53B, and 96 are integrated and averaged for each repetition period length W2 and W3 to calculate the first to third density profiles 56A, 56B, and 98, respectively.
- the first to third integrated density profiles may be calculated by integrating the density profiles 53A, 53B, and 96 for each of the repetition cycle lengths W2 and W3 without performing the averaging process.
- 150 dot patterns are formed in the sub-scanning direction, but the number of each dot pattern may be increased or decreased as appropriate. As the number of dot patterns increases, the number of data of each density profile increases, so that the positional deviation amount ⁇ Y can be measured with higher accuracy.
- the recording head of the above embodiment records four colors of CMYK, but the recording color is not particularly limited.
- the present invention can also be applied to an inkjet printer including a shuttle head type recording head that moves the recording head relative to the recording paper instead of moving the recording paper relative to the fixed recording head.
- an inkjet printer for graphic printing has been described as an example, but the scope of application of the present invention is not limited to this example.
- a wiring drawing apparatus for drawing a wiring pattern of an electronic circuit a manufacturing apparatus for various devices, a resist printing apparatus that uses a resin liquid as a functional liquid for ejection, a color filter manufacturing apparatus, and a material deposition material.
- the present invention can be widely applied to inkjet printers that draw various shapes and patterns using a liquid functional material, such as a fine structure forming apparatus that forms a structure.
- an inkjet printer has been described as an example of the image recording apparatus of the present invention.
- a thermal transfer recording apparatus including a plurality of recording heads using thermal elements as recording elements, and a plurality of recording heads using LED elements as recording elements.
- the present invention can be applied to various image recording apparatuses such as an LED electrophotographic printer provided.
Landscapes
- Engineering & Computer Science (AREA)
- Quality & Reliability (AREA)
- Ink Jet (AREA)
- Accessory Devices And Overall Control Thereof (AREA)
Abstract
La présente invention mesure la quantité d'écart positionnel entre les modules têtes à bas coût et à précision élevée. Pendant le déplacement de la tête d'impression et du support d'impression l'un par rapport à l'autre dans une seconde direction, un premier module tête et un second module tête enregistrent chacun des motifs de points sur le support d'impression à un intervalle préalablement déterminé dans la seconde direction. Les motifs de points sont lus optiquement et des profils de densité qui représentent les changements de densité dans les images de lecture de motifs de points dans la seconde direction sont calculés. La période de répétition des formes d'onde de profil de densité, qui correspondent aux motifs de points respectifs, est calculée. A chaque période de répétition, on ajoute les données de profil de densité et on en fait la moyenne afin de calculer le profil de densité cumulé. Les positions de crête des formes d'onde de profil de densité cumulé, qui correspondent chacune à un motif de points respectif, sont déterminées et la quantité d'écart positionnel est calculée sur la base des positions de crête respectives.
Priority Applications (1)
| Application Number | Priority Date | Filing Date | Title |
|---|---|---|---|
| US14/824,944 US9370954B2 (en) | 2013-03-15 | 2015-08-12 | Method for measuring amount of positional deviation and image-recording device |
Applications Claiming Priority (2)
| Application Number | Priority Date | Filing Date | Title |
|---|---|---|---|
| JP2013053226A JP5894098B2 (ja) | 2013-03-15 | 2013-03-15 | 位置ずれ量測定方法及び画像記録装置 |
| JP2013-053226 | 2013-03-15 |
Related Child Applications (1)
| Application Number | Title | Priority Date | Filing Date |
|---|---|---|---|
| US14/824,944 Continuation US9370954B2 (en) | 2013-03-15 | 2015-08-12 | Method for measuring amount of positional deviation and image-recording device |
Publications (1)
| Publication Number | Publication Date |
|---|---|
| WO2014141862A1 true WO2014141862A1 (fr) | 2014-09-18 |
Family
ID=51536537
Family Applications (1)
| Application Number | Title | Priority Date | Filing Date |
|---|---|---|---|
| PCT/JP2014/054370 WO2014141862A1 (fr) | 2013-03-15 | 2014-02-24 | Procédé de mesure de quantité d'écart positionnel et dispositif d'enregistrement d'image |
Country Status (3)
| Country | Link |
|---|---|
| US (1) | US9370954B2 (fr) |
| JP (1) | JP5894098B2 (fr) |
| WO (1) | WO2014141862A1 (fr) |
Families Citing this family (5)
| Publication number | Priority date | Publication date | Assignee | Title |
|---|---|---|---|---|
| JP2016129989A (ja) * | 2015-01-15 | 2016-07-21 | 武藤工業株式会社 | 測色による作画調整方法及び装置 |
| JP7153425B2 (ja) * | 2017-01-23 | 2022-10-14 | セイコーエプソン株式会社 | スキャナー、スキャンプログラムおよびスキャンデータの生産方法 |
| JP6939236B2 (ja) * | 2017-08-15 | 2021-09-22 | 富士フイルムビジネスイノベーション株式会社 | 画像形成装置 |
| JP7109320B2 (ja) * | 2018-09-19 | 2022-07-29 | 株式会社Screenホールディングス | 印刷装置及びそのズレ量算出方法 |
| JP7211206B2 (ja) * | 2019-03-28 | 2023-01-24 | ブラザー工業株式会社 | 画像形成装置 |
Citations (3)
| Publication number | Priority date | Publication date | Assignee | Title |
|---|---|---|---|---|
| JPH11180013A (ja) * | 1997-12-19 | 1999-07-06 | Canon Aptex Inc | 記録試験装置 |
| JP2005053167A (ja) * | 2003-08-07 | 2005-03-03 | Fuji Xerox Co Ltd | 画像形成装置 |
| JP2006305894A (ja) * | 2005-04-28 | 2006-11-09 | Konica Minolta Holdings Inc | 記録ヘッドの傾き補正方法 |
Family Cites Families (9)
| Publication number | Priority date | Publication date | Assignee | Title |
|---|---|---|---|---|
| JPH0885235A (ja) * | 1994-09-16 | 1996-04-02 | Canon Inc | 画像形成装置 |
| JP2003170645A (ja) * | 2001-12-06 | 2003-06-17 | Olympus Optical Co Ltd | 記録用紙及び画像記録装置 |
| JP4756842B2 (ja) * | 2004-09-30 | 2011-08-24 | キヤノン株式会社 | プリント位置調整方法およびプリント装置 |
| JP2006255976A (ja) * | 2005-03-15 | 2006-09-28 | Fuji Xerox Co Ltd | 画像形成装置及びプリントヘッドの制御方法 |
| JP2006305952A (ja) * | 2005-04-28 | 2006-11-09 | Seiko Epson Corp | 印刷装置、コンピュータプログラム、印刷方法、及び、媒体 |
| JP4888239B2 (ja) * | 2007-06-13 | 2012-02-29 | セイコーエプソン株式会社 | 液体吐出装置 |
| JP4883702B2 (ja) * | 2007-07-18 | 2012-02-22 | 富士フイルム株式会社 | ドット計測方法及び装置、プログラム、並びに画像形成装置 |
| JP5338291B2 (ja) * | 2008-12-12 | 2013-11-13 | コニカミノルタ株式会社 | 画像形成装置 |
| US8721026B2 (en) * | 2010-05-17 | 2014-05-13 | Xerox Corporation | Method for identifying and verifying dash structures as candidates for test patterns and replacement patterns in an inkjet printer |
-
2013
- 2013-03-15 JP JP2013053226A patent/JP5894098B2/ja not_active Expired - Fee Related
-
2014
- 2014-02-24 WO PCT/JP2014/054370 patent/WO2014141862A1/fr active Application Filing
-
2015
- 2015-08-12 US US14/824,944 patent/US9370954B2/en active Active
Patent Citations (3)
| Publication number | Priority date | Publication date | Assignee | Title |
|---|---|---|---|---|
| JPH11180013A (ja) * | 1997-12-19 | 1999-07-06 | Canon Aptex Inc | 記録試験装置 |
| JP2005053167A (ja) * | 2003-08-07 | 2005-03-03 | Fuji Xerox Co Ltd | 画像形成装置 |
| JP2006305894A (ja) * | 2005-04-28 | 2006-11-09 | Konica Minolta Holdings Inc | 記録ヘッドの傾き補正方法 |
Also Published As
| Publication number | Publication date |
|---|---|
| JP5894098B2 (ja) | 2016-03-23 |
| JP2014177057A (ja) | 2014-09-25 |
| US9370954B2 (en) | 2016-06-21 |
| US20150343820A1 (en) | 2015-12-03 |
Similar Documents
| Publication | Publication Date | Title |
|---|---|---|
| US8585174B2 (en) | Inkjet printing apparatus and printing method of inkjet printing apparatus | |
| JP5477954B2 (ja) | 画像記録装置及び画像記録装置のヘッド調整方法 | |
| JP5473704B2 (ja) | テストパターン印刷方法及びインクジェット記録装置 | |
| JP5894098B2 (ja) | 位置ずれ量測定方法及び画像記録装置 | |
| JP5940818B2 (ja) | 補正値取得方法及び画像記録装置 | |
| US20090244167A1 (en) | Inkjet recording apparatus, test image forming method, and computer-readable medium | |
| US9227394B2 (en) | Head adjustment method, head-driving device and image-forming device | |
| US8695529B2 (en) | Application apparatus and image forming apparatus | |
| JP5952704B2 (ja) | ヘッド駆動方法、ヘッド駆動装置およびインクジェット記録装置 | |
| JP2013184458A (ja) | 画像記録装置及び方法 | |
| JP2014136319A (ja) | 記録ヘッドの位置ズレ検知方法及び画像記録装置 | |
| US9895880B2 (en) | Method for adjusting recording head, and image forming apparatus | |
| JP2012250472A (ja) | インクジェット記録ヘッドの状態監視装置及びインクジェット記録装置 | |
| JP5393560B2 (ja) | インクジェット描画装置及びその設計方法並びに描画品質改善方法 | |
| JP5301483B2 (ja) | 記録ヘッド調整方法及び画像記録装置 | |
| JP2012066457A (ja) | 画像形成装置、補正値算出装置、濃度測定用テストチャート、及び補正値算出方法 | |
| JP5436369B2 (ja) | 記録装置及び記録方法 | |
| JP5649460B2 (ja) | 記録ヘッド、画像形成装置及び液体吐出装置 | |
| JP2023067385A (ja) | 記録ヘッドの制御装置及び制御方法、印刷装置 |
Legal Events
| Date | Code | Title | Description |
|---|---|---|---|
| 121 | Ep: the epo has been informed by wipo that ep was designated in this application |
Ref document number: 14764555 Country of ref document: EP Kind code of ref document: A1 |
|
| NENP | Non-entry into the national phase |
Ref country code: DE |
|
| 122 | Ep: pct application non-entry in european phase |
Ref document number: 14764555 Country of ref document: EP Kind code of ref document: A1 |