WO2014141862A1 - Method for measuring amount of positional deviation and image-recording device - Google Patents
Method for measuring amount of positional deviation and image-recording device Download PDFInfo
- Publication number
- WO2014141862A1 WO2014141862A1 PCT/JP2014/054370 JP2014054370W WO2014141862A1 WO 2014141862 A1 WO2014141862 A1 WO 2014141862A1 JP 2014054370 W JP2014054370 W JP 2014054370W WO 2014141862 A1 WO2014141862 A1 WO 2014141862A1
- Authority
- WO
- WIPO (PCT)
- Prior art keywords
- recording
- head
- density profile
- repetition period
- dot pattern
- Prior art date
Links
Images


Classifications
-
- B—PERFORMING OPERATIONS; TRANSPORTING
- B41—PRINTING; LINING MACHINES; TYPEWRITERS; STAMPS
- B41J—TYPEWRITERS; SELECTIVE PRINTING MECHANISMS, i.e. MECHANISMS PRINTING OTHERWISE THAN FROM A FORME; CORRECTION OF TYPOGRAPHICAL ERRORS
- B41J29/00—Details of, or accessories for, typewriters or selective printing mechanisms not otherwise provided for
- B41J29/38—Drives, motors, controls or automatic cut-off devices for the entire printing mechanism
- B41J29/393—Devices for controlling or analysing the entire machine ; Controlling or analysing mechanical parameters involving printing of test patterns
-
- B—PERFORMING OPERATIONS; TRANSPORTING
- B41—PRINTING; LINING MACHINES; TYPEWRITERS; STAMPS
- B41J—TYPEWRITERS; SELECTIVE PRINTING MECHANISMS, i.e. MECHANISMS PRINTING OTHERWISE THAN FROM A FORME; CORRECTION OF TYPOGRAPHICAL ERRORS
- B41J2/00—Typewriters or selective printing mechanisms characterised by the printing or marking process for which they are designed
- B41J2/005—Typewriters or selective printing mechanisms characterised by the printing or marking process for which they are designed characterised by bringing liquid or particles selectively into contact with a printing material
- B41J2/01—Ink jet
- B41J2/21—Ink jet for multi-colour printing
- B41J2/2132—Print quality control characterised by dot disposition, e.g. for reducing white stripes or banding
- B41J2/2135—Alignment of dots
-
- B—PERFORMING OPERATIONS; TRANSPORTING
- B41—PRINTING; LINING MACHINES; TYPEWRITERS; STAMPS
- B41J—TYPEWRITERS; SELECTIVE PRINTING MECHANISMS, i.e. MECHANISMS PRINTING OTHERWISE THAN FROM A FORME; CORRECTION OF TYPOGRAPHICAL ERRORS
- B41J2/00—Typewriters or selective printing mechanisms characterised by the printing or marking process for which they are designed
- B41J2/005—Typewriters or selective printing mechanisms characterised by the printing or marking process for which they are designed characterised by bringing liquid or particles selectively into contact with a printing material
- B41J2/01—Ink jet
- B41J2/21—Ink jet for multi-colour printing
- B41J2/2132—Print quality control characterised by dot disposition, e.g. for reducing white stripes or banding
- B41J2/2146—Print quality control characterised by dot disposition, e.g. for reducing white stripes or banding for line print heads
-
- B—PERFORMING OPERATIONS; TRANSPORTING
- B41—PRINTING; LINING MACHINES; TYPEWRITERS; STAMPS
- B41J—TYPEWRITERS; SELECTIVE PRINTING MECHANISMS, i.e. MECHANISMS PRINTING OTHERWISE THAN FROM A FORME; CORRECTION OF TYPOGRAPHICAL ERRORS
- B41J2/00—Typewriters or selective printing mechanisms characterised by the printing or marking process for which they are designed
- B41J2/005—Typewriters or selective printing mechanisms characterised by the printing or marking process for which they are designed characterised by bringing liquid or particles selectively into contact with a printing material
- B41J2/01—Ink jet
- B41J2/21—Ink jet for multi-colour printing
- B41J2/2132—Print quality control characterised by dot disposition, e.g. for reducing white stripes or banding
- B41J2/2142—Detection of malfunctioning nozzles
-
- B—PERFORMING OPERATIONS; TRANSPORTING
- B41—PRINTING; LINING MACHINES; TYPEWRITERS; STAMPS
- B41J—TYPEWRITERS; SELECTIVE PRINTING MECHANISMS, i.e. MECHANISMS PRINTING OTHERWISE THAN FROM A FORME; CORRECTION OF TYPOGRAPHICAL ERRORS
- B41J29/00—Details of, or accessories for, typewriters or selective printing mechanisms not otherwise provided for
- B41J29/38—Drives, motors, controls or automatic cut-off devices for the entire printing mechanism
- B41J29/393—Devices for controlling or analysing the entire machine ; Controlling or analysing mechanical parameters involving printing of test patterns
- B41J2029/3935—Devices for controlling or analysing the entire machine ; Controlling or analysing mechanical parameters involving printing of test patterns by means of printed test patterns
Definitions
- the present invention relates to a positional deviation amount measuring method for measuring a positional deviation amount of a recording position of a plurality of head modules of a recording head, and an image recording apparatus for measuring the positional deviation amount using this method.
- a line method is known in which an image is recorded in one drawing pass by a line head as the recording medium is conveyed.
- a long line head (recording head) is used along the width direction (main scanning direction) of the recording medium orthogonal to the conveyance direction (sub-scanning direction) of the recording medium. It is not practical to integrally form this line head with a silicon wafer, glass or the like due to problems such as yield, heat generation, and cost. Therefore, in the line method, it is usual to use a line head in which head modules in which nozzles are two-dimensionally arranged are arranged in the width direction of the recording medium.
- a line pattern extending in the width direction of the recording medium by one of the adjacent head modules is set to n pixels in the sub-scanning direction around the reference line.
- the first line group is formed by recording at intervals.
- the second head module forms the second line group by recording the line pattern at intervals of n + 1 pixels in the sub-scanning direction with the reference line as the center.
- the first line group and the second line group are compared, and the first line pattern of the first line group and the second line pattern of the second line group, which have the same position in the transport direction, are respectively identified. .
- the positional deviation amount is calculated as [k ⁇ ((n + 1) ⁇ n)] pixels.
- the amount of misregistration of the recording position between the head modules can be measured in units of pixels, so that the amount of misalignment can be corrected in units of pixels.
- the image quality of the recorded image is degraded unless the positional deviation amount of the recording position between the head modules is within about ⁇ 5 ⁇ m. For this reason, for example, when the recording resolution is 1200 dpi, it is necessary to measure the positional deviation amount of the recording position between the head modules with an accuracy of about 1/4 pixel.
- the test chart recorded by each head module is analyzed by the read image read by the image sensor of the image scanner, but the misalignment amount is measured with about 1/4 pixel. In order to do so, a high-resolution image sensor is required. As a result, the manufacturing cost of the apparatus for measuring the amount of displacement increases.
- An object of the present invention relates to a positional deviation amount measuring method capable of measuring a positional deviation amount of a recording position between head modules with high accuracy, and an image recording apparatus for measuring the positional deviation amount using this method.
- a positional deviation amount measuring method for achieving the object of the present invention includes a recording head formed by arranging a plurality of head modules having a plurality of recording elements in a first direction, and a recording medium orthogonal to the first direction. While relatively moving in the second direction, each of the first head module and the second head module of the plurality of head modules causes a dot pattern having a shape extending in the first direction to advance in the second direction.
- a recording step of recording on the recording medium at a predetermined interval, a reading step of optically reading the dot pattern recorded on the recording medium in the recording step, and a second image of the read image of the dot pattern read in the reading step A density profile calculation step for calculating a density profile indicating a change in density in the direction, and a calculation result of the density profile calculation step. Based on the calculation result of the repetition cycle calculation step and the repetition cycle calculation step that calculates the repetition cycle of the waveform corresponding to each dot pattern in the profile, the density profile data is integrated for each repetition cycle to obtain the integrated density profile.
- the peak position of the waveform corresponding to each dot pattern in the integrated density profile is obtained, and the first head module of the first head module is calculated based on each peak position.
- a positional deviation amount calculating step for calculating a positional deviation amount in the second direction between the recording position and the recording position of the second head module.
- the positional deviation amount in the second direction of the recording position between the head modules based on the read image of the dot pattern recorded on the recording medium at a predetermined interval in the second direction for each head module. Therefore, the amount of positional deviation in the second direction of the recording position between the head modules can be measured with high accuracy without using a high-resolution image sensor.
- the density profile calculating step corresponds to the first density profile corresponding to the first dot pattern recorded by the first head module and the second dot pattern recorded by the second head module as the density profile.
- Each of the second density profiles to be calculated, and the repetition period calculating step includes a first repetition period of a waveform corresponding to the first dot pattern as a repetition period based on the first and second density profiles; A second repetition period indicating a repetition period of a waveform corresponding to the second dot pattern is calculated, and the integrated density profile calculation step uses the first density profile data as the integrated density profile for the first repetition period.
- a first integrated concentration profile that is integrated every time, and a second integrated concentration profile A second integrated density profile obtained by integrating the degree profile data every second repetition period is calculated, and the positional deviation amount calculating step corresponds to the first dot pattern in the first integrated density profile.
- a first peak position of the waveform and a second peak position of the waveform corresponding to the second dot pattern in the second integrated density profile are respectively obtained, and a difference between the first peak position and the second peak position is obtained. It is preferable to calculate the amount of displacement based on the above. As a result, the positional deviation amount in the second direction of the recording position between the head modules can be measured with high accuracy.
- the first head module and the second head module are adjacent to each other in the first direction.
- the inclination of the recording head rotational displacement of the recording head about the direction perpendicular to the recording medium surface
- the error in the conveyance speed of the recording medium the deformation of the recording medium
- the error in reading the read image of the dot pattern etc. Therefore, the positional deviation amount can be measured with higher accuracy.
- the recording step records in a recording area other than the overlapping area. It is preferable to record the first dot pattern and the second dot pattern respectively by the recording elements of the first and second head modules to be performed. As a result, even when the recording areas of the head modules adjacent in the first direction overlap, it is possible to measure the positional deviation amount of the recording position between the head modules in the second direction with high accuracy.
- the recording step is performed as a dot pattern in the overlapping recording area.
- a third repetition period indicating the repetition period of the waveform corresponding to the pattern is calculated.
- the positional deviation amount calculating step includes the first integrated density profile.
- the first peak position of the waveform corresponding to the dot pattern and the second peak position of the waveform corresponding to the second dot pattern are respectively obtained, and the difference between the first peak position and the second peak position is obtained. Based on this, the amount of displacement is calculated.
- the repetition cycle calculation step is a temporary integration concentration profile calculation step for calculating the provisional integrated concentration profile by integrating the concentration profile data for each provisional repetition cycle, and the provisional integration concentration profile calculation while changing the provisional repetition cycle.
- the maximum value is maximized by comparing the repetitive step of repeatedly executing the step to calculate the provisional integrated concentration profile for each provisional repetition period and the maximum value of the provisional integrated concentration profile for each provisional repetition period.
- a determination step for determining a provisional repetition period as a repetition period. Thereby, the repetition period can be calculated more accurately.
- the density profile calculating step further includes a complementing process step that performs a complementing process on the density profile calculated to increase the resolution in the second direction of the density profile, and the repetition period calculating step is subjected to the complementing process. It is preferable to calculate the repetition period based on the concentration profile. Thereby, it is possible to calculate the positional deviation amount with higher accuracy.
- the first direction is preferably the width direction of the recording medium.
- the recording head is preferably an inkjet head.
- An image recording apparatus for achieving an object of the present invention includes a recording head in which a plurality of head modules each having a plurality of recording elements are arranged in a first direction, and the recording head and the recording medium orthogonal to the first direction.
- the relative movement unit that relatively moves in the second direction, the recording head, and the relative movement unit are controlled, and each of the first head module and the second head module among the plurality of head modules controls the first.
- the calculation result of the density profile calculation unit and the density profile calculation unit Based on the calculation result of the repetition cycle calculation unit that calculates the repetition cycle of the waveform corresponding to each dot pattern in the density profile, and the calculation result of the repetition cycle calculation unit, Based on the calculation result of the integrated density profile calculation unit and the integrated density profile calculation unit that integrates the density profile data every repetition cycle to calculate the integrated density profile, the waveform corresponding to each dot pattern in the integrated density profile
- a positional deviation amount calculation unit that obtains a peak position and calculates a positional deviation amount in the second direction between the recording position of the first head module and the recording position of the second head module based on each peak position.
- the positional deviation amount measuring method and the image recording apparatus of the present invention can measure the positional deviation amount of the recording position between the head modules with high accuracy.
- FIG. 1 is a schematic diagram of an inkjet printer according to a first embodiment.
- FIG. 3 is a top view of the recording head according to the first embodiment. It is explanatory drawing for demonstrating the position shift of the recording position of 1st Embodiment. It is a functional block diagram of CPU of 1st Embodiment. It is the schematic of the test chart of 1st Embodiment.
- FIGS. 6A and 6B are diagrams for explaining the calculation of the first density profile, and FIG. 6C is an explanatory diagram for explaining the complementing process.
- FIG. 7A is a diagram for explaining the calculation of the repetitive cycle length
- FIG. 7B is a diagram for explaining the calculation of the first integrated density profile
- FIG. 7C is a diagram for explaining the calculation of the reference positional deviation amount ⁇ y1. It is the flowchart which showed the flow of the calculation process of repetition period length. It is explanatory drawing for demonstrating the process of step S9 in FIG. It is the flowchart which showed the flow of the calculation process of reference
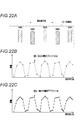
- FIG. 22A and 22B are diagrams for explaining the calculation of the third density profile
- FIG. 22C is an explanatory diagram for explaining the complementing process.
- FIG. 23A is a diagram for explaining the calculation of the repetition period length
- FIG. 23B is a diagram for explaining the calculation of the third integrated density profile
- FIG. It is the flowchart which showed the flow of the calculation process of positional offset amount (DELTA) Y. It is explanatory drawing for demonstrating concretely calculation of positional offset amount (DELTA) Y. It is the flowchart which showed the flow of the positional offset amount measurement process of 3rd Embodiment.
- It is the schematic of the inkjet printer of another example. It is the schematic which shows the structural example of an inkjet head. It is sectional drawing of an inkjet head.
- FIG. 1 An ink jet printer (hereinafter simply referred to as a printer) 10 corresponding to the image recording apparatus of the present invention is connected to an external host computer 11.
- This printer 10 has a recording paper 13 from a recording head 14 to a recording paper (recording medium, see FIG. 2) 13 conveyed by a conveying mechanism (relative movement unit) 12 based on image data input from the host computer 11.
- An image is recorded by ejecting ink droplets on the top.
- FIG. 1 shows only a part mainly related to image data processing.
- the printer 10 includes an image scanner (reading unit) 16, a host interface (I / F) unit 17, an image page memory 18, an image buffer memory write control unit 19, an image, in addition to the transport mechanism 12 and the recording head 14 described above.
- a buffer memory 20, a post-processing operation unit 21, a transfer control unit 22, a head driver 23, a CPU 24, and the like are provided.
- the host I / F unit 17, the image page memory 18, the image buffer memory write control unit 19, and the CPU 24 are connected via a bus 25.
- the transport mechanism 12 moves the recording paper 13 relative to the recording head 14 in the sub-scanning direction (second direction) perpendicular to the width direction and passes under the recording head 14.
- the recording head 14 ejects ink from the nozzles 27 arranged on the lower surface (nozzle surface) thereof, and forms an image on the recording paper 13 that is moving relatively.
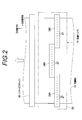
- FIG. 2 is a top view of the recording head 14 and illustrates the recording head 14 through the nozzles 27 arranged on the bottom surface.
- the arrangement of the nozzles 27 is simplified in order to prevent the drawing from becoming complicated.
- the recording head 14 is a line head that extends in the main scanning direction (first direction) parallel to the width direction of the recording paper 13 and has a length corresponding to the width of the recording paper 13. .
- the recording head 14 is provided for each recording color (CMYK).
- the recording head 14 includes three replaceable head modules (two, or four or more) of the first head module 28A, the second head module 28B, and the third head module 28C, and the head modules 28A to 28A. And a frame 29 for holding 28C.
- the head modules 28A to 28C are arranged in a staggered pattern along the main scanning direction. The end portions of two head modules adjacent to each other (adjacent) in each of the head modules 28A to 28C overlap each other.
- the nozzles 27 of the head modules 28A to 28C are arranged so that they can be handled equivalently to those arranged in a straight line at a substantially constant pitch in the main scanning direction. Therefore, the ink droplets adjacent to the main scanning direction (here, the right direction in FIG. 2) of the ink droplets ejected by the nozzle 27 on the rightmost side in FIG. 2 of the first head module 28A are the same as those in the second head module 28B. Drops can be ejected by the nozzle 27 on the left end side in FIG. Further, the ink droplets adjacent to the main scanning direction (here, the right direction in FIG. 2) of the ink droplets ejected by the nozzle 27 on the rightmost side in FIG. 2 of the second head module 28B are the same as those in the third head module 28C. Drops can be ejected by the nozzle 27 on the left end side in FIG.
- the image scanner 16 is disposed at a position downstream of the recording head 14 in the recording sheet conveyance direction and at a position facing the recording surface of the recording sheet 13.
- the image scanner 16 extends in the main scanning direction and has a length corresponding to the width of the recording paper 13.
- the image scanner 16 optically reads a test chart 31 (see FIG. 5) recorded on the recording surface of the recording paper 13 by the recording head 14, and reads test chart read image data 32 (hereinafter referred to as a read image of the present invention).
- a read image data see FIG.
- the image scanner 16 a scanner having a resolution in the sub-scanning direction of about 100 dpi is used. That is, in this embodiment, the test chart 31 is read without using a high-resolution image scanner.
- the host I / F unit 17 is a communication interface that receives image data sent from the host computer 11, and various serial interfaces and parallel interfaces can be used.
- the host I / F unit 17 sends the received image data to the image page memory 18.
- the image page memory 18 stores image data input from the host I / F unit 17, and a DRAM having a storage capacity capable of storing print data for one page is used.
- the image buffer memory writing control unit 19 reads out the print data for one line from the image page memory 18 line by line and transfers it to the image buffer memory 20.
- the print data for one line is transferred to the image buffer memory 20 and stored at successive addresses on the image buffer memory 20.
- the image buffer memory 20 stores print data for a plurality of lines.
- the post-processing computing unit 21 performs post-processing (correction) on the image buffer memory 20, such as mask processing (droplet ejection prohibiting processing) for abnormal nozzles, shading correction processing (processing for adjusting the droplet ejection rate for each nozzle), and the like. Process).
- the post-processed data is written back to the image buffer memory 20.
- the transfer control unit 22 reads the print data for one droplet ejection (for all the nozzles of each head module 28A to 28C) from the image buffer memory 20, and transfers this print data to the head driver 23.
- the transfer control unit 22 performs division processing for dividing print data for one droplet ejection for each of the head modules 28A to 28C and transmitting the print data to the head driver 23, and transfer format adjustment.
- the head driver 23 includes three drivers (not shown) that individually control the driving of the head modules 28A to 28C.
- the head driver 23 controls the driving of actuators (not shown) corresponding to the nozzles 27 of the head modules 28A to 28C based on the print data for the head modules 28A to 28C input from the transfer control unit 22, Ink droplets are ejected from each nozzle 27.
- An image is formed on the recording surface of the recording paper 13 by controlling ink ejection from each of the head modules 28A to 28C in synchronization with the conveyance speed of the recording paper 13.
- the CPU 24 performs overall control of each unit of the printer 10 by sequentially executing various programs and data read from the memory 34 based on an input signal from an operation unit (not shown).
- test chart data 35 (see FIG. 4) which is image data of the test chart 31 is stored in addition to the above-described various programs.
- the RAM area of the memory 34 is also used as a development area for programs executed by the CPU 24 and an arithmetic work area for the CPU 24.
- the CPU 24 analyzes the read image data 32 input from the image scanner 16, and calculates a positional deviation amount ⁇ Y in the sub-scanning direction of the recording position between any two head modules of the head modules 28A to 28C. Calculate (see FIG. 13). Further, the CPU 24 executes a positional deviation correction process for correcting the recording position between the head modules based on the detection result of the positional deviation amount ⁇ Y.
- positional deviation in the sub-scanning direction is simply referred to as “positional deviation”.
- the displacement of the recording position between the head modules occurs due to the actual displacement of the head modules 28A to 28C, for example. Further, although not shown in the figure, the recording position is also displaced by the flying bend of the ink droplets 36 ejected from the nozzles 27 of the head modules 28A to 28C.
- the CPU 24 reads out and executes a program relating to the measurement of the positional deviation amount ⁇ Y and the positional deviation correction from the memory 34, thereby executing a test chart recording control unit (recording control unit) 38 and density profile data calculation.
- the test chart recording control unit 38 is used when the printer 10 is turned on, when any of the head modules 28A to 28C is replaced, when a misregistration amount ⁇ Y is measured, when a predetermined number of sheets are recorded, when a predetermined time elapses, etc.
- the test chart 31 is recorded at a predetermined timing.
- the test chart recording control unit 38 outputs the test chart data 35 read from the memory 34 to the image page memory 18 at the predetermined timing described above, and the image buffer memory write control unit 19, the transfer control unit 22, and the head.
- the driver 23 is operated. As a result, print data corresponding to one droplet ejection based on the test chart data 35 is sequentially transferred to the head through the image buffer memory write control unit 19, the image buffer memory 20, the post-processing calculation unit 21, and the transfer control unit 22. It is transferred to the driver 23.
- the head driver 23 controls ink ejection from the nozzles 27 of the head modules 28A to 28C based on the print data.
- a test chart 31 is recorded on the recording surface of the recording paper 13 by ejecting ink droplets 36 by the head modules 28A to 28C while transporting the recording paper 13 by the transport mechanism 12.
- the ink discharge timings of the head modules 28A to 28C are set to predetermined values so that the test chart 31 recorded on the recording surface has substantially the same shape as the test chart data 35. It is desirable to record.
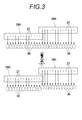
- the test chart 31 includes a first dot pattern group 48A, a second dot pattern group 48B, and a third dot pattern group (not shown) recorded by each of the head modules 28A to 28C.
- first dot pattern group 48A for example, 150 first dot patterns 50A having a shape extending long in the main scanning direction (for example, 5 pixl ⁇ 64 pixl) are recorded at a predetermined pattern interval W1 (repetition period) in the sub scanning direction.
- the “pattern interval W1” here is an interval between the center positions of the dot patterns adjacent to each other in the sub-scanning direction, an interval between the center positions, and an interval between specific dots.
- second dot pattern group 48B for example, 150 second dot patterns 50B having the same shape as the first dot pattern 50A are recorded at a pattern interval W1 (repetition cycle) in the sub-scanning direction.
- Each second dot pattern 50B is recorded with a deviation in the sub-scanning direction by an amount corresponding to the positional deviation of the first and second head modules 28A and 28B with respect to each first dot pattern 50A.
- the third dot pattern group also has a third dot pattern (not shown) having the same shape as the first dot pattern 50A at a pattern interval W1 in the sub-scanning direction. For example, 150 are recorded.
- Such a test chart 31 is read by the image scanner 16.
- the read image data 32 is output from the image scanner 16 to the density profile data calculation unit 39.
- each of the units 39 to 44 from the density profile data calculating unit 39 to the positional deviation amount calculating unit 44 is based on the read image data 32, and between two adjacent head modules of the head modules 28A to 28C.
- the positional deviation amount ⁇ Y of the recording position is calculated.
- the first and second head modules 28A and 28B correspond to the first head module and the second head module of the present invention
- the first and second dot patterns 50A and 50B correspond to the first dot pattern and the second head module of the present invention. This corresponds to a dot pattern of 2.
- the positional deviation amount ⁇ Y is calculated by calculating the deviation amounts of the recording positions of the first and second head modules 28A and 28B from predetermined reference positions (hereinafter referred to as reference positional deviation amounts), respectively. It is calculated by comparing the amount of deviation.
- the calculation of the reference position deviation amount is executed by each of the units 39 to 43 from the density profile data calculation unit 39 to the reference position deviation amount calculation unit 43.
- calculation of the reference position deviation amount of the recording position of the first head module 28A will be described.
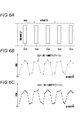
- the density profile data calculation unit 39 analyzes the read image data 32 and density in the sub-scanning direction of the image area where the first dot pattern group 48A is recorded. A first density profile 53A indicating a change is calculated.
- the first concentration profile 53A based on the reference position X 0 a predetermined shows the density change of the image region along the sub-scanning direction from the reference position X 0.
- the density at the position corresponding to each first dot pattern 50A is high, and conversely, the density at the position corresponding to between the first dot patterns 50A is low.
- Reference position X 0 for example, the first dot pattern 50A located at one end portion in the sub-scanning direction of the first dot pattern group 48A, a direction parallel to the sub scanning direction and in a direction away from the first dot pattern group 48A
- the position is at most (W1) / 2 apart.
- the reference position X 0 may be changed as appropriate, it may be between for example the first dot pattern 50A.
- the resolution in the sub-scanning direction of the image scanner 16 (for example, 100 dpi) is lower than the resolution in the sub-scanning direction of the test chart 31 (for example, 600 dpi), so the resolution in the sub-scanning direction of the first density profile 53A. Becomes lower. That is, the interval in the sub-scanning direction between the measurement points of the first density profile 53A is increased.
- the density profile data calculation unit 39 outputs the first density profile 53A to the complement processing unit 40.
- the complement processing unit 40 complements linear interpolation data (also referred to as interpolation) between measurement values at each measurement point of the first density profile 53A (linear interpolation processing). To increase the resolution in the sub-scanning direction of the first density profile 53A from 100 dpi to 10000 dpi.
- the resolution of the image sensor of the image scanner 16 is “R m ”
- the resolution when the resolution is increased is “R h ”
- the measurement value (density value) at an arbitrary measurement point i is “D i ”
- the linear interpolation data “D i (j) ” is expressed by the following equation (1).
- j is an integer of 1 to ((R h ⁇ R m ) ⁇ 1).
- the complement processing unit 40 outputs the first resolution profile 53A1 with high resolution to the repetition period calculation unit 41.
- D i (j) (((R h ⁇ R m ) ⁇ 1) ⁇ D i + j ⁇ D i + 1 ) ⁇ (R h ⁇ R m ) (1)
- the repetition cycle calculation unit 41 is based on the first density profile 53A1 and repeats the density change repetition cycle corresponding to the first dot pattern 50A (that is, how long the peak of the density value is).
- the repetition period length W2 is calculated.
- the repetition cycle length W2 does not completely coincide with the above-described pattern interval W1, and is repeatedly caused by resolution fluctuation factors such as an error in the conveyance speed of the recording paper 13, deformation of the recording paper 13, and reading error of the image scanner 16. An error of about several percent occurs between the cycle length W2 and the pattern interval W1.
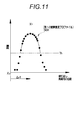
- the repetition cycle length W2 is not accurately obtained, the peak value corresponding to each first dot pattern 50A is averaged during integration averaging by an integration density profile calculation unit 42, which will be described later. It cannot be performed and an accurate peak position (see FIG. 11) cannot be obtained. Therefore, the repetition period calculation unit 41 accurately calculates the repetition period length W2 by the following method.
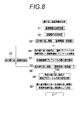
- the repetition period calculation unit 41 first calculates an approximate period (for example, a repetition period when the above-described resolution variation factors such as the above-described pattern interval W1 are ignored) as a temporary repetition.
- the cycle is determined as a reference cycle (high resolution value) (step S1).
- the repetition period calculation unit 41 determines a value from several percent to 10% of the reference period as the fluctuation width of the provisional repetition period (step S2). That is, the provisional repetition period is changed stepwise between (reference period ⁇ variation range) to (reference period + variation range).
- the repetition period calculation unit 41 sets the first provisional repetition period to “reference period—variation width” (step S3). After this setting, the repetition cycle calculation unit 41 calculates a temporary integrated concentration profile obtained by averaging the concentration values of the first concentration profile 53A1 for each temporary repetition cycle (step S4, temporary integrated concentration profile calculation step). .
- the provisional cumulative density profile is basically the same as a first cumulative density profile 56A (see FIG. 7B) described later. Then, the repetition period calculation unit 41 obtains the maximum value (maximum amplitude, intensity) of the provisional cumulative concentration profile (step S5).
- the repetition period calculation unit 41 determines a period obtained by increasing the initial provisional repetition period by several percent of the above-described fluctuation range as a new provisional repetition period (NO in step S6, step S7). Then, the repetition period calculation unit 41 repeatedly executes the calculation of the temporary integrated density profile and the calculation of the maximum value based on the new temporary repetition period (steps S4 and S5). Similarly, the repetition period calculation unit 41 repeats the processes of steps S7, S4, and S5 until the maximum value of the provisional integrated density profile corresponding to the final provisional repetition period (reference period + variation width) is calculated. Execute (NO in step S6, repeat step).
- the repetition period calculation unit 41 calculates the temporary integrated concentration profile for each temporary repetition period after calculating the maximum value of the temporary integration density profile corresponding to all temporary repetition periods (YES in step S ⁇ b> 6). Are compared (step S8).
- the repetition period calculation unit 41 determines the period length of the provisional repetition period having the maximum maximum value as the repetition period length W2 (step S9, determination step). Thereby, the repetition cycle length W2 can be accurately calculated.
- the repetition cycle calculation unit 41 outputs the calculation result of the repetition cycle length W2 to the integrated concentration profile calculation unit 42 together with the first concentration profile 53A1 described above.
- the integrated concentration profile calculation unit 42 averages the concentration values of the first concentration profile 53A1 for each repetition period length W2, and thereby calculates the first integrated concentration profile. 56A is calculated.
- the integrated density profile calculation unit 42 outputs the first integrated density profile 56 ⁇ / b> A to the reference position deviation amount calculation unit 43.
- the reference position deviation amount calculation unit 43 analyzes the first integrated density profile 56A and calculates the reference position deviation amount ⁇ y1 of the recording position of the first head module 28A.
- a method for calculating the reference position deviation amount ⁇ y1 will be specifically described.
- the reference position deviation amount calculation unit 43 determines the threshold value Th of the data of the first integrated density profile 56A using, for example, the following equation (2). Then, the reference position deviation amount calculation unit 43 extracts data exceeding the threshold value Th from the data of the first integrated density profile 56A (step S12).
- Threshold value Th (maximum value ⁇ minimum value) ⁇ f + minimum value: (f is 0.5, for example) (2)
- the peak position is the position where the waveform of the integrated density profile is maximum. For example, in the case of the integrated density profile where the data corresponding to the portion where the dot pattern is not recorded is maximum, the waveform is the waveform.
- the position at which is minimized is the peak position (the same applies to other embodiments). Then, the reference positional deviation amount calculation unit 43 outputs the calculation result of the reference positional deviation amount ⁇ y1 to the positional deviation amount calculation unit 44. Thus, the calculation of the reference position deviation amount ⁇ y1 of the recording position of the first head module 28A is completed.
- the units 39 to 43 from the density profile data calculation unit 39 to the reference position deviation amount calculation unit 43 calculate the reference position deviation amount ⁇ y2 of the recording position of the second head module 28B.
- the calculation process of the reference position deviation amount ⁇ y2 is basically the same as the calculation process of the reference position deviation amount ⁇ y1 described above.
- the density profile data calculation unit 39 analyzes the read image data 32 and calculates a second density profile 53B indicating a change in density in the sub-scanning direction of the image area where the second dot pattern group 48B is recorded.
- the second concentration profile 53B based on the reference position X 0 as defined in the calculation of the first concentration profile 53A described above, a density change of the image region along the sub-scanning direction from the reference position X 0 It is shown. That is, the first and second concentration profile 53A, 53B shows the concentration variation along the sub-scanning direction from a common reference position X 0.
- the complement processing unit 40 performs linear complement processing on the second density profile 53B to increase the resolution of the second density profile 53B in the sub-scanning direction from 100 dpi to 10000 dpi. As a result, a high-resolution second density profile 53B1 is generated.
- the repetition period calculation unit 41 uses the method shown in FIGS. 8 and 9 described above, and based on the second density profile 53B1, the repetition period length W2 indicating the repetition period of the density change corresponding to the second dot pattern 50B. Is calculated.
- the integrated concentration profile calculation unit 42 calculates the second integrated concentration profile 56B by averaging the data of the second concentration profile 53B1 every repetition cycle length W2.
- Reference position deviation amount calculating section 43 as shown in FIGS. 10 and 11 described above, to calculate the peak position X P of the second cumulative concentration profiles 56B, based on the peak position X P, the second head module A reference position deviation amount ⁇ y2 of the recording position 28B is calculated. Then, the reference position deviation amount calculation unit 43 outputs the calculation result of the reference position deviation amount ⁇ y2 to the position deviation amount calculation unit 44.
- position shift amount calculation unit 44 calculates the position deviation amount [Delta] Y.
- Each reference position deviation amount .DELTA.y1, .DELTA.y2 (each peak position X P), since it is calculated as each reference a common reference position X 0, the first and second head modules 28A by taking the difference between the two, 28B It is possible to calculate the positional deviation amount ⁇ Y of the recording position between.
- the positional deviation amount calculation unit 44 outputs the calculation result of the positional deviation amount ⁇ Y to the positional deviation correction processing unit 45.
- the positional deviation amount ⁇ Y includes a deviation amount from the design position shown in FIG. 3, a deviation amount due to the staggered arrangement, and an error in ink ejection timing set in each head module at the time of test chart recording. This is the amount of positional deviation.
- the misregistration correction processing unit 45 performs misregistration correction processing for correcting the recording position between the first and second head modules 28A and 28B based on the detection result of the misregistration amount ⁇ Y.
- the misalignment correction processing unit 45 controls the post-processing calculation unit 21 to perform misalignment correction processing on the print data, and sets the recording start timing of one of the first and second head modules 28A and 28B to the other. Accelerate or delay against Thereby, the displacement of the recording position between the first and second head modules 28A, 28B is corrected.
- Various methods are known as misregistration correction methods for correcting the misregistration of the recording position between the head modules, and any of these may be used.
- each unit 39 of the CPU 24 is displayed. ⁇ 45 are activated to start the measurement process of the positional deviation amount ⁇ Y (step S20).
- Test chart recording process As shown in FIG. 15, after the test chart data 35 in the memory 34 is output to the image page memory 18 under the control of the test chart recording control unit 38, the image buffer memory write control unit 19 and the image buffer memory 20 are output.
- the print data for one droplet ejection based on the test chart data 35 is sequentially transferred to the head driver 23 via the transfer control unit 22.
- the head driver 23 controls ink ejection from the nozzles 27 of the head modules 28A to 28C based on the print data.
- the test chart 31 is recorded on the recording surface of the recording paper 13 by ejecting ink droplets 36 by the head modules 28A to 28C while conveying the recording paper 13 in the sub-scanning direction by the transport mechanism 12. (Step S21, recording step).
- the CPU 24 After recording the test chart 31, the CPU 24 tracks the test chart 31 based on the known conveyance speed information of the recording paper 13. Then, the CPU 24 starts reading by the image scanner 16 in accordance with the timing when the test chart 31 passes the image scanner 16. As a result, the test chart 31 is read by the image scanner 16, and the read image data 32 is output from the image scanner 16 to the density profile data calculation unit 39 (step S22, reading step).
- the density profile data calculation unit 39 identifies two head modules, that is, the first and second head modules 28A and 28B that are the measurement targets of the positional deviation amount ⁇ Y (step S23). Next, a calculation process of the reference position deviation amount ⁇ y1 of the recording position of the first head module 28A is started (step S24).
- the density profile data calculation unit 39 analyzes the read image data 32 to calculate the first density profile 53A as shown in FIG. 6B (step S26, density profile calculation). Step).
- the first density profile 53A is output from the density profile data calculation unit 39 to the complement processing unit 40.
- the complement processing unit 40 performs linear complement processing on the first density profile 53A, thereby generating the first density profile 53A1 having a higher resolution as shown in FIG. 6C (step S27). , Complementary processing step).
- the reference positional deviation amount ⁇ y1 that is, the positional deviation amount ⁇ Y
- the first density profile 53A1 is output from the complement processing unit 40 to the repetition period calculation unit 41.
- the repetition period calculation unit 41 executes the processing from step S1 to step S9 shown in FIG. 8 to thereby repeat the density change repetition period corresponding to the first dot pattern 50A as shown in FIG. 7A. Is calculated (step S28, repetition cycle calculation step). By accurately calculate the repetition period length W2, it is possible to accurately calculate the peak position X P of the first integration density profile 56A.
- the calculation result of the repetition cycle length W2 is output from the repetition cycle calculation unit 41 to the integrated concentration profile calculation unit 42 together with the first concentration profile 53A1.
- the integrated concentration profile calculation unit 42 calculates the first integrated concentration profile 56A by integrating and averaging the data of the first concentration profile 53A1 for each repetition period length W2.
- Step S29 integrated density profile calculation step).
- the first integrated density profile 56A is output from the integrated density profile calculation unit 42 to the reference position deviation amount calculation unit 43.
- the reference position deviation amount calculation unit 43 executes the processing from step S12 to step S14 shown in FIG. 10, so that the recording position of the first head module 28 ⁇ / b> A is obtained as shown in FIG. 7C and FIG. 11.
- the reference position deviation amount ⁇ y1 is calculated (step S30).
- the calculation result of the reference positional deviation amount ⁇ y1 is output from the reference positional deviation amount calculation unit 43 to the positional deviation amount calculation unit 44. This completes the calculation processing of the reference position deviation amount ⁇ y1 (see step S24, FIG. 15).
- Positional deviation amount calculating section 44 calculates the positional deviation amount [Delta] Y (step S33, positional deviation amount calculating step).
- the calculation result of the positional deviation amount ⁇ Y is output from the positional deviation amount calculation unit 44 to the positional deviation correction processing unit 45. This completes the positional deviation amount measurement process (step S20, see FIG. 14).
- Step S36 when a print start operation is performed by an operation unit (not shown) or the like (step S36), image data sent from the host computer 11 is stored in the image page memory 18 via the host I / F unit 17. (Step S37). Then, under the control of the CPU 24, print data for one droplet ejection based on the image data is sequentially transferred to the head driver 23. At this time, the misregistration correction processing unit 45 controls the post-processing calculation unit 21 based on the detection result of the misregistration amount ⁇ Y, and performs misregistration correction processing on the print data. Thereby, the displacement of the recording position between the first and second head modules 28A, 28B is corrected (step S38).
- the head driver 23 controls ink ejection from the nozzles 27 of the head modules 28A to 28C based on the print data. Then, while transporting the recording paper 13 in the sub-scanning direction by the transport mechanism 12, ink droplets 36 are ejected by the head modules 28A to 28C. Thereby, an image based on the image data is recorded on the recording surface of the recording paper 13 (step S39).
- step S40 When printing is performed again based on other image data (YES in step S40), the above-described processing from step S37 to step S39 is repeatedly executed.
- step S41, step S42 the measurement processing of the positional deviation amount ⁇ Y is executed again (YES in step S41, step S42). Thereby, the processing from step S21 to step S30 shown in FIG. 15 and FIG. 16 is repeatedly executed, and a new positional deviation amount ⁇ Y is measured.
- the first and second integrated density profiles 56A and 56B are calculated based on the read image of the test chart 31, and the positional deviation amount ⁇ Y is measured based on the first and second integrated density profiles 56A and 56B. Without using a sensor, it is possible to measure the amount of displacement of the recording position between the head modules with low cost and high accuracy.
- the printer 70 according to the second embodiment of the present invention will be described with reference to FIG.
- the recording areas where the head modules 28A to 28C perform recording on the recording paper 13 do not overlap, but in the printer 70, the recording areas of the head modules adjacent to each other overlap.
- the printer 70 has basically the same configuration as the printer 10 of the first embodiment, except that the printer 70 includes a recording head 72 different from that of the first embodiment. For this reason, the same reference numerals are given to the same functions and configurations as those in the first embodiment, and the description thereof is omitted.
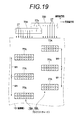
- the recording head 72 includes three replaceable head modules (two, or four or more) of the first head module 73A, the second head module 73B, and the third head module 73C, and the frame body 29. I have.
- the head modules 73A to 73C are arranged in a staggered pattern along the main scanning direction. The ends of two head modules adjacent to each other in each of the head modules 73A to 73C overlap each other.
- Each of the head modules 73A to 73C corresponds to a first head module and a second head module of the present invention, respectively.
- Some nozzles 27a of the first head module 73A and the second head module 73B are arranged so that the positions in the main scanning direction overlap. Further, some of the nozzles 27a of the second head module 73B and the third head module 73C are also arranged so that the positions in the main scanning direction overlap. As a result, a part of the recording area of the first head module 73A and the recording area of the second head module 73B overlap, and one of the recording area of the second head module 73B and the recording area of the third head module 73C. Parts overlap.
- an overlap recording area is referred to as an “overlap recording area”
- a recording area other than the overlap recording area is referred to as a “non-overlapping recording area”.
- the positional deviation of the recording position between the head modules 73A to 73C is omitted as in the first embodiment shown in FIG. 3, and the positional deviation of the head modules 73A to 73C is omitted. Is generated by the flying bend of the ink droplet 36.
- Such a measurement method of the positional deviation amount ⁇ Y of the recording position of each of the head modules 73A to 73C is the same as that of the first embodiment except that a test chart 75 (see FIG. 19) different from the first embodiment is recorded on the recording paper 13. This is basically the same as the measurement method described in the embodiment.
- the test chart recording control unit 38 outputs the test chart data 35 to the image page memory 18 as in the first embodiment, and operates the image buffer memory write control unit 19, the transfer control unit 22, and the head driver 23.
- the test chart 75 is recorded. However, at this time, the test chart recording control unit 38 prohibits (stops) the ejection of the ink droplets 36 from the nozzles 27a. That is, the test chart 75 is recorded in the non-overlapping recording area only by the nozzles 27 of the head modules 73A to 73C.
- the test chart 75 includes a first dot pattern group 76A, a second dot pattern group 76B, and a third dot pattern group (illustrated) recorded by only the nozzles 27 of the head modules 73A to 73C. Is omitted).
- the first dot pattern group 76A is obtained by recording, for example, 150 first dot patterns 77A having a shape extending in the main scanning direction at a pattern interval W1 (repetition period) in the sub scanning direction.
- the second dot pattern group 76B for example, 150 second dot patterns 77B having the same shape as the first dot pattern 77A are recorded at a pattern interval W1 (repetition cycle) in the sub-scanning direction.
- Each second dot pattern 50B is recorded with a deviation in the sub-scanning direction by an amount corresponding to the positional deviation of the first and second head modules 73A and 73B with respect to each first dot pattern 50A.
- third dot patterns for example, 150 third dot patterns (not shown) having the same shape as the first dot pattern 77A are recorded at the pattern interval W1 in the sub-scanning direction.
- the dot patterns 77A and 77B correspond to the first dot pattern and the second dot pattern of the present invention.
- test chart 75 is the same as the test chart 31 of the first embodiment except that the lengths of the first and second dot patterns 77A and 77B in the main scanning direction are different. Therefore, as in the first embodiment, the processing from step S21 to step S33 shown in FIG. 15 and FIG. A positional deviation amount ⁇ Y of the recording position can be calculated. In addition, it is possible to correct the positional deviation based on the calculation result of the positional deviation amount ⁇ Y. Thereby, the effect similar to the said 1st Embodiment is acquired.
- the printer 80 according to the third embodiment of the present invention will be described with reference to FIG.
- the test chart 75 is recorded only by the nozzles 27 of the head modules 73A to 73C.
- the test chart 81 is recorded in the overlap recording area of the recording paper 13 using only the nozzles 27a of the head modules 73A to 73C, and the positional deviation is based on the read image of the test chart 81.
- the quantity ⁇ Y is measured.
- the printer 80 has basically the same configuration as the printer 10 of the first embodiment except that the printer 80 includes a CPU 83 and a recording head 72 different from those of the first embodiment. Further, the recording head 72 of the printer 80 has the same configuration as the recording head 72 of the second embodiment. Therefore, the same functions and configurations as those of the first and second embodiments are denoted by the same reference numerals, and the description thereof is omitted.
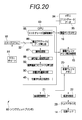
- the CPU 83 reads out and executes a program related to the measurement of the positional deviation amount ⁇ Y and the positional deviation correction from the memory 34, thereby executing a test chart recording control unit (recording control unit) 85, a density profile data calculation unit 86, and a complementary processing unit 87. , Function as a repetition period calculation unit 88, an integrated density profile calculation unit 89, a positional deviation amount calculation unit 90, and a positional deviation correction processing unit 45.
- Test chart recording The test chart recording control unit 85 outputs the test chart data 35 to the image page memory 18 as well as the image buffer memory write control unit 19 and the transfer control unit 22, similarly to the test chart recording control unit 38 of the first embodiment. And the head driver 23 is operated to record the test chart 81. However, at this time, the test chart recording control unit 85 prohibits (stops) the ejection of the ink droplets 36 from the nozzles 27. That is, the test chart 81 is recorded in the overlap recording area OLA (see FIG. 21) only by the nozzles 27a of the head modules 73A to 73C.
- the test chart 81 includes a first dot pattern 94A recorded by the nozzle 27a of the first head module 73A, a second dot pattern 94B recorded by the nozzle 27a of the second head module 73B, A third dot pattern (not shown) recorded by the nozzles 27a of the third head module 73C is included.
- Each of the dot patterns 94A and 94B has a shape extending in the main scanning direction and corresponds to the first dot pattern and the second dot pattern of the present invention.
- 150 first and second dot patterns 94A and 94B are recorded at a pattern interval W1 (repetition period) in the sub-scanning direction.
- W1 repetition period
- the first and second dot patterns 94A and 94B are alternately recorded along the sub-scanning direction.
- the density profile data calculation unit 86 analyzes the read image data 32 of the test chart 81 acquired from the image scanner 16 and overlaps the recording area OLA of the recording paper 13.
- a third density profile 96 indicating the density change in the sub-scanning direction is calculated.
- the density at the position corresponding to the first and second dot patterns 94A and 94B is high, and conversely, the density at the position corresponding to between the first and second dot patterns 94A and 94B is high. Lower.
- the resolution of the image scanner 16 in the sub-scanning direction is low, the resolution of the third density profile 96 in the sub-scanning direction is also low.
- the density profile data calculation unit 86 outputs the third density profile 96 to the complement processing unit 87.
- the complement processing unit 87 performs linear complement processing similar to that of the first embodiment on the third density profile 96, and the third density profile 96 in the sub-scanning direction.
- the resolution is increased from, for example, 100 dpi to 10000 dpi.
- the complement processing unit 40 outputs the high-resolution third density profile 96a to the repetition period calculation unit 88.
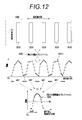
- the repetition period calculation unit 88 is based on the third density profile 96 and indicates the repetition period of the density change corresponding to the first and second dot patterns 94A and 94B adjacent to each other.
- the period length W3 is calculated.
- a temporary integrated concentration profile for each temporary repetition cycle is calculated, and the maximum values of the temporary integrated concentration profiles are compared. It can be calculated based on the result.
- the “maximum value” of each provisional integrated density profile is a total value of two peak values shown in FIG.
- the repetition cycle calculation unit 88 outputs the calculation result of the repetition cycle length W3 to the integrated concentration profile calculation unit 89 together with the above-described third concentration profile 96a.
- the integrated concentration profile calculation unit 89 calculates the third integrated concentration profile 98 by averaging the data of the third concentration profile 96a for each repetition cycle length W3.
- the integrated density profile calculation unit 89 outputs the third integrated density profile 98 to the positional deviation amount calculation unit 90.
- the positional deviation amount calculation unit 90 analyzes the third integrated density profile 98 to determine the position between the recording position of the first head module 73A and the recording position of the second head module 73B. A deviation amount ⁇ Y is calculated.
- a method for calculating the positional deviation amount ⁇ Y based on the third integrated density profile 98 will be specifically described.
- the misregistration amount calculation unit 90 determines the threshold value Th of the data of the third integrated density profile 98 using the equation (2) described in the first embodiment. Then, the positional deviation amount calculation unit 90 extracts data that exceeds the threshold value Th from the data of the third integrated density profile 98 (step S50).
- the positional deviation amount calculation unit 90 obtains an average value of the X values (integrated phase value: position within the repetition period) of the data exceeding the threshold value Th, and sets the data whose X value is smaller than the average value as “group 1”. Conversely, data larger than the average value is set as “group 2” (step S51).
- group 1 is data corresponding to the first dot pattern 94A
- group 2 is data corresponding to the second dot pattern 94B.
- the positional deviation amount calculation unit 90 calculates an approximate curve for the data of group 2, and calculates the peak position X P2 of the approximate curve (step S53).
- positional deviation amount calculating section 90 the peak position X P1, the peak position X P2, and resolution R m of the image scanner 16, based on the resolution R h when the high resolution, the following formula (5) , (6) is used to calculate the positional deviation amount ⁇ Y (step S54). That is, based on the difference between the peak position X P2 of the peak position X P1 corresponding to the first dot pattern 94A corresponding to the second dot pattern 94B, and calculates the positional deviation amount [Delta] Y.
- the positional deviation amount calculation unit 90 outputs the calculation result of the positional deviation amount ⁇ Y to the positional deviation correction processing unit 45.
- the positional deviation amount ⁇ Y includes a deviation amount from the design position shown in FIG. 18, a deviation amount due to the staggered arrangement, and an error in ink ejection timing set in each head module during test chart recording. This is the amount of positional deviation.
- each part of the CPU 83 is used. 85 to 90 are actuated to start the measurement process of the positional deviation amount ⁇ Y (step S20).
- test chart recording control unit 85 Under the control of the test chart recording control unit 85, similarly to the first embodiment, print data for one droplet ejection based on the test chart data 35 is sequentially transferred to the head driver 23.
- the head driver 23 controls ink ejection from the nozzles 27a of the head modules 73A to 73C based on the print data.
- the test chart 81 is recorded in the overlap recording area OLA by ejecting the ink droplets 36 by the head modules 73A to 73C while transporting the recording paper 13 in the sub-scanning direction by the transport mechanism 12. S58, recording step).
- test chart 81 After recording the test chart 81, the test chart 81 is read by the image scanner 16 and the read image data 32 is output from the image scanner 16 to the density profile data calculation unit 86, as in the first embodiment (step S59, read). Step).
- the density profile data calculation unit 86 identifies two head modules, that is, the first and second head modules 73A and 73B that are to be measured for the positional deviation amount ⁇ Y (step S60).
- the density profile data calculation unit 86 analyzes the read image data 32 and calculates a third density profile 96 as shown in FIG. 22B (step S61, density profile calculation step).
- the third density profile 96 is output from the density profile data calculation unit 86 to the complement processing unit 87.
- the complement processing unit 87 performs a linear complement process on the third density profile 96, thereby generating a third density profile 96a having a higher resolution as shown in FIG. 22C (step S62). , Complementary processing step).
- the third density profile 96a is output from the complement processing unit 87 to the repetition period calculation unit 88.
- the repetition cycle calculation unit 88 executes basically the same processing as the processing from step S1 to step S9 shown in FIG. 8, calculates temporary integrated concentration profiles for each temporary repetition cycle, and each temporary integrated concentration profile.
- the maximum values total values of group 1 and group 2 are compared.
- the repetition period length W3 as shown in FIG. 23A is calculated by the repetition period calculation unit 41 (step S63, repetition period calculation step).
- the calculation result of the repetition period length W3 is output from the repetition period calculation unit 88 to the integrated concentration profile calculation unit 89 together with the third concentration profile 96a.
- the integrated concentration profile calculation unit 89 calculates the third integrated concentration profile 98 by averaging the third concentration profile 96a every repetition cycle length W3 (step S64). , Integrated concentration profile calculation step).
- the third integrated density profile 98 is output from the integrated density profile calculation unit 89 to the positional deviation amount calculation unit 90.
- the positional deviation amount calculation unit 90 executes the processing from step S50 to step S54 shown in FIG. Thereby, positional deviation amount calculating section 90, as shown in FIG. 23 (C) and FIG. 25, based on the difference between the peak position X P1 and the peak position X P2, the first and second head modules 73A, 73B A positional deviation amount ⁇ Y between the recording positions is calculated (step S65). This completes the positional deviation amount measurement process.
- the reference position deviation amounts ⁇ y1 and ⁇ y2 for each head module are calculated by analyzing the test chart 81 recorded in the overlap recording area OLA as in the first embodiment. Without this, the positional deviation amount ⁇ Y can be directly calculated. Thereby, the time required for calculating the positional deviation amount ⁇ Y can be shortened. Further, similarly to the first embodiment, it is possible to measure the displacement amount of the recording position between the head modules with low cost and high accuracy without using a high resolution image sensor.
- the printer 100 ejects ink of a plurality of colors from the recording head 250 (configured by CMYK ink jet heads 172M, 172K, 172C, and 172Y) onto the recording paper 13 held on the drawing drum 170.
- This is a direct drawing type ink jet printer that forms a desired color image.
- the printer 100 applies a processing liquid (here, an aggregating processing liquid) to the recording paper 13 before the ink is ejected, and reacts the processing liquid and the ink liquid to form an image on the recording paper 13 (a two-liquid reaction ( The aggregation method is applied.
- a processing liquid here, an aggregating processing liquid
- the printer 100 mainly includes a paper feeding unit 112, a processing liquid application unit 114, a recording unit 116, a drying unit 118, a fixing unit 120, and a paper discharge unit 122.
- recording paper 13 which is a sheet is stacked.
- the recording sheets 13 are fed one by one from the sheet feeding tray 150 of the sheet feeding unit 112 to the processing liquid applying unit 114.
- a sheet cut paper
- a configuration in which continuous paper (roll paper) is cut to a required size and fed is also possible.
- the processing liquid application unit 114 is a mechanism that applies a processing liquid to the surface of the recording paper 13.
- the treatment liquid contains a color material aggregating agent that agglomerates the color material (pigment in this example) applied in the recording unit 116, and the ink comes into contact with the treatment liquid when the treatment liquid comes into contact with the ink. And the solvent are promoted.
- the processing liquid application unit 114 includes a paper feed cylinder 152, a processing liquid drum 154, and a processing liquid coating device 156.
- the processing liquid drum 154 includes a claw-shaped holding means (gripper) 155 on the outer peripheral surface thereof, and the recording paper 13 is sandwiched between the claw of the holding means 155 and the peripheral surface of the processing liquid drum 154. The tip can be held.
- a suction hole may be provided on the outer peripheral surface of the treatment liquid drum 154, and a suction unit that performs suction from the suction hole may be connected. As a result, the recording paper 13 can be held in close contact with the peripheral surface of the treatment liquid drum 154.
- a treatment liquid coating device 156 is disposed to face the peripheral surface of the treatment liquid drum 154.
- the treatment liquid coating device 156 includes a treatment liquid container in which the treatment liquid is stored, an anix roller partially immersed in the treatment liquid in the treatment liquid container, and the recording paper 13 on the anix roller and the treatment liquid drum 154. And a rubber roller that transfers the measured processing liquid to the recording paper 13.
- the processing liquid application device 156 the processing liquid can be applied to the surface of the recording paper 13 while being measured.
- the configuration in which the application method using the roller is exemplified, but the present invention is not limited to this. For example, various methods such as a spray method and an ink jet method can be applied.
- the recording paper 13 to which the processing liquid is applied is transferred from the processing liquid drum 154 to the drawing drum 170 of the recording unit 116 via the intermediate conveyance unit 126.
- the recording unit 116 includes a drawing drum 170, a paper sheet pressing roller 174, and an ink jet head 250 (ink jet heads 172M, 172K, 172C, 172Y). Similar to the treatment liquid drum 154, the drawing drum 170 includes a claw-shaped holding means (gripper) 171 on the outer peripheral surface thereof.
- the inkjet heads 172M, 172K, 172C, and 172Y are full-line inkjet inkjet heads each having a length corresponding to the maximum width of the image formation region on the recording paper 13, and image formation is performed on the ink ejection surface.
- a nozzle row in which a plurality of nozzles for ink ejection are arranged over the entire width of the region is formed.
- Each inkjet head 172M, 172K, 172C, 172Y is installed so as to extend in a direction (first direction) orthogonal to the conveyance direction of the recording paper 13 (the rotation direction of the drawing drum 170, the second direction).
- Corresponding color ink droplets are ejected from the inkjet heads 172M, 172K, 172C, and 172Y of the inkjet head 250 arranged on the surface side toward the surface of the recording paper 13 held in close contact with the drawing drum 170.
- the ink comes into contact with the treatment liquid applied to the recording surface in advance by the treatment liquid application unit 114, and the color material (pigment) dispersed in the ink is aggregated to form a color material aggregate.
- the color material flow on the recording paper 13 is prevented, and an image is formed on the surface of the recording paper 13.
- the recording paper 13 is transported at a constant speed by the drawing drum 170, and the operation of relatively moving the recording paper 13 and the respective ink jet heads 172M, 172K, 172C, 172Y in this transport direction is performed only once ( That is, an image can be recorded in the image forming area on the surface of the recording paper 13 in one sub-scanning.
- the recording paper 13 on which the image is formed is transferred from the drawing drum 170 to the drying drum 176 of the drying unit 118 via the intermediate conveyance unit 128.
- the drying unit 118 is a mechanism for drying moisture contained in the solvent separated by the color material aggregating action, and includes a drying drum 176 and a solvent drying device 178. Similar to the treatment liquid drum 154, the drying drum 176 includes a claw-shaped holding means (gripper) 177 on the outer peripheral surface thereof, and the holding means 177 can hold the leading end of the recording paper 13.
- a drying drum 176 Similar to the treatment liquid drum 154, the drying drum 176 includes a claw-shaped holding means (gripper) 177 on the outer peripheral surface thereof, and the holding means 177 can hold the leading end of the recording paper 13.
- the solvent drying device 178 is disposed at a position facing the outer peripheral surface of the drying drum 176, and includes a plurality of halogen heaters 180 and hot air jet nozzles 182 respectively disposed between the halogen heaters 180.
- the recording paper 13 that has been dried by the drying unit 118 is transferred from the drying drum 176 to the fixing drum 184 of the fixing unit 120 via the intermediate conveyance unit 130.
- the fixing unit 120 includes a fixing drum 184, a halogen heater 186, a fixing roller 188, and an inline sensor 190.
- the fixing drum 184 includes a claw-shaped holding unit (gripper) 185 on its outer peripheral surface, and the holding unit 185 can hold the leading end of the recording paper 13.
- the recording surface (both sides) of the recording paper 13 is preheated by the halogen heater 186, fixed by the fixing roller 188, and inspected by the inline sensor 190.
- the fixing roller 188 is a roller member that heats and pressurizes the dried ink to weld the self-dispersing polymer fine particles in the ink to form a film of the ink, and is configured to heat and press the recording paper 13.
- the Specifically, the fixing roller 188 is disposed so as to be in pressure contact with the fixing drum 184 and constitutes a nip roller with the fixing drum 184.
- the recording paper 13 is sandwiched between the fixing roller 188 and the fixing drum 184 and nipped with a predetermined nip pressure, and a fixing process is performed.
- the fixing roller 188 is constituted by a heating roller incorporating a halogen lamp or the like, and is controlled to a predetermined temperature.
- the in-line sensor (reading unit) 190 is a means for reading an image formed on the recording paper 13 and detecting image density, image defect, and the like, and a CCD line sensor or the like is applied.
- the inline sensor 190 is basically the same as the image scanner 16 described above.
- the latex particles in the thin image layer formed by the drying unit 118 are heated and pressurized by the fixing roller 188 and melted, so that the ink can be fixed and fixed on the recording paper 13.
- the surface temperature of the fixing drum 184 is set to 50 ° C. or higher.
- the printer 100 includes a UV exposure unit that exposes ink on the recording paper 13 to UV light instead of the heat-pressure fixing unit (fixing roller 188) using a heat roller.
- a UV exposure unit that exposes ink on the recording paper 13 to UV light
- an actinic ray such as a UV lamp or an ultraviolet LD (laser diode) array is used instead of the fixing roller 188 for heat fixing. Means for irradiating are provided.
- a paper discharge unit 122 is provided.
- the paper discharge unit 122 includes a discharge tray 192, and a transfer drum 194, a conveyance belt 196, and a stretching roller 198 are provided between the discharge tray 192 and the fixing drum 184 of the fixing unit 120.
- the recording paper 13 is sent to the transport belt 196 by the transfer drum 194 and discharged to the discharge tray 192.
- the details of the paper transport mechanism by the transport belt 196 are not shown in the drawing, the recording paper 13 after printing is held at the front end of the paper by a gripper (not shown) gripped between the endless transport belt 196, and the transport belt 196. Is carried above the discharge tray 192.
- the printer 100 has an ink storage / loading unit that supplies ink to the inkjet heads 172M, 172K, 172C, and 172Y and a processing liquid application unit 114 in addition to the above-described configuration.
- a head maintenance unit that includes means for supplying a processing liquid and performs cleaning (nozzle surface wiping, purging, nozzle suction, etc.) of each of the inkjet heads 172M, 172K, 172C, and 172Y, and the position of the recording paper 13 on the paper transport path
- the inkjet head 250 includes a nozzle 251 that is an ink discharge port, a pressure chamber 252 that communicates with each nozzle 251, and a supply port 254 that communicates a common channel (not shown) and each pressure chamber 252.
- a plurality of ink chamber units (droplet discharge elements as recording element units) 253 are arranged in a matrix.
- the ink jet head 250 increases the density of the substantial nozzle interval (projection nozzle pitch shown by the symbol Pn) projected so as to be aligned along the main scanning direction that is the longitudinal direction of the ink jet head 250. Have achieved.
- the planar shape of the pressure chamber 252 communicating with the nozzle 251 is approximately square, the nozzle 251 is provided at one of the diagonal corners, and the supply port 254 is provided at the other.
- the shape of the pressure chamber 252 is not limited to this example, and the planar shape may have various forms such as a quadrangle (rhombus, rectangle, etc.), a pentagon, a hexagon, other polygons, a circle, and an ellipse.
- the ink chamber unit 253 including the nozzles 251 and the pressure chambers 252 is arranged in a row direction along the main scanning direction and an oblique column direction having a constant angle ⁇ (0 ° ⁇ ⁇ 90 °) that is not orthogonal to the main scanning direction.
- the high-density nozzle head of the present example is realized by arranging the matrix in a fixed arrangement pattern along (shown with reference symbol Sa).
- the projected nozzle pitch Pn of the nozzles projected in the main scanning direction is g ⁇ . cos ⁇ .
- each nozzle 251 can be handled equivalently as a linear arrangement with a constant pitch Pn.
- the inkjet head 250 has a structure in which a nozzle plate 251A in which nozzles 251 are formed and a flow path plate 252P in which flow paths such as a pressure chamber 252 and a common flow path 255 are formed are laminated and joined. Become.
- the flow path plate 252P forms a side wall of the pressure chamber 252 and a flow path that forms a supply port 254 as a narrowed portion (most narrowed portion) of an individual supply path that guides ink from the common flow path 255 to the pressure chamber 252. It is a forming member.
- the flow path plate 252P has a structure in which one or a plurality of substrates are stacked, although it is illustrated in a simplified manner in FIG.
- the nozzle plate 251A and the flow path plate 252P can be processed into a required shape by a semiconductor manufacturing process using silicon as a material.
- the common channel 255 communicates with an ink tank (not shown) as an ink supply source, and the ink supplied from the ink tank is supplied to each pressure chamber 252 via the common channel 255.
- a piezoelectric actuator 258 including an individual electrode 257 is joined to a diaphragm 256 constituting a part of the pressure chamber 252 (the top surface in FIG. 29).
- the diaphragm 256 of this example is made of silicon (Si) with a nickel (Ni) conductive layer functioning as a common electrode 259 corresponding to the lower electrode of the piezoelectric actuator 258, and is arranged corresponding to each pressure chamber 252. It also serves as a common electrode for the actuator 258. It is also possible to form the diaphragm with a non-conductive material such as resin. In this case, a common electrode layer made of a conductive material such as metal is formed on the surface of the diaphragm member. Moreover, you may comprise the diaphragm which serves as a common electrode with metals (conductive material), such as stainless steel (SUS).
- conductive material such as stainless steel (SUS).
- the piezoelectric actuator 258 By applying a driving voltage to the individual electrode 257, the piezoelectric actuator 258 is deformed and the volume of the pressure chamber 252 is changed, and ink is ejected from the nozzle 251 due to the pressure change accompanying this. When the piezoelectric actuator 258 returns to its original state after ink ejection, new ink is refilled into the pressure chamber 252 from the common flow channel 255 through the supply port 254.
- the printer 100 to which the impression cylinder conveyance method is applied is illustrated, but the conveyance method of the recording paper 13 is not limited to the impression cylinder conveyance method, and the belt that sucks and holds the recording paper 13 on the conveyance belt. It is also possible to select a transport method and other transport methods as appropriate.
- the arrangement form of the nozzles 251 is not limited to the illustrated example, and various nozzle arrangement structures can be applied.
- a linear array of lines, a V-shaped nozzle array, a zigzag-shaped nozzle array (such as a W-shape) having a V-shaped array as a repeating unit, and the like are also possible.
- the positional deviation amount ⁇ Y of the recording position between the head modules adjacent to each other is calculated.
- the positional deviation amount ⁇ Y of the recording position between any non-adjacent head modules is also calculated in the same manner. can do. Note that as the interval in the main scanning direction between the head modules for measuring the amount of positional deviation increases, the inclination of the recording head 72 (rotational displacement of the recording head 72 about the direction perpendicular to the surface of the recording paper 13), the recording paper The error of the conveyance speed 13, the deformation of the recording paper 13, the reading error of the image scanner 16, etc. affect the measurement result of the positional deviation amount. For this reason, the positional deviation amount ⁇ Y can be measured with higher accuracy by selecting the head modules adjacent to each other as the measurement target for measuring the positional deviation amount ⁇ Y.
- linear interpolation processing is performed on each density profile by the complement processing units 40 and 87, but the complement method is not particularly limited as long as each density profile can be highly resolved in the sub-scanning direction. Further, the calculation method of the repetition period lengths W2 and W3 of each concentration profile is not particularly limited to the method shown in FIGS. 8 and 9, and various known methods may be used.
- the pattern interval W1 (period length) is arbitrarily set, but this pattern interval W1 is preferably a non-integer multiple of the resolution of the image scanner 16 in the sub-scanning direction of the image sensor.
- the reading position of the image sensor with respect to each of the dot patterns arranged in the sub-scanning direction gradually shifts.
- various measurement points in the sub-scanning direction in the first density profile 53A in FIG. The data at is obtained.
- a more accurate waveform of the first integrated concentration profile 56A shown in FIG. 7B can be obtained, so that the peak position can be accurately determined.
- the first to third density profiles 53A, 53B, and 96 are integrated and averaged for each repetition period length W2 and W3 to calculate the first to third density profiles 56A, 56B, and 98, respectively.
- the first to third integrated density profiles may be calculated by integrating the density profiles 53A, 53B, and 96 for each of the repetition cycle lengths W2 and W3 without performing the averaging process.
- 150 dot patterns are formed in the sub-scanning direction, but the number of each dot pattern may be increased or decreased as appropriate. As the number of dot patterns increases, the number of data of each density profile increases, so that the positional deviation amount ⁇ Y can be measured with higher accuracy.
- the recording head of the above embodiment records four colors of CMYK, but the recording color is not particularly limited.
- the present invention can also be applied to an inkjet printer including a shuttle head type recording head that moves the recording head relative to the recording paper instead of moving the recording paper relative to the fixed recording head.
- an inkjet printer for graphic printing has been described as an example, but the scope of application of the present invention is not limited to this example.
- a wiring drawing apparatus for drawing a wiring pattern of an electronic circuit a manufacturing apparatus for various devices, a resist printing apparatus that uses a resin liquid as a functional liquid for ejection, a color filter manufacturing apparatus, and a material deposition material.
- the present invention can be widely applied to inkjet printers that draw various shapes and patterns using a liquid functional material, such as a fine structure forming apparatus that forms a structure.
- an inkjet printer has been described as an example of the image recording apparatus of the present invention.
- a thermal transfer recording apparatus including a plurality of recording heads using thermal elements as recording elements, and a plurality of recording heads using LED elements as recording elements.
- the present invention can be applied to various image recording apparatuses such as an LED electrophotographic printer provided.
Landscapes
- Engineering & Computer Science (AREA)
- Quality & Reliability (AREA)
- Ink Jet (AREA)
- Accessory Devices And Overall Control Thereof (AREA)
Abstract
The present invention measures the amount of positional deviation between head modules at low cost and with high precision. While moving the print head and the print medium relative to each other in a second direction, a first head module and a second head module each records dot patterns on the print medium at a previously determined interval in the second direction. The dot patterns are read optically and density profiles that represent the changes in density of the dot pattern readout images in the second direction are calculated. The repeating period for the density profile waveforms, which correspond to respective dot patterns, is calculated. With every repeating period, the density profile data is added and averaged to calculate the cumulative density profile. The peak positions of the cumulative density profile waveforms, each of which corresponds to a respective dot pattern, are determined and the amount of positional deviation is calculated on the basis of the respective peak positions.
Description
本発明は、記録ヘッドの複数のヘッドモジュールの記録位置の位置ずれ量を測定する位置ずれ量測定方法、及びこの方法を用いて位置ずれ量を測定する画像記録装置に関する。
The present invention relates to a positional deviation amount measuring method for measuring a positional deviation amount of a recording position of a plurality of head modules of a recording head, and an image recording apparatus for measuring the positional deviation amount using this method.
インクジェットプリンタ(画像記録装置)の記録方式として、記録媒体の搬送と共にラインヘッドによる1回の描画パスで画像を記録するライン方式が知られている。このライン方式では、記録媒体の搬送方向(副走査方向)と直交する記録媒体の幅方向(主走査方向)に沿って長尺のラインヘッド(記録ヘッド)が用いられる。このラインヘッドをシリコンウェハやガラス等で一体に形成することは、歩留まり、発熱、コスト等の問題により現実的ではない。そのため、ライン方式では、ノズルが2次元配列されたヘッドモジュールを記録媒体の幅方向に並べて配置してなるラインヘッドを用いるのが通常である。
As a recording method of an ink jet printer (image recording apparatus), a line method is known in which an image is recorded in one drawing pass by a line head as the recording medium is conveyed. In this line system, a long line head (recording head) is used along the width direction (main scanning direction) of the recording medium orthogonal to the conveyance direction (sub-scanning direction) of the recording medium. It is not practical to integrally form this line head with a silicon wafer, glass or the like due to problems such as yield, heat generation, and cost. Therefore, in the line method, it is usual to use a line head in which head modules in which nozzles are two-dimensionally arranged are arranged in the width direction of the recording medium.
このようなラインヘッドを用いて画像記録を行う際に、個々のヘッドモジュールの位置が副走査方向にずれていると、個々のヘッドモジュールの記録位置が副走査方向に位置ずれするので、記録画像の品質が低下するという問題が発生する。このため、各ヘッドモジュールの記録位置の副走査方向の位置ずれ量を検出するための様々な方法が提案されている。
When performing image recording using such a line head, if the position of each head module is displaced in the sub-scanning direction, the recording position of each head module is displaced in the sub-scanning direction. The problem is that the quality of the product deteriorates. For this reason, various methods have been proposed for detecting the amount of positional deviation in the sub-scanning direction of the recording position of each head module.
特許文献1に記載の位置ずれ量の測定方法では、最初に、互いに隣接するヘッドモジュールの一方により、記録媒体の幅方向に長く延びたラインパターンを、基準ラインを中心として副走査方向にn画素間隔で記録させることで第1のライン群を形成する。また、同時に他方のヘッドモジュールにより、ラインパターンを、基準ラインを中心として副走査方向にn+1画素間隔で記録させることで第2のライン群を形成する。次いで、第1のライン群と第2のライン群とを比較して、搬送方向における位置が一致する第1ライン群の第1ラインパターンと、第2ライン群の第2ラインパターンをそれぞれ同定する。そして、第1及び第2ラインパターンの基準パターンからの位置ずれ量(基準パターンからk本目の位置)に基づき、位置ずれ量を[k×((n+1)-n)]画素と算出する。これにより、互いに隣接するヘッドモジュールの記録位置の副走査方向の位置ずれ量を画素単位で測定することができる。
In the method for measuring the amount of misalignment described in Patent Document 1, first, a line pattern extending in the width direction of the recording medium by one of the adjacent head modules is set to n pixels in the sub-scanning direction around the reference line. The first line group is formed by recording at intervals. At the same time, the second head module forms the second line group by recording the line pattern at intervals of n + 1 pixels in the sub-scanning direction with the reference line as the center. Next, the first line group and the second line group are compared, and the first line pattern of the first line group and the second line pattern of the second line group, which have the same position in the transport direction, are respectively identified. . Then, based on the positional deviation amount from the reference pattern of the first and second line patterns (the k-th position from the reference pattern), the positional deviation amount is calculated as [k × ((n + 1) −n)] pixels. Thereby, the amount of positional deviation in the sub-scanning direction of the recording positions of the head modules adjacent to each other can be measured in units of pixels.
上記特許文献1の位置ずれ量の測定方法を用いれば、ヘッドモジュール間の記録位置の位置ずれ量を画素単位で測定することができるので、位置ずれ量の補正を画素単位で行うことができる。しかしながら、ヘッドモジュール間の記録位置の位置ずれ量は約±5μ以内に収めないと記録画像の画質が低下することが発明者の実験により判明している。このため、例えば記録解像度を1200dpiとした場合には、ヘッドモジュール間の記録位置の位置ずれ量を1/4画素程度の精度で測定する必要がある。
If the method for measuring the amount of misalignment disclosed in Patent Document 1 is used, the amount of misregistration of the recording position between the head modules can be measured in units of pixels, so that the amount of misalignment can be corrected in units of pixels. However, it has been proved by the inventors' experiment that the image quality of the recorded image is degraded unless the positional deviation amount of the recording position between the head modules is within about ± 5 μm. For this reason, for example, when the recording resolution is 1200 dpi, it is necessary to measure the positional deviation amount of the recording position between the head modules with an accuracy of about 1/4 pixel.
また、位置ずれ量の測定の際には、各ヘッドモジュールにより記録されたテストチャート等をイメージスキャナのイメージセンサで読み取った読取画像の解析を行うが、位置ずれ量を1/4画素程度で測定するためには高解像度のイメージセンサが必要となる。その結果、位置ずれ量を測定する装置の製造コストが増加してしまう。
Also, when measuring the amount of misalignment, the test chart recorded by each head module is analyzed by the read image read by the image sensor of the image scanner, but the misalignment amount is measured with about 1/4 pixel. In order to do so, a high-resolution image sensor is required. As a result, the manufacturing cost of the apparatus for measuring the amount of displacement increases.
本発明の目的は、ヘッドモジュール間の記録位置の位置ずれ量を高精度に測定可能な位置ずれ量測定方法、及びこの方法を用いて位置ずれ量を測定する画像記録装置に関する。
An object of the present invention relates to a positional deviation amount measuring method capable of measuring a positional deviation amount of a recording position between head modules with high accuracy, and an image recording apparatus for measuring the positional deviation amount using this method.
本発明の目的を達成するための位置ずれ量測定方法は、複数の記録素子を有するヘッドモジュールを第1の方向に複数配列してなる記録ヘッドと、記録媒体とを第1の方向と直交する第2の方向に相対移動させながら、複数のヘッドモジュールのうちの第1のヘッドモジュール及び第2のヘッドモジュールの各々により、第1の方向に延びた形状のドットパターンを第2の方向に予め定めた間隔で記録媒体上に記録させる記録ステップと、記録ステップで記録媒体上に記録されたドットパターンを光学的に読み取る読取ステップと、読取ステップで読み取られたドットパターンの読取画像の第2の方向の濃度変化を示す濃度プロファイルを算出する濃度プロファイル算出ステップと、濃度プロファイル算出ステップの算出結果に基づき、濃度プロファイル内での各ドットパターンに対応する波形の繰り返し周期を算出する繰り返し周期算出ステップと、繰り返し周期算出ステップの算出結果に基づき、濃度プロファイルのデータを、繰り返し周期毎に積算して積算濃度プロファイルを算出する積算濃度プロファイル算出ステップと、積算濃度プロファイル算出ステップの算出結果に基づき、積算濃度プロファイルにおける各ドットパターンにそれぞれ対応する波形のピーク位置を求め、各ピーク位置に基づいて第1のヘッドモジュールの記録位置と第2のヘッドモジュールの記録位置との第2の方向の位置ずれ量を算出する位置ずれ量算出ステップと、を有する。
A positional deviation amount measuring method for achieving the object of the present invention includes a recording head formed by arranging a plurality of head modules having a plurality of recording elements in a first direction, and a recording medium orthogonal to the first direction. While relatively moving in the second direction, each of the first head module and the second head module of the plurality of head modules causes a dot pattern having a shape extending in the first direction to advance in the second direction. A recording step of recording on the recording medium at a predetermined interval, a reading step of optically reading the dot pattern recorded on the recording medium in the recording step, and a second image of the read image of the dot pattern read in the reading step A density profile calculation step for calculating a density profile indicating a change in density in the direction, and a calculation result of the density profile calculation step. Based on the calculation result of the repetition cycle calculation step and the repetition cycle calculation step that calculates the repetition cycle of the waveform corresponding to each dot pattern in the profile, the density profile data is integrated for each repetition cycle to obtain the integrated density profile. Based on the calculated integrated density profile calculating step and the calculation result of the integrated density profile calculating step, the peak position of the waveform corresponding to each dot pattern in the integrated density profile is obtained, and the first head module of the first head module is calculated based on each peak position. A positional deviation amount calculating step for calculating a positional deviation amount in the second direction between the recording position and the recording position of the second head module.
本発明によれば、ヘッドモジュールごとに第2の方向に予め定められた間隔でそれぞれ記録媒体に記録されたドットパターンの読取画像に基づきヘッドモジュール間の記録位置の第2の方向の位置ずれ量を算出するので、高解像度のイメージセンサを用いることなく、ヘッドモジュール間の記録位置の第2の方向の位置ずれ量を高精度に測定することができる。
According to the present invention, the positional deviation amount in the second direction of the recording position between the head modules based on the read image of the dot pattern recorded on the recording medium at a predetermined interval in the second direction for each head module. Therefore, the amount of positional deviation in the second direction of the recording position between the head modules can be measured with high accuracy without using a high-resolution image sensor.
濃度プロファイル算出ステップは、濃度プロファイルとして、第1のヘッドモジュールにより記録される第1のドットパターンに対応する第1の濃度プロファイルと、第2のヘッドモジュールにより記録される第2のドットパターンに対応する第2の濃度プロファイルとをそれぞれ算出し、繰り返し周期算出ステップは、第1及び第2の濃度プロファイルに基づき、繰り返し周期として、第1のドットパターンに対応する波形の第1の繰り返し周期と、第2のドットパターンに対応する波形の繰り返し周期を示す第2の繰り返し周期とをそれぞれ算出し、積算濃度プロファイル算出ステップは、積算濃度プロファイルとして、第1の濃度プロファイルのデータを第1の繰り返し周期毎に積算してなる第1の積算濃度プロファイルと、第2の濃度プロファイルのデータを第2の繰り返し周期毎に積算してなる第2の積算濃度プロファイルとをそれぞれ算出し、位置ずれ量算出ステップは、第1の積算濃度プロファイルにおける第1のドットパターンに対応する波形の第1のピーク位置と、第2の積算濃度プロファイルにおける第2のドットパターンに対応する波形の第2のピーク位置とをそれぞれ求め、第1のピーク位置と第2のピーク位置との差分に基づき位置ずれ量を算出することが好ましい。これにより、ヘッドモジュール間の記録位置の第2の方向の位置ずれ量を高精度に測定することができる。
The density profile calculating step corresponds to the first density profile corresponding to the first dot pattern recorded by the first head module and the second dot pattern recorded by the second head module as the density profile. Each of the second density profiles to be calculated, and the repetition period calculating step includes a first repetition period of a waveform corresponding to the first dot pattern as a repetition period based on the first and second density profiles; A second repetition period indicating a repetition period of a waveform corresponding to the second dot pattern is calculated, and the integrated density profile calculation step uses the first density profile data as the integrated density profile for the first repetition period. A first integrated concentration profile that is integrated every time, and a second integrated concentration profile A second integrated density profile obtained by integrating the degree profile data every second repetition period is calculated, and the positional deviation amount calculating step corresponds to the first dot pattern in the first integrated density profile. A first peak position of the waveform and a second peak position of the waveform corresponding to the second dot pattern in the second integrated density profile are respectively obtained, and a difference between the first peak position and the second peak position is obtained. It is preferable to calculate the amount of displacement based on the above. As a result, the positional deviation amount in the second direction of the recording position between the head modules can be measured with high accuracy.
第1のヘッドモジュールと第2のヘッドモジュールとが第1の方向において互いに隣接していることが好ましい。これにより、記録ヘッドの傾き(記録媒体面に垂直な方向を軸とする記録ヘッドの回転変位)、記録媒体の搬送速度の誤差、記録媒体の変形、ドットパターンの読取画像の読み取りの誤差、等の影響を受け難くなるので、位置ずれ量をより高精度に測定することができる。
It is preferable that the first head module and the second head module are adjacent to each other in the first direction. As a result, the inclination of the recording head (rotational displacement of the recording head about the direction perpendicular to the recording medium surface), the error in the conveyance speed of the recording medium, the deformation of the recording medium, the error in reading the read image of the dot pattern, etc. Therefore, the positional deviation amount can be measured with higher accuracy.
第1及び第2のヘッドモジュールの各々の記録媒体上の記録領域の一部が互いにオーバラップしているオーバラップ記録領域である場合に、記録ステップは、オーバラップ領域以外の記録領域に記録を行う第1及び第2のヘッドモジュールの各々の記録素子によりそれぞれ第1のドットパターン、第2のドットパターンを記録することが好ましい。これにより、第1の方向に隣接する各ヘッドモジュールの記録領域がオーバラップしている場合でも、ヘッドモジュール間の記録位置の第2の方向の位置ずれ量を高精度に測定することができる。
When the recording areas on the recording medium of each of the first and second head modules are overlapping recording areas, the recording step records in a recording area other than the overlapping area. It is preferable to record the first dot pattern and the second dot pattern respectively by the recording elements of the first and second head modules to be performed. As a result, even when the recording areas of the head modules adjacent in the first direction overlap, it is possible to measure the positional deviation amount of the recording position between the head modules in the second direction with high accuracy.
第1及び第2のヘッドモジュールの各々の記録媒体上の記録領域の一部が互いにオーバラップしているオーバラップ記録領域である場合に、記録ステップは、ドットパターンとして、オーバラップ記録領域内に記録を行う第1及び第2のヘッドモジュールの記録素子により第1のドットパターンと第2のドットパターンとを第2の方向に個別に予め定めた間隔でかつ交互に記録し、濃度プロファイル算出ステップは、濃度プロファイルとして、第1のドットパターン及び第2のドットパターンに対応する第3の濃度プロファイルを算出し、繰り返し周期算出ステップは、第3の濃度プロファイル内での第1及び第2のドットパターンに対応する波形の繰り返し周期を示す第3の繰り返し周期を算出し、積算濃度プロファイル算出ステップは、積算濃度プロファイルとして、第3の濃度プロファイルのデータを第3の繰り返し周期毎に積算してなる第3の積算濃度プロファイルを算出し、位置ずれ量算出ステップは、第3の積算濃度プロファイルにおける第1のドットパターンに対応する波形の第1のピーク位置と、第2のドットパターンに対応する波形の第2のピーク位置とをそれぞれ求め、第1のピーク位置と第2のピーク位置との差分に基づき位置ずれ量を算出する。これにより、第1の方向に隣接する各ヘッドモジュールの記録領域がオーバラップしている場合でも、ヘッドモジュール間の記録位置の第2の方向の位置ずれ量を高精度に測定することができる。さらに、位置ずれ量の算出に要する時間を短縮することができる。
In the case where the recording area on each recording medium of each of the first and second head modules is an overlapping recording area, the recording step is performed as a dot pattern in the overlapping recording area. A density profile calculating step of recording the first dot pattern and the second dot pattern alternately at predetermined intervals in the second direction by the recording elements of the first and second head modules that perform recording. Calculates a third density profile corresponding to the first dot pattern and the second dot pattern as the density profile, and the repetition cycle calculation step includes the first and second dots in the third density profile. A third repetition period indicating the repetition period of the waveform corresponding to the pattern is calculated. As the integrated density profile, a third integrated density profile obtained by integrating the data of the third density profile at every third repetition period is calculated, and the positional deviation amount calculating step includes the first integrated density profile. The first peak position of the waveform corresponding to the dot pattern and the second peak position of the waveform corresponding to the second dot pattern are respectively obtained, and the difference between the first peak position and the second peak position is obtained. Based on this, the amount of displacement is calculated. As a result, even when the recording areas of the head modules adjacent in the first direction overlap, it is possible to measure the positional deviation amount of the recording position between the head modules in the second direction with high accuracy. Furthermore, it is possible to reduce the time required for calculating the amount of positional deviation.
繰り返し周期算出ステップは、濃度プロファイルのデータを、仮の繰り返し周期毎に積算して仮の積算濃度プロファイルを算出する仮積算濃度プロファイル算出ステップと、仮の繰り返し周期を変化さながら、仮積算濃度プロファイル算出ステップを繰り返し実行して、仮の繰り返し周期ごとの仮の積算濃度プロファイルを算出する繰り返しステップと、仮の繰り返し周期ごとの仮の積算濃度プロファイルの最大値を比較して、最大値が最大となる仮の繰り返し周期を繰り返し周期として決定する決定ステップと、を有する。これにより、繰り返し周期をより正確に算出することができる。
The repetition cycle calculation step is a temporary integration concentration profile calculation step for calculating the provisional integrated concentration profile by integrating the concentration profile data for each provisional repetition cycle, and the provisional integration concentration profile calculation while changing the provisional repetition cycle. The maximum value is maximized by comparing the repetitive step of repeatedly executing the step to calculate the provisional integrated concentration profile for each provisional repetition period and the maximum value of the provisional integrated concentration profile for each provisional repetition period. And a determination step for determining a provisional repetition period as a repetition period. Thereby, the repetition period can be calculated more accurately.
濃度プロファイル算出ステップが算出する濃度プロファイルに対して補完処理を施して、濃度プロファイルの第2の方向の解像度を高くする補完処理ステップ、をさらに有し、繰り返し周期算出ステップは、補完処理を施された濃度プロファイルに基づいて繰り返し周期を算出することが好ましい。これにより、より高精度に位置ずれ量を算出することができる。
The density profile calculating step further includes a complementing process step that performs a complementing process on the density profile calculated to increase the resolution in the second direction of the density profile, and the repetition period calculating step is subjected to the complementing process. It is preferable to calculate the repetition period based on the concentration profile. Thereby, it is possible to calculate the positional deviation amount with higher accuracy.
第1の方向は、記録媒体の幅方向であることが好ましい。
The first direction is preferably the width direction of the recording medium.
記録ヘッドは、インクジェットヘッドであることが好ましい。
The recording head is preferably an inkjet head.
本発明の目的を達成するための画像記録装置は、複数の記録素子を有するヘッドモジュールを第1の方向に複数配列してなる記録ヘッドと、記録ヘッドと記録媒体とを第1の方向と直交する第2の方向に相対移動させる相対移動部と、記録ヘッドと相対移動部とを制御して、複数のヘッドモジュールのうちの第1のヘッドモジュール及び第2のヘッドモジュールの各々により、第1の方向に延びた形状のドットパターンを第2の方向に予め定めた間隔で記録媒体上に記録させる記録制御部と、第1のヘッドモジュール及び第2のヘッドモジュールによりそれぞれ記録媒体上に記録されたドットパターンを光学的に読み取る読取部と、読取部で読み取られたドットパターンの読取画像の第2の方向の濃度変化を示す濃度プロファイルを算出する濃度プロファイル算出部と、濃度プロファイル算出部の算出結果に基づき、濃度プロファイル内での各ドットパターンに対応する波形の繰り返し周期を算出する繰り返し周期算出部と、繰り返し周期算出部の算出結果に基づき、濃度プロファイルのデータを、繰り返し周期毎に積算して積算濃度プロファイルを算出する積算濃度プロファイル算出部と、積算濃度プロファイル算出部の算出結果に基づき、積算濃度プロファイルにおける各ドットパターンにそれぞれ対応する波形のピーク位置を求め、各ピーク位置に基づいて第1のヘッドモジュールの記録位置と第2のヘッドモジュールの記録位置との第2の方向の位置ずれ量を算出する位置ずれ量算出部と、を備える。
An image recording apparatus for achieving an object of the present invention includes a recording head in which a plurality of head modules each having a plurality of recording elements are arranged in a first direction, and the recording head and the recording medium orthogonal to the first direction. The relative movement unit that relatively moves in the second direction, the recording head, and the relative movement unit are controlled, and each of the first head module and the second head module among the plurality of head modules controls the first. Recorded on the recording medium by a recording control unit for recording a dot pattern having a shape extending in the direction of 2 on the recording medium at a predetermined interval in the second direction, and the first head module and the second head module, respectively. A reading unit for optically reading the dot pattern, and a density profile indicating a density change in the second direction of the read image of the dot pattern read by the reading unit. Based on the calculation result of the density profile calculation unit and the density profile calculation unit, based on the calculation result of the repetition cycle calculation unit that calculates the repetition cycle of the waveform corresponding to each dot pattern in the density profile, and the calculation result of the repetition cycle calculation unit, Based on the calculation result of the integrated density profile calculation unit and the integrated density profile calculation unit that integrates the density profile data every repetition cycle to calculate the integrated density profile, the waveform corresponding to each dot pattern in the integrated density profile A positional deviation amount calculation unit that obtains a peak position and calculates a positional deviation amount in the second direction between the recording position of the first head module and the recording position of the second head module based on each peak position. .
本発明の位置ずれ量測定方法及び画像記録装置は、ヘッドモジュール間の記録位置の位置ずれ量を高精度に測定することができる。
The positional deviation amount measuring method and the image recording apparatus of the present invention can measure the positional deviation amount of the recording position between the head modules with high accuracy.
[第1実施形態のインクジェットプリンタ]
<インクジェットプリンタの構成>
図1に示すように、本発明の画像記録装置に相当するインクジェットプリンタ(以下、単にプリンタという)10は、外部のホストコンピュータ11に接続されている。このプリンタ10は、搬送機構(相対移動部)12により搬送される記録紙(記録媒体、図2参照)13に対して、ホストコンピュータ11から入力された画像データに基づき記録ヘッド14から記録紙13上にインク滴を打滴して画像を記録する。なお、図1では、主に画像データの処理に関連する部分のみを示している。 [Inkjet Printer of First Embodiment]
<Inkjet printer configuration>
As shown in FIG. 1, an ink jet printer (hereinafter simply referred to as a printer) 10 corresponding to the image recording apparatus of the present invention is connected to anexternal host computer 11. This printer 10 has a recording paper 13 from a recording head 14 to a recording paper (recording medium, see FIG. 2) 13 conveyed by a conveying mechanism (relative movement unit) 12 based on image data input from the host computer 11. An image is recorded by ejecting ink droplets on the top. Note that FIG. 1 shows only a part mainly related to image data processing.
<インクジェットプリンタの構成>
図1に示すように、本発明の画像記録装置に相当するインクジェットプリンタ(以下、単にプリンタという)10は、外部のホストコンピュータ11に接続されている。このプリンタ10は、搬送機構(相対移動部)12により搬送される記録紙(記録媒体、図2参照)13に対して、ホストコンピュータ11から入力された画像データに基づき記録ヘッド14から記録紙13上にインク滴を打滴して画像を記録する。なお、図1では、主に画像データの処理に関連する部分のみを示している。 [Inkjet Printer of First Embodiment]
<Inkjet printer configuration>
As shown in FIG. 1, an ink jet printer (hereinafter simply referred to as a printer) 10 corresponding to the image recording apparatus of the present invention is connected to an
プリンタ10は、前述の搬送機構12及び記録ヘッド14の他に、イメージスキャナ(読取部)16、ホストインターフェース(I/F)部17、画像ページメモリ18、画像バッファメモリ書込制御部19、画像バッファメモリ20、後処理演算部21、転送制御部22、ヘッドドライバ23、及びCPU24などを備えている。ホストI/F部17、画像ページメモリ18、画像バッファメモリ書込制御部19、及びCPU24は、バス25を介して接続されている。
The printer 10 includes an image scanner (reading unit) 16, a host interface (I / F) unit 17, an image page memory 18, an image buffer memory write control unit 19, an image, in addition to the transport mechanism 12 and the recording head 14 described above. A buffer memory 20, a post-processing operation unit 21, a transfer control unit 22, a head driver 23, a CPU 24, and the like are provided. The host I / F unit 17, the image page memory 18, the image buffer memory write control unit 19, and the CPU 24 are connected via a bus 25.
図2に示すように、搬送機構12は、記録ヘッド14に対して、記録紙13をその幅方向に垂直な副走査方向(第2の方向)に相対移動させて記録ヘッド14の下方を通過させる。記録ヘッド14は、その下面(ノズル面)に配列された各ノズル27からインクを吐出し、相対移動中の記録紙13上に画像を形成する。なお、図2は、記録ヘッド14の上面図であり、下面に配列されたノズル27を透過させて図示したものである。また、図面の煩雑化を防止するためにノズル27の配置も簡略化している。
As shown in FIG. 2, the transport mechanism 12 moves the recording paper 13 relative to the recording head 14 in the sub-scanning direction (second direction) perpendicular to the width direction and passes under the recording head 14. Let The recording head 14 ejects ink from the nozzles 27 arranged on the lower surface (nozzle surface) thereof, and forms an image on the recording paper 13 that is moving relatively. FIG. 2 is a top view of the recording head 14 and illustrates the recording head 14 through the nozzles 27 arranged on the bottom surface. In addition, the arrangement of the nozzles 27 is simplified in order to prevent the drawing from becoming complicated.
記録ヘッド14は、記録紙13の幅方向に対して平行な主走査方向(第1の方向)に長く延びて形成されており、記録紙13の幅に対応した長さを有するラインヘッドである。なお、記録ヘッド14は記録する色(CMYK)毎に設けられている。
The recording head 14 is a line head that extends in the main scanning direction (first direction) parallel to the width direction of the recording paper 13 and has a length corresponding to the width of the recording paper 13. . The recording head 14 is provided for each recording color (CMYK).
記録ヘッド14は、第1ヘッドモジュール28A、第2ヘッドモジュール28B、及び第3ヘッドモジュール28Cの3個(2個、あるいは4個以上でも可)の交換可能なヘッドモジュールと、各ヘッドモジュール28A~28Cを保持する枠体29とを備える。各ヘッドモジュール28A~28Cは、主走査方向に沿って千鳥状に配列されている。各ヘッドモジュール28A~28Cの中の互いに隣接する(隣り合う)2つのヘッドモジュールの端部はそれぞれオーバラップしている。
The recording head 14 includes three replaceable head modules (two, or four or more) of the first head module 28A, the second head module 28B, and the third head module 28C, and the head modules 28A to 28A. And a frame 29 for holding 28C. The head modules 28A to 28C are arranged in a staggered pattern along the main scanning direction. The end portions of two head modules adjacent to each other (adjacent) in each of the head modules 28A to 28C overlap each other.
各ヘッドモジュール28A~28Cの各ノズル27は、主走査方向について実質的に一定のピッチで直線状に配列されたものと等価的に取り扱うことができるように配置されている。従って、第1ヘッドモジュール28Aの最も図2中右端側のノズル27で打滴したインク滴の主走査方向(ここでは図2中の右方向)に隣接するインク滴は、第2ヘッドモジュール28Bの最も図2中左端側のノズル27で打滴することができる。また、第2ヘッドモジュール28Bの最も図2中右端側のノズル27で打滴したインク滴の主走査方向(ここでは図2中の右方向)に隣接するインク滴は、第3ヘッドモジュール28Cの最も図2中左端側のノズル27で打滴することができる。
The nozzles 27 of the head modules 28A to 28C are arranged so that they can be handled equivalently to those arranged in a straight line at a substantially constant pitch in the main scanning direction. Therefore, the ink droplets adjacent to the main scanning direction (here, the right direction in FIG. 2) of the ink droplets ejected by the nozzle 27 on the rightmost side in FIG. 2 of the first head module 28A are the same as those in the second head module 28B. Drops can be ejected by the nozzle 27 on the left end side in FIG. Further, the ink droplets adjacent to the main scanning direction (here, the right direction in FIG. 2) of the ink droplets ejected by the nozzle 27 on the rightmost side in FIG. 2 of the second head module 28B are the same as those in the third head module 28C. Drops can be ejected by the nozzle 27 on the left end side in FIG.
イメージスキャナ16は、記録ヘッド14の記録紙搬送方向下流側の位置で、かつ記録紙13の記録面と対向する位置に配置されている。このイメージスキャナ16は、主走査方向に長く延びて形成されており、記録紙13の幅に対応した長さを有している。イメージスキャナ16は、記録ヘッド14により記録紙13の記録面上に記録されたテストチャート31(図5参照)を光学的に読み取り、本発明の読取画像に相当するテストチャート読取画像データ32(以下、単に読取画像データと略す、図1参照)をCPU24へ出力する。このイメージスキャナ16としては、副走査方向の解像度が例えば100dpi程度のものが用いられる。すなわち、本実施形態では、高解像度のイメージスキャナを用いずにテストチャート31の読み取りを行う。
The image scanner 16 is disposed at a position downstream of the recording head 14 in the recording sheet conveyance direction and at a position facing the recording surface of the recording sheet 13. The image scanner 16 extends in the main scanning direction and has a length corresponding to the width of the recording paper 13. The image scanner 16 optically reads a test chart 31 (see FIG. 5) recorded on the recording surface of the recording paper 13 by the recording head 14, and reads test chart read image data 32 (hereinafter referred to as a read image of the present invention). , Simply referred to as read image data, see FIG. As the image scanner 16, a scanner having a resolution in the sub-scanning direction of about 100 dpi is used. That is, in this embodiment, the test chart 31 is read without using a high-resolution image scanner.
図1に戻って、ホストI/F部17は、ホストコンピュータ11から送られてくる画像データを受信する通信インターフェースであり、各種のシリアルインターフェースやパラレルインターフェースを用いることができる。ホストI/F部17は、受信した画像データを画像ページメモリ18へ送る。
Referring back to FIG. 1, the host I / F unit 17 is a communication interface that receives image data sent from the host computer 11, and various serial interfaces and parallel interfaces can be used. The host I / F unit 17 sends the received image data to the image page memory 18.
画像ページメモリ18は、ホストI/F部17から入力される画像データを格納するものであり、1ページ分の印字データを記憶し得る記憶容量を有するDRAMなどが用いられる。
The image page memory 18 stores image data input from the host I / F unit 17, and a DRAM having a storage capacity capable of storing print data for one page is used.
画像バッファメモリ書込制御部19は、画像ページメモリ18から1ライン分の印字データを1ラインずつ読み出して、画像バッファメモリ20へ転送する。1ライン分の印字データは、画像バッファメモリ20に転送されて、画像バッファメモリ20上において連続するアドレスで格納される。画像バッファメモリ20には、複数ライン分の印字データが蓄積される。
The image buffer memory writing control unit 19 reads out the print data for one line from the image page memory 18 line by line and transfers it to the image buffer memory 20. The print data for one line is transferred to the image buffer memory 20 and stored at successive addresses on the image buffer memory 20. The image buffer memory 20 stores print data for a plurality of lines.
後処理演算部21は、画像バッファメモリ20上で、例えば、異常ノズルに対するマスク処理(打滴禁止処理)や、シェーディング補正処理(ノズルごとに打滴率を加減する処理)などの後処理(修正処理)を行う。後処理済みのデータは画像バッファメモリ20に書き戻される。
The post-processing computing unit 21 performs post-processing (correction) on the image buffer memory 20, such as mask processing (droplet ejection prohibiting processing) for abnormal nozzles, shading correction processing (processing for adjusting the droplet ejection rate for each nozzle), and the like. Process). The post-processed data is written back to the image buffer memory 20.
転送制御部22は、画像バッファメモリ20から1回の打滴分(各ヘッドモジュール28A~28Cの全ノズル分)の印字データを読み出し、この印字データをヘッドドライバ23に転送する。転送制御部22は、1回の打滴分の印字データをヘッドモジュール28A~28C毎に分割してヘッドドライバ23に送信するための分割処理や、転送フォーマット調整を行う。
The transfer control unit 22 reads the print data for one droplet ejection (for all the nozzles of each head module 28A to 28C) from the image buffer memory 20, and transfers this print data to the head driver 23. The transfer control unit 22 performs division processing for dividing print data for one droplet ejection for each of the head modules 28A to 28C and transmitting the print data to the head driver 23, and transfer format adjustment.
ヘッドドライバ23は、各ヘッドモジュール28A~28Cの駆動を個別に制御する3個のドライバ(図示は省略)で構成されている。ヘッドドライバ23は、転送制御部22から入力されるヘッドモジュール28A~28C毎の印字データに基づき、ヘッドモジュール28A~28Cの各ノズル27に対応するアクチュエータ(図示は省略)の駆動を制御して、各ノズル27からインク滴を吐出させる。記録紙13の搬送速度に同期して各ヘッドモジュール28A~28Cからのインク吐出を制御することにより、記録紙13の記録面上に画像が形成される。
The head driver 23 includes three drivers (not shown) that individually control the driving of the head modules 28A to 28C. The head driver 23 controls the driving of actuators (not shown) corresponding to the nozzles 27 of the head modules 28A to 28C based on the print data for the head modules 28A to 28C input from the transfer control unit 22, Ink droplets are ejected from each nozzle 27. An image is formed on the recording surface of the recording paper 13 by controlling ink ejection from each of the head modules 28A to 28C in synchronization with the conveyance speed of the recording paper 13.
CPU24は、図示しない操作部からの入力信号に基づき、メモリ34から読み出した各種プログラムやデータを逐次実行することで、プリンタ10の各部を統括的に制御する。メモリ34のROM領域には、上述の各種プログラム等の他に、テストチャート31の画像データであるテストチャートデータ35(図4参照)が格納されている。メモリ34のRAM領域は、CPU24が実行するプログラムの展開領域及びCPU24の演算作業領域としても利用される。
The CPU 24 performs overall control of each unit of the printer 10 by sequentially executing various programs and data read from the memory 34 based on an input signal from an operation unit (not shown). In the ROM area of the memory 34, test chart data 35 (see FIG. 4) which is image data of the test chart 31 is stored in addition to the above-described various programs. The RAM area of the memory 34 is also used as a development area for programs executed by the CPU 24 and an arithmetic work area for the CPU 24.
また、CPU24は、イメージスキャナ16から入力される読取画像データ32を解析して、各ヘッドモジュール28A~28Cのうちの任意の2つのヘッドモジュール間の記録位置の副走査方向の位置ずれ量ΔYを算出する(図13参照)。さらに、CPU24は、位置ずれ量ΔYの検出結果に基づき、ヘッドモジュール間の記録位置を補正する位置ずれ補正処理を実行する。以下、「副走査方向の位置ずれ」を単に「位置ずれ」という。
Further, the CPU 24 analyzes the read image data 32 input from the image scanner 16, and calculates a positional deviation amount ΔY in the sub-scanning direction of the recording position between any two head modules of the head modules 28A to 28C. Calculate (see FIG. 13). Further, the CPU 24 executes a positional deviation correction process for correcting the recording position between the head modules based on the detection result of the positional deviation amount ΔY. Hereinafter, the “positional deviation in the sub-scanning direction” is simply referred to as “positional deviation”.
図3に示すように、ヘッドモジュール間の記録位置の位置ずれは、例えば、各ヘッドモジュール28A~28Cの実際の位置ずれに起因して発生する。また、記録位置の位置ずれは、図示は省略するが、各ヘッドモジュール28A~28Cのノズル27から吐出されるインク滴36の飛翔曲がりによっても発生する。
As shown in FIG. 3, the displacement of the recording position between the head modules occurs due to the actual displacement of the head modules 28A to 28C, for example. Further, although not shown in the figure, the recording position is also displaced by the flying bend of the ink droplets 36 ejected from the nozzles 27 of the head modules 28A to 28C.
<位置ずれ量の測定に係る構成>
図4に示すように、CPU24は、メモリ34から位置ずれ量ΔYの測定や位置ずれ補正に係るプログラムを読み出して実行することで、テストチャート記録制御部(記録制御部)38、濃度プロファイルデータ算出部39、補完処理部40、繰り返し周期算出部41、積算濃度プロファイル算出部42、基準位置ずれ量算出部43、位置ずれ量算出部44、位置ずれ補正処理部45として機能する。 <Configuration for measuring the amount of misalignment>
As shown in FIG. 4, theCPU 24 reads out and executes a program relating to the measurement of the positional deviation amount ΔY and the positional deviation correction from the memory 34, thereby executing a test chart recording control unit (recording control unit) 38 and density profile data calculation. Functions as a unit 39, a complement processing unit 40, a repetition period calculation unit 41, an integrated density profile calculation unit 42, a reference positional deviation amount calculation unit 43, a positional deviation amount calculation unit 44, and a positional deviation correction processing unit 45.
図4に示すように、CPU24は、メモリ34から位置ずれ量ΔYの測定や位置ずれ補正に係るプログラムを読み出して実行することで、テストチャート記録制御部(記録制御部)38、濃度プロファイルデータ算出部39、補完処理部40、繰り返し周期算出部41、積算濃度プロファイル算出部42、基準位置ずれ量算出部43、位置ずれ量算出部44、位置ずれ補正処理部45として機能する。 <Configuration for measuring the amount of misalignment>
As shown in FIG. 4, the
テストチャート記録制御部38は、プリンタ10の電源ON時、各ヘッドモジュール28A~28Cのいずれかの交換時、位置ずれ量ΔYの測定操作がなされた時、所定枚数記録時、所定時間経過時等の所定のタイミングでテストチャート31の記録を実行させる。
The test chart recording control unit 38 is used when the printer 10 is turned on, when any of the head modules 28A to 28C is replaced, when a misregistration amount ΔY is measured, when a predetermined number of sheets are recorded, when a predetermined time elapses, etc. The test chart 31 is recorded at a predetermined timing.
テストチャート記録制御部38は、前述の所定のタイミングで、メモリ34から読み出したテストチャートデータ35を画像ページメモリ18に出力するとともに、画像バッファメモリ書込制御部19、転送制御部22、及びヘッドドライバ23を作動させる。これにより、画像バッファメモリ書込制御部19、画像バッファメモリ20、後処理演算部21、及び転送制御部22を経て、テストチャートデータ35に基づく1回の打滴分の印字データが逐次にヘッドドライバ23へ転送される。ヘッドドライバ23は、印字データに基づき、各ヘッドモジュール28A~28Cの各ノズル27のインク吐出を制御する。搬送機構12により記録紙13を搬送しつつ、各ヘッドモジュール28A~28Cによりインク滴36を打滴することで、記録紙13の記録面上にテストチャート31が記録される。この時、記録面上に記録されたテストチャート31が、テストチャートデータ35と略同形状となるよう、各ヘッドモジュール28A~28Cのインク吐出タイミングを予め定めた値に設定してテストチャート31を記録することが望ましい。
The test chart recording control unit 38 outputs the test chart data 35 read from the memory 34 to the image page memory 18 at the predetermined timing described above, and the image buffer memory write control unit 19, the transfer control unit 22, and the head. The driver 23 is operated. As a result, print data corresponding to one droplet ejection based on the test chart data 35 is sequentially transferred to the head through the image buffer memory write control unit 19, the image buffer memory 20, the post-processing calculation unit 21, and the transfer control unit 22. It is transferred to the driver 23. The head driver 23 controls ink ejection from the nozzles 27 of the head modules 28A to 28C based on the print data. A test chart 31 is recorded on the recording surface of the recording paper 13 by ejecting ink droplets 36 by the head modules 28A to 28C while transporting the recording paper 13 by the transport mechanism 12. At this time, the ink discharge timings of the head modules 28A to 28C are set to predetermined values so that the test chart 31 recorded on the recording surface has substantially the same shape as the test chart data 35. It is desirable to record.
図5に示すように、テストチャート31は、各ヘッドモジュール28A~28Cの各々により記録された第1ドットパターン群48A、第2ドットパターン群48B、及び第3ドットパターン群(図示は省略)を含む。第1ドットパターン群48Aは、主走査方向に長く延びた形状(例えば5pixl×64pixl)の第1ドットパターン50Aを、副走査方向に予め定めたパターン間隔W1(繰り返し周期)で例えば150個記録したものである。なお、ここでいう「パターン間隔W1」とは、副走査方向に隣り合うドットパターンの重心位置の間隔、中心位置の間隔、特定のドットの間隔である。
As shown in FIG. 5, the test chart 31 includes a first dot pattern group 48A, a second dot pattern group 48B, and a third dot pattern group (not shown) recorded by each of the head modules 28A to 28C. Including. In the first dot pattern group 48A, for example, 150 first dot patterns 50A having a shape extending long in the main scanning direction (for example, 5 pixl × 64 pixl) are recorded at a predetermined pattern interval W1 (repetition period) in the sub scanning direction. Is. The “pattern interval W1” here is an interval between the center positions of the dot patterns adjacent to each other in the sub-scanning direction, an interval between the center positions, and an interval between specific dots.
第2ドットパターン群48Bは、第1ドットパターン50Aと同形状の第2ドットパターン50Bを、副走査方向にパターン間隔W1(繰り返し周期)で例えば150個記録したものである。各第2ドットパターン50Bは、各第1ドットパターン50Aに対して、第1及び第2ヘッドモジュール28A,28Bの位置ずれに応じた分だけ副走査方向にずれて記録される。
In the second dot pattern group 48B, for example, 150 second dot patterns 50B having the same shape as the first dot pattern 50A are recorded at a pattern interval W1 (repetition cycle) in the sub-scanning direction. Each second dot pattern 50B is recorded with a deviation in the sub-scanning direction by an amount corresponding to the positional deviation of the first and second head modules 28A and 28B with respect to each first dot pattern 50A.
第3ドットパターン群も、第1及び第2ドットパターン群48A,48Bと同様に、第1ドットパターン50Aと同形状の第3ドットパターン(図示せず)を、副走査方向にパターン間隔W1で例えば150個記録したものである。
Similarly to the first and second dot pattern groups 48A and 48B, the third dot pattern group also has a third dot pattern (not shown) having the same shape as the first dot pattern 50A at a pattern interval W1 in the sub-scanning direction. For example, 150 are recorded.
このようなテストチャート31はイメージスキャナ16により読み取られる。これにより、イメージスキャナ16から濃度プロファイルデータ算出部39へ読取画像データ32が出力される。
Such a test chart 31 is read by the image scanner 16. As a result, the read image data 32 is output from the image scanner 16 to the density profile data calculation unit 39.
図4に戻って、濃度プロファイルデータ算出部39から位置ずれ量算出部44までの各部39~44は、読取画像データ32に基づき、各ヘッドモジュール28A~28Cのうちの隣接する2つのヘッドモジュール間の記録位置の位置ずれ量ΔYを算出する。以下、第1及び第2ヘッドモジュール28A,28B間の記録位置の位置ずれ量ΔYを測定する場合について説明を行う。第1及び第2ヘッドモジュール28A,28Bが本発明の第1のヘッドモジュール、第2のヘッドモジュールに相当し、第1及び第2ドットパターン50A,50Bが本発明の第1のドットパターン、第2のドットパターンに相当する。
Returning to FIG. 4, each of the units 39 to 44 from the density profile data calculating unit 39 to the positional deviation amount calculating unit 44 is based on the read image data 32, and between two adjacent head modules of the head modules 28A to 28C. The positional deviation amount ΔY of the recording position is calculated. Hereinafter, the case where the positional deviation amount ΔY of the recording position between the first and second head modules 28A and 28B is measured will be described. The first and second head modules 28A and 28B correspond to the first head module and the second head module of the present invention, and the first and second dot patterns 50A and 50B correspond to the first dot pattern and the second head module of the present invention. This corresponds to a dot pattern of 2.
位置ずれ量ΔYは、第1及び第2ヘッドモジュール28A,28Bの各々の記録位置の予め定めた基準位置からのずれ量(以下、基準位置ずれ量という)をそれぞれ算出して、2つの基準位置ずれ量を比較することにより算出される。これら基準位置ずれ量の算出は、濃度プロファイルデータ算出部39から基準位置ずれ量算出部43までの各部39~43により実行される。以下、第1ヘッドモジュール28Aの記録位置の基準位置ずれ量の算出について説明を行う。
The positional deviation amount ΔY is calculated by calculating the deviation amounts of the recording positions of the first and second head modules 28A and 28B from predetermined reference positions (hereinafter referred to as reference positional deviation amounts), respectively. It is calculated by comparing the amount of deviation. The calculation of the reference position deviation amount is executed by each of the units 39 to 43 from the density profile data calculation unit 39 to the reference position deviation amount calculation unit 43. Hereinafter, calculation of the reference position deviation amount of the recording position of the first head module 28A will be described.
<第1ヘッドモジュールの記録位置の基準位置ずれ量の算出>
(濃度プロファイルの算出)
図6(A),(B)に示すように、濃度プロファイルデータ算出部39は、読取画像データ32を解析して、第1ドットパターン群48Aが記録されている画像領域の副走査方向の濃度変化を示す第1の濃度プロファイル53Aを算出する。この第1の濃度プロファイル53Aは、予め定めた基準位置X0を基準として、この基準位置X0からの副走査方向に沿った上記画像領域の濃度変化を示すものである。第1の濃度プロファイル53Aは、各第1ドットパターン50Aに対応する位置の濃度が高くなり、逆に各第1ドットパターン50Aの間に対応する位置の濃度が低くなる。 <Calculation of reference position deviation amount of recording position of first head module>
(Calculation of concentration profile)
As shown in FIGS. 6A and 6B, the density profiledata calculation unit 39 analyzes the read image data 32 and density in the sub-scanning direction of the image area where the first dot pattern group 48A is recorded. A first density profile 53A indicating a change is calculated. The first concentration profile 53A, based on the reference position X 0 a predetermined shows the density change of the image region along the sub-scanning direction from the reference position X 0. In the first density profile 53A, the density at the position corresponding to each first dot pattern 50A is high, and conversely, the density at the position corresponding to between the first dot patterns 50A is low.
(濃度プロファイルの算出)
図6(A),(B)に示すように、濃度プロファイルデータ算出部39は、読取画像データ32を解析して、第1ドットパターン群48Aが記録されている画像領域の副走査方向の濃度変化を示す第1の濃度プロファイル53Aを算出する。この第1の濃度プロファイル53Aは、予め定めた基準位置X0を基準として、この基準位置X0からの副走査方向に沿った上記画像領域の濃度変化を示すものである。第1の濃度プロファイル53Aは、各第1ドットパターン50Aに対応する位置の濃度が高くなり、逆に各第1ドットパターン50Aの間に対応する位置の濃度が低くなる。 <Calculation of reference position deviation amount of recording position of first head module>
(Calculation of concentration profile)
As shown in FIGS. 6A and 6B, the density profile
基準位置X0は、例えば、第1ドットパターン群48Aの副走査方向の一端部に位置する第1ドットパターン50Aから、副走査方向に平行な方向でかつ第1ドットパターン群48Aから離れる方向に最大で(W1)/2だけ離れた位置である。なお、この基準位置X0は適宜変更してもよく、例えば第1ドットパターン50Aの間であってもよい。
Reference position X 0, for example, the first dot pattern 50A located at one end portion in the sub-scanning direction of the first dot pattern group 48A, a direction parallel to the sub scanning direction and in a direction away from the first dot pattern group 48A The position is at most (W1) / 2 apart. The reference position X 0 may be changed as appropriate, it may be between for example the first dot pattern 50A.
また、本実施形態ではイメージスキャナ16の副走査方向の解像度(例えば100dpi)がテストチャート31の副走査方向の解像度(例えば600dpi)よりも低いので、第1の濃度プロファイル53Aの副走査方向の解像度が低くなる。すなわち、第1の濃度プロファイル53Aの各測定点の副走査方向の間隔が大きくなる。濃度プロファイルデータ算出部39は、第1の濃度プロファイル53Aを補完処理部40へ出力する。
In the present embodiment, the resolution in the sub-scanning direction of the image scanner 16 (for example, 100 dpi) is lower than the resolution in the sub-scanning direction of the test chart 31 (for example, 600 dpi), so the resolution in the sub-scanning direction of the first density profile 53A. Becomes lower. That is, the interval in the sub-scanning direction between the measurement points of the first density profile 53A is increased. The density profile data calculation unit 39 outputs the first density profile 53A to the complement processing unit 40.
(補完処理:高解像度化)
図6(C)に示すように、補完処理部40は、第1の濃度プロファイル53Aの各測定点の測定値の間に線形補完データを補完(補間ともいう)する補完処理(線形補完処理)を行って、第1の濃度プロファイル53Aの副走査方向の解像度を100dpiから10000dpiに高解像化する。例えば、イメージスキャナ16のイメージセンサの解像度を「Rm」とし、高解像度化した時の解像度を「Rh」とし、任意の測定点iの測定値(濃度値)を「Di」とし、その隣の測定点i+1の測定値を「Di+1」とした場合に、線形補完データ「Di(j)」は以下の式(1)で表される。ただし、j=1~((Rh÷Rm)-1)の整数である。補完処理部40は、高解像化した第1の濃度プロファイル53A1を繰り返し周期算出部41へ出力する。 (Complementary processing: higher resolution)
As shown in FIG. 6C, thecomplement processing unit 40 complements linear interpolation data (also referred to as interpolation) between measurement values at each measurement point of the first density profile 53A (linear interpolation processing). To increase the resolution in the sub-scanning direction of the first density profile 53A from 100 dpi to 10000 dpi. For example, the resolution of the image sensor of the image scanner 16 is “R m ”, the resolution when the resolution is increased is “R h ”, the measurement value (density value) at an arbitrary measurement point i is “D i ”, When the measurement value at the adjacent measurement point i + 1 is “D i + 1 ”, the linear interpolation data “D i (j) ” is expressed by the following equation (1). However, j is an integer of 1 to ((R h ÷ R m ) −1). The complement processing unit 40 outputs the first resolution profile 53A1 with high resolution to the repetition period calculation unit 41.
図6(C)に示すように、補完処理部40は、第1の濃度プロファイル53Aの各測定点の測定値の間に線形補完データを補完(補間ともいう)する補完処理(線形補完処理)を行って、第1の濃度プロファイル53Aの副走査方向の解像度を100dpiから10000dpiに高解像化する。例えば、イメージスキャナ16のイメージセンサの解像度を「Rm」とし、高解像度化した時の解像度を「Rh」とし、任意の測定点iの測定値(濃度値)を「Di」とし、その隣の測定点i+1の測定値を「Di+1」とした場合に、線形補完データ「Di(j)」は以下の式(1)で表される。ただし、j=1~((Rh÷Rm)-1)の整数である。補完処理部40は、高解像化した第1の濃度プロファイル53A1を繰り返し周期算出部41へ出力する。 (Complementary processing: higher resolution)
As shown in FIG. 6C, the
Di(j)=(((Rh÷Rm)-1)×Di+j×Di+1)÷(Rh÷Rm)・・・(1)
D i (j) = (((R h ÷ R m ) −1) × D i + j × D i + 1 ) ÷ (R h ÷ R m ) (1)
(繰り返し周期長の算出)
図7(A)に示すように、繰り返し周期算出部41は、第1の濃度プロファイル53A1に基づき、第1ドットパターン50Aに対応する濃度変化の繰り返し周期(すなわち、濃度値のピークがどれくらいの周期で現れるか)を示す繰り返し周期長W2を算出する。この繰り返し周期長W2は前述のパターン間隔W1と完全に一致するものではなく、記録紙13の搬送速度の誤差、記録紙13の変形、イメージスキャナ16の読み取りの誤差などの解像度変動要因により、繰り返し周期長W2とパターン間隔W1との間には数%程度の誤差が生じる。なお、繰り返し周期長W2が正確に求められていないと、後述の積算濃度プロファイル算出部42による積算平均時に各第1ドットパターン50Aに対応するピーク値が平均化されてしまうため、正確な積算が行えず正確なピークの位置(図11参照)を求められない。そこで、繰り返し周期算出部41は、以下の方法により、繰り返し周期長W2を正確に算出する。 (Calculation of repetition cycle length)
As shown in FIG. 7A, the repetition cycle calculation unit 41 is based on the first density profile 53A1 and repeats the density change repetition cycle corresponding to thefirst dot pattern 50A (that is, how long the peak of the density value is). The repetition period length W2 is calculated. The repetition cycle length W2 does not completely coincide with the above-described pattern interval W1, and is repeatedly caused by resolution fluctuation factors such as an error in the conveyance speed of the recording paper 13, deformation of the recording paper 13, and reading error of the image scanner 16. An error of about several percent occurs between the cycle length W2 and the pattern interval W1. If the repetition cycle length W2 is not accurately obtained, the peak value corresponding to each first dot pattern 50A is averaged during integration averaging by an integration density profile calculation unit 42, which will be described later. It cannot be performed and an accurate peak position (see FIG. 11) cannot be obtained. Therefore, the repetition period calculation unit 41 accurately calculates the repetition period length W2 by the following method.
図7(A)に示すように、繰り返し周期算出部41は、第1の濃度プロファイル53A1に基づき、第1ドットパターン50Aに対応する濃度変化の繰り返し周期(すなわち、濃度値のピークがどれくらいの周期で現れるか)を示す繰り返し周期長W2を算出する。この繰り返し周期長W2は前述のパターン間隔W1と完全に一致するものではなく、記録紙13の搬送速度の誤差、記録紙13の変形、イメージスキャナ16の読み取りの誤差などの解像度変動要因により、繰り返し周期長W2とパターン間隔W1との間には数%程度の誤差が生じる。なお、繰り返し周期長W2が正確に求められていないと、後述の積算濃度プロファイル算出部42による積算平均時に各第1ドットパターン50Aに対応するピーク値が平均化されてしまうため、正確な積算が行えず正確なピークの位置(図11参照)を求められない。そこで、繰り返し周期算出部41は、以下の方法により、繰り返し周期長W2を正確に算出する。 (Calculation of repetition cycle length)
As shown in FIG. 7A, the repetition cycle calculation unit 41 is based on the first density profile 53A1 and repeats the density change repetition cycle corresponding to the
図8に示すように、繰り返し周期算出部41は、最初に、繰り返し周期のおおよその周期(例えば前述のパターン間隔W1など、前述の解像度変動要因を無視した場合の繰り返し周期)を、仮の繰り返し周期の基準周期(高解像度化した値)として決定する(ステップS1)。次いで、繰り返し周期算出部41は、基準周期の数%から10%の値を、仮の繰り返し周期の変動幅として決定する(ステップS2)。すなわち、仮の繰り返し周期は、(基準周期-変動幅)~(基準周期+変動幅)の間で段階的に変化される。
As shown in FIG. 8, the repetition period calculation unit 41 first calculates an approximate period (for example, a repetition period when the above-described resolution variation factors such as the above-described pattern interval W1 are ignored) as a temporary repetition. The cycle is determined as a reference cycle (high resolution value) (step S1). Next, the repetition period calculation unit 41 determines a value from several percent to 10% of the reference period as the fluctuation width of the provisional repetition period (step S2). That is, the provisional repetition period is changed stepwise between (reference period−variation range) to (reference period + variation range).
繰り返し周期算出部41は、最初の仮の繰り返し周期を「基準周期-変動幅」に設定する(ステップS3)。この設定後、繰り返し周期算出部41は、第1の濃度プロファイル53A1の濃度値を仮の繰り返し周期毎に積算平均してなる仮積算濃度プロファイルを算出する(ステップS4、仮積算濃度プロファイル算出ステップ)。なお、仮積算濃度プロファイルは、後述の第1の積算濃度プロファイル56A(図7(B)参照)と基本的に同じものである。そして、繰り返し周期算出部41は、仮積算濃度プロファイルの最大値(最大振幅、強度)を求める(ステップS5)。
The repetition period calculation unit 41 sets the first provisional repetition period to “reference period—variation width” (step S3). After this setting, the repetition cycle calculation unit 41 calculates a temporary integrated concentration profile obtained by averaging the concentration values of the first concentration profile 53A1 for each temporary repetition cycle (step S4, temporary integrated concentration profile calculation step). . The provisional cumulative density profile is basically the same as a first cumulative density profile 56A (see FIG. 7B) described later. Then, the repetition period calculation unit 41 obtains the maximum value (maximum amplitude, intensity) of the provisional cumulative concentration profile (step S5).
次いで、繰り返し周期算出部41は、最初の仮の繰り返し周期を前述の変動幅の数%だけ増加させた周期を、新たな仮の繰り返し周期として決定する(ステップS6でNO、ステップS7)。そして、繰り返し周期算出部41は、新たな仮の繰り返し周期に基づき、仮積算濃度プロファイルの算出と、その最大値の算出とを繰り返し実行する(ステップS4,S5)。以下同様にして、繰り返し周期算出部41は、最終の仮の繰り返し周期(基準周期+変動幅)に対応する仮積算濃度プロファイルの最大値を算出するまで、ステップS7,S4,S5の処理を繰り返し実行する(ステップS6でNO、繰り返しステップ)。
Next, the repetition period calculation unit 41 determines a period obtained by increasing the initial provisional repetition period by several percent of the above-described fluctuation range as a new provisional repetition period (NO in step S6, step S7). Then, the repetition period calculation unit 41 repeatedly executes the calculation of the temporary integrated density profile and the calculation of the maximum value based on the new temporary repetition period (steps S4 and S5). Similarly, the repetition period calculation unit 41 repeats the processes of steps S7, S4, and S5 until the maximum value of the provisional integrated density profile corresponding to the final provisional repetition period (reference period + variation width) is calculated. Execute (NO in step S6, repeat step).
図9に示すように、繰り返し周期算出部41は、全ての仮の繰り返し周期に対応する仮積算濃度プロファイルの最大値の算出後(ステップS6でYES)、仮の繰り返し周期ごとの仮積算濃度プロファイルの最大値を比較する(ステップS8)。仮の繰り返し周期の周期長と繰り返し周期長W2とが異なる場合には、仮の繰り返し周期毎の波形のピーク位置(図7(A)参照)がずれるため、積算平均を行うとピークが平均化されて仮積算濃度プロファイルの最大値は小さくなる。従って、繰り返し周期算出部41は、最大値が最も大きくなる仮の繰り返し周期の周期長を繰り返し周期長W2として決定する(ステップS9、決定ステップ)。これにより、繰り返し周期長W2を正確に算出することができる。繰り返し周期算出部41は、繰り返し周期長W2の算出結果を前述の第1の濃度プロファイル53A1と共に積算濃度プロファイル算出部42へ出力する。
As illustrated in FIG. 9, the repetition period calculation unit 41 calculates the temporary integrated concentration profile for each temporary repetition period after calculating the maximum value of the temporary integration density profile corresponding to all temporary repetition periods (YES in step S <b> 6). Are compared (step S8). When the period length of the temporary repetition period is different from the repetition period length W2, the peak position of the waveform for each temporary repetition period (see FIG. 7A) is shifted. As a result, the maximum value of the provisional integrated density profile becomes smaller. Therefore, the repetition period calculation unit 41 determines the period length of the provisional repetition period having the maximum maximum value as the repetition period length W2 (step S9, determination step). Thereby, the repetition cycle length W2 can be accurately calculated. The repetition cycle calculation unit 41 outputs the calculation result of the repetition cycle length W2 to the integrated concentration profile calculation unit 42 together with the first concentration profile 53A1 described above.
(積算濃度プロファイルの算出)
図7(A),(B)に示すように、積算濃度プロファイル算出部42は、第1の濃度プロファイル53A1の濃度値を、繰り返し周期長W2毎に積算平均して、第1の積算濃度プロファイル56Aを算出する。積算濃度プロファイル算出部42は、第1の積算濃度プロファイル56Aを基準位置ずれ量算出部43へ出力する。 (Calculation of integrated concentration profile)
As shown in FIGS. 7A and 7B, the integrated concentrationprofile calculation unit 42 averages the concentration values of the first concentration profile 53A1 for each repetition period length W2, and thereby calculates the first integrated concentration profile. 56A is calculated. The integrated density profile calculation unit 42 outputs the first integrated density profile 56 </ b> A to the reference position deviation amount calculation unit 43.
図7(A),(B)に示すように、積算濃度プロファイル算出部42は、第1の濃度プロファイル53A1の濃度値を、繰り返し周期長W2毎に積算平均して、第1の積算濃度プロファイル56Aを算出する。積算濃度プロファイル算出部42は、第1の積算濃度プロファイル56Aを基準位置ずれ量算出部43へ出力する。 (Calculation of integrated concentration profile)
As shown in FIGS. 7A and 7B, the integrated concentration
(基準位置ずれ量の算出)
図7(C)に示すように、基準位置ずれ量算出部43は、第1の積算濃度プロファイル56Aを解析して、第1ヘッドモジュール28Aの記録位置の基準位置ずれ量Δy1を算出する。以下、基準位置ずれ量Δy1の算出方法について具体的に説明を行う。 (Calculation of reference position deviation)
As shown in FIG. 7C, the reference position deviationamount calculation unit 43 analyzes the first integrated density profile 56A and calculates the reference position deviation amount Δy1 of the recording position of the first head module 28A. Hereinafter, a method for calculating the reference position deviation amount Δy1 will be specifically described.
図7(C)に示すように、基準位置ずれ量算出部43は、第1の積算濃度プロファイル56Aを解析して、第1ヘッドモジュール28Aの記録位置の基準位置ずれ量Δy1を算出する。以下、基準位置ずれ量Δy1の算出方法について具体的に説明を行う。 (Calculation of reference position deviation)
As shown in FIG. 7C, the reference position deviation
図10及び図11に示すように、基準位置ずれ量算出部43は、第1の積算濃度プロファイル56Aのデータの閾値Thを、例えば下記の式(2)を用いて決定する。そして、基準位置ずれ量算出部43は、第1の積算濃度プロファイル56Aのデータの中で閾値Thを上回るデータを抽出する(ステップS12)。
As shown in FIGS. 10 and 11, the reference position deviation amount calculation unit 43 determines the threshold value Th of the data of the first integrated density profile 56A using, for example, the following equation (2). Then, the reference position deviation amount calculation unit 43 extracts data exceeding the threshold value Th from the data of the first integrated density profile 56A (step S12).
閾値Th=(最大値-最小値)×f+最小値:(fは例えば0.5)・・・(2)
Threshold value Th = (maximum value−minimum value) × f + minimum value: (f is 0.5, for example) (2)
次いで、基準位置ずれ量算出部43は、閾値Thを上回るデータに対し近似曲線(例えば2次関数:y=ax2+bx+c、図11中の実線で表示)を演算し、その近似曲線のピーク位置(頂点値ともいう)XPを算出する(ステップS13)。例えば、ピーク位置XPはXP=-b÷(2×a)に基づき算出される。
Next, the reference position deviation amount calculation unit 43 calculates an approximate curve (for example, a quadratic function: y = ax 2 + bx + c, indicated by a solid line in FIG. 11) for data exceeding the threshold Th, and the peak position of the approximate curve (also referred to as vertex values) to calculate the X P (step S13). For example, the peak position X P is calculated based on X P = −b ÷ (2 × a).
ピーク位置XPの算出後、基準位置ずれ量算出部43は、ピーク位置XPと、基準位置X0(例えばX0=0)と、イメージスキャナ16の解像度Rmと、高解像度化した時の解像度Rhとに基づき、下記の式(3)、(4)を用いて基準位置ずれ量Δy1を算出する(ステップS14)。なお、式(4)の「25400」はインチをμmに変換する変換数である。また、本発明では積算濃度プロファイルの波形が極大となる位置をピーク位置としているが、例えばドットパターンの記録されていない部分に対応するデータが極大となるような積算濃度プロファイルの場合にはその波形が極小となる位置をピーク位置とする(他の実施形態も同様)。そして、基準位置ずれ量算出部43は、基準位置ずれ量Δy1の算出結果を位置ずれ量算出部44へ出力する。以上で第1ヘッドモジュール28Aの記録位置の基準位置ずれ量Δy1の算出が完了する。
After calculating the peak position X P, the reference position deviation amount calculating section 43, the peak position X P, the reference position X 0 (for example, X 0 = 0), and the resolution R m of the image scanner 16, when the high resolution based of on the resolution R h, the following equation (3) to calculate the reference position deviation amount Δy1 with (4) (step S14). Note that “25400” in Equation (4) is the number of conversions for converting inches to μm. In the present invention, the peak position is the position where the waveform of the integrated density profile is maximum. For example, in the case of the integrated density profile where the data corresponding to the portion where the dot pattern is not recorded is maximum, the waveform is the waveform. The position at which is minimized is the peak position (the same applies to other embodiments). Then, the reference positional deviation amount calculation unit 43 outputs the calculation result of the reference positional deviation amount Δy1 to the positional deviation amount calculation unit 44. Thus, the calculation of the reference position deviation amount Δy1 of the recording position of the first head module 28A is completed.
(XP-X0)÷Rh×Rm→p(pixl/スキャナ解像度)・・・(3)
(X P −X 0 ) ÷ R h × R m → p (pixl / scanner resolution) (3)
p÷Rm×25400→Δy1(μm)・・・(4)
p ÷ R m × 25400 → Δy1 (μm) (4)
<第2ヘッドモジュールの記録位置の基準位置ずれ量の算出>
次いで、図12に示すように、濃度プロファイルデータ算出部39から基準位置ずれ量算出部43までの各部39~43は、第2ヘッドモジュール28Bの記録位置の基準位置ずれ量Δy2の算出を行う。この基準位置ずれ量Δy2の算出処理は、前述の基準位置ずれ量Δy1の算出処理と基本的に同じである。 <Calculation of reference position deviation amount of recording position of second head module>
Next, as shown in FIG. 12, theunits 39 to 43 from the density profile data calculation unit 39 to the reference position deviation amount calculation unit 43 calculate the reference position deviation amount Δy2 of the recording position of the second head module 28B. The calculation process of the reference position deviation amount Δy2 is basically the same as the calculation process of the reference position deviation amount Δy1 described above.
次いで、図12に示すように、濃度プロファイルデータ算出部39から基準位置ずれ量算出部43までの各部39~43は、第2ヘッドモジュール28Bの記録位置の基準位置ずれ量Δy2の算出を行う。この基準位置ずれ量Δy2の算出処理は、前述の基準位置ずれ量Δy1の算出処理と基本的に同じである。 <Calculation of reference position deviation amount of recording position of second head module>
Next, as shown in FIG. 12, the
濃度プロファイルデータ算出部39は、読取画像データ32を解析して、第2ドットパターン群48Bが記録されている画像領域の副走査方向の濃度変化を示す第2の濃度プロファイル53Bを算出する。この第2の濃度プロファイル53Bは、前述の第1の濃度プロファイル53Aの算出時に定めた基準位置X0を基準として、この基準位置X0からの副走査方向に沿った上記画像領域の濃度変化を示すものである。すなわち、第1及び第2の濃度プロファイル53A,53Bは、共通の基準位置X0からの副走査方向に沿った濃度変化を示すものである。
The density profile data calculation unit 39 analyzes the read image data 32 and calculates a second density profile 53B indicating a change in density in the sub-scanning direction of the image area where the second dot pattern group 48B is recorded. The second concentration profile 53B, based on the reference position X 0 as defined in the calculation of the first concentration profile 53A described above, a density change of the image region along the sub-scanning direction from the reference position X 0 It is shown. That is, the first and second concentration profile 53A, 53B shows the concentration variation along the sub-scanning direction from a common reference position X 0.
補完処理部40は、第2の濃度プロファイル53Bに対して線形補完処理を行い、第2の濃度プロファイル53Bの副走査方向の解像度を100dpiから10000dpiに高解像化する。これにより、高解像化した第2の濃度プロファイル53B1が生成される。
The complement processing unit 40 performs linear complement processing on the second density profile 53B to increase the resolution of the second density profile 53B in the sub-scanning direction from 100 dpi to 10000 dpi. As a result, a high-resolution second density profile 53B1 is generated.
繰り返し周期算出部41は、前述の図8及び図9に示した方法を用いて、第2の濃度プロファイル53B1に基づき、第2ドットパターン50Bに対応する濃度変化の繰り返し周期を示す繰り返し周期長W2を算出する。
The repetition period calculation unit 41 uses the method shown in FIGS. 8 and 9 described above, and based on the second density profile 53B1, the repetition period length W2 indicating the repetition period of the density change corresponding to the second dot pattern 50B. Is calculated.
積算濃度プロファイル算出部42は、第2の濃度プロファイル53B1のデータを繰り返し周期長W2毎に積算平均して、第2の積算濃度プロファイル56Bを算出する。
The integrated concentration profile calculation unit 42 calculates the second integrated concentration profile 56B by averaging the data of the second concentration profile 53B1 every repetition cycle length W2.
基準位置ずれ量算出部43は、前述の図10及び図11に示したように、第2の積算濃度プロファイル56Bのピーク位置XPを算出し、このピーク位置XPに基づき、第2ヘッドモジュール28Bの記録位置の基準位置ずれ量Δy2を算出する。そして、基準位置ずれ量算出部43は、基準位置ずれ量Δy2の算出結果を位置ずれ量算出部44へ出力する。
Reference position deviation amount calculating section 43, as shown in FIGS. 10 and 11 described above, to calculate the peak position X P of the second cumulative concentration profiles 56B, based on the peak position X P, the second head module A reference position deviation amount Δy2 of the recording position 28B is calculated. Then, the reference position deviation amount calculation unit 43 outputs the calculation result of the reference position deviation amount Δy2 to the position deviation amount calculation unit 44.
<位置ずれ量算出処理>
図13に示すように、位置ずれ量算出部44は、基準位置ずれ量Δy1と基準位置ずれ量Δy2との差分、すなわち、第1ドットパターン50Aに対応するピーク位置XPと第2ドットパターン50Bに対応するピーク位置XPとの差分に基づき、位置ずれ量ΔYを算出する。各基準位置ずれ量Δy1,Δy2(各ピーク位置XP)は、それぞれ共通の基準位置X0を基準として算出されているので、両者の差分をとることで第1及び第2ヘッドモジュール28A,28B間の記録位置の位置ずれ量ΔYを算出することができる。位置ずれ量算出部44は、位置ずれ量ΔYの算出結果を位置ずれ補正処理部45へ出力する。なお、位置ずれ量ΔYは、図3に示した設計位置からのずれ量と、千鳥配置によるずれ量、及び、テストチャート記録時に各ヘッドモジュールに設定されたインク吐出タイミングの誤差、とを含む記録位置の位置ずれ量である。 <Position displacement calculation processing>
As shown in FIG. 13, position shiftamount calculation unit 44, the difference between the reference position deviation amount Δy1 and the reference position deviation amount .DELTA.y2, i.e., the peak position X P and the second dot pattern 50B corresponding to the first dot pattern 50A based on the difference between the corresponding peak position X P in, it calculates the position deviation amount [Delta] Y. Each reference position deviation amount .DELTA.y1, .DELTA.y2 (each peak position X P), since it is calculated as each reference a common reference position X 0, the first and second head modules 28A by taking the difference between the two, 28B It is possible to calculate the positional deviation amount ΔY of the recording position between. The positional deviation amount calculation unit 44 outputs the calculation result of the positional deviation amount ΔY to the positional deviation correction processing unit 45. The positional deviation amount ΔY includes a deviation amount from the design position shown in FIG. 3, a deviation amount due to the staggered arrangement, and an error in ink ejection timing set in each head module at the time of test chart recording. This is the amount of positional deviation.
図13に示すように、位置ずれ量算出部44は、基準位置ずれ量Δy1と基準位置ずれ量Δy2との差分、すなわち、第1ドットパターン50Aに対応するピーク位置XPと第2ドットパターン50Bに対応するピーク位置XPとの差分に基づき、位置ずれ量ΔYを算出する。各基準位置ずれ量Δy1,Δy2(各ピーク位置XP)は、それぞれ共通の基準位置X0を基準として算出されているので、両者の差分をとることで第1及び第2ヘッドモジュール28A,28B間の記録位置の位置ずれ量ΔYを算出することができる。位置ずれ量算出部44は、位置ずれ量ΔYの算出結果を位置ずれ補正処理部45へ出力する。なお、位置ずれ量ΔYは、図3に示した設計位置からのずれ量と、千鳥配置によるずれ量、及び、テストチャート記録時に各ヘッドモジュールに設定されたインク吐出タイミングの誤差、とを含む記録位置の位置ずれ量である。 <Position displacement calculation processing>
As shown in FIG. 13, position shift
<位置ずれ補正処理>
図4に戻って、位置ずれ補正処理部45は、位置ずれ量ΔYの検出結果に基づき、第1及び第2ヘッドモジュール28A,28B間の記録位置を補正する位置ずれ補正処理を行う。例えば、位置ずれ補正処理部45は、後処理演算部21を制御して印字データに位置ずれ補正処理を施して、第1及び第2ヘッドモジュール28A,28Bのいずれか一方の記録開始タイミングを他方に対して早めるあるいは遅らせる。これにより、第1及び第2ヘッドモジュール28A,28B間の記録位置の位置ずれが補正される。なお、ヘッドモジュール間の記録位置の位置ずれを補正する位置ずれ補正方法としては様々な方法が知られており、これらのいずれを用いてもよい。 <Position correction processing>
Returning to FIG. 4, the misregistrationcorrection processing unit 45 performs misregistration correction processing for correcting the recording position between the first and second head modules 28A and 28B based on the detection result of the misregistration amount ΔY. For example, the misalignment correction processing unit 45 controls the post-processing calculation unit 21 to perform misalignment correction processing on the print data, and sets the recording start timing of one of the first and second head modules 28A and 28B to the other. Accelerate or delay against Thereby, the displacement of the recording position between the first and second head modules 28A, 28B is corrected. Various methods are known as misregistration correction methods for correcting the misregistration of the recording position between the head modules, and any of these may be used.
図4に戻って、位置ずれ補正処理部45は、位置ずれ量ΔYの検出結果に基づき、第1及び第2ヘッドモジュール28A,28B間の記録位置を補正する位置ずれ補正処理を行う。例えば、位置ずれ補正処理部45は、後処理演算部21を制御して印字データに位置ずれ補正処理を施して、第1及び第2ヘッドモジュール28A,28Bのいずれか一方の記録開始タイミングを他方に対して早めるあるいは遅らせる。これにより、第1及び第2ヘッドモジュール28A,28B間の記録位置の位置ずれが補正される。なお、ヘッドモジュール間の記録位置の位置ずれを補正する位置ずれ補正方法としては様々な方法が知られており、これらのいずれを用いてもよい。 <Position correction processing>
Returning to FIG. 4, the misregistration
<第1実施形態のインクジェットプリンタの作用>
次に、上記構成のプリンタ10の作用、特に位置ずれ量ΔYの測定処理並びに画像記録処理について説明を行う。なお、ここでは第1及び第2ヘッドモジュール28A,28B間の記録位置の位置ずれ量ΔYを測定する場合について説明を行う。 <Operation of Inkjet Printer of First Embodiment>
Next, the operation of theprinter 10 having the above-described configuration, particularly the measurement process of the positional deviation amount ΔY and the image recording process will be described. Here, a case will be described in which the positional deviation amount ΔY of the recording position between the first and second head modules 28A, 28B is measured.
次に、上記構成のプリンタ10の作用、特に位置ずれ量ΔYの測定処理並びに画像記録処理について説明を行う。なお、ここでは第1及び第2ヘッドモジュール28A,28B間の記録位置の位置ずれ量ΔYを測定する場合について説明を行う。 <Operation of Inkjet Printer of First Embodiment>
Next, the operation of the
図14に示すように、プリンタ10の電源がONされた場合や、第1及び第2ヘッドモジュール28A,28Bの少なくとも一方が新たに記録ヘッド14に装着された場合などには、CPU24の各部39~45が作動して、位置ずれ量ΔYの測定処理を開始する(ステップS20)。
As shown in FIG. 14, when the power of the printer 10 is turned on, or when at least one of the first and second head modules 28A, 28B is newly attached to the recording head 14, each unit 39 of the CPU 24 is displayed. ˜45 are activated to start the measurement process of the positional deviation amount ΔY (step S20).
(テストチャート記録処理)
図15に示すように、テストチャート記録制御部38の制御の下、メモリ34内のテストチャートデータ35が画像ページメモリ18に出力された後、画像バッファメモリ書込制御部19と画像バッファメモリ20と転送制御部22とを介して、テストチャートデータ35に基づく1回の打滴分の印字データが逐次にヘッドドライバ23へ転送される。ヘッドドライバ23は、印字データに基づき、各ヘッドモジュール28A~28Cの各ノズル27のインク吐出を制御する。そして、搬送機構12により記録紙13を副走査方向に搬送しつつ、各ヘッドモジュール28A~28Cによりインク滴36を打滴することで、記録紙13の記録面上にテストチャート31が記録される(ステップS21、記録ステップ)。 (Test chart recording process)
As shown in FIG. 15, after thetest chart data 35 in the memory 34 is output to the image page memory 18 under the control of the test chart recording control unit 38, the image buffer memory write control unit 19 and the image buffer memory 20 are output. The print data for one droplet ejection based on the test chart data 35 is sequentially transferred to the head driver 23 via the transfer control unit 22. The head driver 23 controls ink ejection from the nozzles 27 of the head modules 28A to 28C based on the print data. The test chart 31 is recorded on the recording surface of the recording paper 13 by ejecting ink droplets 36 by the head modules 28A to 28C while conveying the recording paper 13 in the sub-scanning direction by the transport mechanism 12. (Step S21, recording step).
図15に示すように、テストチャート記録制御部38の制御の下、メモリ34内のテストチャートデータ35が画像ページメモリ18に出力された後、画像バッファメモリ書込制御部19と画像バッファメモリ20と転送制御部22とを介して、テストチャートデータ35に基づく1回の打滴分の印字データが逐次にヘッドドライバ23へ転送される。ヘッドドライバ23は、印字データに基づき、各ヘッドモジュール28A~28Cの各ノズル27のインク吐出を制御する。そして、搬送機構12により記録紙13を副走査方向に搬送しつつ、各ヘッドモジュール28A~28Cによりインク滴36を打滴することで、記録紙13の記録面上にテストチャート31が記録される(ステップS21、記録ステップ)。 (Test chart recording process)
As shown in FIG. 15, after the
(テストチャート読取処理)
テストチャート31の記録後、CPU24は、既知の記録紙13の搬送速度情報に基づきテストチャート31をトラッキングする。そして、CPU24は、テストチャート31がイメージスキャナ16を通過するタイミングに合わせてイメージスキャナ16による読み取りを開始させる。これにより、テストチャート31がイメージスキャナ16により読み取られ、読取画像データ32がイメージスキャナ16から濃度プロファイルデータ算出部39へ出力される(ステップS22、読取ステップ)。 (Test chart reading process)
After recording thetest chart 31, the CPU 24 tracks the test chart 31 based on the known conveyance speed information of the recording paper 13. Then, the CPU 24 starts reading by the image scanner 16 in accordance with the timing when the test chart 31 passes the image scanner 16. As a result, the test chart 31 is read by the image scanner 16, and the read image data 32 is output from the image scanner 16 to the density profile data calculation unit 39 (step S22, reading step).
テストチャート31の記録後、CPU24は、既知の記録紙13の搬送速度情報に基づきテストチャート31をトラッキングする。そして、CPU24は、テストチャート31がイメージスキャナ16を通過するタイミングに合わせてイメージスキャナ16による読み取りを開始させる。これにより、テストチャート31がイメージスキャナ16により読み取られ、読取画像データ32がイメージスキャナ16から濃度プロファイルデータ算出部39へ出力される(ステップS22、読取ステップ)。 (Test chart reading process)
After recording the
濃度プロファイルデータ算出部39は、読取画像データ32の入力後、位置ずれ量ΔYの測定対象となる2つのヘッドモジュール、すなわち、第1及び第2ヘッドモジュール28A,28Bを同定する(ステップS23)。次いで、第1ヘッドモジュール28Aの記録位置の基準位置ずれ量Δy1の算出処理が開始される(ステップS24)。
After the input of the read image data 32, the density profile data calculation unit 39 identifies two head modules, that is, the first and second head modules 28A and 28B that are the measurement targets of the positional deviation amount ΔY (step S23). Next, a calculation process of the reference position deviation amount Δy1 of the recording position of the first head module 28A is started (step S24).
(基準位置ずれ量Δy1の算出処理)
図16に示すように、濃度プロファイルデータ算出部39は、読取画像データ32を解析して、図6(B)に示したような第1の濃度プロファイル53Aを算出する(ステップS26、濃度プロファイル算出ステップ)。この第1の濃度プロファイル53Aは、濃度プロファイルデータ算出部39から補完処理部40へ出力される。 (Calculation processing of reference position deviation amount Δy1)
As shown in FIG. 16, the density profiledata calculation unit 39 analyzes the read image data 32 to calculate the first density profile 53A as shown in FIG. 6B (step S26, density profile calculation). Step). The first density profile 53A is output from the density profile data calculation unit 39 to the complement processing unit 40.
図16に示すように、濃度プロファイルデータ算出部39は、読取画像データ32を解析して、図6(B)に示したような第1の濃度プロファイル53Aを算出する(ステップS26、濃度プロファイル算出ステップ)。この第1の濃度プロファイル53Aは、濃度プロファイルデータ算出部39から補完処理部40へ出力される。 (Calculation processing of reference position deviation amount Δy1)
As shown in FIG. 16, the density profile
補完処理部40は、第1の濃度プロファイル53Aに対して線形補完処理を施すことにより、図6(C)に示したように高解像度化された第1の濃度プロファイル53A1を生成する(ステップS27、補完処理ステップ)。第1の濃度プロファイル53Aを副走査方向に高解像度化することで、基準位置ずれ量Δy1(すなわち、位置ずれ量ΔY)をより高精度に算出することができる。この第1の濃度プロファイル53A1は、補完処理部40から繰り返し周期算出部41へ出力される。
The complement processing unit 40 performs linear complement processing on the first density profile 53A, thereby generating the first density profile 53A1 having a higher resolution as shown in FIG. 6C (step S27). , Complementary processing step). By increasing the resolution of the first density profile 53A in the sub-scanning direction, the reference positional deviation amount Δy1 (that is, the positional deviation amount ΔY) can be calculated with higher accuracy. The first density profile 53A1 is output from the complement processing unit 40 to the repetition period calculation unit 41.
繰り返し周期算出部41は、図8に示したステップS1からステップS9までの処理を実行することで、図7(A)に示したように、第1ドットパターン50Aに対応する濃度変化の繰り返し周期を示す繰り返し周期長W2を算出する(ステップS28、繰り返し周期算出ステップ)。繰り返し周期長W2を正確に算出することで、第1の積算濃度プロファイル56Aのピーク位置XPを正確に算出することができる。そして、この繰り返し周期長W2の算出結果は第1の濃度プロファイル53A1と共に、繰り返し周期算出部41から積算濃度プロファイル算出部42へ出力される。
The repetition period calculation unit 41 executes the processing from step S1 to step S9 shown in FIG. 8 to thereby repeat the density change repetition period corresponding to the first dot pattern 50A as shown in FIG. 7A. Is calculated (step S28, repetition cycle calculation step). By accurately calculate the repetition period length W2, it is possible to accurately calculate the peak position X P of the first integration density profile 56A. The calculation result of the repetition cycle length W2 is output from the repetition cycle calculation unit 41 to the integrated concentration profile calculation unit 42 together with the first concentration profile 53A1.
積算濃度プロファイル算出部42は、図7(B)に示したように、第1の濃度プロファイル53A1のデータを繰り返し周期長W2毎に積算平均して、第1の積算濃度プロファイル56Aを算出する(ステップS29、積算濃度プロファイル算出ステップ)。この第1の積算濃度プロファイル56Aは、積算濃度プロファイル算出部42から基準位置ずれ量算出部43へ出力される。
As shown in FIG. 7B, the integrated concentration profile calculation unit 42 calculates the first integrated concentration profile 56A by integrating and averaging the data of the first concentration profile 53A1 for each repetition period length W2. Step S29, integrated density profile calculation step). The first integrated density profile 56A is output from the integrated density profile calculation unit 42 to the reference position deviation amount calculation unit 43.
基準位置ずれ量算出部43は、図10に示したステップS12からステップS14までの処理を実行することで、図7(C)及び図11に示したように、第1ヘッドモジュール28Aの記録位置の基準位置ずれ量Δy1を算出する(ステップS30)。この基準位置ずれ量Δy1の算出結果は、基準位置ずれ量算出部43から位置ずれ量算出部44へ出力される。以上で基準位置ずれ量Δy1の算出処理(ステップS24、図15参照)が完了する。
The reference position deviation amount calculation unit 43 executes the processing from step S12 to step S14 shown in FIG. 10, so that the recording position of the first head module 28 </ b> A is obtained as shown in FIG. 7C and FIG. 11. The reference position deviation amount Δy1 is calculated (step S30). The calculation result of the reference positional deviation amount Δy1 is output from the reference positional deviation amount calculation unit 43 to the positional deviation amount calculation unit 44. This completes the calculation processing of the reference position deviation amount Δy1 (see step S24, FIG. 15).
(基準位置ずれ量Δy2の算出処理)
図15に戻って、基準位置ずれ量Δy1の算出処理後、第2ヘッドモジュール28Bの記録位置の基準位置ずれ量Δy2の算出処理が開始される(ステップS32)。この基準位置ずれ量Δy2の算出処理でも、図16に示したステップS26からステップS30までの処理が再度実行される。これにより、図12に示したような第2の濃度プロファイル53Bの算出、第2の濃度プロファイル53B1の生成、繰り返し周期長W2の算出、第2の積算濃度プロファイル56Bの算出が行われた後、第2ヘッドモジュール28Bの記録位置の基準位置ずれ量Δy2が算出される。この基準位置ずれ量Δy2の算出結果も位置ずれ量算出部44へ出力される。 (Calculation processing of reference position deviation amount Δy2)
Returning to FIG. 15, after the calculation process of the reference position deviation amount Δy1, the calculation process of the reference position deviation amount Δy2 of the recording position of thesecond head module 28B is started (step S32). Also in the calculation processing of the reference position deviation amount Δy2, the processing from step S26 to step S30 shown in FIG. 16 is executed again. Thus, after the calculation of the second density profile 53B, the generation of the second density profile 53B1, the calculation of the repetition cycle length W2, and the calculation of the second integrated density profile 56B as shown in FIG. A reference position deviation amount Δy2 of the recording position of the second head module 28B is calculated. The calculation result of the reference positional deviation amount Δy2 is also output to the positional deviation amount calculation unit 44.
図15に戻って、基準位置ずれ量Δy1の算出処理後、第2ヘッドモジュール28Bの記録位置の基準位置ずれ量Δy2の算出処理が開始される(ステップS32)。この基準位置ずれ量Δy2の算出処理でも、図16に示したステップS26からステップS30までの処理が再度実行される。これにより、図12に示したような第2の濃度プロファイル53Bの算出、第2の濃度プロファイル53B1の生成、繰り返し周期長W2の算出、第2の積算濃度プロファイル56Bの算出が行われた後、第2ヘッドモジュール28Bの記録位置の基準位置ずれ量Δy2が算出される。この基準位置ずれ量Δy2の算出結果も位置ずれ量算出部44へ出力される。 (Calculation processing of reference position deviation amount Δy2)
Returning to FIG. 15, after the calculation process of the reference position deviation amount Δy1, the calculation process of the reference position deviation amount Δy2 of the recording position of the
(位置ずれ量ΔYの算出処理)
位置ずれ量算出部44は、図13に示したように、基準位置ずれ量Δy1と基準位置ずれ量Δy2との差分(第1ドットパターン50Aに対応するピーク位置XPと第2ドットパターン50Bに対応するピーク位置XPとの差分)に基づき、位置ずれ量ΔYを算出する(ステップS33、位置ずれ量算出ステップ)。この位置ずれ量ΔYの算出結果は、位置ずれ量算出部44から位置ずれ補正処理部45へ出力される。以上で位置ずれ量測定処理(ステップS20、図14参照)が完了する。 (Calculation processing of misregistration amount ΔY)
Positional deviationamount calculating section 44, as shown in FIG. 13, the difference between the reference position deviation amount Δy1 and the reference position deviation amount .DELTA.y2 (the peak position X P corresponding to the first dot pattern 50A in the second dot pattern 50B based on the difference) between the corresponding peak position X P, and calculates the positional deviation amount [Delta] Y (step S33, positional deviation amount calculating step). The calculation result of the positional deviation amount ΔY is output from the positional deviation amount calculation unit 44 to the positional deviation correction processing unit 45. This completes the positional deviation amount measurement process (step S20, see FIG. 14).
位置ずれ量算出部44は、図13に示したように、基準位置ずれ量Δy1と基準位置ずれ量Δy2との差分(第1ドットパターン50Aに対応するピーク位置XPと第2ドットパターン50Bに対応するピーク位置XPとの差分)に基づき、位置ずれ量ΔYを算出する(ステップS33、位置ずれ量算出ステップ)。この位置ずれ量ΔYの算出結果は、位置ずれ量算出部44から位置ずれ補正処理部45へ出力される。以上で位置ずれ量測定処理(ステップS20、図14参照)が完了する。 (Calculation processing of misregistration amount ΔY)
Positional deviation
なお、第2及び第3ヘッドモジュール28B,28C間の記録位置の位置ずれ量ΔYについても同様に測定することができる。
Note that the positional deviation amount ΔY of the recording position between the second and third head modules 28B, 28C can be measured in the same manner.
(位置ずれ補正処理)
図14に戻って、図示しない操作部等で印刷開始操作がなされると(ステップS36)、ホストコンピュータ11から送られてくる画像データがホストI/F部17を介して画像ページメモリ18に格納される(ステップS37)。そして、CPU24の制御の下、画像データに基づく1回の打滴分の印字データが逐次にヘッドドライバ23へ転送される。この際に、位置ずれ補正処理部45は、位置ずれ量ΔYの検出結果に基づき、後処理演算部21を制御して、印字データに対して位置ずれ補正処理を行う。これにより、第1及び第2ヘッドモジュール28A,28B間の記録位置の位置ずれが補正される(ステップS38)。 (Position correction processing)
Returning to FIG. 14, when a print start operation is performed by an operation unit (not shown) or the like (step S36), image data sent from thehost computer 11 is stored in the image page memory 18 via the host I / F unit 17. (Step S37). Then, under the control of the CPU 24, print data for one droplet ejection based on the image data is sequentially transferred to the head driver 23. At this time, the misregistration correction processing unit 45 controls the post-processing calculation unit 21 based on the detection result of the misregistration amount ΔY, and performs misregistration correction processing on the print data. Thereby, the displacement of the recording position between the first and second head modules 28A, 28B is corrected (step S38).
図14に戻って、図示しない操作部等で印刷開始操作がなされると(ステップS36)、ホストコンピュータ11から送られてくる画像データがホストI/F部17を介して画像ページメモリ18に格納される(ステップS37)。そして、CPU24の制御の下、画像データに基づく1回の打滴分の印字データが逐次にヘッドドライバ23へ転送される。この際に、位置ずれ補正処理部45は、位置ずれ量ΔYの検出結果に基づき、後処理演算部21を制御して、印字データに対して位置ずれ補正処理を行う。これにより、第1及び第2ヘッドモジュール28A,28B間の記録位置の位置ずれが補正される(ステップS38)。 (Position correction processing)
Returning to FIG. 14, when a print start operation is performed by an operation unit (not shown) or the like (step S36), image data sent from the
ヘッドドライバ23は、印字データに基づき、各ヘッドモジュール28A~28Cの各ノズル27のインク吐出を制御する。そして、搬送機構12により記録紙13を副走査方向に搬送しつつ、各ヘッドモジュール28A~28Cによりインク滴36を打滴する。これにより、記録紙13の記録面上に画像データに基づく画像が記録される(ステップS39)。
The head driver 23 controls ink ejection from the nozzles 27 of the head modules 28A to 28C based on the print data. Then, while transporting the recording paper 13 in the sub-scanning direction by the transport mechanism 12, ink droplets 36 are ejected by the head modules 28A to 28C. Thereby, an image based on the image data is recorded on the recording surface of the recording paper 13 (step S39).
他の画像データに基づき再度印刷を行う場合には(ステップS40でYES)、上述の各ステップS37からステップS39までの処理が繰り返し実行される。
When printing is performed again based on other image data (YES in step S40), the above-described processing from step S37 to step S39 is repeatedly executed.
この際に、第1及び第2ヘッドモジュール28A,28Bの交換を行った場合、先に位置ずれ量ΔYの測定を行ってから所定時間が経過した場合、あるいは所定枚数の印刷を行った場合、ユーザから位置ずれ量ΔYの再測定の指示を受けた場合などには、再度、位置ずれ量ΔYの測定処理が実行される(ステップS41でYES、ステップS42)。これにより、前述の図15及び図16に示したステップS21からステップS30までの処理が繰り返し実行されて、新たな位置ずれ量ΔYが測定される。
At this time, when the first and second head modules 28A, 28B are exchanged, when a predetermined time has elapsed since the measurement of the positional deviation amount ΔY is performed first, or when a predetermined number of sheets are printed, When receiving an instruction for re-measurement of the positional deviation amount ΔY from the user, the measurement processing of the positional deviation amount ΔY is executed again (YES in step S41, step S42). Thereby, the processing from step S21 to step S30 shown in FIG. 15 and FIG. 16 is repeatedly executed, and a new positional deviation amount ΔY is measured.
以下、プリンタ10での印刷が終了するまで上述の各ステップの処理が繰り返し実行される。
Hereinafter, the processing of each step described above is repeatedly executed until printing by the printer 10 is completed.
<第1実施形態のインクジェットプリンタの作用効果>
このように本実施形態では、テストチャート31の読取画像を基に第1及び第2の積算濃度プロファイル56A,56Bをそれぞれ算出し、これらに基づき位置ずれ量ΔYを測定するので、高解像度のイメージセンサを用いることなく、ヘッドモジュール間の記録位置の位置ずれ量を低コストかつ高精度に測定することができる。 <Operational Effect of Inkjet Printer of First Embodiment>
As described above, in the present embodiment, the first and second integrated density profiles 56A and 56B are calculated based on the read image of the test chart 31, and the positional deviation amount ΔY is measured based on the first and second integrated density profiles 56A and 56B. Without using a sensor, it is possible to measure the amount of displacement of the recording position between the head modules with low cost and high accuracy.
このように本実施形態では、テストチャート31の読取画像を基に第1及び第2の積算濃度プロファイル56A,56Bをそれぞれ算出し、これらに基づき位置ずれ量ΔYを測定するので、高解像度のイメージセンサを用いることなく、ヘッドモジュール間の記録位置の位置ずれ量を低コストかつ高精度に測定することができる。 <Operational Effect of Inkjet Printer of First Embodiment>
As described above, in the present embodiment, the first and second
[第2実施形態のインクジェットプリンタ]
次に、図17を用いて本発明の第2実施形態のプリンタ70について説明を行う。上記第1実施形態では、各ヘッドモジュール28A~28Cがそれぞれ記録紙13に記録を行う記録領域がオーバラップしていないが、プリンタ70では互いに隣接するヘッドモジュールの記録領域がオーバラップしている。なお、プリンタ70は、第1実施形態とは異なる記録ヘッド72を備える点を除けば、第1実施形態のプリンタ10と基本的には同じ構成である。このため、上記第1実施形態と機能・構成上同一のものについては、同一符号を付してその説明は省略する。 [Inkjet Printer of Second Embodiment]
Next, the printer 70 according to the second embodiment of the present invention will be described with reference to FIG. In the first embodiment, the recording areas where thehead modules 28A to 28C perform recording on the recording paper 13 do not overlap, but in the printer 70, the recording areas of the head modules adjacent to each other overlap. The printer 70 has basically the same configuration as the printer 10 of the first embodiment, except that the printer 70 includes a recording head 72 different from that of the first embodiment. For this reason, the same reference numerals are given to the same functions and configurations as those in the first embodiment, and the description thereof is omitted.
次に、図17を用いて本発明の第2実施形態のプリンタ70について説明を行う。上記第1実施形態では、各ヘッドモジュール28A~28Cがそれぞれ記録紙13に記録を行う記録領域がオーバラップしていないが、プリンタ70では互いに隣接するヘッドモジュールの記録領域がオーバラップしている。なお、プリンタ70は、第1実施形態とは異なる記録ヘッド72を備える点を除けば、第1実施形態のプリンタ10と基本的には同じ構成である。このため、上記第1実施形態と機能・構成上同一のものについては、同一符号を付してその説明は省略する。 [Inkjet Printer of Second Embodiment]
Next, the printer 70 according to the second embodiment of the present invention will be described with reference to FIG. In the first embodiment, the recording areas where the
記録ヘッド72は、第1ヘッドモジュール73A、第2ヘッドモジュール73B、及び第3ヘッドモジュール73Cの3個(2個、あるいは4個以上でも可)の交換可能なヘッドモジュールと、枠体29とを備えている。各ヘッドモジュール73A~73Cは、主走査方向に沿って千鳥状に配列されている。各ヘッドモジュール73A~73Cの中の互いに隣接する2つのヘッドモジュールの端部はそれぞれオーバラップしている。各ヘッドモジュール73A~73Cは、それぞれ本発明の第1のヘッドモジュール、第2のヘッドモジュールに相当する。
The recording head 72 includes three replaceable head modules (two, or four or more) of the first head module 73A, the second head module 73B, and the third head module 73C, and the frame body 29. I have. The head modules 73A to 73C are arranged in a staggered pattern along the main scanning direction. The ends of two head modules adjacent to each other in each of the head modules 73A to 73C overlap each other. Each of the head modules 73A to 73C corresponds to a first head module and a second head module of the present invention, respectively.
第1ヘッドモジュール73A及び第2ヘッドモジュール73Bの一部のノズル27aは、主走査方向位置がオーバラップするように配置されている。また、第2ヘッドモジュール73B及び第3ヘッドモジュール73Cの一部のノズル27aも、主走査方向位置がオーバラップするように配置されている。これにより、第1ヘッドモジュール73Aの記録領域と第2ヘッドモジュール73Bの記録領域との一部がオーバラップするとともに、第2ヘッドモジュール73Bの記録領域と第3ヘッドモジュール73Cの記録領域との一部がオーバラップする。以下、記録領域同士のオーバラップ領域を「オーバラップ記録領域」といい、オーバラップ記録領域以外の記録領域を「非オーバラップ記録領域」という。
Some nozzles 27a of the first head module 73A and the second head module 73B are arranged so that the positions in the main scanning direction overlap. Further, some of the nozzles 27a of the second head module 73B and the third head module 73C are also arranged so that the positions in the main scanning direction overlap. As a result, a part of the recording area of the first head module 73A and the recording area of the second head module 73B overlap, and one of the recording area of the second head module 73B and the recording area of the third head module 73C. Parts overlap. Hereinafter, an overlap area between the recording areas is referred to as an “overlap recording area”, and a recording area other than the overlap recording area is referred to as a “non-overlapping recording area”.
図18に示すように、各ヘッドモジュール73A~73C間の記録位置の位置ずれは、図3に示した第1実施形態と同様に、各ヘッドモジュール73A~73Cの位置ずれや、図示は省略するがインク滴36の飛翔曲がりにより発生する。
As shown in FIG. 18, the positional deviation of the recording position between the head modules 73A to 73C is omitted as in the first embodiment shown in FIG. 3, and the positional deviation of the head modules 73A to 73C is omitted. Is generated by the flying bend of the ink droplet 36.
このような各ヘッドモジュール73A~73Cの記録位置の位置ずれ量ΔYの測定方法は、第1実施形態とは異なるテストチャート75(図19参照)を記録紙13に記録する点を除けば、第1実施形態で説明した測定方法と基本的に同じである。
Such a measurement method of the positional deviation amount ΔY of the recording position of each of the head modules 73A to 73C is the same as that of the first embodiment except that a test chart 75 (see FIG. 19) different from the first embodiment is recorded on the recording paper 13. This is basically the same as the measurement method described in the embodiment.
テストチャート記録制御部38は、第1実施形態と同様にテストチャートデータ35を画像ページメモリ18に出力するとともに、画像バッファメモリ書込制御部19、転送制御部22、及びヘッドドライバ23を作動させて、テストチャート75の記録を実行させる。ただし、この際に、テストチャート記録制御部38は、ノズル27aからのインク滴36の吐出は禁止(停止)する。すなわち、各ヘッドモジュール73A~73Cのノズル27のみで非オーバラップ記録領域にテストチャート75を記録する。
The test chart recording control unit 38 outputs the test chart data 35 to the image page memory 18 as in the first embodiment, and operates the image buffer memory write control unit 19, the transfer control unit 22, and the head driver 23. The test chart 75 is recorded. However, at this time, the test chart recording control unit 38 prohibits (stops) the ejection of the ink droplets 36 from the nozzles 27a. That is, the test chart 75 is recorded in the non-overlapping recording area only by the nozzles 27 of the head modules 73A to 73C.
図19に示すように、テストチャート75は、各ヘッドモジュール73A~73Cの各々のノズル27のみにより記録された第1ドットパターン群76A、第2ドットパターン群76B、及び第3ドットパターン群(図示は省略)を含む。第1ドットパターン群76Aは、主走査方向に長く延びた形状の第1ドットパターン77Aを、副走査方向にパターン間隔W1(繰り返し周期)で例えば150個記録したものである。
As shown in FIG. 19, the test chart 75 includes a first dot pattern group 76A, a second dot pattern group 76B, and a third dot pattern group (illustrated) recorded by only the nozzles 27 of the head modules 73A to 73C. Is omitted). The first dot pattern group 76A is obtained by recording, for example, 150 first dot patterns 77A having a shape extending in the main scanning direction at a pattern interval W1 (repetition period) in the sub scanning direction.
第2ドットパターン群76Bは、第1ドットパターン77Aと同形状の第2ドットパターン77Bを、副走査方向にパターン間隔W1(繰り返し周期)で例えば150個記録したものである。各第2ドットパターン50Bは、各第1ドットパターン50Aに対して、第1及び第2ヘッドモジュール73A,73Bの位置ずれに応じた分だけ副走査方向にずれて記録される。
In the second dot pattern group 76B, for example, 150 second dot patterns 77B having the same shape as the first dot pattern 77A are recorded at a pattern interval W1 (repetition cycle) in the sub-scanning direction. Each second dot pattern 50B is recorded with a deviation in the sub-scanning direction by an amount corresponding to the positional deviation of the first and second head modules 73A and 73B with respect to each first dot pattern 50A.
第3ドットパターン群も、第1ドットパターン77Aと同形状の第3ドットパターン(図示せず)を、副走査方向にパターン間隔W1で例えば150個記録したものである。なお、各ドットパターン77A,77Bは、本発明の第1のドットパターン、第2のドットパターンに相当する。
In the third dot pattern group, for example, 150 third dot patterns (not shown) having the same shape as the first dot pattern 77A are recorded at the pattern interval W1 in the sub-scanning direction. The dot patterns 77A and 77B correspond to the first dot pattern and the second dot pattern of the present invention.
このようにテストチャート75は、第1及び第2ドットパターン77A,77Bの主走査方向の長さが異なる点を除けば、第1実施形態のテストチャート31と同じである。従って、第1実施形態と同様に、CPU24の各部で図15及び図16に示したステップS21からステップS33までの処理を実行することで、各ヘッドモジュール73A~73Cの中の2つのヘッドモジュールの記録位置の位置ずれ量ΔYを算出することができる。また、この位置ずれ量ΔYの算出結果に基づき位置ずれ補正を行うことができる。これにより、上記第1実施形態と同様の効果が得られる。
Thus, the test chart 75 is the same as the test chart 31 of the first embodiment except that the lengths of the first and second dot patterns 77A and 77B in the main scanning direction are different. Therefore, as in the first embodiment, the processing from step S21 to step S33 shown in FIG. 15 and FIG. A positional deviation amount ΔY of the recording position can be calculated. In addition, it is possible to correct the positional deviation based on the calculation result of the positional deviation amount ΔY. Thereby, the effect similar to the said 1st Embodiment is acquired.
[第3実施形態のインクジェットプリンタ]
<インクジェットプリンタの構成>
次に、図20を用いて本発明の第3実施形態のプリンタ80について説明を行う。上記第2実施形態では、各ヘッドモジュール73A~73Cのノズル27のみでテストチャート75の記録を行う。これに対して、プリンタ80では、各ヘッドモジュール73A~73Cのノズル27aのみを用いて記録紙13のオーバラップ記録領域にテストチャート81を記録するとともに、このテストチャート81の読取画像に基づき位置ずれ量ΔYを測定する。 [Inkjet Printer of Third Embodiment]
<Inkjet printer configuration>
Next, the printer 80 according to the third embodiment of the present invention will be described with reference to FIG. In the second embodiment, the test chart 75 is recorded only by thenozzles 27 of the head modules 73A to 73C. On the other hand, in the printer 80, the test chart 81 is recorded in the overlap recording area of the recording paper 13 using only the nozzles 27a of the head modules 73A to 73C, and the positional deviation is based on the read image of the test chart 81. The quantity ΔY is measured.
<インクジェットプリンタの構成>
次に、図20を用いて本発明の第3実施形態のプリンタ80について説明を行う。上記第2実施形態では、各ヘッドモジュール73A~73Cのノズル27のみでテストチャート75の記録を行う。これに対して、プリンタ80では、各ヘッドモジュール73A~73Cのノズル27aのみを用いて記録紙13のオーバラップ記録領域にテストチャート81を記録するとともに、このテストチャート81の読取画像に基づき位置ずれ量ΔYを測定する。 [Inkjet Printer of Third Embodiment]
<Inkjet printer configuration>
Next, the printer 80 according to the third embodiment of the present invention will be described with reference to FIG. In the second embodiment, the test chart 75 is recorded only by the
プリンタ80は、第1実施形態とは異なるCPU83及び記録ヘッド72を備える点を除けば、第1実施形態のプリンタ10と基本的には同じ構成である。また、プリンタ80の記録ヘッド72は、第2実施形態の記録ヘッド72と同じ構成である。このため、上記第1及び第2実施形態と機能・構成上同一のものについては、同一符号を付してその説明は省略する。
The printer 80 has basically the same configuration as the printer 10 of the first embodiment except that the printer 80 includes a CPU 83 and a recording head 72 different from those of the first embodiment. Further, the recording head 72 of the printer 80 has the same configuration as the recording head 72 of the second embodiment. Therefore, the same functions and configurations as those of the first and second embodiments are denoted by the same reference numerals, and the description thereof is omitted.
<位置ずれ量の測定に係る構成>
CPU83は、メモリ34から位置ずれ量ΔYの測定や位置ずれ補正に係るプログラムを読み出して実行することで、テストチャート記録制御部(記録制御部)85、濃度プロファイルデータ算出部86、補完処理部87、繰り返し周期算出部88、積算濃度プロファイル算出部89、位置ずれ量算出部90、位置ずれ補正処理部45として機能する。 <Configuration for measuring the amount of misalignment>
TheCPU 83 reads out and executes a program related to the measurement of the positional deviation amount ΔY and the positional deviation correction from the memory 34, thereby executing a test chart recording control unit (recording control unit) 85, a density profile data calculation unit 86, and a complementary processing unit 87. , Function as a repetition period calculation unit 88, an integrated density profile calculation unit 89, a positional deviation amount calculation unit 90, and a positional deviation correction processing unit 45.
CPU83は、メモリ34から位置ずれ量ΔYの測定や位置ずれ補正に係るプログラムを読み出して実行することで、テストチャート記録制御部(記録制御部)85、濃度プロファイルデータ算出部86、補完処理部87、繰り返し周期算出部88、積算濃度プロファイル算出部89、位置ずれ量算出部90、位置ずれ補正処理部45として機能する。 <Configuration for measuring the amount of misalignment>
The
(テストチャートの記録)
テストチャート記録制御部85は、第1実施形態のテストチャート記録制御部38と同様に、テストチャートデータ35を画像ページメモリ18に出力するとともに、画像バッファメモリ書込制御部19、転送制御部22、及びヘッドドライバ23を作動させて、テストチャート81の記録を実行させる。ただし、この際に、テストチャート記録制御部85は、ノズル27からのインク滴36の吐出は禁止(停止)する。すなわち、各ヘッドモジュール73A~73Cのノズル27aのみでオーバラップ記録領域OLA(図21参照)にテストチャート81を記録する。 (Test chart recording)
The test chartrecording control unit 85 outputs the test chart data 35 to the image page memory 18 as well as the image buffer memory write control unit 19 and the transfer control unit 22, similarly to the test chart recording control unit 38 of the first embodiment. And the head driver 23 is operated to record the test chart 81. However, at this time, the test chart recording control unit 85 prohibits (stops) the ejection of the ink droplets 36 from the nozzles 27. That is, the test chart 81 is recorded in the overlap recording area OLA (see FIG. 21) only by the nozzles 27a of the head modules 73A to 73C.
テストチャート記録制御部85は、第1実施形態のテストチャート記録制御部38と同様に、テストチャートデータ35を画像ページメモリ18に出力するとともに、画像バッファメモリ書込制御部19、転送制御部22、及びヘッドドライバ23を作動させて、テストチャート81の記録を実行させる。ただし、この際に、テストチャート記録制御部85は、ノズル27からのインク滴36の吐出は禁止(停止)する。すなわち、各ヘッドモジュール73A~73Cのノズル27aのみでオーバラップ記録領域OLA(図21参照)にテストチャート81を記録する。 (Test chart recording)
The test chart
図21に示すように、テストチャート81は、第1ヘッドモジュール73Aのノズル27aにより記録される第1ドットパターン94Aと、第2ヘッドモジュール73Bのノズル27aにより記録される第2ドットパターン94Bと、第3ヘッドモジュール73Cのノズル27aにより記録される第3ドットパターン(図示せず)を含む。各ドットパターン94A,94Bは、主走査方向に長く延びた形状を有しており、本発明の第1のドットパターン、第2のドットパターンに相当する。第1及び第2ドットパターン94A,94Bは、それぞれ副走査方向にパターン間隔W1(繰り返し周期)で例えば150個記録される。また同時に、第1及び第2ドットパターン94A,94Bは、副走査方向に沿って交互に記録される。なお、図示は省略するが、第2ドットパターン94B及び第3ドットパターンについても同様である。
As shown in FIG. 21, the test chart 81 includes a first dot pattern 94A recorded by the nozzle 27a of the first head module 73A, a second dot pattern 94B recorded by the nozzle 27a of the second head module 73B, A third dot pattern (not shown) recorded by the nozzles 27a of the third head module 73C is included. Each of the dot patterns 94A and 94B has a shape extending in the main scanning direction and corresponds to the first dot pattern and the second dot pattern of the present invention. For example, 150 first and second dot patterns 94A and 94B are recorded at a pattern interval W1 (repetition period) in the sub-scanning direction. At the same time, the first and second dot patterns 94A and 94B are alternately recorded along the sub-scanning direction. Although not shown, the same applies to the second dot pattern 94B and the third dot pattern.
(濃度プロファイルの算出)
図22(A),(B)に示すように、濃度プロファイルデータ算出部86は、イメージスキャナ16から取得したテストチャート81の読取画像データ32を解析して、記録紙13のオーバラップ記録領域OLAの副走査方向の濃度変化を示す第3の濃度プロファイル96を算出する。この第3の濃度プロファイル96は、第1及び第2ドットパターン94A,94Bに対応する位置の濃度が高くなり、逆に第1及び第2ドットパターン94A,94Bの間に対応する位置の濃度が低くなる。なお、第1実施形態と同様に、イメージスキャナ16の副走査方向の解像度が低いので、第3の濃度プロファイル96の副走査方向の解像度も低くなる。濃度プロファイルデータ算出部86は、第3の濃度プロファイル96を補完処理部87へ出力する。 (Calculation of concentration profile)
As shown in FIGS. 22A and 22B, the density profiledata calculation unit 86 analyzes the read image data 32 of the test chart 81 acquired from the image scanner 16 and overlaps the recording area OLA of the recording paper 13. A third density profile 96 indicating the density change in the sub-scanning direction is calculated. In the third density profile 96, the density at the position corresponding to the first and second dot patterns 94A and 94B is high, and conversely, the density at the position corresponding to between the first and second dot patterns 94A and 94B is high. Lower. As in the first embodiment, since the resolution of the image scanner 16 in the sub-scanning direction is low, the resolution of the third density profile 96 in the sub-scanning direction is also low. The density profile data calculation unit 86 outputs the third density profile 96 to the complement processing unit 87.
図22(A),(B)に示すように、濃度プロファイルデータ算出部86は、イメージスキャナ16から取得したテストチャート81の読取画像データ32を解析して、記録紙13のオーバラップ記録領域OLAの副走査方向の濃度変化を示す第3の濃度プロファイル96を算出する。この第3の濃度プロファイル96は、第1及び第2ドットパターン94A,94Bに対応する位置の濃度が高くなり、逆に第1及び第2ドットパターン94A,94Bの間に対応する位置の濃度が低くなる。なお、第1実施形態と同様に、イメージスキャナ16の副走査方向の解像度が低いので、第3の濃度プロファイル96の副走査方向の解像度も低くなる。濃度プロファイルデータ算出部86は、第3の濃度プロファイル96を補完処理部87へ出力する。 (Calculation of concentration profile)
As shown in FIGS. 22A and 22B, the density profile
(補完処理)
図22(C)に示すように、補完処理部87は、第3の濃度プロファイル96に対して第1実施形態と同様の線形補完処理を施して、第3の濃度プロファイル96の副走査方向の解像度を例えば100dpiから10000dpiに高解像化する。第3の濃度プロファイル96を副走査方向に高解像度化することで、位置ずれ量ΔYをより高精度に算出することができる。補完処理部40は、高解像化した第3の濃度プロファイル96aを繰り返し周期算出部88へ出力する。 (Complementary processing)
As shown in FIG. 22C, thecomplement processing unit 87 performs linear complement processing similar to that of the first embodiment on the third density profile 96, and the third density profile 96 in the sub-scanning direction. The resolution is increased from, for example, 100 dpi to 10000 dpi. By increasing the resolution of the third density profile 96 in the sub-scanning direction, the positional deviation amount ΔY can be calculated with higher accuracy. The complement processing unit 40 outputs the high-resolution third density profile 96a to the repetition period calculation unit 88.
図22(C)に示すように、補完処理部87は、第3の濃度プロファイル96に対して第1実施形態と同様の線形補完処理を施して、第3の濃度プロファイル96の副走査方向の解像度を例えば100dpiから10000dpiに高解像化する。第3の濃度プロファイル96を副走査方向に高解像度化することで、位置ずれ量ΔYをより高精度に算出することができる。補完処理部40は、高解像化した第3の濃度プロファイル96aを繰り返し周期算出部88へ出力する。 (Complementary processing)
As shown in FIG. 22C, the
図23(A)に示すように、繰り返し周期算出部88は、第3の濃度プロファイル96に基づき、互いに隣り合う第1及び第2ドットパターン94A,94Bに対応する濃度変化の繰り返し周期を示す繰り返し周期長W3を算出する。この繰り返し周期長W3は、図8及び図9に示した第1実施形態の算出方法と同様に、仮の繰り返し周期毎の仮積算濃度プロファイルを算出し、各仮積算濃度プロファイルの最大値を比較した結果に基づき算出可能である。なお、ここでいう各仮積算濃度プロファイルの「最大値」とは、図23(C)に示す2つのピーク値の合計値である。繰り返し周期算出部88は、繰り返し周期長W3の算出結果を前述の第3の濃度プロファイル96aと共に積算濃度プロファイル算出部89へ出力する。
As shown in FIG. 23A, the repetition period calculation unit 88 is based on the third density profile 96 and indicates the repetition period of the density change corresponding to the first and second dot patterns 94A and 94B adjacent to each other. The period length W3 is calculated. As for the repetition cycle length W3, in the same manner as the calculation method of the first embodiment shown in FIGS. 8 and 9, a temporary integrated concentration profile for each temporary repetition cycle is calculated, and the maximum values of the temporary integrated concentration profiles are compared. It can be calculated based on the result. Here, the “maximum value” of each provisional integrated density profile is a total value of two peak values shown in FIG. The repetition cycle calculation unit 88 outputs the calculation result of the repetition cycle length W3 to the integrated concentration profile calculation unit 89 together with the above-described third concentration profile 96a.
図23(B)に示すように、積算濃度プロファイル算出部89は、第3の濃度プロファイル96aのデータを繰り返し周期長W3毎に積算平均して、第3の積算濃度プロファイル98を算出する。積算濃度プロファイル算出部89は、第3の積算濃度プロファイル98を位置ずれ量算出部90へ出力する。
As shown in FIG. 23B, the integrated concentration profile calculation unit 89 calculates the third integrated concentration profile 98 by averaging the data of the third concentration profile 96a for each repetition cycle length W3. The integrated density profile calculation unit 89 outputs the third integrated density profile 98 to the positional deviation amount calculation unit 90.
図23(C)に示すように、位置ずれ量算出部90は、第3の積算濃度プロファイル98を解析して、第1ヘッドモジュール73Aの記録位置と第2ヘッドモジュール73Bの記録位置との位置ずれ量ΔYを算出する。以下、第3の積算濃度プロファイル98に基づく位置ずれ量ΔYの算出方法について具体的に説明を行う。
As shown in FIG. 23C, the positional deviation amount calculation unit 90 analyzes the third integrated density profile 98 to determine the position between the recording position of the first head module 73A and the recording position of the second head module 73B. A deviation amount ΔY is calculated. Hereinafter, a method for calculating the positional deviation amount ΔY based on the third integrated density profile 98 will be specifically described.
図24及び図25に示すように、位置ずれ量算出部90は、第3の積算濃度プロファイル98のデータの閾値Thを、上記第1実施形態で説明した式(2)を用いて決定する。そして、位置ずれ量算出部90は、第3の積算濃度プロファイル98のデータの中で閾値Thを上回るデータを抽出する(ステップS50)。
As shown in FIGS. 24 and 25, the misregistration amount calculation unit 90 determines the threshold value Th of the data of the third integrated density profile 98 using the equation (2) described in the first embodiment. Then, the positional deviation amount calculation unit 90 extracts data that exceeds the threshold value Th from the data of the third integrated density profile 98 (step S50).
次いで、位置ずれ量算出部90は、閾値Thを上回るデータのX値(積算位相値:繰り返し周期内の位置)の平均値を求め、この平均値よりもX値が小さいデータを「グループ1」とし、逆に平均値よりも大きいデータを「グループ2」とする(ステップS51)。本実施形態では、グループ1は第1ドットパターン94Aに対応するデータであり、グループ2は第2ドットパターン94Bに対応するデータである。
Next, the positional deviation amount calculation unit 90 obtains an average value of the X values (integrated phase value: position within the repetition period) of the data exceeding the threshold value Th, and sets the data whose X value is smaller than the average value as “group 1”. Conversely, data larger than the average value is set as “group 2” (step S51). In the present embodiment, group 1 is data corresponding to the first dot pattern 94A, and group 2 is data corresponding to the second dot pattern 94B.
位置ずれ量算出部90は、グループ1のデータに対し近似曲線(例えば2次関数:y=ax2+bx+c、図25中の実線で表示)を演算し、その近似曲線のピーク位置XP1を算出する(ステップS52)。このピーク位置XP1は、例えばXP1=-b÷(2×a)に基づき算出される。
Positional deviation amount calculating section 90, the data to the approximate curve (e.g. quadratic function: y = ax 2 + bx + c, indicated by solid line in FIG. 25) of the group 1 is calculated, and calculates the peak position X P1 of the approximate curve (Step S52). The peak position X P1 is calculated based on, for example, X P1 = −b ÷ (2 × a).
また、位置ずれ量算出部90は、ピーク位置XP1の算出時と同様に、グループ2のデータに対し近似曲線を演算し、その近似曲線のピーク位置XP2を算出する(ステップS53)。このピーク位置XP2も例えばXP2=-b÷(2×a)に基づき算出される。
Similarly to the calculation of the peak position X P1 , the positional deviation amount calculation unit 90 calculates an approximate curve for the data of group 2, and calculates the peak position X P2 of the approximate curve (step S53). This peak position X P2 is also calculated based on, for example, X P2 = −b ÷ (2 × a).
次いで、位置ずれ量算出部90は、ピーク位置XP1と、ピーク位置XP2と、イメージスキャナ16の解像度Rmと、高解像度化した時の解像度Rhとに基づき、下記の式(5)、(6)を用いて位置ずれ量ΔYを算出する(ステップS54)。すなわち、第1ドットパターン94Aに対応するピーク位置XP1と第2ドットパターン94Bに対応するピーク位置XP2との差分に基づき、位置ずれ量ΔYを算出する。位置ずれ量算出部90は、位置ずれ量ΔYの算出結果を位置ずれ補正処理部45に出力する。なお、位置ずれ量ΔYは、図18に示した設計位置からのずれ量と、千鳥配置によるずれ量、及び、テストチャート記録時に各ヘッドモジュールに設定されたインク吐出タイミングの誤差、とを含む記録位置の位置ずれ量である。
Then, positional deviation amount calculating section 90, the peak position X P1, the peak position X P2, and resolution R m of the image scanner 16, based on the resolution R h when the high resolution, the following formula (5) , (6) is used to calculate the positional deviation amount ΔY (step S54). That is, based on the difference between the peak position X P2 of the peak position X P1 corresponding to the first dot pattern 94A corresponding to the second dot pattern 94B, and calculates the positional deviation amount [Delta] Y. The positional deviation amount calculation unit 90 outputs the calculation result of the positional deviation amount ΔY to the positional deviation correction processing unit 45. The positional deviation amount ΔY includes a deviation amount from the design position shown in FIG. 18, a deviation amount due to the staggered arrangement, and an error in ink ejection timing set in each head module during test chart recording. This is the amount of positional deviation.
(XP1-XP2)÷Rh×Rm→p(pixl/スキャナ解像度)・・・(5)
(X P1 −X P2 ) ÷ R h × R m → p (pixl / scanner resolution) (5)
p÷Rm×25400→ΔY・・・(6)
p ÷ R m × 25400 → ΔY (6)
<第3実施形態のインクジェットプリンタの作用>
次に、上記構成のプリンタ80の作用、特に位置ずれ量ΔYの測定処理について説明を行う。なお、位置ずれ補正処理を含む画像記録処理については第1実施形態と同じであるのでここでは説明を省略する。ここでは第1及び第2ヘッドモジュール73A,73B間の記録位置の位置ずれ量ΔYを測定する場合について説明を行う。 <Operation of Inkjet Printer of Third Embodiment>
Next, the operation of the printer 80 configured as described above, particularly the measurement process of the positional deviation amount ΔY will be described. Note that the image recording process including the misregistration correction process is the same as that in the first embodiment, and a description thereof will be omitted here. Here, the case where the positional deviation amount ΔY of the recording position between the first and second head modules 73A and 73B is measured will be described.
次に、上記構成のプリンタ80の作用、特に位置ずれ量ΔYの測定処理について説明を行う。なお、位置ずれ補正処理を含む画像記録処理については第1実施形態と同じであるのでここでは説明を省略する。ここでは第1及び第2ヘッドモジュール73A,73B間の記録位置の位置ずれ量ΔYを測定する場合について説明を行う。 <Operation of Inkjet Printer of Third Embodiment>
Next, the operation of the printer 80 configured as described above, particularly the measurement process of the positional deviation amount ΔY will be described. Note that the image recording process including the misregistration correction process is the same as that in the first embodiment, and a description thereof will be omitted here. Here, the case where the positional deviation amount ΔY of the recording position between the first and
図26に示すように、プリンタ80の電源がONされた場合や.、第1及び第2ヘッドモジュール73A,73Bの少なくとも一方が新たに記録ヘッド72に装着された場合などには、CPU83の各部85~90が作動して、位置ずれ量ΔYの測定処理を開始する(ステップS20)。
As shown in FIG. 26, when the printer 80 is turned on, or when at least one of the first and second head modules 73A and 73B is newly attached to the recording head 72, each part of the CPU 83 is used. 85 to 90 are actuated to start the measurement process of the positional deviation amount ΔY (step S20).
テストチャート記録制御部85の制御の下、第1実施形態と同様に、テストチャートデータ35に基づく1回の打滴分の印字データが逐次にヘッドドライバ23へ転送される。ヘッドドライバ23は、印字データに基づき、各ヘッドモジュール73A~73Cの各ノズル27aのインク吐出を制御する。そして、搬送機構12により記録紙13を副走査方向に搬送しつつ、各ヘッドモジュール73A~73Cによりインク滴36を打滴することで、オーバラップ記録領域OLAにテストチャート81が記録される(ステップS58、記録ステップ)。
Under the control of the test chart recording control unit 85, similarly to the first embodiment, print data for one droplet ejection based on the test chart data 35 is sequentially transferred to the head driver 23. The head driver 23 controls ink ejection from the nozzles 27a of the head modules 73A to 73C based on the print data. The test chart 81 is recorded in the overlap recording area OLA by ejecting the ink droplets 36 by the head modules 73A to 73C while transporting the recording paper 13 in the sub-scanning direction by the transport mechanism 12. S58, recording step).
テストチャート81の記録後、第1実施形態と同様に、テストチャート81がイメージスキャナ16により読み取られ、読取画像データ32がイメージスキャナ16から濃度プロファイルデータ算出部86へ出力される(ステップS59、読取ステップ)。
After recording the test chart 81, the test chart 81 is read by the image scanner 16 and the read image data 32 is output from the image scanner 16 to the density profile data calculation unit 86, as in the first embodiment (step S59, read). Step).
濃度プロファイルデータ算出部86は、読取画像データ32の入力後、位置ずれ量ΔYの測定対象となる2つのヘッドモジュール、すなわち、第1及び第2ヘッドモジュール73A,73Bを同定する(ステップS60)。
After the input of the read image data 32, the density profile data calculation unit 86 identifies two head modules, that is, the first and second head modules 73A and 73B that are to be measured for the positional deviation amount ΔY (step S60).
次いで、濃度プロファイルデータ算出部86は、読取画像データ32を解析して、図22(B)に示したような第3の濃度プロファイル96を算出する(ステップS61、濃度プロファイル算出ステップ)。この第3の濃度プロファイル96は、濃度プロファイルデータ算出部86から補完処理部87へ出力される。
Next, the density profile data calculation unit 86 analyzes the read image data 32 and calculates a third density profile 96 as shown in FIG. 22B (step S61, density profile calculation step). The third density profile 96 is output from the density profile data calculation unit 86 to the complement processing unit 87.
補完処理部87は、第3の濃度プロファイル96に対して線形補完処理を施すことにより、図22(C)に示したような高解像度化された第3の濃度プロファイル96aを生成する(ステップS62、補完処理ステップ)。この第3の濃度プロファイル96aは、補完処理部87から繰り返し周期算出部88へ出力される。
The complement processing unit 87 performs a linear complement process on the third density profile 96, thereby generating a third density profile 96a having a higher resolution as shown in FIG. 22C (step S62). , Complementary processing step). The third density profile 96a is output from the complement processing unit 87 to the repetition period calculation unit 88.
繰り返し周期算出部88は、図8に示したステップS1からステップS9までの処理と基本的に同じ処理を実行して、仮の繰り返し周期毎の仮積算濃度プロファイルを算出し、各仮積算濃度プロファイルの最大値(グループ1とグループ2の合計値)の大きさを比較する。これにより、図23(A)に示したような繰り返し周期長W3が繰り返し周期算出部41により算出される(ステップS63、繰り返し周期算出ステップ)。この繰り返し周期長W3の算出結果は第3の濃度プロファイル96aと共に、繰り返し周期算出部88から積算濃度プロファイル算出部89へ出力される。
The repetition cycle calculation unit 88 executes basically the same processing as the processing from step S1 to step S9 shown in FIG. 8, calculates temporary integrated concentration profiles for each temporary repetition cycle, and each temporary integrated concentration profile. The maximum values (total values of group 1 and group 2) are compared. Thereby, the repetition period length W3 as shown in FIG. 23A is calculated by the repetition period calculation unit 41 (step S63, repetition period calculation step). The calculation result of the repetition period length W3 is output from the repetition period calculation unit 88 to the integrated concentration profile calculation unit 89 together with the third concentration profile 96a.
積算濃度プロファイル算出部89は、図23(B)に示したように、第3の濃度プロファイル96aを繰り返し周期長W3毎に積算平均して、第3の積算濃度プロファイル98を算出する(ステップS64、積算濃度プロファイル算出ステップ)。この第3の積算濃度プロファイル98は、積算濃度プロファイル算出部89から位置ずれ量算出部90へ出力される。
As shown in FIG. 23B, the integrated concentration profile calculation unit 89 calculates the third integrated concentration profile 98 by averaging the third concentration profile 96a every repetition cycle length W3 (step S64). , Integrated concentration profile calculation step). The third integrated density profile 98 is output from the integrated density profile calculation unit 89 to the positional deviation amount calculation unit 90.
位置ずれ量算出部90は、図24に示したステップS50からステップS54までの処理を実行する。これにより、位置ずれ量算出部90は、図23(C)及び図25に示したように、ピーク位置XP1とピーク位置XP2との差分に基づき、第1及び第2ヘッドモジュール73A,73B間の記録位置の位置ずれ量ΔYを算出する(ステップS65)。以上で位置ずれ量測定処理が完了する。
The positional deviation amount calculation unit 90 executes the processing from step S50 to step S54 shown in FIG. Thereby, positional deviation amount calculating section 90, as shown in FIG. 23 (C) and FIG. 25, based on the difference between the peak position X P1 and the peak position X P2, the first and second head modules 73A, 73B A positional deviation amount ΔY between the recording positions is calculated (step S65). This completes the positional deviation amount measurement process.
<第3実施形態のインクジェットプリンタの作用効果>
このように本発明の第3実施形態では、オーバラップ記録領域OLAに記録されたテストチャート81を解析することで、第1実施形態のようにヘッドモジュール毎の基準位置ずれ量Δy1,Δy2を算出することなく、位置ずれ量ΔYを直接算出することができる。これにより、位置ずれ量ΔYの算出に要する時間を短縮することができる。また、第1実施形態と同様に、高解像度のイメージセンサを用いることなく、ヘッドモジュール間の記録位置の位置ずれ量を低コストかつ高精度に測定することができる。 <Operational Effect of Inkjet Printer of Third Embodiment>
As described above, in the third embodiment of the present invention, the reference position deviation amounts Δy1 and Δy2 for each head module are calculated by analyzing thetest chart 81 recorded in the overlap recording area OLA as in the first embodiment. Without this, the positional deviation amount ΔY can be directly calculated. Thereby, the time required for calculating the positional deviation amount ΔY can be shortened. Further, similarly to the first embodiment, it is possible to measure the displacement amount of the recording position between the head modules with low cost and high accuracy without using a high resolution image sensor.
このように本発明の第3実施形態では、オーバラップ記録領域OLAに記録されたテストチャート81を解析することで、第1実施形態のようにヘッドモジュール毎の基準位置ずれ量Δy1,Δy2を算出することなく、位置ずれ量ΔYを直接算出することができる。これにより、位置ずれ量ΔYの算出に要する時間を短縮することができる。また、第1実施形態と同様に、高解像度のイメージセンサを用いることなく、ヘッドモジュール間の記録位置の位置ずれ量を低コストかつ高精度に測定することができる。 <Operational Effect of Inkjet Printer of Third Embodiment>
As described above, in the third embodiment of the present invention, the reference position deviation amounts Δy1 and Δy2 for each head module are calculated by analyzing the
[他のインクジェットプリンタの構成例]
次に、図1に示したプリンタ10の一例であるプリンタ100の構成例について説明する。 [Other inkjet printer configuration examples]
Next, a configuration example of theprinter 100 that is an example of the printer 10 illustrated in FIG. 1 will be described.
次に、図1に示したプリンタ10の一例であるプリンタ100の構成例について説明する。 [Other inkjet printer configuration examples]
Next, a configuration example of the
図27に示すように、プリンタ100は、描画ドラム170に保持された記録紙13に、記録ヘッド250(CMYKのインクジェットヘッド172M,172K,172C,172Yにより構成)から複数色のインクを打滴して所望のカラー画像を形成する直描方式のインクジェットプリンタである。プリンタ100は、インクの打滴前に記録紙13上に処理液(ここでは凝集処理液)を付与し、処理液とインク液を反応させて記録紙13上に画像形成を行う2液反応(凝集)方式が適用される。
As shown in FIG. 27, the printer 100 ejects ink of a plurality of colors from the recording head 250 (configured by CMYK ink jet heads 172M, 172K, 172C, and 172Y) onto the recording paper 13 held on the drawing drum 170. This is a direct drawing type ink jet printer that forms a desired color image. The printer 100 applies a processing liquid (here, an aggregating processing liquid) to the recording paper 13 before the ink is ejected, and reacts the processing liquid and the ink liquid to form an image on the recording paper 13 (a two-liquid reaction ( The aggregation method is applied.
プリンタ100は、主として、給紙部112、処理液付与部114、記録部116、乾燥部118、定着部120、及び排紙部122を備えて構成される。
The printer 100 mainly includes a paper feeding unit 112, a processing liquid application unit 114, a recording unit 116, a drying unit 118, a fixing unit 120, and a paper discharge unit 122.
(給紙部)
給紙部112には、枚葉紙である記録紙13が積層されている。給紙部112の給紙トレイ150から記録紙13が一枚ずつ処理液付与部114に給紙される。記録紙13として、枚葉紙(カット紙)を用いているが、連続用紙(ロール紙)から必要なサイズに切断して給紙する構成も可能である。 (Paper Feeder)
In thepaper feeding unit 112, recording paper 13 which is a sheet is stacked. The recording sheets 13 are fed one by one from the sheet feeding tray 150 of the sheet feeding unit 112 to the processing liquid applying unit 114. As the recording paper 13, a sheet (cut paper) is used. However, a configuration in which continuous paper (roll paper) is cut to a required size and fed is also possible.
給紙部112には、枚葉紙である記録紙13が積層されている。給紙部112の給紙トレイ150から記録紙13が一枚ずつ処理液付与部114に給紙される。記録紙13として、枚葉紙(カット紙)を用いているが、連続用紙(ロール紙)から必要なサイズに切断して給紙する構成も可能である。 (Paper Feeder)
In the
(処理液付与部)
処理液付与部114は、記録紙13の表面に処理液を付与する機構である。処理液は、記録部116で付与されるインク中の色材(本例では顔料)を凝集させる色材凝集剤を含んでおり、この処理液とインクとが接触することによって、インクは色材と溶媒との分離が促進される。 (Processing liquid application part)
The processingliquid application unit 114 is a mechanism that applies a processing liquid to the surface of the recording paper 13. The treatment liquid contains a color material aggregating agent that agglomerates the color material (pigment in this example) applied in the recording unit 116, and the ink comes into contact with the treatment liquid when the treatment liquid comes into contact with the ink. And the solvent are promoted.
処理液付与部114は、記録紙13の表面に処理液を付与する機構である。処理液は、記録部116で付与されるインク中の色材(本例では顔料)を凝集させる色材凝集剤を含んでおり、この処理液とインクとが接触することによって、インクは色材と溶媒との分離が促進される。 (Processing liquid application part)
The processing
処理液付与部114は、給紙胴152、処理液ドラム154、及び処理液塗布装置156を備えている。処理液ドラム154は、その外周面に爪形状の保持手段(グリッパー)155を備え、この保持手段155の爪と処理液ドラム154の周面の間に記録紙13を挟み込むことによって記録紙13の先端を保持できるようになっている。処理液ドラム154の外周面に吸引孔を設け、吸引孔から吸引を行う吸引手段を接続してもよい。これにより記録紙13を処理液ドラム154の周面に密着保持することができる。
The processing liquid application unit 114 includes a paper feed cylinder 152, a processing liquid drum 154, and a processing liquid coating device 156. The processing liquid drum 154 includes a claw-shaped holding means (gripper) 155 on the outer peripheral surface thereof, and the recording paper 13 is sandwiched between the claw of the holding means 155 and the peripheral surface of the processing liquid drum 154. The tip can be held. A suction hole may be provided on the outer peripheral surface of the treatment liquid drum 154, and a suction unit that performs suction from the suction hole may be connected. As a result, the recording paper 13 can be held in close contact with the peripheral surface of the treatment liquid drum 154.
処理液ドラム154の周面に対向して処理液塗布装置156が配置される。処理液塗布装置156は、処理液が貯留された処理液容器と、この処理液容器の処理液に一部が浸漬されたアニックスローラと、アニックスローラと処理液ドラム154上の記録紙13に圧接されて計量後の処理液を記録紙13に転移するゴムローラとで構成される。この処理液塗布装置156によれば、処理液を計量しながら記録紙13の表面に塗布することができる。本実施形態では、ローラによる塗布方式を適用した構成を例示したが、これに限定されず、例えば、スプレー方式、インクジェット方式などの各種方式を適用することも可能である。
A treatment liquid coating device 156 is disposed to face the peripheral surface of the treatment liquid drum 154. The treatment liquid coating device 156 includes a treatment liquid container in which the treatment liquid is stored, an anix roller partially immersed in the treatment liquid in the treatment liquid container, and the recording paper 13 on the anix roller and the treatment liquid drum 154. And a rubber roller that transfers the measured processing liquid to the recording paper 13. According to the processing liquid application device 156, the processing liquid can be applied to the surface of the recording paper 13 while being measured. In the present embodiment, the configuration in which the application method using the roller is exemplified, but the present invention is not limited to this. For example, various methods such as a spray method and an ink jet method can be applied.
処理液が付与された記録紙13は、処理液ドラム154から中間搬送部126を介して記録部116の描画ドラム170へ受け渡される。
The recording paper 13 to which the processing liquid is applied is transferred from the processing liquid drum 154 to the drawing drum 170 of the recording unit 116 via the intermediate conveyance unit 126.
(記録部)
記録部116は、描画ドラム170、用紙抑えローラ174、及びインクジェットヘッド250(インクジェットヘッド172M,172K,172C,172Y)を備えている。描画ドラム170は、処理液ドラム154と同様に、その外周面に爪形状の保持手段(グリッパー)171を備える。 (Recording part)
Therecording unit 116 includes a drawing drum 170, a paper sheet pressing roller 174, and an ink jet head 250 (ink jet heads 172M, 172K, 172C, 172Y). Similar to the treatment liquid drum 154, the drawing drum 170 includes a claw-shaped holding means (gripper) 171 on the outer peripheral surface thereof.
記録部116は、描画ドラム170、用紙抑えローラ174、及びインクジェットヘッド250(インクジェットヘッド172M,172K,172C,172Y)を備えている。描画ドラム170は、処理液ドラム154と同様に、その外周面に爪形状の保持手段(グリッパー)171を備える。 (Recording part)
The
インクジェットヘッド172M,172K,172C,172Yは、それぞれ記録紙13における画像形成領域の最大幅に対応する長さを有するフルライン型のインクジェット方式のインクジェットヘッドであり、そのインク吐出面には、画像形成領域の全幅にわたってインク吐出用のノズルが複数配列されたノズル列が形成されている。各インクジェットヘッド172M,172K,172C,172Yは、記録紙13の搬送方向(描画ドラム170の回転方向、第2の方向)と直交する方向(第1の方向)に延びるようにして設置される。
The inkjet heads 172M, 172K, 172C, and 172Y are full-line inkjet inkjet heads each having a length corresponding to the maximum width of the image formation region on the recording paper 13, and image formation is performed on the ink ejection surface. A nozzle row in which a plurality of nozzles for ink ejection are arranged over the entire width of the region is formed. Each inkjet head 172M, 172K, 172C, 172Y is installed so as to extend in a direction (first direction) orthogonal to the conveyance direction of the recording paper 13 (the rotation direction of the drawing drum 170, the second direction).
描画ドラム170上に密着保持された記録紙13の表面に向かって、この表面側に配置されたインクジェットヘッド250の各インクジェットヘッド172M,172K,172C,172Yから対応する色インクの液滴が吐出されることにより、処理液付与部114で予め記録面に付与された処理液にインクが接触し、インク中に分散する色材(顔料)が凝集され、色材凝集体が形成される。これにより、記録紙13上での色材流れなどが防止され、記録紙13の表面に画像が形成される。
Corresponding color ink droplets are ejected from the inkjet heads 172M, 172K, 172C, and 172Y of the inkjet head 250 arranged on the surface side toward the surface of the recording paper 13 held in close contact with the drawing drum 170. As a result, the ink comes into contact with the treatment liquid applied to the recording surface in advance by the treatment liquid application unit 114, and the color material (pigment) dispersed in the ink is aggregated to form a color material aggregate. Thereby, the color material flow on the recording paper 13 is prevented, and an image is formed on the surface of the recording paper 13.
すなわち、描画ドラム170によって記録紙13を一定の速度で搬送し、この搬送方向について、記録紙13と各インクジェットヘッド172M,172K,172C,172Yを相対的に移動させる動作を1回行うだけで(即ち1回の副走査で)、記録紙13の表面の画像形成領域に画像を記録することができる。
That is, the recording paper 13 is transported at a constant speed by the drawing drum 170, and the operation of relatively moving the recording paper 13 and the respective ink jet heads 172M, 172K, 172C, 172Y in this transport direction is performed only once ( That is, an image can be recorded in the image forming area on the surface of the recording paper 13 in one sub-scanning.
画像が形成された記録紙13は、描画ドラム170から中間搬送部128を介して乾燥部118の乾燥ドラム176へ受け渡される。
The recording paper 13 on which the image is formed is transferred from the drawing drum 170 to the drying drum 176 of the drying unit 118 via the intermediate conveyance unit 128.
(乾燥部)
乾燥部118は、色材凝集作用により分離された溶媒に含まれる水分を乾燥させる機構であり、乾燥ドラム176、及び溶媒乾燥装置178を備えている。乾燥ドラム176は、処理液ドラム154と同様に、その外周面に爪形状の保持手段(グリッパー)177を備え、この保持手段177によって記録紙13の先端を保持できるようになっている。 (Drying part)
The dryingunit 118 is a mechanism for drying moisture contained in the solvent separated by the color material aggregating action, and includes a drying drum 176 and a solvent drying device 178. Similar to the treatment liquid drum 154, the drying drum 176 includes a claw-shaped holding means (gripper) 177 on the outer peripheral surface thereof, and the holding means 177 can hold the leading end of the recording paper 13.
乾燥部118は、色材凝集作用により分離された溶媒に含まれる水分を乾燥させる機構であり、乾燥ドラム176、及び溶媒乾燥装置178を備えている。乾燥ドラム176は、処理液ドラム154と同様に、その外周面に爪形状の保持手段(グリッパー)177を備え、この保持手段177によって記録紙13の先端を保持できるようになっている。 (Drying part)
The drying
溶媒乾燥装置178は、乾燥ドラム176の外周面に対向する位置に配置され、複数のハロゲンヒータ180と、各ハロゲンヒータ180の間にそれぞれ配置された温風噴出ノズル182とで構成される。乾燥部118で乾燥処理が行われた記録紙13は、乾燥ドラム176から中間搬送部130を介して定着部120の定着ドラム184へ受け渡される。
The solvent drying device 178 is disposed at a position facing the outer peripheral surface of the drying drum 176, and includes a plurality of halogen heaters 180 and hot air jet nozzles 182 respectively disposed between the halogen heaters 180. The recording paper 13 that has been dried by the drying unit 118 is transferred from the drying drum 176 to the fixing drum 184 of the fixing unit 120 via the intermediate conveyance unit 130.
(定着部)
定着部120は、定着ドラム184、ハロゲンヒータ186、定着ローラ188、及びインラインセンサ190で構成される。定着ドラム184は、処理液ドラム154と同様に、その外周面に爪形状の保持手段(グリッパー)185を備え、この保持手段185によって記録紙13の先端を保持できるようになっている。 (Fixing part)
The fixingunit 120 includes a fixing drum 184, a halogen heater 186, a fixing roller 188, and an inline sensor 190. Like the processing liquid drum 154, the fixing drum 184 includes a claw-shaped holding unit (gripper) 185 on its outer peripheral surface, and the holding unit 185 can hold the leading end of the recording paper 13.
定着部120は、定着ドラム184、ハロゲンヒータ186、定着ローラ188、及びインラインセンサ190で構成される。定着ドラム184は、処理液ドラム154と同様に、その外周面に爪形状の保持手段(グリッパー)185を備え、この保持手段185によって記録紙13の先端を保持できるようになっている。 (Fixing part)
The fixing
定着ドラム184の回転により、記録紙13の記録面(両面)に対して、ハロゲンヒータ186による予備加熱と、定着ローラ188による定着処理と、インラインセンサ190による検査が行われる。
As the fixing drum 184 rotates, the recording surface (both sides) of the recording paper 13 is preheated by the halogen heater 186, fixed by the fixing roller 188, and inspected by the inline sensor 190.
定着ローラ188は、乾燥させたインクを加熱加圧することによってインク中の自己分散性ポリマー微粒子を溶着し、インクを被膜化させるためのローラ部材であり、記録紙13を加熱加圧するように構成される。具体的には、定着ローラ188は、定着ドラム184に対して圧接するように配置されており、定着ドラム184との間でニップローラを構成するようになっている。記録紙13は、定着ローラ188と定着ドラム184との間に挟まれ、所定のニップ圧でニップされ、定着処理が行われる。
The fixing roller 188 is a roller member that heats and pressurizes the dried ink to weld the self-dispersing polymer fine particles in the ink to form a film of the ink, and is configured to heat and press the recording paper 13. The Specifically, the fixing roller 188 is disposed so as to be in pressure contact with the fixing drum 184 and constitutes a nip roller with the fixing drum 184. The recording paper 13 is sandwiched between the fixing roller 188 and the fixing drum 184 and nipped with a predetermined nip pressure, and a fixing process is performed.
また、定着ローラ188は、ハロゲンランプなどを組み込んだ加熱ローラによって構成され、所定の温度に制御される。
The fixing roller 188 is constituted by a heating roller incorporating a halogen lamp or the like, and is controlled to a predetermined temperature.
インラインセンサ(読取部)190は、記録紙13に形成された画像を読み取り、画像の濃度、画像の欠陥などを検出するための手段であり、CCDラインセンサなどが適用される。このインラインセンサ190は、前述のイメージスキャナ16と基本的に同じものである。
The in-line sensor (reading unit) 190 is a means for reading an image formed on the recording paper 13 and detecting image density, image defect, and the like, and a CCD line sensor or the like is applied. The inline sensor 190 is basically the same as the image scanner 16 described above.
定着部120によれば、乾燥部118で形成された薄層の画像層内のラテックス粒子が定着ローラ188によって加熱加圧されて溶融されるので、記録紙13にインクを固定定着させることができる。また、定着ドラム184の表面温度は50℃以上に設定されている。
According to the fixing unit 120, the latex particles in the thin image layer formed by the drying unit 118 are heated and pressurized by the fixing roller 188 and melted, so that the ink can be fixed and fixed on the recording paper 13. . The surface temperature of the fixing drum 184 is set to 50 ° C. or higher.
なお、高沸点溶媒及びポリマー微粒子(熱可塑性樹脂粒子)を含んだインクに代えて、UV露光にて重合硬化可能なモノマー成分を含有したインクを用いてもよい。この場合、プリンタ100は、ヒートローラによる熱圧定着部(定着ローラ188)の代わりに、記録紙13上のインクにUV光を露光するUV露光部を備える。このように、UV硬化性樹脂などの活性光線硬化性樹脂を含んだインクを用いる場合には、加熱定着の定着ローラ188に代えて、UVランプや紫外線LD(レーザダイオード)アレイなど、活性光線を照射する手段が設けられる。
In addition, instead of the ink containing the high boiling point solvent and the polymer fine particles (thermoplastic resin particles), an ink containing a monomer component that can be polymerized and cured by UV exposure may be used. In this case, the printer 100 includes a UV exposure unit that exposes ink on the recording paper 13 to UV light instead of the heat-pressure fixing unit (fixing roller 188) using a heat roller. As described above, when ink containing an actinic ray curable resin such as a UV curable resin is used, an actinic ray such as a UV lamp or an ultraviolet LD (laser diode) array is used instead of the fixing roller 188 for heat fixing. Means for irradiating are provided.
(排紙部)
定着部120に続いて排紙部122が設けられている。排紙部122は、排出トレイ192を備えており、この排出トレイ192と定着部120の定着ドラム184との間に、渡し胴194、搬送ベルト196、張架ローラ198が設けられている。記録紙13は、渡し胴194により搬送ベルト196に送られ、排出トレイ192に排出される。搬送ベルト196による用紙搬送機構の詳細は図示しないが、印刷後の記録紙13は無端状の搬送ベルト196間に渡されたバー(不図示)のグリッパーによって用紙先端部が保持され、搬送ベルト196の回転によって排出トレイ192の上方に運ばれてくる。 (Output section)
Subsequent to the fixingunit 120, a paper discharge unit 122 is provided. The paper discharge unit 122 includes a discharge tray 192, and a transfer drum 194, a conveyance belt 196, and a stretching roller 198 are provided between the discharge tray 192 and the fixing drum 184 of the fixing unit 120. The recording paper 13 is sent to the transport belt 196 by the transfer drum 194 and discharged to the discharge tray 192. Although the details of the paper transport mechanism by the transport belt 196 are not shown in the drawing, the recording paper 13 after printing is held at the front end of the paper by a gripper (not shown) gripped between the endless transport belt 196, and the transport belt 196. Is carried above the discharge tray 192.
定着部120に続いて排紙部122が設けられている。排紙部122は、排出トレイ192を備えており、この排出トレイ192と定着部120の定着ドラム184との間に、渡し胴194、搬送ベルト196、張架ローラ198が設けられている。記録紙13は、渡し胴194により搬送ベルト196に送られ、排出トレイ192に排出される。搬送ベルト196による用紙搬送機構の詳細は図示しないが、印刷後の記録紙13は無端状の搬送ベルト196間に渡されたバー(不図示)のグリッパーによって用紙先端部が保持され、搬送ベルト196の回転によって排出トレイ192の上方に運ばれてくる。 (Output section)
Subsequent to the fixing
また、図示は省略するが、本例のプリンタ100には、上記構成の他、各インクジェットヘッド172M,172K,172C,172Yにインクを供給するインク貯蔵/装填部、処理液付与部114に対して処理液を供給する手段を備えるとともに、各インクジェットヘッド172M,172K,172C,172Yのクリーニング(ノズル面のワイピング、パージ、ノズル吸引等)を行うヘッドメンテナンス部や、用紙搬送路上における記録紙13の位置を検出する位置検出センサ、装置各部の温度を検出する温度センサなどを備えている。
Although not shown, the printer 100 according to the present embodiment has an ink storage / loading unit that supplies ink to the inkjet heads 172M, 172K, 172C, and 172Y and a processing liquid application unit 114 in addition to the above-described configuration. A head maintenance unit that includes means for supplying a processing liquid and performs cleaning (nozzle surface wiping, purging, nozzle suction, etc.) of each of the inkjet heads 172M, 172K, 172C, and 172Y, and the position of the recording paper 13 on the paper transport path A position detection sensor for detecting the temperature, a temperature sensor for detecting the temperature of each part of the apparatus, and the like.
〔インクジェットヘッドの構造〕
次に、記録部116に具備されるインクジェットヘッド172M,172K,172C,172Yの構造について説明する。なお、各色に対応するインクジェットヘッド172M,172K,172C,172Yの構造は共通しているので、以下、これらを代表してインクジェットヘッド250として説明を行う。 [Inkjet head structure]
Next, the structure of the inkjet heads 172M, 172K, 172C, 172Y provided in therecording unit 116 will be described. In addition, since the structures of the inkjet heads 172M, 172K, 172C, and 172Y corresponding to the respective colors are common, the following description will be made on the basis of these as the inkjet head 250.
次に、記録部116に具備されるインクジェットヘッド172M,172K,172C,172Yの構造について説明する。なお、各色に対応するインクジェットヘッド172M,172K,172C,172Yの構造は共通しているので、以下、これらを代表してインクジェットヘッド250として説明を行う。 [Inkjet head structure]
Next, the structure of the inkjet heads 172M, 172K, 172C, 172Y provided in the
図28に示すように、インクジェットヘッド250は、インク吐出口であるノズル251と、各ノズル251と連通する圧力室252と、不図示の共通流路と各圧力室252とを連通させる供給口254等からなる複数のインク室ユニット(記録素子単位としての液滴吐出素子)253をマトリクス配置した構造を有する。これによりインクジェットヘッド250は、インクジェットヘッド250の長手方向である主走査方向に沿って並ぶように投影される実質的なノズル間隔(符号Pnを付して図示する投影ノズルピッチ)の高密度化を達成している。
As shown in FIG. 28, the inkjet head 250 includes a nozzle 251 that is an ink discharge port, a pressure chamber 252 that communicates with each nozzle 251, and a supply port 254 that communicates a common channel (not shown) and each pressure chamber 252. A plurality of ink chamber units (droplet discharge elements as recording element units) 253 are arranged in a matrix. As a result, the ink jet head 250 increases the density of the substantial nozzle interval (projection nozzle pitch shown by the symbol Pn) projected so as to be aligned along the main scanning direction that is the longitudinal direction of the ink jet head 250. Have achieved.
ノズル251と連通する圧力室252は、その平面形状が概略正方形となっており、対角線上の両隅部の一方にノズル251が設けられ、他方に供給口254が設けられている。なお、圧力室252の形状は本例に限定されず、平面形状が四角形(菱形、長方形など)、五角形、六角形その他の多角形、円形、楕円形など、多様な形態があり得る。
The planar shape of the pressure chamber 252 communicating with the nozzle 251 is approximately square, the nozzle 251 is provided at one of the diagonal corners, and the supply port 254 is provided at the other. Note that the shape of the pressure chamber 252 is not limited to this example, and the planar shape may have various forms such as a quadrangle (rhombus, rectangle, etc.), a pentagon, a hexagon, other polygons, a circle, and an ellipse.
ノズル251及び圧力室252等からなるインク室ユニット253を、主走査方向に沿う行方向及び主走査方向に対して直交しない一定の角度θ(0°<θ<90°)を有する斜めの列方向(符号Saを付して図示する。)に沿って一定の配列パターンでマトリクス配列させることにより、本例の高密度ノズルヘッドが実現されている。
The ink chamber unit 253 including the nozzles 251 and the pressure chambers 252 is arranged in a row direction along the main scanning direction and an oblique column direction having a constant angle θ (0 ° <θ <90 °) that is not orthogonal to the main scanning direction. The high-density nozzle head of the present example is realized by arranging the matrix in a fixed arrangement pattern along (shown with reference symbol Sa).
主走査方向に対してある角度θをなす方向に沿ってインク室ユニット253を一定のピッチgで複数配列する構造により、主走査方向に並ぶように投影されたノズルの投影ノズルピッチPnはg×cosθとなる。このため主走査方向については、各ノズル251が一定のピッチPnで直線状に配列されたものと等価的に取り扱うことができる。このような構成により、主走査方向に並ぶように投影されるノズル列は、1インチ当たり1200個(1200ノズル/インチ)におよぶ高密度配置を実現することが可能になる。
With a structure in which a plurality of ink chamber units 253 are arranged at a constant pitch g along a direction that forms an angle θ with respect to the main scanning direction, the projected nozzle pitch Pn of the nozzles projected in the main scanning direction is g ×. cos θ. For this reason, in the main scanning direction, each nozzle 251 can be handled equivalently as a linear arrangement with a constant pitch Pn. With such a configuration, it is possible to realize a high-density arrangement of 1200 nozzle rows per inch (1200 nozzles / inch) projected so as to be aligned in the main scanning direction.
図29に示すように、インクジェットヘッド250は、ノズル251が形成されたノズルプレート251Aと、圧力室252や共通流路255等の流路が形成された流路板252P等を積層接合した構造から成る。
As shown in FIG. 29, the inkjet head 250 has a structure in which a nozzle plate 251A in which nozzles 251 are formed and a flow path plate 252P in which flow paths such as a pressure chamber 252 and a common flow path 255 are formed are laminated and joined. Become.
流路板252Pは、圧力室252の側壁部を構成するとともに、共通流路255から圧力室252にインクを導く個別供給路の絞り部(最狭窄部)としての供給口254を形成する流路形成部材である。なお、説明の便宜上、図29では簡略的に図示しているが、流路板252Pは一枚又は複数の基板を積層した構造である。
The flow path plate 252P forms a side wall of the pressure chamber 252 and a flow path that forms a supply port 254 as a narrowed portion (most narrowed portion) of an individual supply path that guides ink from the common flow path 255 to the pressure chamber 252. It is a forming member. For convenience of explanation, the flow path plate 252P has a structure in which one or a plurality of substrates are stacked, although it is illustrated in a simplified manner in FIG.
ノズルプレート251A及び流路板252Pは、シリコンを材料として半導体製造プロセスによって所要の形状に加工することが可能である。
The nozzle plate 251A and the flow path plate 252P can be processed into a required shape by a semiconductor manufacturing process using silicon as a material.
共通流路255はインク供給源たるインクタンク(不図示)と連通しており、インクタンクから供給されるインクは共通流路255を介して各圧力室252に供給される。
The common channel 255 communicates with an ink tank (not shown) as an ink supply source, and the ink supplied from the ink tank is supplied to each pressure chamber 252 via the common channel 255.
圧力室252の一部の面(図29において天面)を構成する振動板256には、個別電極257を備えた圧電アクチュエータ258が接合されている。本例の振動板256は、圧電アクチュエータ258の下部電極に相当する共通電極259として機能するニッケル(Ni)導電層付きのシリコン(Si)から成り、各圧力室252に対応して配置される圧電アクチュエータ258の共通電極を兼ねる。なお、樹脂などの非導電性材料によって振動板を形成する態様も可能であり、この場合は、振動板部材の表面に金属などの導電材料による共通電極層が形成される。また、ステンレス鋼(SUS)など、金属(導電性材料)によって共通電極を兼ねる振動板を構成してもよい。
A piezoelectric actuator 258 including an individual electrode 257 is joined to a diaphragm 256 constituting a part of the pressure chamber 252 (the top surface in FIG. 29). The diaphragm 256 of this example is made of silicon (Si) with a nickel (Ni) conductive layer functioning as a common electrode 259 corresponding to the lower electrode of the piezoelectric actuator 258, and is arranged corresponding to each pressure chamber 252. It also serves as a common electrode for the actuator 258. It is also possible to form the diaphragm with a non-conductive material such as resin. In this case, a common electrode layer made of a conductive material such as metal is formed on the surface of the diaphragm member. Moreover, you may comprise the diaphragm which serves as a common electrode with metals (conductive material), such as stainless steel (SUS).
個別電極257に駆動電圧を印加することによって圧電アクチュエータ258が変形して圧力室252の容積が変化し、これに伴う圧力変化によりノズル251からインクが吐出される。インク吐出後、圧電アクチュエータ258が元の状態に戻る際、共通流路255から供給口254を通って新しいインクが圧力室252に再充填される。
By applying a driving voltage to the individual electrode 257, the piezoelectric actuator 258 is deformed and the volume of the pressure chamber 252 is changed, and ink is ejected from the nozzle 251 due to the pressure change accompanying this. When the piezoelectric actuator 258 returns to its original state after ink ejection, new ink is refilled into the pressure chamber 252 from the common flow channel 255 through the supply port 254.
本例では、圧胴搬送方式が適用されるプリンタ100を例示したが、記録紙13の搬送方式は圧胴搬送方式に限定されず、搬送ベルト上に記録紙13を吸着保持して搬送するベルト搬送方式や他の搬送方式を適宜選択することも可能である。
In this example, the printer 100 to which the impression cylinder conveyance method is applied is illustrated, but the conveyance method of the recording paper 13 is not limited to the impression cylinder conveyance method, and the belt that sucks and holds the recording paper 13 on the conveyance belt. It is also possible to select a transport method and other transport methods as appropriate.
ノズル251の配列形態は図示の例に限定されず、様々なノズル配置構造を適用できる。例えば、一列の直線配列、V字状のノズル配列、V字状配列を繰り返し単位とするジグザク状(W字状など)のような折れ線状のノズル配列なども可能である。
The arrangement form of the nozzles 251 is not limited to the illustrated example, and various nozzle arrangement structures can be applied. For example, a linear array of lines, a V-shaped nozzle array, a zigzag-shaped nozzle array (such as a W-shape) having a V-shaped array as a repeating unit, and the like are also possible.
[その他]
上記各実施形態では、互いに隣接するヘッドモジュール間の記録位置の位置ずれ量ΔYを算出しているが、隣接してない任意のヘッドモジュール間の記録位置の位置ずれ量ΔYも同様の方法で算出することができる。なお、位置ずれ量の測定を行うヘッドモジュール間の主走査方向の間隔が広がるほど、記録ヘッド72の傾き(記録紙13面に垂直な方向を軸とする記録ヘッド72の回転変位)、記録紙13の搬送速度の誤差、記録紙13の変形、イメージスキャナ16の読み取りの誤差等が位置ずれ量の測定結果に影響を及ぼす。このため、位置ずれ量ΔYの測定を行う測定対象として互いに隣接するヘッドモジュールを選択することで、より高精度に位置ずれ量ΔYを測定することができる。 [Others]
In each of the above embodiments, the positional deviation amount ΔY of the recording position between the head modules adjacent to each other is calculated. However, the positional deviation amount ΔY of the recording position between any non-adjacent head modules is also calculated in the same manner. can do. Note that as the interval in the main scanning direction between the head modules for measuring the amount of positional deviation increases, the inclination of the recording head 72 (rotational displacement of the recording head 72 about the direction perpendicular to the surface of the recording paper 13), the recording paper The error of theconveyance speed 13, the deformation of the recording paper 13, the reading error of the image scanner 16, etc. affect the measurement result of the positional deviation amount. For this reason, the positional deviation amount ΔY can be measured with higher accuracy by selecting the head modules adjacent to each other as the measurement target for measuring the positional deviation amount ΔY.
上記各実施形態では、互いに隣接するヘッドモジュール間の記録位置の位置ずれ量ΔYを算出しているが、隣接してない任意のヘッドモジュール間の記録位置の位置ずれ量ΔYも同様の方法で算出することができる。なお、位置ずれ量の測定を行うヘッドモジュール間の主走査方向の間隔が広がるほど、記録ヘッド72の傾き(記録紙13面に垂直な方向を軸とする記録ヘッド72の回転変位)、記録紙13の搬送速度の誤差、記録紙13の変形、イメージスキャナ16の読み取りの誤差等が位置ずれ量の測定結果に影響を及ぼす。このため、位置ずれ量ΔYの測定を行う測定対象として互いに隣接するヘッドモジュールを選択することで、より高精度に位置ずれ量ΔYを測定することができる。 [Others]
In each of the above embodiments, the positional deviation amount ΔY of the recording position between the head modules adjacent to each other is calculated. However, the positional deviation amount ΔY of the recording position between any non-adjacent head modules is also calculated in the same manner. can do. Note that as the interval in the main scanning direction between the head modules for measuring the amount of positional deviation increases, the inclination of the recording head 72 (rotational displacement of the recording head 72 about the direction perpendicular to the surface of the recording paper 13), the recording paper The error of the
上記各実施形態では、補完処理部40,87にて各濃度プロファイルに対して線形補完処理を行っているが、各濃度プロファイルを副走査方向に高解像化できれば補完方法は特に限定されない。また、各濃度プロファイルの繰り返し周期長W2,W3の算出方法も前述の図8及び図9に示した方法に特に限定されず、公知の各種方法を用いてもよい。
In each of the above embodiments, linear interpolation processing is performed on each density profile by the complement processing units 40 and 87, but the complement method is not particularly limited as long as each density profile can be highly resolved in the sub-scanning direction. Further, the calculation method of the repetition period lengths W2 and W3 of each concentration profile is not particularly limited to the method shown in FIGS. 8 and 9, and various known methods may be used.
上記各実施形態では、パターン間隔W1(周期長)を任意に設定しているが、このパターン間隔W1はイメージスキャナ16のイメージセンサの副走査方向の解像度の非整数倍であることが好ましい。これにより、副走査方向に配列された各ドットパターンのそれぞれに対するイメージセンサの読取位置が徐々にずれるので、例えば、図6(B)の第1の濃度プロファイル53Aにおいて副走査方向の様々な測定点でのデータが得られる。その結果、図7(B)に示した第1の積算濃度プロファイル56Aのより正確な波形が得られるので、ピーク位置を正確に定めることができる。
In each of the above embodiments, the pattern interval W1 (period length) is arbitrarily set, but this pattern interval W1 is preferably a non-integer multiple of the resolution of the image scanner 16 in the sub-scanning direction of the image sensor. As a result, the reading position of the image sensor with respect to each of the dot patterns arranged in the sub-scanning direction gradually shifts. For example, various measurement points in the sub-scanning direction in the first density profile 53A in FIG. The data at is obtained. As a result, a more accurate waveform of the first integrated concentration profile 56A shown in FIG. 7B can be obtained, so that the peak position can be accurately determined.
上記各実施形態では、第1~第3の濃度プロファイル53A,53B,96をそれぞれ繰り返し周期長W2,W3毎に積算平均して第1~第3の積算濃度プロファイル56A,56B,98を算出しているが、平均処理を行わずに、各濃度プロファイル53A,53B,96をそれぞれ繰り返し周期長W2,W3毎に積算して第1~第3積算濃度プロファイルを算出してもよい。
In each of the above embodiments, the first to third density profiles 53A, 53B, and 96 are integrated and averaged for each repetition period length W2 and W3 to calculate the first to third density profiles 56A, 56B, and 98, respectively. However, the first to third integrated density profiles may be calculated by integrating the density profiles 53A, 53B, and 96 for each of the repetition cycle lengths W2 and W3 without performing the averaging process.
上記各実施形態では、各ドットパターンをそれぞれ副走査方向に150個形成しているが、各ドットパターンのそれぞれの数は適宜増減してもよい。なお、各ドットパターンの数が多いほど、各濃度プロファイルのデータ数が増えるので位置ずれ量ΔYをより高精度に測定することができる。
In each of the above embodiments, 150 dot patterns are formed in the sub-scanning direction, but the number of each dot pattern may be increased or decreased as appropriate. As the number of dot patterns increases, the number of data of each density profile increases, so that the positional deviation amount ΔY can be measured with higher accuracy.
上記実施形態の記録ヘッドはCMYKの4色の記録を行うが、記録する色は特に限定はされない。また、固定された記録ヘッドに対して記録紙を移動させる代わりに、記録紙に対して記録ヘッドを移動させる例えばシャトルヘッドタイプの記録ヘッドを備えるインクジェットプリンタにも本発明を適用することができる。
The recording head of the above embodiment records four colors of CMYK, but the recording color is not particularly limited. The present invention can also be applied to an inkjet printer including a shuttle head type recording head that moves the recording head relative to the recording paper instead of moving the recording paper relative to the fixed recording head.
上記各実施形態では、グラフィック印刷用のインクジェットプリンタへの適用を例に説明したが、本発明の適用範囲はこの例に限定されない。例えば、電子回路の配線パターンを描画する配線描画装置、各種デバイスの製造装置、吐出用の機能性液体として樹脂液を用いるレジスト印刷装置、カラーフィルター製造装置、マテリアルデポジション用の材料を用いて微細構造物を形成する微細構造物形成装置など、液状機能性材料を用いて様々な形状やパターンを描画するインクジェットプリンタに広く適用できる。
In the above embodiments, application to an inkjet printer for graphic printing has been described as an example, but the scope of application of the present invention is not limited to this example. For example, a wiring drawing apparatus for drawing a wiring pattern of an electronic circuit, a manufacturing apparatus for various devices, a resist printing apparatus that uses a resin liquid as a functional liquid for ejection, a color filter manufacturing apparatus, and a material deposition material. The present invention can be widely applied to inkjet printers that draw various shapes and patterns using a liquid functional material, such as a fine structure forming apparatus that forms a structure.
上記各実施形態では、本発明の画像記録装置としてインクジェットプリンタを例に説明したが、サーマル素子を記録素子とする記録ヘッドを複数備えた熱転写記録装置、LED素子を記録素子とする記録ヘッドを複数備えたLED電子写真プリンタなどの各種画像記録装置に本発明を適用することができる。
In each of the above embodiments, an inkjet printer has been described as an example of the image recording apparatus of the present invention. However, a thermal transfer recording apparatus including a plurality of recording heads using thermal elements as recording elements, and a plurality of recording heads using LED elements as recording elements. The present invention can be applied to various image recording apparatuses such as an LED electrophotographic printer provided.
10,70,80…インクジェットプリンタ
14,72…記録ヘッド
16…イメージスキャナ
24…CPU
28A,28B,28C…第1、第2、第3ヘッドモジュール
39,86…濃度プロファイルデータ算出部
40,87…補完処理部
41,88…繰り返し周期算出部
42,89…積算濃度プロファイル算出部
44,90…位置ずれ量算出部
50A,50B…第1、第2ドットパターン
53A,53B…第1、第2の濃度プロファイル
56A,56B…第1、第2の積算濃度プロファイル
73A,73B,73C…第1、第2、第3ヘッドモジュール
77A,77B…第1、第2ドットパターン
94A,94B…第1、第2ドットパターン
96…第3の濃度プロファイル
98…第3の積算濃度プロファイル 10, 70, 80 ...Inkjet printer 14, 72 ... Recording head 16 ... Image scanner 24 ... CPU
28A, 28B, 28C ... 1st, 2nd, 3rd head module 39, 86 ... Density profile data calculation part 40, 87 ... Complement processing part 41, 88 ... Repeat period calculation part 42, 89 ... Integrated density profile calculation part 44 , 90... Misregistration amount calculation unit 50A, 50B... First and second dot patterns 53A, 53B... First and second density profiles 56A, 56B... First and second integrated density profiles 73A, 73B, 73C. First, second and third head modules 77A, 77B... First and second dot patterns 94A, 94B... First and second dot patterns 96... Third density profile 98.
14,72…記録ヘッド
16…イメージスキャナ
24…CPU
28A,28B,28C…第1、第2、第3ヘッドモジュール
39,86…濃度プロファイルデータ算出部
40,87…補完処理部
41,88…繰り返し周期算出部
42,89…積算濃度プロファイル算出部
44,90…位置ずれ量算出部
50A,50B…第1、第2ドットパターン
53A,53B…第1、第2の濃度プロファイル
56A,56B…第1、第2の積算濃度プロファイル
73A,73B,73C…第1、第2、第3ヘッドモジュール
77A,77B…第1、第2ドットパターン
94A,94B…第1、第2ドットパターン
96…第3の濃度プロファイル
98…第3の積算濃度プロファイル 10, 70, 80 ...
28A, 28B, 28C ... 1st, 2nd,
Claims (10)
- 複数の記録素子を有するヘッドモジュールを第1の方向に複数配列してなる記録ヘッドと、記録媒体とを、前記第1の方向と直交する第2の方向に相対移動させながら、前記複数のヘッドモジュールのうちの第1のヘッドモジュール及び第2のヘッドモジュールの各々により、前記第1の方向に延びた形状のドットパターンを前記第2の方向に予め定めた間隔で前記記録媒体上に記録させる記録ステップと、
前記記録ステップで前記記録媒体上に記録された前記ドットパターンを光学的に読み取る読取ステップと、
前記読取ステップで読み取られた前記ドットパターンの読取画像の前記第2の方向の濃度変化を示す濃度プロファイルを算出する濃度プロファイル算出ステップと、
前記濃度プロファイル算出ステップの算出結果に基づき、前記濃度プロファイル内での各前記ドットパターンに対応する波形の繰り返し周期を算出する繰り返し周期算出ステップと、
前記繰り返し周期算出ステップの算出結果に基づき、前記濃度プロファイルのデータを、前記繰り返し周期毎に積算して積算濃度プロファイルを算出する積算濃度プロファイル算出ステップと、
前記積算濃度プロファイル算出ステップの算出結果に基づき、前記積算濃度プロファイルにおける各前記ドットパターンにそれぞれ対応する波形のピーク位置を求め、各前記ピーク位置に基づいて前記第1のヘッドモジュールの記録位置と前記第2のヘッドモジュールの記録位置との前記第2の方向の位置ずれ量を算出する位置ずれ量算出ステップと、
を有する位置ずれ量測定方法。 The plurality of heads while relatively moving a recording head formed by arranging a plurality of head modules having a plurality of recording elements in a first direction and a recording medium in a second direction orthogonal to the first direction. A dot pattern having a shape extending in the first direction is recorded on the recording medium at a predetermined interval in the second direction by each of the first head module and the second head module of the modules. Recording step;
A reading step for optically reading the dot pattern recorded on the recording medium in the recording step;
A density profile calculating step for calculating a density profile indicating a density change in the second direction of the read image of the dot pattern read in the reading step;
Based on the calculation result of the density profile calculation step, a repetition period calculation step for calculating a repetition period of a waveform corresponding to each dot pattern in the density profile;
Based on the calculation result of the repetition cycle calculation step, an integrated concentration profile calculation step of calculating the integrated concentration profile by integrating the data of the concentration profile for each repetition cycle;
Based on the calculation result of the integrated density profile calculating step, a peak position of a waveform corresponding to each of the dot patterns in the integrated density profile is obtained, and the recording position of the first head module and the recording position of the first head module are calculated based on each peak position. A positional deviation amount calculating step for calculating a positional deviation amount in the second direction from the recording position of the second head module;
A method for measuring the amount of misalignment. - 前記濃度プロファイル算出ステップは、前記濃度プロファイルとして、前記第1のヘッドモジュールにより記録される第1のドットパターンに対応する第1の濃度プロファイルと、前記第2のヘッドモジュールにより記録される第2のドットパターンに対応する第2の濃度プロファイルとをそれぞれ算出し、
前記繰り返し周期算出ステップは、前記第1及び第2の濃度プロファイルに基づき、前記繰り返し周期として、前記第1のドットパターンに対応する波形の第1の繰り返し周期と、前記第2のドットパターンに対応する波形の繰り返し周期を示す第2の繰り返し周期とをそれぞれ算出し、
前記積算濃度プロファイル算出ステップは、前記積算濃度プロファイルとして、前記第1の濃度プロファイルのデータを前記第1の繰り返し周期毎に積算してなる第1の積算濃度プロファイルと、前記第2の濃度プロファイルのデータを前記第2の繰り返し周期毎に積算してなる第2の積算濃度プロファイルとをそれぞれ算出し、
前記位置ずれ量算出ステップは、前記第1の積算濃度プロファイルにおける前記第1のドットパターンに対応する波形の第1のピーク位置と、前記第2の積算濃度プロファイルにおける前記第2のドットパターンに対応する波形の第2のピーク位置とをそれぞれ求め、前記第1のピーク位置と第2のピーク位置との差分に基づき前記位置ずれ量を算出する請求項1記載の位置ずれ量測定方法。 The density profile calculating step includes a first density profile corresponding to a first dot pattern recorded by the first head module and a second density recorded by the second head module as the density profile. Calculating a second density profile corresponding to the dot pattern,
The repetition period calculating step corresponds to the first repetition period of the waveform corresponding to the first dot pattern and the second dot pattern as the repetition period based on the first and second density profiles. A second repetition period indicating a repetition period of the waveform to be calculated,
In the integrated concentration profile calculating step, as the integrated concentration profile, a first integrated concentration profile obtained by integrating the data of the first concentration profile for each first repetition period, and the second concentration profile Calculating a second integrated concentration profile obtained by integrating data for each second repetition period,
The positional deviation amount calculating step corresponds to a first peak position of a waveform corresponding to the first dot pattern in the first integrated density profile and the second dot pattern in the second integrated density profile. The positional deviation amount measuring method according to claim 1, wherein a second peak position of a waveform to be calculated is obtained, and the positional deviation amount is calculated based on a difference between the first peak position and the second peak position. - 前記第1のヘッドモジュールと前記第2のヘッドモジュールとが前記第1の方向において互いに隣接している請求項2記載の位置ずれ量測定方法。 3. The positional deviation amount measuring method according to claim 2, wherein the first head module and the second head module are adjacent to each other in the first direction.
- 前記第1及び第2のヘッドモジュールの各々の前記記録媒体上の記録領域の一部が互いにオーバラップしているオーバラップ記録領域である場合に、
前記記録ステップは、前記オーバラップ領域以外の記録領域に記録を行う前記第1及び第2のヘッドモジュールの各々の前記記録素子によりそれぞれ前記第1のドットパターン、前記第2のドットパターンを記録する請求項3記載の位置ずれ量測定方法。 When a part of the recording area on the recording medium of each of the first and second head modules is an overlapping recording area,
In the recording step, the first dot pattern and the second dot pattern are recorded by the recording elements of the first and second head modules that perform recording in a recording area other than the overlap area, respectively. The positional deviation amount measuring method according to claim 3. - 前記第1及び第2のヘッドモジュールの各々の前記記録媒体上の記録領域の一部が互いにオーバラップしているオーバラップ記録領域である場合に、
前記記録ステップは、前記ドットパターンとして、前記オーバラップ記録領域内に記録を行う前記第1及び第2のヘッドモジュールの前記記録素子により第1のドットパターンと第2のドットパターンとを前記第2の方向に個別に予め定めた間隔でかつ交互に記録し、
前記濃度プロファイル算出ステップは、前記濃度プロファイルとして、前記第1のドットパターン及び第2のドットパターンに対応する第3の濃度プロファイルを算出し、
前記繰り返し周期算出ステップは、前記第3の濃度プロファイル内での前記第1及び第2のドットパターンに対応する波形の繰り返し周期を示す第3の繰り返し周期を算出し、
前記積算濃度プロファイル算出ステップは、前記積算濃度プロファイルとして、前記第3の濃度プロファイルのデータを前記第3の繰り返し周期毎に積算してなる第3の積算濃度プロファイルを算出し、
前記位置ずれ量算出ステップは、前記第3の積算濃度プロファイルにおける前記第1のドットパターンに対応する波形の第1のピーク位置と、前記第2のドットパターンに対応する波形の第2のピーク位置とをそれぞれ求め、前記第1のピーク位置と第2のピーク位置との差分に基づき前記位置ずれ量を算出する請求項1記載の位置ずれ量測定方法。 When a part of the recording area on the recording medium of each of the first and second head modules is an overlapping recording area,
In the recording step, the first dot pattern and the second dot pattern are recorded as the dot pattern by the recording elements of the first and second head modules that perform recording in the overlap recording area. Record alternately at predetermined intervals in the direction of
The density profile calculating step calculates a third density profile corresponding to the first dot pattern and the second dot pattern as the density profile;
The repetition period calculating step calculates a third repetition period indicating a repetition period of a waveform corresponding to the first and second dot patterns in the third density profile;
The integrated concentration profile calculating step calculates a third integrated concentration profile obtained by integrating the data of the third concentration profile every third repetition period as the integrated concentration profile;
The positional deviation amount calculating step includes a first peak position of a waveform corresponding to the first dot pattern in the third integrated density profile, and a second peak position of a waveform corresponding to the second dot pattern. The positional deviation amount measuring method according to claim 1, wherein the positional deviation amount is calculated based on a difference between the first peak position and the second peak position. - 前記繰り返し周期算出ステップは、
前記濃度プロファイルのデータを、仮の繰り返し周期毎に積算して仮の積算濃度プロファイルを算出する仮積算濃度プロファイル算出ステップと、
前記仮の繰り返し周期を変化させながら、前記仮積算濃度プロファイル算出ステップを繰り返し実行して、前記仮の繰り返し周期毎の前記仮の積算濃度プロファイルを算出する繰り返しステップと、
前記仮の繰り返し周期毎の前記仮の積算濃度プロファイルの最大値を比較して、前記最大値が最大となる前記仮の繰り返し周期を前記繰り返し周期として決定する決定ステップと、を有する請求項1から5のいずれか1項記載の位置ずれ量測定方法。 The repetition period calculating step includes:
Temporary integrated concentration profile calculating step of calculating the temporary integrated concentration profile by integrating the concentration profile data for each temporary repetition period;
Repetitively executing the provisional integrated concentration profile calculating step while changing the provisional repetition period, and calculating the provisional integrated concentration profile for each provisional repetition period;
A determination step of comparing the maximum value of the temporary integrated concentration profile for each temporary repetition period and determining the temporary repetition period that maximizes the maximum value as the repetition period. 6. The positional deviation amount measuring method according to any one of 5 above. - 前記濃度プロファイル算出ステップが算出する濃度プロファイルに対して補完処理を施して、当該濃度プロファイルの前記第2の方向の解像度を高くする補完処理ステップ、
をさらに有し、
前記繰り返し周期算出ステップは、前記補完処理を施された濃度プロファイルに基づいて繰り返し周期を算出する請求項1から6のいずれか1項記載の位置ずれ量測定方法。 A complementary processing step of performing a complementary process on the density profile calculated by the density profile calculating step to increase the resolution of the density profile in the second direction;
Further comprising
The positional deviation amount measuring method according to claim 1, wherein the repetition period calculating step calculates a repetition period based on the density profile subjected to the complementing process. - 前記第1の方向は、前記記録媒体の幅方向である請求項1から7のいずれか1項記載の位置ずれ量測定方法。 The method of measuring a displacement amount according to any one of claims 1 to 7, wherein the first direction is a width direction of the recording medium.
- 前記記録ヘッドは、インクジェットヘッドである請求項1から8のいずれか1項記載の位置ずれ量測定方法。 The method of measuring a displacement amount according to any one of claims 1 to 8, wherein the recording head is an inkjet head.
- 複数の記録素子を有するヘッドモジュールを第1の方向に複数配列してなる記録ヘッドと、
前記記録ヘッドと記録媒体とを前記第1の方向と直交する第2の方向に相対移動させる相対移動部と、
前記記録ヘッドと前記相対移動部とを制御して、前記複数のヘッドモジュールのうちの第1のヘッドモジュール及び第2のヘッドモジュールの各々により、前記第1の方向に延びた形状のドットパターンを前記第2の方向に予め定めた間隔で前記記録媒体上に記録させる記録制御部と、
前記第1のヘッドモジュール及び前記第2のヘッドモジュールによりそれぞれ前記記録媒体上に記録された前記ドットパターンを光学的に読み取る読取部と、
前記読取部で読み取られた前記ドットパターンの読取画像の前記第2の方向の濃度変化を示す濃度プロファイルを算出する濃度プロファイル算出部と、
前記濃度プロファイル算出部の算出結果に基づき、前記濃度プロファイル内での各前記ドットパターンに対応する波形の繰り返し周期を算出する繰り返し周期算出部と、
前記繰り返し周期算出部の算出結果に基づき、前記濃度プロファイルのデータを、前記繰り返し周期毎に積算して積算濃度プロファイルを算出する積算濃度プロファイル算出部と、
前記積算濃度プロファイル算出部の算出結果に基づき、前記積算濃度プロファイルにおける各前記ドットパターンにそれぞれ対応する波形のピーク位置を求め、各前記ピーク位置に基づいて前記第1のヘッドモジュールの記録位置と前記第2のヘッドモジュールの記録位置との前記第2の方向の位置ずれ量を算出する位置ずれ量算出部と、
を備える画像記録装置。 A recording head comprising a plurality of head modules each having a plurality of recording elements arranged in a first direction;
A relative movement unit that relatively moves the recording head and the recording medium in a second direction orthogonal to the first direction;
A dot pattern having a shape extending in the first direction is controlled by each of the first head module and the second head module of the plurality of head modules by controlling the recording head and the relative movement unit. A recording control unit for recording on the recording medium at predetermined intervals in the second direction;
A reading unit that optically reads the dot patterns recorded on the recording medium by the first head module and the second head module, respectively.
A density profile calculation unit that calculates a density profile indicating a density change in the second direction of the read image of the dot pattern read by the reading unit;
Based on the calculation result of the density profile calculation unit, a repetition period calculation unit that calculates a repetition period of a waveform corresponding to each dot pattern in the density profile;
Based on the calculation result of the repetition period calculation unit, an integrated concentration profile calculation unit that calculates the integrated concentration profile by integrating the data of the concentration profile for each repetition period;
Based on the calculation result of the integrated density profile calculation unit, a peak position of a waveform corresponding to each of the dot patterns in the integrated density profile is obtained, and the recording position of the first head module and the recording position of the first head module are calculated based on each peak position. A misregistration amount calculation unit for calculating a misregistration amount in the second direction with respect to the recording position of the second head module;
An image recording apparatus comprising:
Priority Applications (1)
| Application Number | Priority Date | Filing Date | Title |
|---|---|---|---|
| US14/824,944 US9370954B2 (en) | 2013-03-15 | 2015-08-12 | Method for measuring amount of positional deviation and image-recording device |
Applications Claiming Priority (2)
| Application Number | Priority Date | Filing Date | Title |
|---|---|---|---|
| JP2013053226A JP5894098B2 (en) | 2013-03-15 | 2013-03-15 | Position shift amount measuring method and image recording apparatus |
| JP2013-053226 | 2013-03-15 |
Related Child Applications (1)
| Application Number | Title | Priority Date | Filing Date |
|---|---|---|---|
| US14/824,944 Continuation US9370954B2 (en) | 2013-03-15 | 2015-08-12 | Method for measuring amount of positional deviation and image-recording device |
Publications (1)
| Publication Number | Publication Date |
|---|---|
| WO2014141862A1 true WO2014141862A1 (en) | 2014-09-18 |
Family
ID=51536537
Family Applications (1)
| Application Number | Title | Priority Date | Filing Date |
|---|---|---|---|
| PCT/JP2014/054370 WO2014141862A1 (en) | 2013-03-15 | 2014-02-24 | Method for measuring amount of positional deviation and image-recording device |
Country Status (3)
| Country | Link |
|---|---|
| US (1) | US9370954B2 (en) |
| JP (1) | JP5894098B2 (en) |
| WO (1) | WO2014141862A1 (en) |
Families Citing this family (5)
| Publication number | Priority date | Publication date | Assignee | Title |
|---|---|---|---|---|
| JP2016129989A (en) * | 2015-01-15 | 2016-07-21 | 武藤工業株式会社 | Drawing adjustment method and device by colorimetry |
| JP7153425B2 (en) * | 2017-01-23 | 2022-10-14 | セイコーエプソン株式会社 | Scanners, scan programs and methods of producing scan data |
| JP6939236B2 (en) * | 2017-08-15 | 2021-09-22 | 富士フイルムビジネスイノベーション株式会社 | Image forming device |
| JP7109320B2 (en) * | 2018-09-19 | 2022-07-29 | 株式会社Screenホールディングス | PRINTING APPARATUS AND METHOD OF DELAYING THE SAME |
| JP7211206B2 (en) * | 2019-03-28 | 2023-01-24 | ブラザー工業株式会社 | image forming device |
Citations (3)
| Publication number | Priority date | Publication date | Assignee | Title |
|---|---|---|---|---|
| JPH11180013A (en) * | 1997-12-19 | 1999-07-06 | Canon Aptex Inc | Recording test device |
| JP2005053167A (en) * | 2003-08-07 | 2005-03-03 | Fuji Xerox Co Ltd | Image formation device |
| JP2006305894A (en) * | 2005-04-28 | 2006-11-09 | Konica Minolta Holdings Inc | Method for correcting inclination of recording head |
Family Cites Families (9)
| Publication number | Priority date | Publication date | Assignee | Title |
|---|---|---|---|---|
| JPH0885235A (en) * | 1994-09-16 | 1996-04-02 | Canon Inc | Image forming device |
| JP2003170645A (en) * | 2001-12-06 | 2003-06-17 | Olympus Optical Co Ltd | Recording sheet and image recorder |
| JP4756842B2 (en) * | 2004-09-30 | 2011-08-24 | キヤノン株式会社 | Print position adjusting method and printing apparatus |
| JP2006255976A (en) * | 2005-03-15 | 2006-09-28 | Fuji Xerox Co Ltd | Image forming device, and control method for printing head |
| JP2006305952A (en) * | 2005-04-28 | 2006-11-09 | Seiko Epson Corp | Printer, computer program, printing method, and medium |
| JP4888239B2 (en) * | 2007-06-13 | 2012-02-29 | セイコーエプソン株式会社 | Liquid ejection device |
| JP4883702B2 (en) * | 2007-07-18 | 2012-02-22 | 富士フイルム株式会社 | Dot measuring method and apparatus, program, and image forming apparatus |
| JP5338291B2 (en) * | 2008-12-12 | 2013-11-13 | コニカミノルタ株式会社 | Image forming apparatus |
| US8721026B2 (en) * | 2010-05-17 | 2014-05-13 | Xerox Corporation | Method for identifying and verifying dash structures as candidates for test patterns and replacement patterns in an inkjet printer |
-
2013
- 2013-03-15 JP JP2013053226A patent/JP5894098B2/en not_active Expired - Fee Related
-
2014
- 2014-02-24 WO PCT/JP2014/054370 patent/WO2014141862A1/en active Application Filing
-
2015
- 2015-08-12 US US14/824,944 patent/US9370954B2/en active Active
Patent Citations (3)
| Publication number | Priority date | Publication date | Assignee | Title |
|---|---|---|---|---|
| JPH11180013A (en) * | 1997-12-19 | 1999-07-06 | Canon Aptex Inc | Recording test device |
| JP2005053167A (en) * | 2003-08-07 | 2005-03-03 | Fuji Xerox Co Ltd | Image formation device |
| JP2006305894A (en) * | 2005-04-28 | 2006-11-09 | Konica Minolta Holdings Inc | Method for correcting inclination of recording head |
Also Published As
| Publication number | Publication date |
|---|---|
| JP5894098B2 (en) | 2016-03-23 |
| US9370954B2 (en) | 2016-06-21 |
| US20150343820A1 (en) | 2015-12-03 |
| JP2014177057A (en) | 2014-09-25 |
Similar Documents
| Publication | Publication Date | Title |
|---|---|---|
| US8585174B2 (en) | Inkjet printing apparatus and printing method of inkjet printing apparatus | |
| JP5477954B2 (en) | Image recording apparatus and head adjustment method of image recording apparatus | |
| JP5473704B2 (en) | Test pattern printing method and inkjet recording apparatus | |
| JP5894098B2 (en) | Position shift amount measuring method and image recording apparatus | |
| JP5940818B2 (en) | Correction value acquisition method and image recording apparatus | |
| JP2008254203A (en) | Inkjet recorder, and inkjet recording method | |
| US20090244167A1 (en) | Inkjet recording apparatus, test image forming method, and computer-readable medium | |
| US9227394B2 (en) | Head adjustment method, head-driving device and image-forming device | |
| US8695529B2 (en) | Application apparatus and image forming apparatus | |
| JP5952704B2 (en) | Head driving method, head driving device, and ink jet recording apparatus | |
| JP2013184458A (en) | Image recording apparatus and method | |
| JP2014136319A (en) | Method for detecting position displacement of recording head, and image recording device | |
| US9895880B2 (en) | Method for adjusting recording head, and image forming apparatus | |
| JP2012250472A (en) | State monitoring device of inkjet recording head and inkjet recording apparatus | |
| JP5393560B2 (en) | Inkjet drawing apparatus, design method thereof, and drawing quality improvement method | |
| JP5301483B2 (en) | Recording head adjustment method and image recording apparatus | |
| JP2012066457A (en) | Image forming apparatus, correction value calculator, test chart for density measurement, and correction value calculation method | |
| JP5436369B2 (en) | Recording apparatus and recording method | |
| JP5649460B2 (en) | Recording head, image forming apparatus, and liquid ejection apparatus | |
| JP2023067385A (en) | Recording head control device and control method, and printing device |
Legal Events
| Date | Code | Title | Description |
|---|---|---|---|
| 121 | Ep: the epo has been informed by wipo that ep was designated in this application |
Ref document number: 14764555 Country of ref document: EP Kind code of ref document: A1 |
|
| NENP | Non-entry into the national phase |
Ref country code: DE |
|
| 122 | Ep: pct application non-entry in european phase |
Ref document number: 14764555 Country of ref document: EP Kind code of ref document: A1 |