WO2014041886A1 - Système et procédé d'analyse de masse - Google Patents
Système et procédé d'analyse de masse Download PDFInfo
- Publication number
- WO2014041886A1 WO2014041886A1 PCT/JP2013/068837 JP2013068837W WO2014041886A1 WO 2014041886 A1 WO2014041886 A1 WO 2014041886A1 JP 2013068837 W JP2013068837 W JP 2013068837W WO 2014041886 A1 WO2014041886 A1 WO 2014041886A1
- Authority
- WO
- WIPO (PCT)
- Prior art keywords
- reliability
- mass
- correction
- mass spectrometry
- spectrometry system
- Prior art date
Links
Images


Classifications
-
- H—ELECTRICITY
- H01—ELECTRIC ELEMENTS
- H01J—ELECTRIC DISCHARGE TUBES OR DISCHARGE LAMPS
- H01J49/00—Particle spectrometers or separator tubes
- H01J49/0027—Methods for using particle spectrometers
- H01J49/0036—Step by step routines describing the handling of the data generated during a measurement
-
- H—ELECTRICITY
- H01—ELECTRIC ELEMENTS
- H01J—ELECTRIC DISCHARGE TUBES OR DISCHARGE LAMPS
- H01J49/00—Particle spectrometers or separator tubes
- H01J49/26—Mass spectrometers or separator tubes
- H01J49/34—Dynamic spectrometers
- H01J49/42—Stability-of-path spectrometers, e.g. monopole, quadrupole, multipole, farvitrons
- H01J49/426—Methods for controlling ions
- H01J49/4265—Controlling the number of trapped ions; preventing space charge effects
Definitions
- the present invention relates to a mass spectrometry system and method.
- Patent Document 1 is a document describing the background art of mass spectrometry systems.
- a mass spectrometer is disclosed error in the experimentally determined mass to charge ratios of ions are reported together with an error band for each mass to charge ratio determination.
- the error band may, for example, reflect a 95% probability or confidence that the real, true, actual or accepted ⁇ mass to charge ratio of the ion lies within the error band.By accurately determining the error band the possible candidate ions in a database can be accurately restricted whilst also guarding against over restriction. ''
- the phenomenon that affects mass spectrometry is the “space charge effect”.
- the “space charge effect” is a phenomenon that appears depending on the amount of ions introduced into the mass spectrometer, and specifically refers to a phenomenon that acts to shift the mass axis of the measured spectrum.
- Patent Document 1 described above discloses a mass spectrometer that estimates the amount of blur included in the estimated value of the peak position based on the ion intensity and displays the estimated value. Neither the method of evaluating the reliability of the correction result nor the method of presenting the evaluation result is disclosed.
- the present invention employs, for example, the configuration described in the claims.
- the present specification includes a plurality of means for solving the above-described problems. For example, a space charge effect correction unit that corrects a space charge effect based on a mass spectrum and outputs the corrected spectrum as a corrected spectrum. And a correction reliability calculation unit that calculates the reliability when the correction is performed based on the mass spectrum.
- the mass spectrometry system can calculate the reliability when the space charge effect is corrected based on the mass spectrum. Problems, configurations, and effects other than those described above will be clarified by the following description.
- amendment reliability The figure which shows the example of a user interface screen used for the setting of the determination threshold value of correction
- amendment reliability The figure explaining the detail of the starting process by a present Example.
- the figure explaining the detail of the error processing by a present Example. The figure explaining the correlation between the upper intensity integrated value measured when the ion concentration is 0.02 ppm and the peak position.
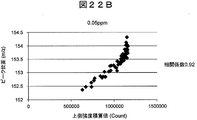
- the figure explaining the correlation between the upper intensity integrated value measured when the ion concentration is 0.05 ppm and the peak position.
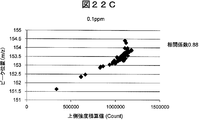
- the figure explaining the correlation between the upper intensity integrated value measured when the ion concentration is 0.1 ppm and the peak position.
- the figure explaining the correlation between the upper intensity integrated value measured when the ion concentration is 0.2 ppm and the peak position.
- the figure explaining the correlation between the upper intensity integrated value measured when the ion concentration is 0.5 ppm and the peak position.
- Example 1 In this example, a mass spectrometry system that can optimize the measurement method and the interpretation method of the mass spectrum according to the amount of ions will be described.
- FIG. 1 shows a hardware configuration of a mass spectrometry system 100 according to the present embodiment.
- a mass spectrometry system 100 includes a central processing unit 101, a user interface unit 102, a storage medium 103, a volatile memory 104, and a mass analysis unit 110.
- the central processing unit 101, the user interface unit 102, the storage medium 103, and the volatile memory 104 constitute a so-called computer.
- the mass spectrometric unit 110 includes a sample introduction unit 111, an ionization unit 112, an ion transport unit 113, an ion trap 114, a detector 115, a high frequency power source 116, and vacuum pumps 117 to 119.
- the vacuum pumps 117 to 119 maintain the pressure (degree of vacuum) of the chambers to which they are connected at appropriate values.
- the sample introduction unit 111 introduces the sample in the form of vapor, mist droplets or fine particles, and sends the introduced sample to the ionization unit 112.
- the ionization unit 112 ionizes the sample introduced in the ion source.
- the ionization method for example, an electrospray ionization method, a sonic spray ionization method, or the like is used.
- the generated ions ride on the gas flow generated by the pressure difference and are transported to the first chamber. The ions are then transported from the first chamber to the second chamber. This transportation is also performed by gas flow.
- an ion transport part 113 and an ion trap 114 are provided in the second room.
- ions are transported to the ion trap 114 via the ion transport part 113.
- the ion trap 114 for example, a quadrupole ion trap, a linear trap, or the like is used.
- the high frequency power supply 116 supplies a high frequency voltage to each of the ion transport unit 113 and the ion trap 114 and traps desired ions in the ion trap 114.
- the central processing unit 101 transports ions to the detector 115 at different times according to the mass-to-charge ratio (m / z) by changing the high-frequency voltage applied to the ion trap 114 with time.
- the detector 115 converts the amount of ions reaching each time into a voltage value, and transmits the voltage value to the central processing unit 101 as a voltage signal.
- the central processing unit 101 converts time to ion m / z with respect to a voltage signal given in time series, thereby obtaining intensity series data (hereinafter referred to as “mass spectrum”) representing the amount of ions corresponding to each m / z. And stored in the volatile memory 104.
- the central processing unit 101 executes space charge effect correction processing based on the mass spectrum stored in the volatile memory 104. This correction process is executed based on an estimation program stored in the storage medium 103.
- the central processing unit 101 presents the spectrum after correcting the space charge effect (hereinafter also referred to as “corrected spectrum”) to the operator through the user interface unit 102.
- the user interface unit 102 may be, for example, a monitor having a touch panel arranged on the display surface, or may be a monitor of an external PC connected via a network.
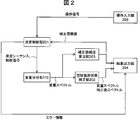
- FIG. 2 shows a functional block configuration of the mass spectrometry system 100 according to the present embodiment.
- the functional blocks excluding the mass analyzer 110 are realized through a program executed by the central processing unit 101.
- the operation input unit 205 outputs an operation signal corresponding to an operator operation input (for example, a start operation or a measurement start operation) to the measurement control unit 201.
- the activation operation and the measurement start operation are input as, for example, pressing a button included in the user interface unit 102.
- the measurement control unit 201 executes a start process and a measurement start process in response to input of each operation signal corresponding to the start operation and the measurement start operation, and outputs a control signal for controlling the state of the mass analyzer 110.
- the measurement control unit 201 outputs a control signal and error information for stopping the mass analysis unit 110 according to the internal state of the system and the correction reliability.
- the error information is, for example, a number indicating the type of error.
- the measurement control unit 201 determines a measurement sequence to be executed next by the mass analysis unit 110 according to the correction reliability, and outputs the measurement sequence to the mass analysis unit 110.
- the measurement sequence is a signal for controlling voltage application, valve opening / closing, detector on / off, etc., used in the accumulation process, the exhaust waiting process, the mass scanning process, the exclusion process, etc. Consists of time series.
- the measurement sequence disclosed in Patent Document 2 is used.
- tandem mass spectrometry measurement processing is executed a plurality of times, such as MS / MS (MS2), MS / MS / MS (MS3), and the like. In that case, the isolation (isolation) step and the dissociation step are arranged between the aforementioned steps.
- FIG. 3 shows an example of a measurement sequence corresponding to MS2.
- the measurement sequence itself shown in FIG. 3 is a general one. For this reason, detailed description of control operations such as opening and closing of the valve executed in the measurement sequence is omitted.
- the mass analyzer 110 performs mass analysis based on the measurement sequence given from the measurement controller 201. As described above, the mass analyzer 110 measures and outputs the mass spectrum of the sample to be measured.
- the mass spectrum here includes the space charge effect.
- the term “mass spectrum” means a spectrum before correcting the space charge effect. Information on the mass spectrum is output to the space charge effect correction unit 202 and the correction reliability calculation unit 203.
- the correction method of the space charge effect is arbitrary.
- the same technique (method for correcting the space charge effect based on the integrated value of ionic strength) as in Japanese Patent Application No. 2011-140089 by the same applicant as the present applicant may be adopted.
- the correction reliability calculation unit 203 calculates a correction reliability that is a measure of the reliability of the correction result of the space charge effect based on the mass spectrum, and outputs the calculated correction reliability.
- the correction reliability is output to the measurement control unit 201 and the result output unit 204.
- the result output unit 204 stores the mass spectrum before correction, the mass spectrum after correction, and the correction reliability in the storage medium 103 and further presents them to the user.
- Examples of the presentation method include presentation of image information by the user interface unit 102, presentation by a braille display, presentation by voice, and printing of image information by a printer.
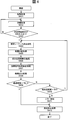
- FIG. 4 shows mass spectrometry processing executed by the mass spectrometry system 100 according to the present embodiment.
- the mass spectrometry system 100 starts to operate based on the operator's activation operation input via the operation input unit 205, and the measurement control unit 201 executes the activation process (step S401).
- the mass spectrometry system 100 enters a standby state for accepting a measurement start operation.
- the measurement control unit 201 executes standby processing.
- the standby process monitoring of the operator's operation input and monitoring of the apparatus state are executed.
- the measurement control unit 201 determines whether or not the operator has performed a measurement start operation. When the measurement start operation is performed, the measurement control unit 201 executes the processes after step S404. If the measurement start operation has not been performed, the measurement control unit 201 returns to step S402.
- step S404 the measurement control unit 201 performs a measurement sequence determination process. Immediately after the start of measurement, the measurement control unit 201 outputs an initially set measurement sequence, and in other cases, the measurement control unit 201 outputs a measurement sequence determined based on the correction reliability.
- the mass analysis unit 110 executes a mass analysis process.
- mass analysis process mass analysis based on a measurement sequence is executed, and a mass spectrum is acquired.
- step S406 the correction reliability calculation unit 203 executes a correction reliability calculation process.
- the correction reliability is calculated based on the mass spectrum. A specific calculation method will be described later.
- step S407 the space charge effect correction unit 202 executes a space charge effect correction process.
- a corrected spectrum Z (z_1,..., Z_M) is calculated.
- step S408 the result output unit 204 executes a result output process.
- the correction reliability and the corrected spectrum are output.
- step S409 the measurement control unit 201 determines whether or not the elapsed time from the start of measurement exceeds a preset threshold TH_C. If the threshold value TH_C is exceeded, the measurement control unit 201 proceeds to step S412. When the threshold value TH_C is not exceeded, the measurement control unit 201 proceeds to step S410, and determines whether or not the correction reliability exceeds a preset threshold value TH1. If the threshold value TH1 is exceeded, the measurement control unit 201 returns to step S404. On the other hand, when the threshold value TH1 is not exceeded, the measurement control unit 201 proceeds to step S411.
- step S411 the result output unit 204 performs error processing based on the error information. For example, a measurement stop command is output as error processing.
- step S412 the result output unit 204 executes measurement stop processing.
- the measurement stop process is performed both when the measurement time passes a predetermined time and when error processing is executed.
- the user interface screen is displayed on the user interface unit 102.
- the user interface screen includes a display area for activation and measurement start buttons corresponding to the operation input unit 205, and a display area for displaying a mass spectrum, correction reliability, a peak position of the mass spectrum, and a peak position of the corrected spectrum.
- the result output unit 204 calculates and draws the peak position. For example, a known centroid process is used to calculate the peak position.
- the corrected spectrum may be displayed instead of the mass spectrum, or both the mass spectrum and the corrected spectrum may be displayed in the display area.
- the information on the mass spectrum and / or the information on the corrected spectrum and the correction reliability are displayed on the same screen. For this reason, the operator can appropriately interpret the mass spectrum measured from the display screen.
- the reliability of the correction result of the space charge effect cannot be confirmed, there is a possibility that the operator misinterprets. Also, the operator could not notice an error in the interpretation of the mass spectrum.
- 5 and 6 are display examples of user interface screens used when the correction reliability is high (in the example, 95%).
- the correction reliability is high, the operator checks the peak position of the corrected spectrum and its numerical information to determine whether a component is present in the sample (presence / absence information) and the type of component contained in the sample (qualitative) Information), the concentration of components contained in the sample (quantitative information), and the like can be estimated with high accuracy.
- the smaller the displayed correction reliability the less reliable the measured mass spectrum and the corrected spectrum.
- the operator can determine from the display content of the correction reliability that presence information / qualitative information / quantitative information should not be read from the corrected spectrum.
- the operator preferentially selects a mass spectrum in which a high correction reliability is displayed from a plurality of mass spectra measured in the past, and estimates presence / absence information / qualitative information / quantitative information, More accurate information can be obtained.
- the correction reliability of the corrected spectrum is low as described above, the operator can remeasure the sample in an appropriate measurement sequence according to the ion amount as a countermeasure.
- the correction reliability is displayed on the same screen together with the information of the mass spectrum or the information of the corrected spectrum, so that the operator can quickly grasp whether the measurement situation is appropriate or not. If the measurement situation is inappropriate or defective, the operator can quickly change the measurement sequence.
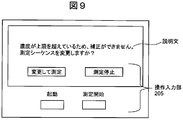
- FIG. 7 is a display example of a user interface screen used when the correction reliability is low.
- the fact that the space charge effect cannot be corrected is clearly indicated by the notation “correction impossible”, and the operator is warned.
- This non-correctable display has an effect of preventing the operator from reading presence / absence information, qualitative information, and quantitative information from the displayed spectrum. Whether or not to display a non-correctable display may be determined based on a comparison result between the correction reliability and an appropriate threshold set in advance.
- the user interface screen shown in FIG. 8 displays a sentence explaining that the reliability of the current measurement is low.
- the explanation in FIG. 8 is a content that prompts the operator to adjust the concentration of the sample and perform remeasurement.
- the operator adjusts the concentration of the sample according to the explanatory text and performs remeasurement, a mass spectrum with high measurement accuracy can be obtained.
- the error number is displayed together with the explanatory text, but the error type name may be displayed instead of the error number.
- a “change and measure” button that prompts the operator to change the measurement sequence and a “measurement stop” button that prompts the operator to stop the measurement itself are prepared as the operation input unit 205 together with the explanatory text. Has been.
- the measurement control unit 201 changes the measurement sequence so as to reduce the amount of ions transported to the ion trap 114, and executes the measurement process again. For example, if the measurement sequence is changed so as to appropriately shorten the ion accumulation time, the ion concentration can be reduced. If remeasurement is performed in this state, a mass spectrum with higher measurement accuracy than the previous measurement can be obtained.
- the measurement control unit 201 executes a measurement stop process (step S412) and stops the analysis process by the mass spectrometry system.
- a measurement stop process step S412
- the analysis process can be stopped based on the operator's intention.
- the “measurement stop” button is prepared in addition to the “change and measure” button, so that the measurement sequence is inadvertently changed, resulting in confusion when the operator interprets the mass spectrum. The situation can be prevented.
- the mass spectrum information and / or the corrected spectrum information and the correction reliability are simultaneously displayed in the user interface screen. Therefore, the reliability of the correction result can be confirmed before the operator interprets the displayed spectrum. Further, based on the reliability of the confirmed correction result, the measurement sequence can be changed so that the amount of ions at the time of measurement can be optimized, and the method for interpreting the measured mass spectrum can be changed.
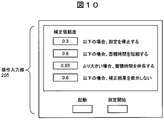
- FIG. 10 and 11 show user interface screens suitable for use in setting a correction reliability determination threshold value.
- the user interface screen shown in FIG. 10 is an example in which a threshold value can be received by inputting a numerical value on the input form. Note that the number of threshold values that can be set is not necessarily one, and as shown in FIG. 10, threshold values for determination may be set corresponding to each of the four processing operations.
- FIG. 11 is a user interface screen that allows the same setting to be input by the position of the slider bar. In particular, as shown in FIG. 11, in the case of a user interface screen in which the position of the threshold value can be input at the position of the slider bar, the operator can easily grasp the magnitude relationship and approximate size of each threshold value, and can be set easily. .
- the threshold value can include a threshold value for determining whether or not to display the corrected spectrum on the screen. For example, when the correction reliability is higher than the threshold value, the mass spectrum and the corrected spectrum are displayed on the screen as shown in FIGS. On the other hand, when the correction reliability is lower than the threshold value, the mass spectrum and the corrected spectrum can be prevented from being displayed on the screen as shown in FIGS.
- FIG. 12 shows the detailed process of the activation process (step S401).
- the measurement control unit 201 performs a vacuum degree initialization process (step S1201).
- the measurement control unit 201 drives the vacuum pumps 117 to 119 to exhaust, reduces the chamber connected to each pump to an appropriate pressure, and maintains the pressure.
- the measurement control unit 201 performs a cleaning process (step S1202).
- the measurement control unit 201 requests the operator to introduce a sample such as ammonia into the sample introduction unit 111 through the user interface unit 102, and waits for the introduction of the sample to execute the measurement process.
- the substance (carry over) adsorbed on the sample introduction unit 111 during the previous measurement is washed.
- the measurement control unit 201 executes a mass-to-charge ratio calibration process (step S1203).
- the measurement control unit 201 causes the operator to introduce a standard material sample having a peak at a known m / z into the sample introduction unit 111 through the user interface unit 102, and introduce the sample. Wait and execute the measurement process.
- the measurement control unit 201 creates a correspondence table b (m) between each element number on the mass spectrum array and m / z based on the measured peak position of the mass spectrum.
- the measurement control unit 201 performs a blank check (step S1204).
- the measurement control unit 201 causes the operator to introduce a known sample that does not contain the measurement target component into the sample introduction unit 111, and waits for the introduction of the sample before executing the measurement process.
- the measurement control unit 201 executes processing for determining whether or not the measured spectrum is normal (step S1205).
- the measurement control unit 201 determines that the spectrum is normal and ends the activation process.
- the measurement control unit 201 determines that the spectrum is abnormal, and returns to the cleaning process (step S1202).
- an example of a condition for determining that “the measured spectrum is normal” is, for example, that a large peak does not exist in the measured spectrum.
- Another example is that, for example, when the measured spectrum is regarded as an M-dimensional vector, the cosine similarity calculated between the reference spectrum measured in the past is higher than a predetermined threshold.
- an appropriate known method may be used to determine whether or not it is normal.
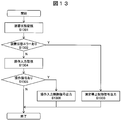
- FIG. 13 shows the detailed processing of the standby processing (step S402).
- the measurement control unit 201 performs apparatus state monitoring processing (step S1301).
- the measurement control unit 201 monitors the apparatus state such as the degree of vacuum, the voltage value, and the temperature of the mass analysis unit 110.
- the measurement control unit 201 determines whether there is an error in the apparatus state (step S1302). When it is determined that there is an error in the apparatus state, the measurement control unit 201 performs a measurement stop control signal output process (step S1303). In the measurement stop control signal output process, the measurement control unit 201 outputs a control signal for instructing to stop the measurement to the mass analysis unit 110, and ends the standby process. On the other hand, when there is no error in the apparatus state, the measurement control unit 201 executes an operation input monitoring process (step S1304). In the operation input monitoring process, the measurement control unit 201 monitors an operation signal input from the operation input unit 205.
- the operation control unit 201 determines the presence or absence of an operation signal (step S1305).
- the operation control unit 201 executes an operation input control signal output process (step S1306).
- the operation control unit 201 outputs a control signal corresponding to the operation input to the mass analyzer 110, and ends the standby process.
- the operation control unit 201 immediately ends the standby process.
- FIG. 14 shows the detailed process of the measurement sequence determination process (step S404).
- the measurement control unit 201 determines whether or not it is immediately after the start of measurement (step S1401). In the case immediately after the start of measurement, the measurement control unit 201 executes an initial setting measurement sequence output process (step S1402). Here, the measurement control unit 201 outputs the initial measurement sequence to the mass analysis unit 110, and ends the measurement sequence determination process.
- the measurement control unit 201 determines whether or not the correction reliability calculated for the previous measurement sequence is greater than the threshold value TH2 (step S1403).
- the threshold value TH2 is smaller than a threshold value TH3 described later.
- the measurement control unit 201 outputs a measurement sequence that shortens the time for accumulating ions to the mass analysis unit 110 (step S1404).
- the accumulation time ACC calculated based on (Equation 1) is output as a measurement sequence to the mass analyzer 110, and the measurement sequence determination process ends.
- step S1405 the measurement control unit 201 determines whether the correction reliability is greater than the threshold value TH3.
- the measurement control unit 201 outputs the same measurement sequence as the previous time (that is, a measurement sequence in which the accumulation time is not changed) to the mass analysis unit 110, and ends the measurement sequence determination process ( Step S1406).
- the measurement control unit 201 outputs a measurement sequence that extends the time for accumulating ions to the mass analysis unit 110 (step S1407).
- the accumulation time ACC calculated in (Equation 2) is output as a measurement sequence to the mass analyzer 110, and the measurement sequence determination process ends.
- the mass spectrometry system can increase the SN ratio of the mass spectrum as much as possible while maintaining high measurement accuracy.
- FIG. 15 shows the detailed process of the correction reliability calculation process (step S406).
- the correction reliability calculation unit 203 executes a peak extraction process (step S1501).
- the correction reliability calculation unit 203 lists a plurality (p, q) of peak positions (m / z) p and intensity q from the mass spectrum.
- a known appropriate method can be applied to this treatment. For example, it can be realized by smoothing a mass spectrum and fitting a Lorentz function or fitting a Gaussian function.
- a known appropriate smoothing method such as a Gaussian filter, a Savitzky-Golay filter, or a spline approximation can be used.
- the correction reliability calculation unit 203 executes a peak selection process (step S1502).
- the correction reliability calculation unit 203 selects one or a plurality of peaks used for calculation of the correction reliability from the plurality of listed peaks.
- the correction reliability can be calculated robustly even when some peaks cannot be extracted due to the influence of a miscellaneous component or when the subsequent width calculation process (step S1503) is low accuracy. it can.
- a peak derived from a known standard substance is used. Since it is guaranteed that the standard substance is contained in the sample, the correction reliability can be calculated with high accuracy when using the peak derived from the standard substance.
- the standard substance may be a substance mixed with the sample at the time of measurement, or may be a substance known in advance from the beginning. Also, a specified number of peaks may be selected in descending order of intensity. Since a peak with a high intensity generally has a high SN ratio, the subsequent width calculation process (step S1503) can be executed with high accuracy, and as a result, the correction reliability can also be calculated with high accuracy.
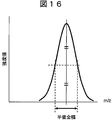
- the correction reliability calculation unit 203 executes a width calculation process (step S1503).
- the width calculation process the correction reliability calculation unit 203 calculates the width w ′ of each peak selected in the previous step, and further calculates a width w representing the plurality of widths.
- the width w ′ here is, for example, the full width at half maximum of the peak (FIG. 16), the half width at half maximum of the Lorentz function fitted by peak extraction (half the full width at half maximum), the standard deviation of the Gaussian function fitted by peak extraction, and the peak of the mass spectrum. It can be given as a statistic indicating the shape of the distribution such as standard deviation in the vicinity, exp ( ⁇ k) calculated from the kurtosis k near the peak of the mass spectrum.
- the peak width to be calculated is an example of a peak waveform.
- the correction reliability calculation unit 203 executes intensity integrated value calculation processing (step S1504).
- the correction reliability calculation unit 203 calculates the integrated intensity value TIC of the mass spectrum using (Equation 3).
- X (m) is the intensity value of the mth peak constituting the mass spectrum.
- the correction reliability calculation unit 203 executes a correction reliability calculation process (step S1505).
- the correction reliability calculation unit 203 calculates the correction reliability c based on (Equation 4), and ends the correction reliability calculation process.
- the target peak intensity q means the intensity q of the pair of peaks (p, q) used for the width calculation.
- FIG. 17 shows the detailed process of the space charge effect correction process (step S407).
- the space charge effect correction unit 202 performs a peak extraction process (step S1701).
- the space charge effect correction unit 202 lists pairs (p, q) of a plurality of peak positions p and intensities q from the mass spectrum, as in the correction reliability calculation unit 203.
- the space charge effect correction unit 202 executes an upper intensity integrated value calculation process (step S1702).
- the space charge effect correction unit 202 provides an upper intensity integrated value HIC that gives an estimated value of the amount of ions that exist in the trap and have an influence of the space charge effect at the time when each peak is measured. Is calculated based on (Equation 5).
- W is an appropriate weighting function that expresses the influence of each m / z ion on the space peak effect on the peak ion to be corrected.
- the upper intensity integrated value HIC is calculated for mass scanning from the low mass side to the high mass side, but conversely, when mass scanning is performed from the high mass side to the low mass side, the lower intensity is calculated.
- the integrated value LIC is calculated and used in place of the upper intensity integrated value HIC in the processing described later.
- the space charge effect correction unit 202 executes space charge effect removal m / z calculation processing (step S1703).
- the space charge effect correcting unit 202 corrects the peak position m based on (Equation 6), and the corrected peak position m ⁇ (the position of the symbol “ ⁇ ” here is for convenience, and the symbol “ ⁇ "Is expressed on m as shown in Equation 6. The same applies hereinafter.
- the peak position is m / z, it is represented by m in Equation 6. The same applies to Equation 7.
- G (•) is a function obtained in advance as a relationship between the upper intensity integrated value HIC and the shift amount of the q value.
- the space charge effect correction unit 202 executes a calibrated m / z calculation process (step S1704).
- the space charge effect correction unit 202 is a correspondence table b (m) between each element number on the mass spectrum array calculated in the mass-to-charge ratio calibration process (step S1203) and m / z. ) Based on m / z m ⁇ corresponding to the corrected peak position m ⁇ (the notation of the symbol " ⁇ " here is for convenience, and the symbol “ ⁇ " The same shall apply hereinafter).
- the space charge effect correction unit 202 executes a corrected spectrum output process (step S1705).
- the space charge effect correction unit 202 calculates the corrected spectrum Z based on (Equation 7) based on the peak set (p, q) and its correction value m ⁇ z. Calculate and output.
- the space charge effect correction unit 202 calculates the corrected spectrum Z by superimposing the Lorentz function or Gaussian function fitted for each peak in the peak extraction process in step S1501 on the peak set (p, q). May be.
- FIG. 18 shows detailed processing of the result output processing (step S408).
- the result output unit 204 executes data storage processing (step S1801).
- the result output unit 204 stores the input mass spectrum X, the corrected spectrum Z, and the corrected reliability c in the storage medium 103.
- FIG. 19 shows a data structure used when these data are stored in the storage medium 103.
- the user interface screen illustrated in FIGS. 5 to 9 can be displayed at high speed. it can. With this display, the operator can quickly change to an appropriate measurement sequence according to the amount of ions at the time of measurement and change the interpretation method of the measured mass spectrum.
- the result output unit 204 executes a mass spectrum display process (step S1802).
- the result output unit 204 displays a mass spectrum on the user interface screen.
- the result output unit 204 executes a correction reliability display process (step S1803).
- the result output unit 204 displays the correction reliability on the user interface screen.
- the result output unit 204 determines whether or not the correction reliability is greater than the threshold value TH2 (step S1804). If the correction reliability is greater than the threshold value TH2, the result output unit 204 proceeds to step S1805. On the other hand, when the correction reliability is equal to or lower than the threshold value TH2, the result output unit 204 proceeds to step S1806.
- step S1805 the result output unit 204 executes a peak position display process of the corrected spectrum.
- the result output unit 204 displays the peak position of the corrected spectrum on the user interface screen, and ends the result output process.
- step S1806 the result output unit 204 executes an uncorrectable display process.
- the result output unit 204 displays that the space charge effect cannot be corrected on the user interface screen, and ends the result output process.
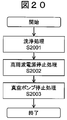
- FIG. 20 shows the detailed process of the measurement stop process (step S412).
- the measurement control unit 201 performs a cleaning process (step S2001).
- the cleaning process here is the same as the cleaning process in step S1202.
- the measurement control unit 201 executes a high-frequency power supply stop process (step 2002).
- the measurement control unit 201 controls to stop the operation of the high frequency power supply 116.
- the measurement control unit 201 executes a vacuum pump stop process (step S2003). In this vacuum pump stop process, the measurement control unit 201 stops the operation of the vacuum pumps 117 to 119.
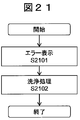
- FIG. 21 shows detailed processing of error processing (step S411).
- the result output unit 204 executes an error display process (step S2101).
- the result output unit 204 explicitly displays error information on the user interface screen as illustrated in FIG.
- the result output unit 204 executes a cleaning process (step S2102).
- the cleaning process here is the same as the cleaning process in step S1202.
- the lower the calculated correction reliability the longer the cleaning time.
- 22A to 22G show the relationship between the upper intensity integrated value HIC for each concentration and the peak position m / z when mass analysis is performed by changing the concentration of ions having a peak position m / z of 150 from 0.02 ppm to 1 ppm. Is plotted for each scan.
- the upper intensity integrated value HIC gives a relatively good estimate of the amount of ions in the trap.
- the amount of shift between the intensity integrated value HIC and the peak position m / z has a high positive correlation. For this reason, the peak position can be corrected with high accuracy based on (Expression 5) and (Expression 6).
- the inventors presume that such a decrease in correlation is caused by the following principle.
- FIG. 23 shows the relationship between each concentration and the full width at half maximum of the measured peak for the same measurement sequence.
- the full width at half maximum tends to increase as the concentration increases. Assuming this cause, it is considered that when the amount of ions in the ion trap 114 is large, the pseudopotential felt by the ions becomes shallow, and the ions are measured at m / z that is wider than the original m / z. It is done. In fact, the full width at half maximum monotonously increases even near the threshold (0.1 ppm, around 0.2 ppm) where the correlation was weak in the relationship between the upper intensity integrated value HIC and the shift amount of the peak position m / z.
- the full width at half maximum of the peak monotonously increases even near the threshold (around 0.1 ppm and 0.2 ppm in the above example) where the correlation between the upper intensity integrated value HIC and the shift amount of the peak position m / z weakens. . For this reason, it is possible to determine whether or not the correction result of the space charge effect is reliable by thresholding the full width at half maximum. Further, since the full width at half maximum increases continuously, it can be used as a continuous reliability indicating whether or not the correction result of the space charge effect is reliable.
- FIG. 23 shows the relationship between the full width at half maximum of the peak and the concentration, but exp ( ⁇ k) calculated from the standard deviation near the peak and the kurtosis k is also between the half width of the peak and the concentration. A similar relationship between the full width at half maximum and the concentration is also observed between the concentrations.
- the reliability of the correction result of the space charge effect can be calculated and presented to the operator as the correction reliability (FIGS. 5 to 9). Further, if the correction reliability is displayed on the user interface screen together with the mass spectrum information and / or the corrected spectrum information, the operator can correctly interpret the displayed mass spectrum.
- This function of presenting the correction reliability of the space charge effect is particularly useful when the operator has little or no expertise or when it is difficult to strictly adjust the inspection environment such as a portable mass spectrometry system.
- portable mass spectrometry systems include on-site illegal drug detection devices.
- this presentation function is useful in that the measurement environment can be quantitatively confirmed even when the operator has expertise or in the case of a mass spectrometry system used in a laboratory or the like.
- the mass spectrometry system 100 can automatically select the measurement sequence so that the amount of ions introduced into the ion trap 114 becomes an appropriate amount according to the calculated correction reliability. Thereby, even when the correction reliability of the space charge effect is low, the correction reliability can be increased for the space charge effect in the next measurement sequence.
- the operator can select remeasurement, measurement sequence change, measurement stop, etc. through the user interface screen. By mounting this function, it is possible to prevent an operator from unintentionally changing the measurement sequence and executing the measurement operation.
- a function for automating the change of the measurement sequence or the like based on the comparison result between the correction reliability and the threshold value is provided.
- the threshold value that defines the execution of each operation can be freely set by the operator through the user interface screen, the operator's intention can be reflected in the automation process.
- Example 2 In the present embodiment, a mass spectrometry system capable of calculating the correction reliability with higher accuracy than in the first embodiment will be described.
- the basic hardware configuration and functional configuration of the mass spectrometry system according to the present embodiment are the same as those of the first embodiment.
- the correction reliability calculation process step S406
- FIG. 24 shows the detailed process of the correction reliability calculation process (step S406) used in the present embodiment.
- the correction reliability calculation unit 203 performs a peak extraction process on the mass spectra of all the scans measured up to now (step S2401).
- the contents of the peak extraction process may be the same as in step S1501.
- the correction reliability calculation unit 203 selects one or a plurality of peaks used for calculation of the correction reliability from the extracted plurality of peaks (step S2402).
- the correction reliability calculation unit 203 selects, for example, one or a plurality of peaks extracted in common from the largest number of mass spectra among a plurality of mass spectra corresponding to each scan.
- the correction reliability calculation unit 203 calculates the upper intensity integrated value HIC of the peak extracted in the previous step for the mass spectrum of each scan (step S2403).
- the correction reliability calculation unit 203 executes a correlation coefficient calculation process (step 2404).
- the correction reliability calculation unit 203 calculates the correlation coefficient R between the upper intensity integrated value HIC and the peak position m / z for the same peak for the mass spectra of all scans. That is, a correlation coefficient R equivalent to that calculated for each graph of FIGS. 22A to 22G is calculated.
- the correction reliability calculation unit 203 executes a correction reliability calculation process (step S2405).
- the correction reliability calculation unit 203 substitutes the correlation coefficient R for the correction reliability, and ends the correction reliability calculation process.
- the correlation coefficient R is used instead of certain peak width information (for example, full width at half maximum).
- the correlation coefficient R obtained for a statistically significant peak extracted from the results of a plurality of scans is used as the correction reliability instead of the information of a single peak.
- the correlation coefficient R is directly related to the quality of the correction result of the space charge effect. For this reason, compared with the case of Example 1, the correction reliability of higher precision can be obtained.
- Example 3 a mass spectrometry system capable of calculating the correction reliability more robustly and with a lower processing amount than that of the first embodiment will be described.
- the basic hardware configuration and functional configuration of the mass spectrometry system according to the present embodiment are the same as those of the first embodiment.
- the correction reliability calculation process step S406
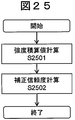
- FIG. 25 shows the detailed process of the correction reliability calculation process (step S406) used in this embodiment.
- the correction reliability calculation unit 203 executes intensity integrated value calculation processing (step S2501).
- the correction reliability calculation unit 203 calculates the integrated intensity value TIC.
- the correction reliability calculation unit 203 executes a correction reliability calculation process (step S2502).
- the correction reliability calculation unit 203 calculates the correction reliability c using (Equation 8).
- Equation 8] c exp ( ⁇ ⁇ TIC) (Formula 8)
- ⁇ is a positive constant set in advance.
- Equation 8 means that the smaller the integrated intensity value TIC, the higher the correction reliability c, and the larger the integrated intensity value TIC, the smaller the corrected reliability c.
- the correction reliability is calculated without calculating the peak extraction or the full width at half maximum. Therefore, even when it is difficult to extract a peak or calculate the full width at half maximum due to an influence of a contaminating component or the like, the correction reliability can be calculated robustly. Further, the method of this embodiment can operate with a low processing amount. However, as described above, if the amount of ions increases excessively, the increase in the amount of ions does not correlate with the integrated intensity value, so that the dynamic range of the amount of ions is considered to be narrower than in Example 1. Therefore, this embodiment is effective at a relatively low concentration.
- this invention is not limited to an above-described Example, Various modifications are included.
- the above-described embodiments have been described in detail for easy understanding of the present invention, and are not necessarily limited to those having all the configurations described.
- a part of the configuration of one embodiment can be replaced with the configuration of another embodiment, and the configuration of another embodiment can be added to the configuration of one embodiment.
- each of the above-described configurations, functions, processing units, processing means, and the like may be realized by hardware by designing a part or all of them with, for example, an integrated circuit.
- Each of the above-described configurations, functions, and the like may be realized by software by interpreting and executing a program that realizes each function by the processor.
- Information such as programs, tables, and files for realizing each function can be stored in a memory, a recording device such as a hard disk or SSD (Solid State Drive), or a recording medium such as an IC card, SD card, or DVD.
- control lines and information lines indicate what is considered necessary for the explanation, and not all the control lines and information lines on the product are necessarily shown. Actually, it may be considered that almost all the components are connected to each other.
Abstract
Le système d'analyse de masse de la présente invention comprend : une unité d'analyse de masse (110) permettant de mesurer un échantillon et de produire un spectre de masse ; une unité de correction de l'effet de charge d'espace (202) permettant de corriger l'effet de charge d'espace sur la base du spectre de masse et de produire celui-ci sous la forme d'un spectre corrigé ; et une unité de calcul de la fiabilité de la correction (203) permettant de calculer la fiabilité lorsqu'une correction a été apportée sur la base du spectre de masse. Selon la présente invention, la fiabilité de la correction concernant l'effet de charge d'espace peut être évaluée de façon précise.
Applications Claiming Priority (2)
| Application Number | Priority Date | Filing Date | Title |
|---|---|---|---|
| JP2012-202786 | 2012-09-14 | ||
| JP2012202786A JP5993259B2 (ja) | 2012-09-14 | 2012-09-14 | 質量分析システム |
Publications (1)
| Publication Number | Publication Date |
|---|---|
| WO2014041886A1 true WO2014041886A1 (fr) | 2014-03-20 |
Family
ID=50278017
Family Applications (1)
| Application Number | Title | Priority Date | Filing Date |
|---|---|---|---|
| PCT/JP2013/068837 WO2014041886A1 (fr) | 2012-09-14 | 2013-07-10 | Système et procédé d'analyse de masse |
Country Status (2)
| Country | Link |
|---|---|
| JP (1) | JP5993259B2 (fr) |
| WO (1) | WO2014041886A1 (fr) |
Families Citing this family (3)
| Publication number | Priority date | Publication date | Assignee | Title |
|---|---|---|---|---|
| WO2019150576A1 (fr) * | 2018-02-05 | 2019-08-08 | 株式会社島津製作所 | Spectroscope de masse et procédé d'étalonnage de masse pour spectroscope de masse |
| JP6783263B2 (ja) | 2018-03-19 | 2020-11-11 | 日本電子株式会社 | 質量分析装置 |
| JP7380501B2 (ja) | 2020-09-30 | 2023-11-15 | 株式会社島津製作所 | 分子構造解析システム及び分子構造解析方法 |
Citations (2)
| Publication number | Priority date | Publication date | Assignee | Title |
|---|---|---|---|---|
| JP2009014424A (ja) * | 2007-07-03 | 2009-01-22 | Shimadzu Corp | クロマトグラフ質量分析装置 |
| JP2010529457A (ja) * | 2007-06-02 | 2010-08-26 | セルノ・バイオサイエンス・エルエルシー | 質量分析のための自己較正アプローチ |
Family Cites Families (6)
| Publication number | Priority date | Publication date | Assignee | Title |
|---|---|---|---|---|
| JPH0381660A (ja) * | 1989-08-24 | 1991-04-08 | Shimadzu Corp | 質量分析計を用いた選択イオン検出方法 |
| JPH08212969A (ja) * | 1995-02-08 | 1996-08-20 | Hitachi Ltd | 質量分析計データ処理装置 |
| JPH1183803A (ja) * | 1997-09-01 | 1999-03-26 | Hitachi Ltd | マスマーカーの補正方法 |
| US6884996B2 (en) * | 2003-06-04 | 2005-04-26 | Thermo Finnigan Llc | Space charge adjustment of activation frequency |
| JP2005251594A (ja) * | 2004-03-05 | 2005-09-15 | Hitachi High-Technologies Corp | イオントラップ/飛行時間型質量分析計 |
| JP4636943B2 (ja) * | 2005-06-06 | 2011-02-23 | 株式会社日立ハイテクノロジーズ | 質量分析装置 |
-
2012
- 2012-09-14 JP JP2012202786A patent/JP5993259B2/ja active Active
-
2013
- 2013-07-10 WO PCT/JP2013/068837 patent/WO2014041886A1/fr active Application Filing
Patent Citations (2)
| Publication number | Priority date | Publication date | Assignee | Title |
|---|---|---|---|---|
| JP2010529457A (ja) * | 2007-06-02 | 2010-08-26 | セルノ・バイオサイエンス・エルエルシー | 質量分析のための自己較正アプローチ |
| JP2009014424A (ja) * | 2007-07-03 | 2009-01-22 | Shimadzu Corp | クロマトグラフ質量分析装置 |
Non-Patent Citations (1)
| Title |
|---|
| YOSHIHIRO MIZUTANI ET AL.: "Molecular Dynamical Simulation of Space-Charge Effect in a Time-of-Flight Spectrometry", JOURNAL OF THE SPECTROSCOPICAL RESEARCH OF JAPAN, vol. 52, no. 5, 15 October 2003 (2003-10-15), pages 281 - 285 * |
Also Published As
| Publication number | Publication date |
|---|---|
| JP2014059964A (ja) | 2014-04-03 |
| JP5993259B2 (ja) | 2016-09-14 |
Similar Documents
| Publication | Publication Date | Title |
|---|---|---|
| US8428889B2 (en) | Methods of automated spectral peak detection and quantification having learning mode | |
| US7983852B2 (en) | Methods of automated spectral peak detection and quantification without user input | |
| CN109308989B (zh) | 针对校准物中不存在的离子调谐多极杆rf振幅 | |
| US7985948B2 (en) | Systems and methods for analyzing substances using a mass spectrometer | |
| US9482642B2 (en) | Fast method for measuring collision cross section of ions utilizing ion mobility spectrometry | |
| JP6176334B2 (ja) | 質量分析方法、質量分析装置、及び質量分析データ処理プログラム | |
| EP2837933B1 (fr) | Analyseur de masse | |
| JP2010054406A (ja) | クロマトグラフ質量分析データ解析方法及び装置 | |
| US9934946B2 (en) | Plasma processing apparatus and operating method of plasma processing apparatus | |
| US20210172800A1 (en) | Systems and Methods for Analyzing Unknown Sample Compositions Using a Prediction Model Based On Optical Emission Spectra | |
| JP6813033B2 (ja) | 分析データ解析方法および分析データ解析装置 | |
| US20120089342A1 (en) | Methods of Automated Spectral and Chromatographic Peak Detection and Quantification without User Input | |
| JP5757264B2 (ja) | クロマトグラフ質量分析データ処理装置 | |
| WO2019150576A1 (fr) | Spectroscope de masse et procédé d'étalonnage de masse pour spectroscope de masse | |
| JP5993259B2 (ja) | 質量分析システム | |
| US8026479B2 (en) | Systems and methods for analyzing substances using a mass spectrometer | |
| JP5464711B2 (ja) | 質量分析法による定量化のための信号対雑音を改善する方法 | |
| JP6748085B2 (ja) | 干渉検出および着目ピークのデコンボルーション | |
| JP5947567B2 (ja) | 質量分析システム | |
| US20190378702A1 (en) | 3d mass spectrometry predictive classification | |
| JP2005221276A (ja) | クロマトグラフ質量分析用データ処理装置 | |
| CN108780073B (zh) | 色谱仪装置 | |
| JP7334788B2 (ja) | 波形解析方法及び波形解析装置 | |
| US20220013344A1 (en) | Analysis method and non-transitory computer readable medium | |
| JP6896830B2 (ja) | イオン種の質量を判定するためのシステムおよび方法 |
Legal Events
| Date | Code | Title | Description |
|---|---|---|---|
| 121 | Ep: the epo has been informed by wipo that ep was designated in this application |
Ref document number: 13837567 Country of ref document: EP Kind code of ref document: A1 |
|
| NENP | Non-entry into the national phase |
Ref country code: DE |
|
| 122 | Ep: pct application non-entry in european phase |
Ref document number: 13837567 Country of ref document: EP Kind code of ref document: A1 |