WO2014041886A1 - Mass analysis system and method - Google Patents
Mass analysis system and method Download PDFInfo
- Publication number
- WO2014041886A1 WO2014041886A1 PCT/JP2013/068837 JP2013068837W WO2014041886A1 WO 2014041886 A1 WO2014041886 A1 WO 2014041886A1 JP 2013068837 W JP2013068837 W JP 2013068837W WO 2014041886 A1 WO2014041886 A1 WO 2014041886A1
- Authority
- WO
- WIPO (PCT)
- Prior art keywords
- reliability
- mass
- correction
- mass spectrometry
- spectrometry system
- Prior art date
Links
Images


Classifications
-
- H—ELECTRICITY
- H01—ELECTRIC ELEMENTS
- H01J—ELECTRIC DISCHARGE TUBES OR DISCHARGE LAMPS
- H01J49/00—Particle spectrometers or separator tubes
- H01J49/0027—Methods for using particle spectrometers
- H01J49/0036—Step by step routines describing the handling of the data generated during a measurement
-
- H—ELECTRICITY
- H01—ELECTRIC ELEMENTS
- H01J—ELECTRIC DISCHARGE TUBES OR DISCHARGE LAMPS
- H01J49/00—Particle spectrometers or separator tubes
- H01J49/26—Mass spectrometers or separator tubes
- H01J49/34—Dynamic spectrometers
- H01J49/42—Stability-of-path spectrometers, e.g. monopole, quadrupole, multipole, farvitrons
- H01J49/426—Methods for controlling ions
- H01J49/4265—Controlling the number of trapped ions; preventing space charge effects
Definitions
- the present invention relates to a mass spectrometry system and method.
- Patent Document 1 is a document describing the background art of mass spectrometry systems.
- a mass spectrometer is disclosed error in the experimentally determined mass to charge ratios of ions are reported together with an error band for each mass to charge ratio determination.
- the error band may, for example, reflect a 95% probability or confidence that the real, true, actual or accepted ⁇ mass to charge ratio of the ion lies within the error band.By accurately determining the error band the possible candidate ions in a database can be accurately restricted whilst also guarding against over restriction. ''
- the phenomenon that affects mass spectrometry is the “space charge effect”.
- the “space charge effect” is a phenomenon that appears depending on the amount of ions introduced into the mass spectrometer, and specifically refers to a phenomenon that acts to shift the mass axis of the measured spectrum.
- Patent Document 1 described above discloses a mass spectrometer that estimates the amount of blur included in the estimated value of the peak position based on the ion intensity and displays the estimated value. Neither the method of evaluating the reliability of the correction result nor the method of presenting the evaluation result is disclosed.
- the present invention employs, for example, the configuration described in the claims.
- the present specification includes a plurality of means for solving the above-described problems. For example, a space charge effect correction unit that corrects a space charge effect based on a mass spectrum and outputs the corrected spectrum as a corrected spectrum. And a correction reliability calculation unit that calculates the reliability when the correction is performed based on the mass spectrum.
- the mass spectrometry system can calculate the reliability when the space charge effect is corrected based on the mass spectrum. Problems, configurations, and effects other than those described above will be clarified by the following description.
- amendment reliability The figure which shows the example of a user interface screen used for the setting of the determination threshold value of correction
- amendment reliability The figure explaining the detail of the starting process by a present Example.
- the figure explaining the detail of the error processing by a present Example. The figure explaining the correlation between the upper intensity integrated value measured when the ion concentration is 0.02 ppm and the peak position.
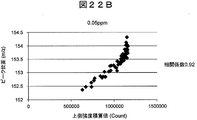
- the figure explaining the correlation between the upper intensity integrated value measured when the ion concentration is 0.05 ppm and the peak position.
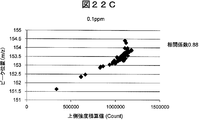
- the figure explaining the correlation between the upper intensity integrated value measured when the ion concentration is 0.1 ppm and the peak position.
- the figure explaining the correlation between the upper intensity integrated value measured when the ion concentration is 0.2 ppm and the peak position.
- the figure explaining the correlation between the upper intensity integrated value measured when the ion concentration is 0.5 ppm and the peak position.
- Example 1 In this example, a mass spectrometry system that can optimize the measurement method and the interpretation method of the mass spectrum according to the amount of ions will be described.
- FIG. 1 shows a hardware configuration of a mass spectrometry system 100 according to the present embodiment.
- a mass spectrometry system 100 includes a central processing unit 101, a user interface unit 102, a storage medium 103, a volatile memory 104, and a mass analysis unit 110.
- the central processing unit 101, the user interface unit 102, the storage medium 103, and the volatile memory 104 constitute a so-called computer.
- the mass spectrometric unit 110 includes a sample introduction unit 111, an ionization unit 112, an ion transport unit 113, an ion trap 114, a detector 115, a high frequency power source 116, and vacuum pumps 117 to 119.
- the vacuum pumps 117 to 119 maintain the pressure (degree of vacuum) of the chambers to which they are connected at appropriate values.
- the sample introduction unit 111 introduces the sample in the form of vapor, mist droplets or fine particles, and sends the introduced sample to the ionization unit 112.
- the ionization unit 112 ionizes the sample introduced in the ion source.
- the ionization method for example, an electrospray ionization method, a sonic spray ionization method, or the like is used.
- the generated ions ride on the gas flow generated by the pressure difference and are transported to the first chamber. The ions are then transported from the first chamber to the second chamber. This transportation is also performed by gas flow.
- an ion transport part 113 and an ion trap 114 are provided in the second room.
- ions are transported to the ion trap 114 via the ion transport part 113.
- the ion trap 114 for example, a quadrupole ion trap, a linear trap, or the like is used.
- the high frequency power supply 116 supplies a high frequency voltage to each of the ion transport unit 113 and the ion trap 114 and traps desired ions in the ion trap 114.
- the central processing unit 101 transports ions to the detector 115 at different times according to the mass-to-charge ratio (m / z) by changing the high-frequency voltage applied to the ion trap 114 with time.
- the detector 115 converts the amount of ions reaching each time into a voltage value, and transmits the voltage value to the central processing unit 101 as a voltage signal.
- the central processing unit 101 converts time to ion m / z with respect to a voltage signal given in time series, thereby obtaining intensity series data (hereinafter referred to as “mass spectrum”) representing the amount of ions corresponding to each m / z. And stored in the volatile memory 104.
- the central processing unit 101 executes space charge effect correction processing based on the mass spectrum stored in the volatile memory 104. This correction process is executed based on an estimation program stored in the storage medium 103.
- the central processing unit 101 presents the spectrum after correcting the space charge effect (hereinafter also referred to as “corrected spectrum”) to the operator through the user interface unit 102.
- the user interface unit 102 may be, for example, a monitor having a touch panel arranged on the display surface, or may be a monitor of an external PC connected via a network.
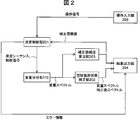
- FIG. 2 shows a functional block configuration of the mass spectrometry system 100 according to the present embodiment.
- the functional blocks excluding the mass analyzer 110 are realized through a program executed by the central processing unit 101.
- the operation input unit 205 outputs an operation signal corresponding to an operator operation input (for example, a start operation or a measurement start operation) to the measurement control unit 201.
- the activation operation and the measurement start operation are input as, for example, pressing a button included in the user interface unit 102.
- the measurement control unit 201 executes a start process and a measurement start process in response to input of each operation signal corresponding to the start operation and the measurement start operation, and outputs a control signal for controlling the state of the mass analyzer 110.
- the measurement control unit 201 outputs a control signal and error information for stopping the mass analysis unit 110 according to the internal state of the system and the correction reliability.
- the error information is, for example, a number indicating the type of error.
- the measurement control unit 201 determines a measurement sequence to be executed next by the mass analysis unit 110 according to the correction reliability, and outputs the measurement sequence to the mass analysis unit 110.
- the measurement sequence is a signal for controlling voltage application, valve opening / closing, detector on / off, etc., used in the accumulation process, the exhaust waiting process, the mass scanning process, the exclusion process, etc. Consists of time series.
- the measurement sequence disclosed in Patent Document 2 is used.
- tandem mass spectrometry measurement processing is executed a plurality of times, such as MS / MS (MS2), MS / MS / MS (MS3), and the like. In that case, the isolation (isolation) step and the dissociation step are arranged between the aforementioned steps.
- FIG. 3 shows an example of a measurement sequence corresponding to MS2.
- the measurement sequence itself shown in FIG. 3 is a general one. For this reason, detailed description of control operations such as opening and closing of the valve executed in the measurement sequence is omitted.
- the mass analyzer 110 performs mass analysis based on the measurement sequence given from the measurement controller 201. As described above, the mass analyzer 110 measures and outputs the mass spectrum of the sample to be measured.
- the mass spectrum here includes the space charge effect.
- the term “mass spectrum” means a spectrum before correcting the space charge effect. Information on the mass spectrum is output to the space charge effect correction unit 202 and the correction reliability calculation unit 203.
- the correction method of the space charge effect is arbitrary.
- the same technique (method for correcting the space charge effect based on the integrated value of ionic strength) as in Japanese Patent Application No. 2011-140089 by the same applicant as the present applicant may be adopted.
- the correction reliability calculation unit 203 calculates a correction reliability that is a measure of the reliability of the correction result of the space charge effect based on the mass spectrum, and outputs the calculated correction reliability.
- the correction reliability is output to the measurement control unit 201 and the result output unit 204.
- the result output unit 204 stores the mass spectrum before correction, the mass spectrum after correction, and the correction reliability in the storage medium 103 and further presents them to the user.
- Examples of the presentation method include presentation of image information by the user interface unit 102, presentation by a braille display, presentation by voice, and printing of image information by a printer.
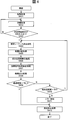
- FIG. 4 shows mass spectrometry processing executed by the mass spectrometry system 100 according to the present embodiment.
- the mass spectrometry system 100 starts to operate based on the operator's activation operation input via the operation input unit 205, and the measurement control unit 201 executes the activation process (step S401).
- the mass spectrometry system 100 enters a standby state for accepting a measurement start operation.
- the measurement control unit 201 executes standby processing.
- the standby process monitoring of the operator's operation input and monitoring of the apparatus state are executed.
- the measurement control unit 201 determines whether or not the operator has performed a measurement start operation. When the measurement start operation is performed, the measurement control unit 201 executes the processes after step S404. If the measurement start operation has not been performed, the measurement control unit 201 returns to step S402.
- step S404 the measurement control unit 201 performs a measurement sequence determination process. Immediately after the start of measurement, the measurement control unit 201 outputs an initially set measurement sequence, and in other cases, the measurement control unit 201 outputs a measurement sequence determined based on the correction reliability.
- the mass analysis unit 110 executes a mass analysis process.
- mass analysis process mass analysis based on a measurement sequence is executed, and a mass spectrum is acquired.
- step S406 the correction reliability calculation unit 203 executes a correction reliability calculation process.
- the correction reliability is calculated based on the mass spectrum. A specific calculation method will be described later.
- step S407 the space charge effect correction unit 202 executes a space charge effect correction process.
- a corrected spectrum Z (z_1,..., Z_M) is calculated.
- step S408 the result output unit 204 executes a result output process.
- the correction reliability and the corrected spectrum are output.
- step S409 the measurement control unit 201 determines whether or not the elapsed time from the start of measurement exceeds a preset threshold TH_C. If the threshold value TH_C is exceeded, the measurement control unit 201 proceeds to step S412. When the threshold value TH_C is not exceeded, the measurement control unit 201 proceeds to step S410, and determines whether or not the correction reliability exceeds a preset threshold value TH1. If the threshold value TH1 is exceeded, the measurement control unit 201 returns to step S404. On the other hand, when the threshold value TH1 is not exceeded, the measurement control unit 201 proceeds to step S411.
- step S411 the result output unit 204 performs error processing based on the error information. For example, a measurement stop command is output as error processing.
- step S412 the result output unit 204 executes measurement stop processing.
- the measurement stop process is performed both when the measurement time passes a predetermined time and when error processing is executed.
- the user interface screen is displayed on the user interface unit 102.
- the user interface screen includes a display area for activation and measurement start buttons corresponding to the operation input unit 205, and a display area for displaying a mass spectrum, correction reliability, a peak position of the mass spectrum, and a peak position of the corrected spectrum.
- the result output unit 204 calculates and draws the peak position. For example, a known centroid process is used to calculate the peak position.
- the corrected spectrum may be displayed instead of the mass spectrum, or both the mass spectrum and the corrected spectrum may be displayed in the display area.
- the information on the mass spectrum and / or the information on the corrected spectrum and the correction reliability are displayed on the same screen. For this reason, the operator can appropriately interpret the mass spectrum measured from the display screen.
- the reliability of the correction result of the space charge effect cannot be confirmed, there is a possibility that the operator misinterprets. Also, the operator could not notice an error in the interpretation of the mass spectrum.
- 5 and 6 are display examples of user interface screens used when the correction reliability is high (in the example, 95%).
- the correction reliability is high, the operator checks the peak position of the corrected spectrum and its numerical information to determine whether a component is present in the sample (presence / absence information) and the type of component contained in the sample (qualitative) Information), the concentration of components contained in the sample (quantitative information), and the like can be estimated with high accuracy.
- the smaller the displayed correction reliability the less reliable the measured mass spectrum and the corrected spectrum.
- the operator can determine from the display content of the correction reliability that presence information / qualitative information / quantitative information should not be read from the corrected spectrum.
- the operator preferentially selects a mass spectrum in which a high correction reliability is displayed from a plurality of mass spectra measured in the past, and estimates presence / absence information / qualitative information / quantitative information, More accurate information can be obtained.
- the correction reliability of the corrected spectrum is low as described above, the operator can remeasure the sample in an appropriate measurement sequence according to the ion amount as a countermeasure.
- the correction reliability is displayed on the same screen together with the information of the mass spectrum or the information of the corrected spectrum, so that the operator can quickly grasp whether the measurement situation is appropriate or not. If the measurement situation is inappropriate or defective, the operator can quickly change the measurement sequence.
- FIG. 7 is a display example of a user interface screen used when the correction reliability is low.
- the fact that the space charge effect cannot be corrected is clearly indicated by the notation “correction impossible”, and the operator is warned.
- This non-correctable display has an effect of preventing the operator from reading presence / absence information, qualitative information, and quantitative information from the displayed spectrum. Whether or not to display a non-correctable display may be determined based on a comparison result between the correction reliability and an appropriate threshold set in advance.
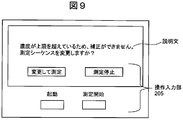
- the user interface screen shown in FIG. 8 displays a sentence explaining that the reliability of the current measurement is low.
- the explanation in FIG. 8 is a content that prompts the operator to adjust the concentration of the sample and perform remeasurement.
- the operator adjusts the concentration of the sample according to the explanatory text and performs remeasurement, a mass spectrum with high measurement accuracy can be obtained.
- the error number is displayed together with the explanatory text, but the error type name may be displayed instead of the error number.
- a “change and measure” button that prompts the operator to change the measurement sequence and a “measurement stop” button that prompts the operator to stop the measurement itself are prepared as the operation input unit 205 together with the explanatory text. Has been.
- the measurement control unit 201 changes the measurement sequence so as to reduce the amount of ions transported to the ion trap 114, and executes the measurement process again. For example, if the measurement sequence is changed so as to appropriately shorten the ion accumulation time, the ion concentration can be reduced. If remeasurement is performed in this state, a mass spectrum with higher measurement accuracy than the previous measurement can be obtained.
- the measurement control unit 201 executes a measurement stop process (step S412) and stops the analysis process by the mass spectrometry system.
- a measurement stop process step S412
- the analysis process can be stopped based on the operator's intention.
- the “measurement stop” button is prepared in addition to the “change and measure” button, so that the measurement sequence is inadvertently changed, resulting in confusion when the operator interprets the mass spectrum. The situation can be prevented.
- the mass spectrum information and / or the corrected spectrum information and the correction reliability are simultaneously displayed in the user interface screen. Therefore, the reliability of the correction result can be confirmed before the operator interprets the displayed spectrum. Further, based on the reliability of the confirmed correction result, the measurement sequence can be changed so that the amount of ions at the time of measurement can be optimized, and the method for interpreting the measured mass spectrum can be changed.
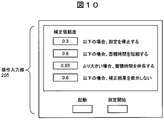
- FIG. 10 and 11 show user interface screens suitable for use in setting a correction reliability determination threshold value.
- the user interface screen shown in FIG. 10 is an example in which a threshold value can be received by inputting a numerical value on the input form. Note that the number of threshold values that can be set is not necessarily one, and as shown in FIG. 10, threshold values for determination may be set corresponding to each of the four processing operations.
- FIG. 11 is a user interface screen that allows the same setting to be input by the position of the slider bar. In particular, as shown in FIG. 11, in the case of a user interface screen in which the position of the threshold value can be input at the position of the slider bar, the operator can easily grasp the magnitude relationship and approximate size of each threshold value, and can be set easily. .
- the threshold value can include a threshold value for determining whether or not to display the corrected spectrum on the screen. For example, when the correction reliability is higher than the threshold value, the mass spectrum and the corrected spectrum are displayed on the screen as shown in FIGS. On the other hand, when the correction reliability is lower than the threshold value, the mass spectrum and the corrected spectrum can be prevented from being displayed on the screen as shown in FIGS.
- FIG. 12 shows the detailed process of the activation process (step S401).
- the measurement control unit 201 performs a vacuum degree initialization process (step S1201).
- the measurement control unit 201 drives the vacuum pumps 117 to 119 to exhaust, reduces the chamber connected to each pump to an appropriate pressure, and maintains the pressure.
- the measurement control unit 201 performs a cleaning process (step S1202).
- the measurement control unit 201 requests the operator to introduce a sample such as ammonia into the sample introduction unit 111 through the user interface unit 102, and waits for the introduction of the sample to execute the measurement process.
- the substance (carry over) adsorbed on the sample introduction unit 111 during the previous measurement is washed.
- the measurement control unit 201 executes a mass-to-charge ratio calibration process (step S1203).
- the measurement control unit 201 causes the operator to introduce a standard material sample having a peak at a known m / z into the sample introduction unit 111 through the user interface unit 102, and introduce the sample. Wait and execute the measurement process.
- the measurement control unit 201 creates a correspondence table b (m) between each element number on the mass spectrum array and m / z based on the measured peak position of the mass spectrum.
- the measurement control unit 201 performs a blank check (step S1204).
- the measurement control unit 201 causes the operator to introduce a known sample that does not contain the measurement target component into the sample introduction unit 111, and waits for the introduction of the sample before executing the measurement process.
- the measurement control unit 201 executes processing for determining whether or not the measured spectrum is normal (step S1205).
- the measurement control unit 201 determines that the spectrum is normal and ends the activation process.
- the measurement control unit 201 determines that the spectrum is abnormal, and returns to the cleaning process (step S1202).
- an example of a condition for determining that “the measured spectrum is normal” is, for example, that a large peak does not exist in the measured spectrum.
- Another example is that, for example, when the measured spectrum is regarded as an M-dimensional vector, the cosine similarity calculated between the reference spectrum measured in the past is higher than a predetermined threshold.
- an appropriate known method may be used to determine whether or not it is normal.
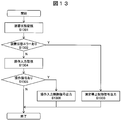
- FIG. 13 shows the detailed processing of the standby processing (step S402).
- the measurement control unit 201 performs apparatus state monitoring processing (step S1301).
- the measurement control unit 201 monitors the apparatus state such as the degree of vacuum, the voltage value, and the temperature of the mass analysis unit 110.
- the measurement control unit 201 determines whether there is an error in the apparatus state (step S1302). When it is determined that there is an error in the apparatus state, the measurement control unit 201 performs a measurement stop control signal output process (step S1303). In the measurement stop control signal output process, the measurement control unit 201 outputs a control signal for instructing to stop the measurement to the mass analysis unit 110, and ends the standby process. On the other hand, when there is no error in the apparatus state, the measurement control unit 201 executes an operation input monitoring process (step S1304). In the operation input monitoring process, the measurement control unit 201 monitors an operation signal input from the operation input unit 205.
- the operation control unit 201 determines the presence or absence of an operation signal (step S1305).
- the operation control unit 201 executes an operation input control signal output process (step S1306).
- the operation control unit 201 outputs a control signal corresponding to the operation input to the mass analyzer 110, and ends the standby process.
- the operation control unit 201 immediately ends the standby process.
- FIG. 14 shows the detailed process of the measurement sequence determination process (step S404).
- the measurement control unit 201 determines whether or not it is immediately after the start of measurement (step S1401). In the case immediately after the start of measurement, the measurement control unit 201 executes an initial setting measurement sequence output process (step S1402). Here, the measurement control unit 201 outputs the initial measurement sequence to the mass analysis unit 110, and ends the measurement sequence determination process.
- the measurement control unit 201 determines whether or not the correction reliability calculated for the previous measurement sequence is greater than the threshold value TH2 (step S1403).
- the threshold value TH2 is smaller than a threshold value TH3 described later.
- the measurement control unit 201 outputs a measurement sequence that shortens the time for accumulating ions to the mass analysis unit 110 (step S1404).
- the accumulation time ACC calculated based on (Equation 1) is output as a measurement sequence to the mass analyzer 110, and the measurement sequence determination process ends.
- step S1405 the measurement control unit 201 determines whether the correction reliability is greater than the threshold value TH3.
- the measurement control unit 201 outputs the same measurement sequence as the previous time (that is, a measurement sequence in which the accumulation time is not changed) to the mass analysis unit 110, and ends the measurement sequence determination process ( Step S1406).
- the measurement control unit 201 outputs a measurement sequence that extends the time for accumulating ions to the mass analysis unit 110 (step S1407).
- the accumulation time ACC calculated in (Equation 2) is output as a measurement sequence to the mass analyzer 110, and the measurement sequence determination process ends.
- the mass spectrometry system can increase the SN ratio of the mass spectrum as much as possible while maintaining high measurement accuracy.
- FIG. 15 shows the detailed process of the correction reliability calculation process (step S406).
- the correction reliability calculation unit 203 executes a peak extraction process (step S1501).
- the correction reliability calculation unit 203 lists a plurality (p, q) of peak positions (m / z) p and intensity q from the mass spectrum.
- a known appropriate method can be applied to this treatment. For example, it can be realized by smoothing a mass spectrum and fitting a Lorentz function or fitting a Gaussian function.
- a known appropriate smoothing method such as a Gaussian filter, a Savitzky-Golay filter, or a spline approximation can be used.
- the correction reliability calculation unit 203 executes a peak selection process (step S1502).
- the correction reliability calculation unit 203 selects one or a plurality of peaks used for calculation of the correction reliability from the plurality of listed peaks.
- the correction reliability can be calculated robustly even when some peaks cannot be extracted due to the influence of a miscellaneous component or when the subsequent width calculation process (step S1503) is low accuracy. it can.
- a peak derived from a known standard substance is used. Since it is guaranteed that the standard substance is contained in the sample, the correction reliability can be calculated with high accuracy when using the peak derived from the standard substance.
- the standard substance may be a substance mixed with the sample at the time of measurement, or may be a substance known in advance from the beginning. Also, a specified number of peaks may be selected in descending order of intensity. Since a peak with a high intensity generally has a high SN ratio, the subsequent width calculation process (step S1503) can be executed with high accuracy, and as a result, the correction reliability can also be calculated with high accuracy.
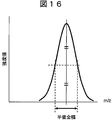
- the correction reliability calculation unit 203 executes a width calculation process (step S1503).
- the width calculation process the correction reliability calculation unit 203 calculates the width w ′ of each peak selected in the previous step, and further calculates a width w representing the plurality of widths.
- the width w ′ here is, for example, the full width at half maximum of the peak (FIG. 16), the half width at half maximum of the Lorentz function fitted by peak extraction (half the full width at half maximum), the standard deviation of the Gaussian function fitted by peak extraction, and the peak of the mass spectrum. It can be given as a statistic indicating the shape of the distribution such as standard deviation in the vicinity, exp ( ⁇ k) calculated from the kurtosis k near the peak of the mass spectrum.
- the peak width to be calculated is an example of a peak waveform.
- the correction reliability calculation unit 203 executes intensity integrated value calculation processing (step S1504).
- the correction reliability calculation unit 203 calculates the integrated intensity value TIC of the mass spectrum using (Equation 3).
- X (m) is the intensity value of the mth peak constituting the mass spectrum.
- the correction reliability calculation unit 203 executes a correction reliability calculation process (step S1505).
- the correction reliability calculation unit 203 calculates the correction reliability c based on (Equation 4), and ends the correction reliability calculation process.
- the target peak intensity q means the intensity q of the pair of peaks (p, q) used for the width calculation.
- FIG. 17 shows the detailed process of the space charge effect correction process (step S407).
- the space charge effect correction unit 202 performs a peak extraction process (step S1701).
- the space charge effect correction unit 202 lists pairs (p, q) of a plurality of peak positions p and intensities q from the mass spectrum, as in the correction reliability calculation unit 203.
- the space charge effect correction unit 202 executes an upper intensity integrated value calculation process (step S1702).
- the space charge effect correction unit 202 provides an upper intensity integrated value HIC that gives an estimated value of the amount of ions that exist in the trap and have an influence of the space charge effect at the time when each peak is measured. Is calculated based on (Equation 5).
- W is an appropriate weighting function that expresses the influence of each m / z ion on the space peak effect on the peak ion to be corrected.
- the upper intensity integrated value HIC is calculated for mass scanning from the low mass side to the high mass side, but conversely, when mass scanning is performed from the high mass side to the low mass side, the lower intensity is calculated.
- the integrated value LIC is calculated and used in place of the upper intensity integrated value HIC in the processing described later.
- the space charge effect correction unit 202 executes space charge effect removal m / z calculation processing (step S1703).
- the space charge effect correcting unit 202 corrects the peak position m based on (Equation 6), and the corrected peak position m ⁇ (the position of the symbol “ ⁇ ” here is for convenience, and the symbol “ ⁇ "Is expressed on m as shown in Equation 6. The same applies hereinafter.
- the peak position is m / z, it is represented by m in Equation 6. The same applies to Equation 7.
- G (•) is a function obtained in advance as a relationship between the upper intensity integrated value HIC and the shift amount of the q value.
- the space charge effect correction unit 202 executes a calibrated m / z calculation process (step S1704).
- the space charge effect correction unit 202 is a correspondence table b (m) between each element number on the mass spectrum array calculated in the mass-to-charge ratio calibration process (step S1203) and m / z. ) Based on m / z m ⁇ corresponding to the corrected peak position m ⁇ (the notation of the symbol " ⁇ " here is for convenience, and the symbol “ ⁇ " The same shall apply hereinafter).
- the space charge effect correction unit 202 executes a corrected spectrum output process (step S1705).
- the space charge effect correction unit 202 calculates the corrected spectrum Z based on (Equation 7) based on the peak set (p, q) and its correction value m ⁇ z. Calculate and output.
- the space charge effect correction unit 202 calculates the corrected spectrum Z by superimposing the Lorentz function or Gaussian function fitted for each peak in the peak extraction process in step S1501 on the peak set (p, q). May be.
- FIG. 18 shows detailed processing of the result output processing (step S408).
- the result output unit 204 executes data storage processing (step S1801).
- the result output unit 204 stores the input mass spectrum X, the corrected spectrum Z, and the corrected reliability c in the storage medium 103.
- FIG. 19 shows a data structure used when these data are stored in the storage medium 103.
- the user interface screen illustrated in FIGS. 5 to 9 can be displayed at high speed. it can. With this display, the operator can quickly change to an appropriate measurement sequence according to the amount of ions at the time of measurement and change the interpretation method of the measured mass spectrum.
- the result output unit 204 executes a mass spectrum display process (step S1802).
- the result output unit 204 displays a mass spectrum on the user interface screen.
- the result output unit 204 executes a correction reliability display process (step S1803).
- the result output unit 204 displays the correction reliability on the user interface screen.
- the result output unit 204 determines whether or not the correction reliability is greater than the threshold value TH2 (step S1804). If the correction reliability is greater than the threshold value TH2, the result output unit 204 proceeds to step S1805. On the other hand, when the correction reliability is equal to or lower than the threshold value TH2, the result output unit 204 proceeds to step S1806.
- step S1805 the result output unit 204 executes a peak position display process of the corrected spectrum.
- the result output unit 204 displays the peak position of the corrected spectrum on the user interface screen, and ends the result output process.
- step S1806 the result output unit 204 executes an uncorrectable display process.
- the result output unit 204 displays that the space charge effect cannot be corrected on the user interface screen, and ends the result output process.
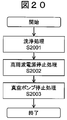
- FIG. 20 shows the detailed process of the measurement stop process (step S412).
- the measurement control unit 201 performs a cleaning process (step S2001).
- the cleaning process here is the same as the cleaning process in step S1202.
- the measurement control unit 201 executes a high-frequency power supply stop process (step 2002).
- the measurement control unit 201 controls to stop the operation of the high frequency power supply 116.
- the measurement control unit 201 executes a vacuum pump stop process (step S2003). In this vacuum pump stop process, the measurement control unit 201 stops the operation of the vacuum pumps 117 to 119.
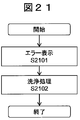
- FIG. 21 shows detailed processing of error processing (step S411).
- the result output unit 204 executes an error display process (step S2101).
- the result output unit 204 explicitly displays error information on the user interface screen as illustrated in FIG.
- the result output unit 204 executes a cleaning process (step S2102).
- the cleaning process here is the same as the cleaning process in step S1202.
- the lower the calculated correction reliability the longer the cleaning time.
- 22A to 22G show the relationship between the upper intensity integrated value HIC for each concentration and the peak position m / z when mass analysis is performed by changing the concentration of ions having a peak position m / z of 150 from 0.02 ppm to 1 ppm. Is plotted for each scan.
- the upper intensity integrated value HIC gives a relatively good estimate of the amount of ions in the trap.
- the amount of shift between the intensity integrated value HIC and the peak position m / z has a high positive correlation. For this reason, the peak position can be corrected with high accuracy based on (Expression 5) and (Expression 6).
- the inventors presume that such a decrease in correlation is caused by the following principle.
- FIG. 23 shows the relationship between each concentration and the full width at half maximum of the measured peak for the same measurement sequence.
- the full width at half maximum tends to increase as the concentration increases. Assuming this cause, it is considered that when the amount of ions in the ion trap 114 is large, the pseudopotential felt by the ions becomes shallow, and the ions are measured at m / z that is wider than the original m / z. It is done. In fact, the full width at half maximum monotonously increases even near the threshold (0.1 ppm, around 0.2 ppm) where the correlation was weak in the relationship between the upper intensity integrated value HIC and the shift amount of the peak position m / z.
- the full width at half maximum of the peak monotonously increases even near the threshold (around 0.1 ppm and 0.2 ppm in the above example) where the correlation between the upper intensity integrated value HIC and the shift amount of the peak position m / z weakens. . For this reason, it is possible to determine whether or not the correction result of the space charge effect is reliable by thresholding the full width at half maximum. Further, since the full width at half maximum increases continuously, it can be used as a continuous reliability indicating whether or not the correction result of the space charge effect is reliable.
- FIG. 23 shows the relationship between the full width at half maximum of the peak and the concentration, but exp ( ⁇ k) calculated from the standard deviation near the peak and the kurtosis k is also between the half width of the peak and the concentration. A similar relationship between the full width at half maximum and the concentration is also observed between the concentrations.
- the reliability of the correction result of the space charge effect can be calculated and presented to the operator as the correction reliability (FIGS. 5 to 9). Further, if the correction reliability is displayed on the user interface screen together with the mass spectrum information and / or the corrected spectrum information, the operator can correctly interpret the displayed mass spectrum.
- This function of presenting the correction reliability of the space charge effect is particularly useful when the operator has little or no expertise or when it is difficult to strictly adjust the inspection environment such as a portable mass spectrometry system.
- portable mass spectrometry systems include on-site illegal drug detection devices.
- this presentation function is useful in that the measurement environment can be quantitatively confirmed even when the operator has expertise or in the case of a mass spectrometry system used in a laboratory or the like.
- the mass spectrometry system 100 can automatically select the measurement sequence so that the amount of ions introduced into the ion trap 114 becomes an appropriate amount according to the calculated correction reliability. Thereby, even when the correction reliability of the space charge effect is low, the correction reliability can be increased for the space charge effect in the next measurement sequence.
- the operator can select remeasurement, measurement sequence change, measurement stop, etc. through the user interface screen. By mounting this function, it is possible to prevent an operator from unintentionally changing the measurement sequence and executing the measurement operation.
- a function for automating the change of the measurement sequence or the like based on the comparison result between the correction reliability and the threshold value is provided.
- the threshold value that defines the execution of each operation can be freely set by the operator through the user interface screen, the operator's intention can be reflected in the automation process.
- Example 2 In the present embodiment, a mass spectrometry system capable of calculating the correction reliability with higher accuracy than in the first embodiment will be described.
- the basic hardware configuration and functional configuration of the mass spectrometry system according to the present embodiment are the same as those of the first embodiment.
- the correction reliability calculation process step S406
- FIG. 24 shows the detailed process of the correction reliability calculation process (step S406) used in the present embodiment.
- the correction reliability calculation unit 203 performs a peak extraction process on the mass spectra of all the scans measured up to now (step S2401).
- the contents of the peak extraction process may be the same as in step S1501.
- the correction reliability calculation unit 203 selects one or a plurality of peaks used for calculation of the correction reliability from the extracted plurality of peaks (step S2402).
- the correction reliability calculation unit 203 selects, for example, one or a plurality of peaks extracted in common from the largest number of mass spectra among a plurality of mass spectra corresponding to each scan.
- the correction reliability calculation unit 203 calculates the upper intensity integrated value HIC of the peak extracted in the previous step for the mass spectrum of each scan (step S2403).
- the correction reliability calculation unit 203 executes a correlation coefficient calculation process (step 2404).
- the correction reliability calculation unit 203 calculates the correlation coefficient R between the upper intensity integrated value HIC and the peak position m / z for the same peak for the mass spectra of all scans. That is, a correlation coefficient R equivalent to that calculated for each graph of FIGS. 22A to 22G is calculated.
- the correction reliability calculation unit 203 executes a correction reliability calculation process (step S2405).
- the correction reliability calculation unit 203 substitutes the correlation coefficient R for the correction reliability, and ends the correction reliability calculation process.
- the correlation coefficient R is used instead of certain peak width information (for example, full width at half maximum).
- the correlation coefficient R obtained for a statistically significant peak extracted from the results of a plurality of scans is used as the correction reliability instead of the information of a single peak.
- the correlation coefficient R is directly related to the quality of the correction result of the space charge effect. For this reason, compared with the case of Example 1, the correction reliability of higher precision can be obtained.
- Example 3 a mass spectrometry system capable of calculating the correction reliability more robustly and with a lower processing amount than that of the first embodiment will be described.
- the basic hardware configuration and functional configuration of the mass spectrometry system according to the present embodiment are the same as those of the first embodiment.
- the correction reliability calculation process step S406
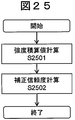
- FIG. 25 shows the detailed process of the correction reliability calculation process (step S406) used in this embodiment.
- the correction reliability calculation unit 203 executes intensity integrated value calculation processing (step S2501).
- the correction reliability calculation unit 203 calculates the integrated intensity value TIC.
- the correction reliability calculation unit 203 executes a correction reliability calculation process (step S2502).
- the correction reliability calculation unit 203 calculates the correction reliability c using (Equation 8).
- Equation 8] c exp ( ⁇ ⁇ TIC) (Formula 8)
- ⁇ is a positive constant set in advance.
- Equation 8 means that the smaller the integrated intensity value TIC, the higher the correction reliability c, and the larger the integrated intensity value TIC, the smaller the corrected reliability c.
- the correction reliability is calculated without calculating the peak extraction or the full width at half maximum. Therefore, even when it is difficult to extract a peak or calculate the full width at half maximum due to an influence of a contaminating component or the like, the correction reliability can be calculated robustly. Further, the method of this embodiment can operate with a low processing amount. However, as described above, if the amount of ions increases excessively, the increase in the amount of ions does not correlate with the integrated intensity value, so that the dynamic range of the amount of ions is considered to be narrower than in Example 1. Therefore, this embodiment is effective at a relatively low concentration.
- this invention is not limited to an above-described Example, Various modifications are included.
- the above-described embodiments have been described in detail for easy understanding of the present invention, and are not necessarily limited to those having all the configurations described.
- a part of the configuration of one embodiment can be replaced with the configuration of another embodiment, and the configuration of another embodiment can be added to the configuration of one embodiment.
- each of the above-described configurations, functions, processing units, processing means, and the like may be realized by hardware by designing a part or all of them with, for example, an integrated circuit.
- Each of the above-described configurations, functions, and the like may be realized by software by interpreting and executing a program that realizes each function by the processor.
- Information such as programs, tables, and files for realizing each function can be stored in a memory, a recording device such as a hard disk or SSD (Solid State Drive), or a recording medium such as an IC card, SD card, or DVD.
- control lines and information lines indicate what is considered necessary for the explanation, and not all the control lines and information lines on the product are necessarily shown. Actually, it may be considered that almost all the components are connected to each other.
Abstract
This mass analysis system has: a mass analysis unit (110) for measuring a sample and outputting a mass spectrum; a space charge effect correction unit (202) for correcting for the space charge effect on the basis of the mass spectrum and outputting same as a corrected spectrum; and a correction reliability calculation unit (203) for calculating the reliability when a correction has been made on the basis of the mass spectrum. According to the present invention, the reliability of the effect of correcting for the space charge effect can be accurately assessed.
Description
本発明は、質量分析システム及び方法に関する。
The present invention relates to a mass spectrometry system and method.
現在、質量分析法を用いて試料の分子量を正確に計測するシステム(以下「質量分析システム」という)が、様々な用途で用いられている。質量分析システムの背景技術を記述する文献には、例えば特許文献1がある。特許文献1には、「A mass spectrometer is
disclosed wherein the experimentally determined mass to charge ratios of ions are reported together with an error band for each mass to charge ratio determination. The error band may, for example, reflect a 95% probability or confidence that the real, true, actual or accepted mass to charge ratio of the ion lies within the error band. By accurately determining the error band the possible candidate ions in a database can be accurately restricted whilst also guarding against over restriction.」との記載が認められる。 Currently, a system that accurately measures the molecular weight of a sample using mass spectrometry (hereinafter referred to as “mass spectrometry system”) is used in various applications. For example,Patent Document 1 is a document describing the background art of mass spectrometry systems. In Patent Document 1, “A mass spectrometer is
disclosed error in the experimentally determined mass to charge ratios of ions are reported together with an error band for each mass to charge ratio determination.The error band may, for example, reflect a 95% probability or confidence that the real, true, actual or accepted `` mass to charge ratio of the ion lies within the error band.By accurately determining the error band the possible candidate ions in a database can be accurately restricted whilst also guarding against over restriction. ''
disclosed wherein the experimentally determined mass to charge ratios of ions are reported together with an error band for each mass to charge ratio determination. The error band may, for example, reflect a 95% probability or confidence that the real, true, actual or accepted mass to charge ratio of the ion lies within the error band. By accurately determining the error band the possible candidate ions in a database can be accurately restricted whilst also guarding against over restriction.」との記載が認められる。 Currently, a system that accurately measures the molecular weight of a sample using mass spectrometry (hereinafter referred to as “mass spectrometry system”) is used in various applications. For example,
disclosed error in the experimentally determined mass to charge ratios of ions are reported together with an error band for each mass to charge ratio determination.The error band may, for example, reflect a 95% probability or confidence that the real, true, actual or accepted `` mass to charge ratio of the ion lies within the error band.By accurately determining the error band the possible candidate ions in a database can be accurately restricted whilst also guarding against over restriction. ''
質量分析に影響を与える現象に「空間電荷効果」がある。「空間電荷効果」とは、質量分析計に導入されるイオン量に依存して出現する現象であり、具体的には計測されたスペクトルの質量軸をずらすように作用する現象をいう。ただし、現在のところ、測定結果に含まれる空間電荷効果の補正結果の信頼度を評価して提示する技術は知られていない。例えば前述した特許文献1には、イオン強度に基づいてピーク位置の推定値に含まれるぶれ量の大きさを推定し、その推定値を表示する質量分析計が開示されているが、空間電荷効果の補正結果の信頼度を評価する方法も評価結果を提示する方法も開示されていない。
The phenomenon that affects mass spectrometry is the “space charge effect”. The “space charge effect” is a phenomenon that appears depending on the amount of ions introduced into the mass spectrometer, and specifically refers to a phenomenon that acts to shift the mass axis of the measured spectrum. However, at present, there is no known technique for evaluating and presenting the reliability of the correction result of the space charge effect included in the measurement result. For example, Patent Document 1 described above discloses a mass spectrometer that estimates the amount of blur included in the estimated value of the peak position based on the ion intensity and displays the estimated value. Neither the method of evaluating the reliability of the correction result nor the method of presenting the evaluation result is disclosed.
上記課題を解決するために、本発明は、例えば請求の範囲に記載の構成を採用する。本明細書には、上記課題を解決する手段が複数含まれているが、その一例を挙げるならば、質量スペクトルに基づいて空間電荷効果を補正し、補正後スペクトルとして出力する空間電荷効果補正部と、質量スペクトルに基づいて、前記補正をした場合の信頼度を算出する補正信頼度算出部とを有する質量分析システムである。
In order to solve the above-described problems, the present invention employs, for example, the configuration described in the claims. The present specification includes a plurality of means for solving the above-described problems. For example, a space charge effect correction unit that corrects a space charge effect based on a mass spectrum and outputs the corrected spectrum as a corrected spectrum. And a correction reliability calculation unit that calculates the reliability when the correction is performed based on the mass spectrum.
本発明によれば、質量分析システムは、質量スペクトルに基づいて空間電荷効果を補正した場合の信頼度を算出することができる。前述した以外の課題、構成及び効果は、以下の説明により明らかにされる。
According to the present invention, the mass spectrometry system can calculate the reliability when the space charge effect is corrected based on the mass spectrum. Problems, configurations, and effects other than those described above will be clarified by the following description.
以下、図面に基づいて、本発明の実施の形態を説明する。なお、本発明の実施の形態は、後述する実施例に限定されるものではなく、その技術思想の範囲において、種々の変形が可能である。
Hereinafter, embodiments of the present invention will be described with reference to the drawings. The embodiment of the present invention is not limited to the examples described later, and various modifications are possible within the scope of the technical idea.
[実施例1]
本実施例では、測定方法及び質量スペクトルの解釈方法を、イオン量に応じて最適化できる質量分析システムについて説明する。 [Example 1]
In this example, a mass spectrometry system that can optimize the measurement method and the interpretation method of the mass spectrum according to the amount of ions will be described.
本実施例では、測定方法及び質量スペクトルの解釈方法を、イオン量に応じて最適化できる質量分析システムについて説明する。 [Example 1]
In this example, a mass spectrometry system that can optimize the measurement method and the interpretation method of the mass spectrum according to the amount of ions will be described.
(システム構成)
図1に、本実施例に係る質量分析システム100のハードウェア構成を示す。本実施例に係る質量分析システム100は、中央演算装置101、ユーザインタフェース部102、記憶媒体103、揮発性メモリ104、質量分析部110で構成される。因みに、中央演算装置101、ユーザインタフェース部102、記憶媒体103、揮発性メモリ104は、いわゆるコンピュータを構成する。 (System configuration)
FIG. 1 shows a hardware configuration of a mass spectrometry system 100 according to the present embodiment. A mass spectrometry system 100 according to this embodiment includes acentral processing unit 101, a user interface unit 102, a storage medium 103, a volatile memory 104, and a mass analysis unit 110. Incidentally, the central processing unit 101, the user interface unit 102, the storage medium 103, and the volatile memory 104 constitute a so-called computer.
図1に、本実施例に係る質量分析システム100のハードウェア構成を示す。本実施例に係る質量分析システム100は、中央演算装置101、ユーザインタフェース部102、記憶媒体103、揮発性メモリ104、質量分析部110で構成される。因みに、中央演算装置101、ユーザインタフェース部102、記憶媒体103、揮発性メモリ104は、いわゆるコンピュータを構成する。 (System configuration)
FIG. 1 shows a hardware configuration of a mass spectrometry system 100 according to the present embodiment. A mass spectrometry system 100 according to this embodiment includes a
質量分析部110は、試料導入部111、イオン化部112、イオン輸送部113、イオントラップ114、検出器115、高周波電源116、真空ポンプ117~119から構成される。真空ポンプ117~119は、それぞれが接続される室の圧力(真空度)を適切な値に維持する。
The mass spectrometric unit 110 includes a sample introduction unit 111, an ionization unit 112, an ion transport unit 113, an ion trap 114, a detector 115, a high frequency power source 116, and vacuum pumps 117 to 119. The vacuum pumps 117 to 119 maintain the pressure (degree of vacuum) of the chambers to which they are connected at appropriate values.
試料導入部111は、試料を蒸気、霧状液滴又は微粒子の形態で導入し、導入された試料をイオン化部112に送る。イオン化部112は、イオン源において導入された試料をイオン化する。イオン化方法には、例えばエレクトロスプレーイオン化法、ソニックスプレーイオン化法などを用いる。生成されたイオンは、圧力差により生じたガス流に乗り、1つ目の室に輸送される。その後、イオンは、1つ目の室から2つ目の室に輸送される。この輸送もガス流により行われる。
The sample introduction unit 111 introduces the sample in the form of vapor, mist droplets or fine particles, and sends the introduced sample to the ionization unit 112. The ionization unit 112 ionizes the sample introduced in the ion source. As the ionization method, for example, an electrospray ionization method, a sonic spray ionization method, or the like is used. The generated ions ride on the gas flow generated by the pressure difference and are transported to the first chamber. The ions are then transported from the first chamber to the second chamber. This transportation is also performed by gas flow.
2つ目の室内には、イオン輸送部113とイオントラップ114が設けられている。2つ目の室内において、イオンは、イオン輸送部113を介してイオントラップ114に輸送される。イオントラップ114には、例えば四重極イオントラップ、リニアトラップ等を使用する。
In the second room, an ion transport part 113 and an ion trap 114 are provided. In the second chamber, ions are transported to the ion trap 114 via the ion transport part 113. As the ion trap 114, for example, a quadrupole ion trap, a linear trap, or the like is used.
高周波電源116は、イオン輸送部113とイオントラップ114のそれぞれに高周波電圧を供給し、イオントラップ114にて所望のイオンをトラップする。中央演算装置101は、イオントラップ114に印加する高周波電圧を時間的に変化させることにより、イオンを質量対電荷比(m/z)に応じて異なる時刻に検出器115に輸送する。検出器115は、各時刻に到達したイオンの量を電圧値に変換し、電圧信号として中央演算装置101に送信する。
The high frequency power supply 116 supplies a high frequency voltage to each of the ion transport unit 113 and the ion trap 114 and traps desired ions in the ion trap 114. The central processing unit 101 transports ions to the detector 115 at different times according to the mass-to-charge ratio (m / z) by changing the high-frequency voltage applied to the ion trap 114 with time. The detector 115 converts the amount of ions reaching each time into a voltage value, and transmits the voltage value to the central processing unit 101 as a voltage signal.
中央演算装置101は、時系列に与えられる電圧信号に対し、時刻をイオンのm/zに変換することにより、各m/zに対応するイオンの量を表わす強度の系列データ(以下「質量スペクトル」という)に置き換え、揮発性メモリ104に格納する。ここで、質量スペクトルは、要素数Mの配列形式X=(x_1, ..., x_M)として格納される。中央演算装置101は、揮発性メモリ104に格納した質量スペクトルに基づいて空間電荷効果の補正処理を実行する。この補正処理は、記憶媒体103に格納された推定プログラムに基づいて実行される。中央演算装置101は、空間電荷効果を補正した後のスペクトル(以下「補正後スペクトル」ともいう)を、ユーザインタフェース部102を通じてオペレータに提示する。ユーザインタフェース部102は、例えばタッチパネルを表示面に配置したモニタであってもよく、ネットワーク経由で接続された外部PCのモニタなどであってもよい。
The central processing unit 101 converts time to ion m / z with respect to a voltage signal given in time series, thereby obtaining intensity series data (hereinafter referred to as “mass spectrum”) representing the amount of ions corresponding to each m / z. And stored in the volatile memory 104. Here, the mass spectrum is stored as an array format X = (x_1,..., X_M) having M elements. The central processing unit 101 executes space charge effect correction processing based on the mass spectrum stored in the volatile memory 104. This correction process is executed based on an estimation program stored in the storage medium 103. The central processing unit 101 presents the spectrum after correcting the space charge effect (hereinafter also referred to as “corrected spectrum”) to the operator through the user interface unit 102. The user interface unit 102 may be, for example, a monitor having a touch panel arranged on the display surface, or may be a monitor of an external PC connected via a network.
(機能ブロック構成)
図2に、本実施例に係る質量分析システム100の機能ブロック構成を示す。図中、質量分析部110を除く機能ブロックの一部又は全部は、中央演算装置101で実行されるプログラムを通じて実現される。 (Function block configuration)
FIG. 2 shows a functional block configuration of the mass spectrometry system 100 according to the present embodiment. In the drawing, some or all of the functional blocks excluding the mass analyzer 110 are realized through a program executed by thecentral processing unit 101.
図2に、本実施例に係る質量分析システム100の機能ブロック構成を示す。図中、質量分析部110を除く機能ブロックの一部又は全部は、中央演算装置101で実行されるプログラムを通じて実現される。 (Function block configuration)
FIG. 2 shows a functional block configuration of the mass spectrometry system 100 according to the present embodiment. In the drawing, some or all of the functional blocks excluding the mass analyzer 110 are realized through a program executed by the
操作入力部205は、オペレータの操作入力(例えば起動操作、測定開始操作)に対応する操作信号を測定制御部201に出力する。起動操作や測定開始操作は、例えばユーザインタフェース部102が有するボタンの押下として入力される。
The operation input unit 205 outputs an operation signal corresponding to an operator operation input (for example, a start operation or a measurement start operation) to the measurement control unit 201. The activation operation and the measurement start operation are input as, for example, pressing a button included in the user interface unit 102.
測定制御部201は、起動操作や測定開始操作に対応する各操作信号の入力に応じ、起動処理や測定開始処理を実行し、質量分析部110の状態を制御する制御信号を出力する。また、測定制御部201は、システムの内部状態及び補正信頼度に応じ、質量分析部110を停止制御する制御信号及びエラー情報を出力する。ここで、エラー情報は、例えばエラーの種類を表す番号である。
The measurement control unit 201 executes a start process and a measurement start process in response to input of each operation signal corresponding to the start operation and the measurement start operation, and outputs a control signal for controlling the state of the mass analyzer 110. In addition, the measurement control unit 201 outputs a control signal and error information for stopping the mass analysis unit 110 according to the internal state of the system and the correction reliability. Here, the error information is, for example, a number indicating the type of error.
また、測定制御部201は、補正信頼度に応じ、質量分析部110が次に実行する測定シーケンスを決定し、質量分析部110に出力する。ここで、測定シーケンスは、蓄積工程、排気待ち工程、質量スキャン工程、排除工程等において使用される、複数の電極に対する電圧の印加、バルブの開閉、検出器のオン/オフ等を制御する信号の時系列により構成される。測定シーケンスには、例えば特許文献2に開示されたものを使用する。なお、タンデム質量分析では、MS/MS(MS2)、MS/MS/MS(MS3)等のように測定処理が複数回実行される。その場合には、アイソレーション(単離)工程と解離工程が、前述の工程間に配置される。図3に、MS2に対応する測定シーケンスの例を示す。図3に示す測定シーケンス自体は一般的なものである。このため、測定シーケンスに際して実行されるバルブの開閉等の制御動作の詳細な説明は省略する。
Further, the measurement control unit 201 determines a measurement sequence to be executed next by the mass analysis unit 110 according to the correction reliability, and outputs the measurement sequence to the mass analysis unit 110. Here, the measurement sequence is a signal for controlling voltage application, valve opening / closing, detector on / off, etc., used in the accumulation process, the exhaust waiting process, the mass scanning process, the exclusion process, etc. Consists of time series. For example, the measurement sequence disclosed in Patent Document 2 is used. In tandem mass spectrometry, measurement processing is executed a plurality of times, such as MS / MS (MS2), MS / MS / MS (MS3), and the like. In that case, the isolation (isolation) step and the dissociation step are arranged between the aforementioned steps. FIG. 3 shows an example of a measurement sequence corresponding to MS2. The measurement sequence itself shown in FIG. 3 is a general one. For this reason, detailed description of control operations such as opening and closing of the valve executed in the measurement sequence is omitted.
図2の説明に戻る。質量分析部110は、測定制御部201から与えられた測定シーケンスに基づいて質量分析を実行する。前述したように、質量分析部110は、測定対象とする試料の質量スペクトルを測定して出力する。ここでの質量スペクトルは、空間電荷効果を含んでいる。以下、単に「質量スペクトル」というときは、空間電荷効果を補正する前のスペクトルを意味する。質量スペクトルの情報は、空間電荷効果補正部202と補正信頼度算出部203に出力される。
Returning to the explanation of FIG. The mass analyzer 110 performs mass analysis based on the measurement sequence given from the measurement controller 201. As described above, the mass analyzer 110 measures and outputs the mass spectrum of the sample to be measured. The mass spectrum here includes the space charge effect. Hereinafter, the term “mass spectrum” means a spectrum before correcting the space charge effect. Information on the mass spectrum is output to the space charge effect correction unit 202 and the correction reliability calculation unit 203.
空間電荷効果補正部202は、質量スペクトルに基づいてその質量軸を補正し、補正後スペクトルZ=(z_1, ..., z_M)を出力する。ここで、空間電荷効果の補正方法は任意である。例えば本出願人と同一の出願人による特願2011-140089号と同じ技術(イオン強度の積算値に基づいて空間電荷効果を補正する方法)を採用しても良い。
The space charge effect correction unit 202 corrects the mass axis based on the mass spectrum, and outputs a corrected spectrum Z = (z_1, ..., z_M). Here, the correction method of the space charge effect is arbitrary. For example, the same technique (method for correcting the space charge effect based on the integrated value of ionic strength) as in Japanese Patent Application No. 2011-140089 by the same applicant as the present applicant may be adopted.
補正信頼度算出部203は、質量スペクトルに基づいて空間電荷効果の補正結果の信頼度合の尺度である補正信頼度を算出し、算出された補正信頼度を出力する。補正信頼度は、測定制御部201と結果出力部204に出力される。
The correction reliability calculation unit 203 calculates a correction reliability that is a measure of the reliability of the correction result of the space charge effect based on the mass spectrum, and outputs the calculated correction reliability. The correction reliability is output to the measurement control unit 201 and the result output unit 204.
結果出力部204は、補正前の質量スペクトル、補正後の質量スペクトル、補正信頼度を記憶媒体103に格納し、更にユーザに提示する。提示方法には、例えばユーザインタフェース部102による画像情報の提示、点字ディスプレイによる提示、音声による提示、プリンタによる画像情報の印刷等がある。
The result output unit 204 stores the mass spectrum before correction, the mass spectrum after correction, and the correction reliability in the storage medium 103 and further presents them to the user. Examples of the presentation method include presentation of image information by the user interface unit 102, presentation by a braille display, presentation by voice, and printing of image information by a printer.
(質量分析処理の概要)
図4に、本実施例に係る質量分析システム100で実行される質量分析処理を示す。まず、質量分析システム100は、操作入力部205を介して入力されるオペレータの起動操作に基づいて動作を開始し、測定制御部201が起動処理を実行する(ステップS401)。ここで、測定制御部201による起動処理の後、質量分析システム100は測定開始操作を受け付ける待機状態になる。 (Overview of mass spectrometry processing)
FIG. 4 shows mass spectrometry processing executed by the mass spectrometry system 100 according to the present embodiment. First, the mass spectrometry system 100 starts to operate based on the operator's activation operation input via theoperation input unit 205, and the measurement control unit 201 executes the activation process (step S401). Here, after the activation process by the measurement control unit 201, the mass spectrometry system 100 enters a standby state for accepting a measurement start operation.
図4に、本実施例に係る質量分析システム100で実行される質量分析処理を示す。まず、質量分析システム100は、操作入力部205を介して入力されるオペレータの起動操作に基づいて動作を開始し、測定制御部201が起動処理を実行する(ステップS401)。ここで、測定制御部201による起動処理の後、質量分析システム100は測定開始操作を受け付ける待機状態になる。 (Overview of mass spectrometry processing)
FIG. 4 shows mass spectrometry processing executed by the mass spectrometry system 100 according to the present embodiment. First, the mass spectrometry system 100 starts to operate based on the operator's activation operation input via the
次のステップ402において、測定制御部201は待機処理を実行する。待機処理では、オペレータの操作入力の監視、装置状態の監視が実行される。
In the next step 402, the measurement control unit 201 executes standby processing. In the standby process, monitoring of the operator's operation input and monitoring of the apparatus state are executed.
次のステップ403では、測定制御部201が、オペレータが測定開始操作を行ったか否かを判定する。測定開始操作が行われた場合、測定制御部201は、ステップS404以降の処理を実行する。測定開始操作が行われていない場合、測定制御部201は、ステップS402に戻る。
In the next step 403, the measurement control unit 201 determines whether or not the operator has performed a measurement start operation. When the measurement start operation is performed, the measurement control unit 201 executes the processes after step S404. If the measurement start operation has not been performed, the measurement control unit 201 returns to step S402.
ステップS404では、測定制御部201が測定シーケンス決定処理を行う。測定開始直後の場合、測定制御部201は初期設定されている測定シーケンスを出力し、それ以外の場合、測定制御部201は補正信頼度に基づいて決定した測定シーケンスを出力する。
In step S404, the measurement control unit 201 performs a measurement sequence determination process. Immediately after the start of measurement, the measurement control unit 201 outputs an initially set measurement sequence, and in other cases, the measurement control unit 201 outputs a measurement sequence determined based on the correction reliability.
次のステップS405では、質量分析部110が質量分析処理を実行する。質量分析処理では、測定シーケンスに基づいた質量分析が実行され、質量スペクトルが取得される。
In the next step S405, the mass analysis unit 110 executes a mass analysis process. In the mass analysis process, mass analysis based on a measurement sequence is executed, and a mass spectrum is acquired.
ステップS406では、補正信頼度算出部203が補正信頼度算出処理を実行する。補正信頼度算出処理では、質量スペクトルに基づいて補正信頼度が算出される。具体的な算出方法については後述する。
In step S406, the correction reliability calculation unit 203 executes a correction reliability calculation process. In the correction reliability calculation process, the correction reliability is calculated based on the mass spectrum. A specific calculation method will be described later.
ステップS407では、空間電荷効果補正部202が空間電荷効果補正処理を実行する。空間電荷効果補正処理では、補正後スペクトルZ=(z_1, ..., z_M)が算出される。
In step S407, the space charge effect correction unit 202 executes a space charge effect correction process. In the space charge effect correction process, a corrected spectrum Z = (z_1,..., Z_M) is calculated.
ステップS408では、結果出力部204が結果出力処理を実行する。結果出力処理では、補正信頼度及び補正後スペクトルが出力される。
In step S408, the result output unit 204 executes a result output process. In the result output process, the correction reliability and the corrected spectrum are output.
ステップS409では、測定制御部201が、測定開始からの経過時間が、予め設定された閾値TH_Cを超えているか否かを判定する。閾値TH_Cを超えている場合、測定制御部201は、ステップS412に進む。閾値TH_Cを超えていない場合、測定制御部201はステップS410に進み、補正信頼度が予め設定された閾値TH1を超えているか否かを判定する。閾値TH1を超えている場合、測定制御部201はステップS404に戻る。一方、閾値TH1を超えていない場合、測定制御部201はステップS411に進む。
In step S409, the measurement control unit 201 determines whether or not the elapsed time from the start of measurement exceeds a preset threshold TH_C. If the threshold value TH_C is exceeded, the measurement control unit 201 proceeds to step S412. When the threshold value TH_C is not exceeded, the measurement control unit 201 proceeds to step S410, and determines whether or not the correction reliability exceeds a preset threshold value TH1. If the threshold value TH1 is exceeded, the measurement control unit 201 returns to step S404. On the other hand, when the threshold value TH1 is not exceeded, the measurement control unit 201 proceeds to step S411.
ステップS411では、結果出力部204がエラー情報に基づいてエラー処理を行う。例えばエラー処理として測定停止命令が出力される。
In step S411, the result output unit 204 performs error processing based on the error information. For example, a measurement stop command is output as error processing.
ステップS412では、結果出力部204が測定停止処理を実行する。測定停止処理は、測定時間が所定時間を経過した場合にも、エラー処理が実行される場合にも行われる。
In step S412, the result output unit 204 executes measurement stop processing. The measurement stop process is performed both when the measurement time passes a predetermined time and when error processing is executed.
(ユーザインタフェース画面)
図5~図9に、本実施例で使用するユーザインタフェース画面の一例を示す。ユーザインタフェース画面は、ユーザインタフェース部102に表示される。ユーザインタフェース画面は、操作入力部205に対応する起動及び測定開始ボタンの表示領域と、質量スペクトル、補正信頼度、質量スペクトルのピーク位置、補正後スペクトルのピーク位置を表示する表示領域とを有する。ここで、ピーク位置は、結果出力部204が算出し描画する。ピーク位置の算出には、例えば公知のセントロイド処理を使用する。また、後述するように、表示領域には、質量スペクトルに代えて補正後スペクトルを表示しても良いし、質量スペクトルと補正後スペクトルの両方を表示しても良い。 (User interface screen)
5 to 9 show examples of user interface screens used in this embodiment. The user interface screen is displayed on theuser interface unit 102. The user interface screen includes a display area for activation and measurement start buttons corresponding to the operation input unit 205, and a display area for displaying a mass spectrum, correction reliability, a peak position of the mass spectrum, and a peak position of the corrected spectrum. Here, the result output unit 204 calculates and draws the peak position. For example, a known centroid process is used to calculate the peak position. As will be described later, the corrected spectrum may be displayed instead of the mass spectrum, or both the mass spectrum and the corrected spectrum may be displayed in the display area.
図5~図9に、本実施例で使用するユーザインタフェース画面の一例を示す。ユーザインタフェース画面は、ユーザインタフェース部102に表示される。ユーザインタフェース画面は、操作入力部205に対応する起動及び測定開始ボタンの表示領域と、質量スペクトル、補正信頼度、質量スペクトルのピーク位置、補正後スペクトルのピーク位置を表示する表示領域とを有する。ここで、ピーク位置は、結果出力部204が算出し描画する。ピーク位置の算出には、例えば公知のセントロイド処理を使用する。また、後述するように、表示領域には、質量スペクトルに代えて補正後スペクトルを表示しても良いし、質量スペクトルと補正後スペクトルの両方を表示しても良い。 (User interface screen)
5 to 9 show examples of user interface screens used in this embodiment. The user interface screen is displayed on the
このように、本実施例の場合には、質量スペクトルの情報及び/又は補正後スペクトルの情報と補正信頼度とが同一画面上に表示される。このため、オペレータは、その表示画面より測定された質量スペクトルを適切に解釈することが可能になる。因みに、従来装置の場合、空間電荷効果の補正結果の信頼度を確認できないため、オペレータが解釈を誤る可能性があった。また、オペレータは、質量スペクトルの解釈の誤りに気付くこともできなかった。
Thus, in the case of the present embodiment, the information on the mass spectrum and / or the information on the corrected spectrum and the correction reliability are displayed on the same screen. For this reason, the operator can appropriately interpret the mass spectrum measured from the display screen. Incidentally, in the case of the conventional apparatus, since the reliability of the correction result of the space charge effect cannot be confirmed, there is a possibility that the operator misinterprets. Also, the operator could not notice an error in the interpretation of the mass spectrum.
以下、ユーザインタフェース画面の具体例について説明する。
Hereinafter, specific examples of the user interface screen will be described.
図5と図6は、補正信頼度が高い場合(例では95%)に使用するユーザインタフェース画面の表示例である。表示されている補正信頼度が大きいほど、オペレータは補正後スペクトルのピーク位置を信用することができる。補正信頼度が高い場合、オペレータは、補正後スペクトルのピーク位置やその数値情報を確認することにより、試料内にある成分が存在するかどうか(有無情報)、試料に含まれる成分の種別(定性情報)、試料に含まれる成分の濃度(定量情報)などを高い確度で推定することができる。
5 and 6 are display examples of user interface screens used when the correction reliability is high (in the example, 95%). The greater the displayed correction reliability, the more the operator can trust the peak position of the corrected spectrum. When the correction reliability is high, the operator checks the peak position of the corrected spectrum and its numerical information to determine whether a component is present in the sample (presence / absence information) and the type of component contained in the sample (qualitative) Information), the concentration of components contained in the sample (quantitative information), and the like can be estimated with high accuracy.
逆に、表示された補正信頼度が小さいほど、測定された質量スペクトル及び補正後スペクトルが信用できないことを意味する。この場合、オペレータは、補正後スペクトルから有無情報・定性情報・定量情報を読み取るべきではないと、補正信頼度の表示内容から判断することができる。またこの場合、オペレータは、過去に測定された複数の質量スペクトルの中から高い補正信頼度が表示された質量スペクトルを優先的に選択し、有無情報・定性情報・定量情報を推定することにより、より正確な情報を得ることができる。なお、このように補正後スペクトルの補正信頼度が低い場合、オペレータは、その対処方法として、イオン量に応じて適切な測定シーケンスで試料を再測定することが可能である。
Conversely, the smaller the displayed correction reliability, the less reliable the measured mass spectrum and the corrected spectrum. In this case, the operator can determine from the display content of the correction reliability that presence information / qualitative information / quantitative information should not be read from the corrected spectrum. In this case, the operator preferentially selects a mass spectrum in which a high correction reliability is displayed from a plurality of mass spectra measured in the past, and estimates presence / absence information / qualitative information / quantitative information, More accurate information can be obtained. When the correction reliability of the corrected spectrum is low as described above, the operator can remeasure the sample in an appropriate measurement sequence according to the ion amount as a countermeasure.
また、本実施例の場合、補正信頼度が、質量スペクトルの情報又は補正後スペクトルの情報と共に同一画面上に表示されるため、オペレータは測定状況の適否又は良否を迅速に把握することができる。そして、測定状況が不適当又は不良の場合、オペレータは、測定シーケンスを迅速に変更することができる。
Further, in the case of the present embodiment, the correction reliability is displayed on the same screen together with the information of the mass spectrum or the information of the corrected spectrum, so that the operator can quickly grasp whether the measurement situation is appropriate or not. If the measurement situation is inappropriate or defective, the operator can quickly change the measurement sequence.
図7は、補正信頼度が低い場合に使用するユーザインタフェース画面の表示例である。図7に示すユーザインタフェース画面では、空間電荷効果の補正が不可能であることを「補正不可」なる表記で明示し、オペレータに対して注意を促している。この補正不可能表示は、オペレータが、表示されたスペクトルから有無情報・定性情報・定量情報を読み取るのを防ぐ効果がある。補正不可能表示を表示するか否かは、補正信頼度と予め設定した適当な閾値との比較結果に基づいて判定すれば良い。
FIG. 7 is a display example of a user interface screen used when the correction reliability is low. In the user interface screen shown in FIG. 7, the fact that the space charge effect cannot be corrected is clearly indicated by the notation “correction impossible”, and the operator is warned. This non-correctable display has an effect of preventing the operator from reading presence / absence information, qualitative information, and quantitative information from the displayed spectrum. Whether or not to display a non-correctable display may be determined based on a comparison result between the correction reliability and an appropriate threshold set in advance.
図8及び図9に、補正信頼度が低い場合に使用して好適なユーザインタフェース画面の他の表示例を示す。これらのユーザインタフェース画面では、スペクトル自体が表示されていない。この結果、オペレータによる誤った解釈が行われる可能性は、図7の場合に比して一段と低減される。
8 and 9 show other display examples of user interface screens suitable for use when the correction reliability is low. In these user interface screens, the spectrum itself is not displayed. As a result, the possibility of erroneous interpretation by the operator is further reduced compared to the case of FIG.
因みに、図8に示すユーザインタフェース画面では、今回の測定の信頼性が低いことを説明する文が表示されている。図8の説明文は、オペレータに対して、試料の濃度を調節して再測定することを促す内容となっている。オペレータが、説明文に従って試料の濃度を調整し、再測定を行った場合、測定精度の高い質量スペクトルを得ることができる。なお、図8の場合には、説明文と一緒にエラー番号も表示しているが、エラー番号の代わりにエラーの種別名を表示しても良い。
Incidentally, the user interface screen shown in FIG. 8 displays a sentence explaining that the reliability of the current measurement is low. The explanation in FIG. 8 is a content that prompts the operator to adjust the concentration of the sample and perform remeasurement. When the operator adjusts the concentration of the sample according to the explanatory text and performs remeasurement, a mass spectrum with high measurement accuracy can be obtained. In the case of FIG. 8, the error number is displayed together with the explanatory text, but the error type name may be displayed instead of the error number.
図9に示すユーザインタフェース画面では、説明文と共に、測定シーケンスの変更をオペレータに促す「変更して測定」ボタンと、測定自体の停止をオペレータに促す「測定停止」ボタンが操作入力部205として用意されている。
In the user interface screen shown in FIG. 9, a “change and measure” button that prompts the operator to change the measurement sequence and a “measurement stop” button that prompts the operator to stop the measurement itself are prepared as the operation input unit 205 together with the explanatory text. Has been.
「変更して測定」ボタンが押下された場合、測定制御部201は、イオントラップ114に輸送されるイオン量を低減するように測定シーケンスを変更し、再度の測定処理を実行する。例えばイオンの蓄積時間を適当に短縮するように測定シーケンスを変更すれば、イオン濃度を低下させることができる。この状態で再測定を行えば、直前回よりも測定精度の高い質量スペクトルを得ることができる。
When the “change and measure” button is pressed, the measurement control unit 201 changes the measurement sequence so as to reduce the amount of ions transported to the ion trap 114, and executes the measurement process again. For example, if the measurement sequence is changed so as to appropriately shorten the ion accumulation time, the ion concentration can be reduced. If remeasurement is performed in this state, a mass spectrum with higher measurement accuracy than the previous measurement can be obtained.
これに対し、「測定停止」ボタンが押下された場合、測定制御部201は、測定停止処理(ステップS412)を実行し、質量分析システムによる分析処理を停止する。図9のように、ユーザインタフェース画面に「測定停止」ボタンが用意されている場合には、オペレータの意図に基づいて分析処理を停止させることができる。このように、「変更して測定」ボタンだけでなく、「測定停止」ボタンが用意されることにより、不用意に測定シーケンスが変更された結果、オペレータが質量スペクトルの解釈をする際に混乱する事態を防止することができる。
On the other hand, when the “measurement stop” button is pressed, the measurement control unit 201 executes a measurement stop process (step S412) and stops the analysis process by the mass spectrometry system. As shown in FIG. 9, when a “measurement stop” button is prepared on the user interface screen, the analysis process can be stopped based on the operator's intention. In this way, the “measurement stop” button is prepared in addition to the “change and measure” button, so that the measurement sequence is inadvertently changed, resulting in confusion when the operator interprets the mass spectrum. The situation can be prevented.
前述したように、本実施例に係る質量分析システムでは、ユーザインタフェース画面内に、質量スペクトルの情報及び/又は補正後スペクトルの情報と補正信頼度とが同時に表示される。このため、オペレータが表示されたスペクトルを解釈する前に、補正結果の信頼度を確認することができる。また、確認された補正結果の信頼度に基づいて、測定時のイオン量が最適になるように測定シーケンスを変更したり、測定された質量スペクトルの解釈方法を変更することができる。
As described above, in the mass spectrometry system according to the present embodiment, the mass spectrum information and / or the corrected spectrum information and the correction reliability are simultaneously displayed in the user interface screen. Therefore, the reliability of the correction result can be confirmed before the operator interprets the displayed spectrum. Further, based on the reliability of the confirmed correction result, the measurement sequence can be changed so that the amount of ions at the time of measurement can be optimized, and the method for interpreting the measured mass spectrum can be changed.
図10及び図11に、補正信頼度の判定閾値の設定に用いて好適なユーザインタフェース画面を示す。補正信頼度の閾値を受け付ける画面を用意することにより、オペレータの判断に基づいて、測定シーケンスや解釈方法を柔軟に変更することが可能となる。図10に示すユーザインタフェース画面は、入力フォームに対する数値の入力により閾値の受け付けを可能とする例である。なお、設定可能な閾値は1つである必要は無く、図10に示すように、4つの処理動作のそれぞれに対応して判定用の閾値を設定しても良い。一方、図11は、同様の設定をスライダーバーの位置により入力可能とするユーザインタフェース画面である。特に、図11に示すように、閾値の位置をスライダーバーの位置で入力可能なユーザインタフェース画面の場合、オペレータは、各閾値の大小関係やおおまかな大きさを把握し易く、設定が容易である。
10 and 11 show user interface screens suitable for use in setting a correction reliability determination threshold value. By preparing a screen for accepting the threshold value of the correction reliability, the measurement sequence and interpretation method can be flexibly changed based on the operator's judgment. The user interface screen shown in FIG. 10 is an example in which a threshold value can be received by inputting a numerical value on the input form. Note that the number of threshold values that can be set is not necessarily one, and as shown in FIG. 10, threshold values for determination may be set corresponding to each of the four processing operations. On the other hand, FIG. 11 is a user interface screen that allows the same setting to be input by the position of the slider bar. In particular, as shown in FIG. 11, in the case of a user interface screen in which the position of the threshold value can be input at the position of the slider bar, the operator can easily grasp the magnitude relationship and approximate size of each threshold value, and can be set easily. .
なお、図10及び図11に示すように、閾値には、補正スペクトルを画面表示させるか否かを判定するための閾値を含めることができる。例えば補正信頼度が閾値より高い場合、図5及び図6に示すように質量スペクトルや補正後スペクトルが画面表示される。一方、補正信頼度が閾値より低い場合、図8及び図9に示すように質量スペクトルや補正後スペクトルが画面表示されないようにできる。
As shown in FIGS. 10 and 11, the threshold value can include a threshold value for determining whether or not to display the corrected spectrum on the screen. For example, when the correction reliability is higher than the threshold value, the mass spectrum and the corrected spectrum are displayed on the screen as shown in FIGS. On the other hand, when the correction reliability is lower than the threshold value, the mass spectrum and the corrected spectrum can be prevented from being displayed on the screen as shown in FIGS.
(各処理動作の具体例)
以下、図12~図23に基づいて、図4で説明した質量分析処理を構成する各処理動作の具体例を説明する。 (Specific examples of each processing operation)
A specific example of each processing operation constituting the mass spectrometry processing described in FIG. 4 will be described below with reference to FIGS.
以下、図12~図23に基づいて、図4で説明した質量分析処理を構成する各処理動作の具体例を説明する。 (Specific examples of each processing operation)
A specific example of each processing operation constituting the mass spectrometry processing described in FIG. 4 will be described below with reference to FIGS.
図12は、起動処理(ステップS401)の詳細処理を示している。まず、測定制御部201は、真空度初期化処理を実行する(ステップS1201)。この真空度初期化処理において、測定制御部201は、真空ポンプ117~119を排気駆動し、各ポンプに接続された室内を適切な圧力まで低減し、その圧力に保持する。
FIG. 12 shows the detailed process of the activation process (step S401). First, the measurement control unit 201 performs a vacuum degree initialization process (step S1201). In this vacuum degree initialization process, the measurement control unit 201 drives the vacuum pumps 117 to 119 to exhaust, reduces the chamber connected to each pump to an appropriate pressure, and maintains the pressure.
次に、測定制御部201は、洗浄処理を実行する(ステップS1202)。洗浄処理において、測定制御部201は、ユーザインタフェース部102を通じ、オペレータに対してアンモニアなどの試料の試料導入部111への導入を要求し、試料の導入を待って測定処理を実行する。測定処理の実行により、前回の測定時に試料導入部111に吸着した物質(キャリーオーバ)を洗浄する。
Next, the measurement control unit 201 performs a cleaning process (step S1202). In the cleaning process, the measurement control unit 201 requests the operator to introduce a sample such as ammonia into the sample introduction unit 111 through the user interface unit 102, and waits for the introduction of the sample to execute the measurement process. By executing the measurement process, the substance (carry over) adsorbed on the sample introduction unit 111 during the previous measurement is washed.
次に、測定制御部201は、質量対電荷比校正処理を実行する(ステップS1203)。質量対電荷比校正処理において、測定制御部201は、ユーザインタフェース部102を通じ、オペレータに対して、既知のm/zにピークが現れる標準物質試料を試料導入部111に導入させ、試料の導入を待って測定処理を実行する。測定制御部201は、測定された質量スペクトルのピーク位置に基づいて、質量スペクトルの配列上の各要素番号とm/zとの対応表b(m)を作成する。
Next, the measurement control unit 201 executes a mass-to-charge ratio calibration process (step S1203). In the mass-to-charge ratio calibration process, the measurement control unit 201 causes the operator to introduce a standard material sample having a peak at a known m / z into the sample introduction unit 111 through the user interface unit 102, and introduce the sample. Wait and execute the measurement process. The measurement control unit 201 creates a correspondence table b (m) between each element number on the mass spectrum array and m / z based on the measured peak position of the mass spectrum.
次に、測定制御部201は、ブランクチェックを実行する(ステップS1204)。ブランクチェックにおいて、測定制御部201は、オペレータに対して、測定対象成分を含有しない既知の試料を試料導入部111に導入させ、試料の導入を待って測定処理を実行する。
Next, the measurement control unit 201 performs a blank check (step S1204). In the blank check, the measurement control unit 201 causes the operator to introduce a known sample that does not contain the measurement target component into the sample introduction unit 111, and waits for the introduction of the sample before executing the measurement process.
次に、測定制御部201は、測定されたスペクトルが正常か否かを判定する処理を実行する(ステップS1205)。測定されたスペクトルが予め設定された条件を満たす場合、測定制御部201は、スペクトルが正常であると判定し、起動処理を終了する。一方、測定されたスペクトルが予め設定された条件を満たさない場合、測定制御部201は、スペクトルが異常であると判定し、洗浄処理(ステップS1202)に戻る。
Next, the measurement control unit 201 executes processing for determining whether or not the measured spectrum is normal (step S1205). When the measured spectrum satisfies a preset condition, the measurement control unit 201 determines that the spectrum is normal and ends the activation process. On the other hand, when the measured spectrum does not satisfy the preset condition, the measurement control unit 201 determines that the spectrum is abnormal, and returns to the cleaning process (step S1202).
ここで、「測定されたスペクトルが正常である」と判定するための条件の一例は、例えば測定されたスペクトルに大きなピークが存在しないことである。他の一例は、例えば測定されたスペクトルをM次元のベクトルと見なす場合に、過去に測定された参照用のスペクトルと間で算出されるコサイン類似度が所定の閾値よりも高いことである。このように、正常かどうかの判定には適当な公知の方法を使えばよい。
Here, an example of a condition for determining that “the measured spectrum is normal” is, for example, that a large peak does not exist in the measured spectrum. Another example is that, for example, when the measured spectrum is regarded as an M-dimensional vector, the cosine similarity calculated between the reference spectrum measured in the past is higher than a predetermined threshold. As described above, an appropriate known method may be used to determine whether or not it is normal.
図13は、待機処理(ステップS402)の詳細処理を示している。まず、測定制御部201は、装置状態監視処理を実行する(ステップS1301)。装置状態監視処理において、測定制御部201は、質量分析部110の真空度、電圧値、温度といった装置状態を監視する。
FIG. 13 shows the detailed processing of the standby processing (step S402). First, the measurement control unit 201 performs apparatus state monitoring processing (step S1301). In the apparatus state monitoring process, the measurement control unit 201 monitors the apparatus state such as the degree of vacuum, the voltage value, and the temperature of the mass analysis unit 110.
次に、測定制御部201は、装置状態にエラーがあるか否かを判定する(ステップS1302)。装置状態にエラーがあると判定された場合、測定制御部201は、測定停止制御信号出力処理を実行する(ステップS1303)。測定停止制御信号出力処理において、測定制御部201は、測定の停止を命じる制御信号を質量分析部110に出力し、待機処理を終了する。一方、装置状態にエラーがない場合、測定制御部201は、操作入力監視処理を実行する(ステップS1304)。操作入力監視処理において、測定制御部201は、操作入力部205から入力される操作信号を監視する。
Next, the measurement control unit 201 determines whether there is an error in the apparatus state (step S1302). When it is determined that there is an error in the apparatus state, the measurement control unit 201 performs a measurement stop control signal output process (step S1303). In the measurement stop control signal output process, the measurement control unit 201 outputs a control signal for instructing to stop the measurement to the mass analysis unit 110, and ends the standby process. On the other hand, when there is no error in the apparatus state, the measurement control unit 201 executes an operation input monitoring process (step S1304). In the operation input monitoring process, the measurement control unit 201 monitors an operation signal input from the operation input unit 205.
次に、操作制御部201は、操作信号の有無を判定する(ステップS1305)。操作信号が入力されている場合、操作制御部201は、操作入力制御信号出力処理を実行する(ステップS1306)。操作入力制御信号出力処理において、操作制御部201は、操作入力に対応する制御信号を質量分析部110に出力し、待機処理を終了する。一方、操作信号が入力されていない場合、操作制御部201は、即座に待機処理を終了する。
Next, the operation control unit 201 determines the presence or absence of an operation signal (step S1305). When the operation signal is input, the operation control unit 201 executes an operation input control signal output process (step S1306). In the operation input control signal output process, the operation control unit 201 outputs a control signal corresponding to the operation input to the mass analyzer 110, and ends the standby process. On the other hand, when no operation signal is input, the operation control unit 201 immediately ends the standby process.
図14は、測定シーケンス決定処理(ステップS404)の詳細処理を示している。まず、測定制御部201は、測定開始直後か否かを判定する(ステップS1401)。測定開始直後の場合、測定制御部201は、初期設定測定シーケンス出力処理を実行する(ステップS1402)。ここで、測定制御部201は、初期設定測定シーケンスを質量分析部110に出力し、測定シーケンス決定処理を終了する。
FIG. 14 shows the detailed process of the measurement sequence determination process (step S404). First, the measurement control unit 201 determines whether or not it is immediately after the start of measurement (step S1401). In the case immediately after the start of measurement, the measurement control unit 201 executes an initial setting measurement sequence output process (step S1402). Here, the measurement control unit 201 outputs the initial measurement sequence to the mass analysis unit 110, and ends the measurement sequence determination process.
これに対し、測定開始直後でない場合、測定制御部201は、前回の測定シーケンスについて算出された補正信頼度が閾値TH2より大きいか否かを判定する(ステップS1403)。ここで、閾値TH2は、後述する閾値TH3より小さい値である。補正信頼度が閾値TH2以下であった場合、測定制御部201は、イオンを蓄積する時間を短縮する測定シーケンスを質量分析部110に出力する(ステップS1404)。例えば(式1)に基づいて算出される蓄積時間ACCを、測定シーケンスとして質量分析部110に出力し、測定シーケンス決定処理を終了する。

On the other hand, when not immediately after the start of measurement, the measurement control unit 201 determines whether or not the correction reliability calculated for the previous measurement sequence is greater than the threshold value TH2 (step S1403). Here, the threshold value TH2 is smaller than a threshold value TH3 described later. When the correction reliability is equal to or less than the threshold value TH2, the measurement control unit 201 outputs a measurement sequence that shortens the time for accumulating ions to the mass analysis unit 110 (step S1404). For example, the accumulation time ACC calculated based on (Equation 1) is output as a measurement sequence to the mass analyzer 110, and the measurement sequence determination process ends.
これに対し、補正信頼度が閾値TH2より大きい場合、測定制御部201は、ステップS1405に進む。ステップS1405において、測定制御部201は、補正信頼度が閾値TH3より大きいか否か判定する。補正信頼度が閾値TH3以下の場合、測定制御部201は、前回と同じ測定シーケンス(すなわち、蓄積時間に変更がない測定シーケンス)を質量分析部110に出力し、測定シーケンス決定処理を終了する(ステップS1406)。
On the other hand, when the correction reliability is greater than the threshold value TH2, the measurement control unit 201 proceeds to step S1405. In step S1405, the measurement control unit 201 determines whether the correction reliability is greater than the threshold value TH3. When the correction reliability is equal to or less than the threshold TH3, the measurement control unit 201 outputs the same measurement sequence as the previous time (that is, a measurement sequence in which the accumulation time is not changed) to the mass analysis unit 110, and ends the measurement sequence determination process ( Step S1406).
これに対し、補正信頼度が閾値TH3より大きい場合、測定制御部201は、イオンを蓄積する時間を伸長する測定シーケンスを質量分析部110に出力する(ステップS1407)。例えば(式2)に算出される蓄積時間ACCを、測定シーケンスとして質量分析部110に出力し、測定シーケンス決定処理を終了する。

On the other hand, when the correction reliability is greater than the threshold TH3, the measurement control unit 201 outputs a measurement sequence that extends the time for accumulating ions to the mass analysis unit 110 (step S1407). For example, the accumulation time ACC calculated in (Equation 2) is output as a measurement sequence to the mass analyzer 110, and the measurement sequence determination process ends.
前述したように、本実施例の場合、補正信頼度の大きさに基づいてイオンの蓄積時間(すなわち、イオントラップ114にトラップされるイオン量)が自動的に調節される。このため、本実施例に係る質量分析システムは、高い測定精度を保ちつつ、可能な限り質量スペクトルのSN比を上げることができる。
As described above, in this embodiment, the ion accumulation time (that is, the amount of ions trapped in the ion trap 114) is automatically adjusted based on the magnitude of the correction reliability. For this reason, the mass spectrometry system according to the present embodiment can increase the SN ratio of the mass spectrum as much as possible while maintaining high measurement accuracy.
図15は、補正信頼度算出処理(ステップS406)の詳細処理を示している。まず、補正信頼度算出部203は、ピーク抽出処理を実行する(ステップS1501)。ピーク抽出処理において、補正信頼度算出部203は、質量スペクトルから複数のピーク位置(m/z)pと強度qの組(p,q)を列挙する。この処理には、公知の適当な方法を適用できる。例えば質量スペクトルの平滑化とローレンツ関数のフィッティング、又は、ガウス関数のフィッティングにより実現することができる。質量スペクトルの平滑化には、ガウスフィルタ、Savitzky-Golayフィルタ、スプライン近似などの公知の適当な平滑化方法を用いることができる。
FIG. 15 shows the detailed process of the correction reliability calculation process (step S406). First, the correction reliability calculation unit 203 executes a peak extraction process (step S1501). In the peak extraction process, the correction reliability calculation unit 203 lists a plurality (p, q) of peak positions (m / z) p and intensity q from the mass spectrum. A known appropriate method can be applied to this treatment. For example, it can be realized by smoothing a mass spectrum and fitting a Lorentz function or fitting a Gaussian function. For the smoothing of the mass spectrum, a known appropriate smoothing method such as a Gaussian filter, a Savitzky-Golay filter, or a spline approximation can be used.
次に、補正信頼度算出部203は、ピーク選択処理を実行する(ステップS1502)。ピーク選択処理において、補正信頼度算出部203は、列挙した複数のピークの中から補正信頼度の算出に用いる1個又は複数のピークを選択する。複数のピークを用いる場合、夾雑成分などの影響により幾つかのピークが抽出できない場合や後段の幅計算処理(ステップS1503)が低精度である場合にも、頑健に補正信頼度を計算することができる。
Next, the correction reliability calculation unit 203 executes a peak selection process (step S1502). In the peak selection process, the correction reliability calculation unit 203 selects one or a plurality of peaks used for calculation of the correction reliability from the plurality of listed peaks. When a plurality of peaks are used, the correction reliability can be calculated robustly even when some peaks cannot be extracted due to the influence of a miscellaneous component or when the subsequent width calculation process (step S1503) is low accuracy. it can.
ピークの選択には、例えば既知の標準物質由来のピークを使用する。標準物質は試料中に含有されていることが保証されているので、標準物質由来のピークを用いる場合、補正信頼度を高精度に計算することができる。標準物質は、測定時に試料に混合した物質でもよいし、初めから試料に含まれることが予め知られている物質でもよい。また、ピークは、強度が大きい順に指定個数のピークを選択してもよい。強度が大きいピークは一般にSN比が高いので、後段の幅計算処理(ステップS1503)を高精度に実行でき、その結果、補正信頼度も高精度に計算することができる。
For peak selection, for example, a peak derived from a known standard substance is used. Since it is guaranteed that the standard substance is contained in the sample, the correction reliability can be calculated with high accuracy when using the peak derived from the standard substance. The standard substance may be a substance mixed with the sample at the time of measurement, or may be a substance known in advance from the beginning. Also, a specified number of peaks may be selected in descending order of intensity. Since a peak with a high intensity generally has a high SN ratio, the subsequent width calculation process (step S1503) can be executed with high accuracy, and as a result, the correction reliability can also be calculated with high accuracy.
次に、補正信頼度算出部203は、幅計算処理を実行する(ステップS1503)。幅計算処理において、補正信頼度算出部203は、前ステップで選択された各ピークの幅w'を計算し、さらに、それら複数の幅を代表する幅wを計算する。ここでの幅w'は、例えばピークの半値全幅(図16)、ピーク抽出でフィッティングしたローレンツ関数の半値半幅(半値全幅の半分)、ピーク抽出でフィッティングしたガウス関数の標準偏差、質量スペクトルのピーク付近の標準偏差、質量スペクトルのピーク付近の尖度kから計算されるexp(-k)などの分布の形状を表す統計量で与えることができる。なお、計算対象とするピークの幅はピーク波形の一例である。
Next, the correction reliability calculation unit 203 executes a width calculation process (step S1503). In the width calculation process, the correction reliability calculation unit 203 calculates the width w ′ of each peak selected in the previous step, and further calculates a width w representing the plurality of widths. The width w ′ here is, for example, the full width at half maximum of the peak (FIG. 16), the half width at half maximum of the Lorentz function fitted by peak extraction (half the full width at half maximum), the standard deviation of the Gaussian function fitted by peak extraction, and the peak of the mass spectrum. It can be given as a statistic indicating the shape of the distribution such as standard deviation in the vicinity, exp (−k) calculated from the kurtosis k near the peak of the mass spectrum. The peak width to be calculated is an example of a peak waveform.
複数の幅から代表する幅の計算には、複数のピークについて計算された全ての幅w’の加算平均値、相乗平均値、幾何平均値、中央値、最大値、最小値など統計的に意味のあるなんらかの代表値を求める計算処理を適用すればよい。
For the calculation of representative widths from multiple widths, statistical significance such as addition average value, geometric average value, geometric average value, median value, maximum value, minimum value of all widths w 'calculated for multiple peaks A calculation process for obtaining a certain representative value may be applied.
次に、補正信頼度算出部203は、強度積算値計算処理を実行する(ステップS1504)。強度積算値計算処理において、補正信頼度算出部203は、(式3)により、質量スペクトルの強度積算値TICを計算する。ここで、X(m)は、質量スペクトルを構成するm番目のピークの強度値である。

Next, the correction reliability calculation unit 203 executes intensity integrated value calculation processing (step S1504). In the integrated intensity value calculation process, the correction reliability calculation unit 203 calculates the integrated intensity value TIC of the mass spectrum using (Equation 3). Here, X (m) is the intensity value of the mth peak constituting the mass spectrum.
次に、補正信頼度算出部203は、補正信頼度計算処理を実行する(ステップS1505)。補正信頼度計算処理において、補正信頼度算出部203は、(式4)に基づいて補正信頼度cを計算し、補正信頼度算出処理を終了する。

Next, the correction reliability calculation unit 203 executes a correction reliability calculation process (step S1505). In the correction reliability calculation process, the correction reliability calculation unit 203 calculates the correction reliability c based on (Equation 4), and ends the correction reliability calculation process.
ただし、r、TH_I、TH_Qは予め設定された正の定数である。対象ピーク強度qとは幅計算に用いたピークの組(p,q)の強度qを意味する。
(However, r, TH_I, and TH_Q are preset positive constants. The target peak intensity q means the intensity q of the pair of peaks (p, q) used for the width calculation.
図17は、空間電荷効果補正処理(ステップS407)の詳細処理を示している。まず、空間電荷効果補正部202は、ピーク抽出処理を実行する(ステップS1701)。ピーク抽出処理において、空間電荷効果補正部202は、補正信頼度算出部203と同様、質量スペクトルから複数のピークの位置pと強度qの組(p,q)を列挙する。
FIG. 17 shows the detailed process of the space charge effect correction process (step S407). First, the space charge effect correction unit 202 performs a peak extraction process (step S1701). In the peak extraction process, the space charge effect correction unit 202 lists pairs (p, q) of a plurality of peak positions p and intensities q from the mass spectrum, as in the correction reliability calculation unit 203.
次に、空間電荷効果補正部202は、上側強度積算値計算処理を実行する(ステップS1702)。上側強度積算値計算処理において、空間電荷効果補正部202は、各ピークが測定された時刻にトラップ内に存在して空間電荷効果の影響を与えたイオン量の推定値を与える上側強度積算値HICを、(式5)に基づいて計算する。

Next, the space charge effect correction unit 202 executes an upper intensity integrated value calculation process (step S1702). In the upper intensity integrated value calculation process, the space charge effect correction unit 202 provides an upper intensity integrated value HIC that gives an estimated value of the amount of ions that exist in the trap and have an influence of the space charge effect at the time when each peak is measured. Is calculated based on (Equation 5).
ただし、Wは、各m/zのイオンが補正対象のピークのイオンに空間電荷効果を与える影響を表した適当な重み関数である。本実施例の場合、低質量側から高質量側に質量スキャンするため上側強度積算値HICを計算しているが、逆に高質量側から低質量側に質量スキャンする場合には、下側強度積算値LICを計算し、後述する処理の上側強度積算値HICの代わりに使用する。
However, W is an appropriate weighting function that expresses the influence of each m / z ion on the space peak effect on the peak ion to be corrected. In the case of this example, the upper intensity integrated value HIC is calculated for mass scanning from the low mass side to the high mass side, but conversely, when mass scanning is performed from the high mass side to the low mass side, the lower intensity is calculated. The integrated value LIC is calculated and used in place of the upper intensity integrated value HIC in the processing described later.
次に、空間電荷効果補正部202は、空間電荷効果除去m/z計算処理を実行する(ステップS1703)。空間電荷効果補正部202は、(式6)に基づいてピーク位置mを補正し、補正後のピーク位置m^(ここでの記号「^」の表記位置は便宜上のものであり、記号「^」は式6のようにmの上に表記されるものとする。以下、同じ。)を計算する。なお、ピーク位置はm/zであるが、式6では、mで表している。式7も同様である。

Next, the space charge effect correction unit 202 executes space charge effect removal m / z calculation processing (step S1703). The space charge effect correcting unit 202 corrects the peak position m based on (Equation 6), and the corrected peak position m ^ (the position of the symbol “^” here is for convenience, and the symbol “^ "Is expressed on m as shown in Equation 6. The same applies hereinafter. Although the peak position is m / z, it is represented by m in Equation 6. The same applies to Equation 7.
ただし、G(・)は、上側強度積算値HICとq値のシフト量との間の関係として予め得られた関数である。
However, G (•) is a function obtained in advance as a relationship between the upper intensity integrated value HIC and the shift amount of the q value.
次に、空間電荷効果補正部202は、校正済みm/z計算処理を実行する(ステップS1704)。校正済みm/z計算処理において、空間電荷効果補正部202は、質量対電荷比校正処理(ステップS1203)で算出した質量スペクトルの配列上の各要素番号とm/zとの対応表b(m)に基づいて、補正後ピーク位置m^が対応するm/z m~(ここでの記号「~」の表記位置は便宜上のものであり、記号「~」は後述する式7のようにmの上に表記されるものとする。以下、同じ。)を計算する。
Next, the space charge effect correction unit 202 executes a calibrated m / z calculation process (step S1704). In the calibrated m / z calculation process, the space charge effect correction unit 202 is a correspondence table b (m) between each element number on the mass spectrum array calculated in the mass-to-charge ratio calibration process (step S1203) and m / z. ) Based on m / z m ~ corresponding to the corrected peak position m ^ (the notation of the symbol "~" here is for convenience, and the symbol "~" The same shall apply hereinafter).
次に、空間電荷効果補正部202は、補正後スペクトル出力処理(ステップS1705)を実行する。補正後スペクトル出力処理において、空間電荷効果補正部202は、ピークの組(p,q)とそのm/zの補正値m~に基づいて、(式7)に基づいて、補正後スペクトルZを計算し、出力する。

Next, the space charge effect correction unit 202 executes a corrected spectrum output process (step S1705). In the corrected spectrum output process, the space charge effect correction unit 202 calculates the corrected spectrum Z based on (Equation 7) based on the peak set (p, q) and its correction value m ~ z. Calculate and output.
また、空間電荷効果補正部202は、ステップS1501のピーク抽出処理でピーク毎にフィッティングされたローレンツ関数やガウス関数をピークの組(p,q)に対して重畳し、補正後スペクトルZを計算しても良い。
Further, the space charge effect correction unit 202 calculates the corrected spectrum Z by superimposing the Lorentz function or Gaussian function fitted for each peak in the peak extraction process in step S1501 on the peak set (p, q). May be.
図18は、結果出力処理(ステップS408)の詳細処理を示している。まず、結果出力部204は、データ格納処理を実行する(ステップS1801)。データ格納処理において、結果出力部204は、入力された質量スペクトルX、補正後スペクトルZ、補正信頼度cを、記憶媒体103に格納する。図19は、記憶媒体103にこれらのデータを格納する場合に使用するデータ構造である。このように質量スペクトルの情報又は補正後スペクトルの情報と補正信頼度とを組み合わせて記憶媒体103に格納することにより、図5~図9で例示したようなユーザインタフェース画面を高速に表示することができる。この表示により、オペレータは、測定時のイオン量に応じた適切な測定シーケンスへの変更と測定された質量スペクトルの解釈方法の変更を迅速に行うことができる。
FIG. 18 shows detailed processing of the result output processing (step S408). First, the result output unit 204 executes data storage processing (step S1801). In the data storage process, the result output unit 204 stores the input mass spectrum X, the corrected spectrum Z, and the corrected reliability c in the storage medium 103. FIG. 19 shows a data structure used when these data are stored in the storage medium 103. As described above, by storing the information on the mass spectrum or the information on the corrected spectrum and the correction reliability in the storage medium 103, the user interface screen illustrated in FIGS. 5 to 9 can be displayed at high speed. it can. With this display, the operator can quickly change to an appropriate measurement sequence according to the amount of ions at the time of measurement and change the interpretation method of the measured mass spectrum.
次に、結果出力部204は、質量スペクトル表示処理を実行する(ステップS1802)。質量スペクトル表示処理において、結果出力部204は、ユーザインタフェース画面上に質量スペクトルを表示する。
Next, the result output unit 204 executes a mass spectrum display process (step S1802). In the mass spectrum display process, the result output unit 204 displays a mass spectrum on the user interface screen.
次に、結果出力部204は、補正信頼度表示処理を実行する(ステップS1803)。補正信頼度表示処理において、結果出力部204は、ユーザインタフェース画面上に補正信頼度を表示する。
Next, the result output unit 204 executes a correction reliability display process (step S1803). In the correction reliability display process, the result output unit 204 displays the correction reliability on the user interface screen.
次に、結果出力部204は、補正信頼度が閾値TH2より大きいか否かを判定する(ステップS1804)。補正信頼度が閾値TH2より大きい場合、結果出力部204は、ステップS1805に進む。これに対し、補正信頼度が閾値TH2以下の場合、結果出力部204は、ステップS1806に進む。
Next, the result output unit 204 determines whether or not the correction reliability is greater than the threshold value TH2 (step S1804). If the correction reliability is greater than the threshold value TH2, the result output unit 204 proceeds to step S1805. On the other hand, when the correction reliability is equal to or lower than the threshold value TH2, the result output unit 204 proceeds to step S1806.
ステップS1805において、結果出力部204は、補正後スペクトルのピーク位置表示処理を実行する。この場合、結果出力部204は、図5や図6で例示したように、ユーザインタフェース画面上に補正後スペクトルのピーク位置を表示し、結果出力処理を終了する。
In step S1805, the result output unit 204 executes a peak position display process of the corrected spectrum. In this case, as illustrated in FIGS. 5 and 6, the result output unit 204 displays the peak position of the corrected spectrum on the user interface screen, and ends the result output process.
一方、ステップS1806において、結果出力部204は、補正不可能表示処理を実行する。この場合、結果出力部204は、図7に例示したように、ユーザインタフェース画面上に空間電荷効果の補正が不可能であることを表示し、結果出力処理を終了する。
On the other hand, in step S1806, the result output unit 204 executes an uncorrectable display process. In this case, as illustrated in FIG. 7, the result output unit 204 displays that the space charge effect cannot be corrected on the user interface screen, and ends the result output process.
図20は、測定停止処理(ステップS412)の詳細処理を示している。まず、測定制御部201は、洗浄処理を実行する(ステップS2001)。ここでの洗浄処理は、ステップS1202の洗浄処理と同じ処理である。
FIG. 20 shows the detailed process of the measurement stop process (step S412). First, the measurement control unit 201 performs a cleaning process (step S2001). The cleaning process here is the same as the cleaning process in step S1202.
次に、測定制御部201は、高周波電源停止処理を実行する(ステップ2002)。高周波電源停止処理において、測定制御部201は、高周波電源116の動作を停止制御する。
Next, the measurement control unit 201 executes a high-frequency power supply stop process (step 2002). In the high frequency power supply stop process, the measurement control unit 201 controls to stop the operation of the high frequency power supply 116.
高周波電源116の停止完了後、測定制御部201は、真空ポンプ停止処理を実行する(ステップS2003)。この真空ポンプ停止処理において、測定制御部201は、真空ポンプ117~119の動作を停止させる。
After the stop of the high frequency power supply 116, the measurement control unit 201 executes a vacuum pump stop process (step S2003). In this vacuum pump stop process, the measurement control unit 201 stops the operation of the vacuum pumps 117 to 119.
図21は、エラー処理(ステップS411)の詳細処理を示す。まず、結果出力部204は、エラー表示処理を実行する(ステップS2101)。エラー表示処理において、結果出力部204は、図8で例示したように、ユーザインタフェース画面上に、エラー情報を明示的に表示する。
FIG. 21 shows detailed processing of error processing (step S411). First, the result output unit 204 executes an error display process (step S2101). In the error display process, the result output unit 204 explicitly displays error information on the user interface screen as illustrated in FIG.
次に、結果出力部204は、洗浄処理を実行する(ステップS2102)。ここでの洗浄処理は、ステップS1202の洗浄処理と同じ処理である。計算された補正信頼度が低いほど洗浄時間を長くする。これにより、汚染が比較的小さい場合には洗浄が短時間で完了する一方で、汚染が比較的大きい場合には汚染を強く洗浄してキャリーオーバの可能性を低減できるという効果が生じる。
Next, the result output unit 204 executes a cleaning process (step S2102). The cleaning process here is the same as the cleaning process in step S1202. The lower the calculated correction reliability, the longer the cleaning time. As a result, when the contamination is relatively small, the cleaning is completed in a short time, while when the contamination is relatively large, the contamination can be strongly washed to reduce the possibility of carryover.
図22A~図22Gは、ピーク位置m/zが150のイオンの濃度を0.02ppmから1ppmまで変化させて質量分析を行った場合における濃度別の上側強度積算値HICとピーク位置m/zの関係をスキャン毎にプロットしたものである。
22A to 22G show the relationship between the upper intensity integrated value HIC for each concentration and the peak position m / z when mass analysis is performed by changing the concentration of ions having a peak position m / z of 150 from 0.02 ppm to 1 ppm. Is plotted for each scan.
図22A~図22Cに示すように、イオン濃度が通常の場合(0.02ppm~0.1ppmの場合)には、上側強度積算値HICがトラップ内のイオン量の比較的良い推定値を与えるため、上側強度積算値HICとピーク位置m/zのシフト量は高い正の相関を持つ。このため、(式5)及び(式6)に基づいて、ピーク位置を高精度に補正することができる。
As shown in FIGS. 22A to 22C, when the ion concentration is normal (in the case of 0.02 ppm to 0.1 ppm), the upper intensity integrated value HIC gives a relatively good estimate of the amount of ions in the trap. The amount of shift between the intensity integrated value HIC and the peak position m / z has a high positive correlation. For this reason, the peak position can be corrected with high accuracy based on (Expression 5) and (Expression 6).
しかし、図22D~図22Gに示すように、イオン濃度が過剰な場合(0.2ppm~1.0ppmの場合)には、上側強度積算値HICとピーク位置m/zのシフト量の相関が弱くなる。そのため、イオン濃度が通常の場合のように、(式5)及び(式6)に基づいて、ピーク位置を高精度で補正することが困難となる。
However, as shown in FIGS. 22D to 22G, when the ion concentration is excessive (0.2 ppm to 1.0 ppm), the correlation between the upper intensity integrated value HIC and the shift amount of the peak position m / z is weakened. Therefore, it becomes difficult to correct the peak position with high accuracy based on (Expression 5) and (Expression 6) as in the case where the ion concentration is normal.
このような相関の低下は、次のような原理により発生するものと発明者らは推測する。まず、高濃度の試料を測定すると、イオントラップ114に大量のイオンが蓄積される。この場合、イオントラップ114に蓄積されたイオン量が過剰であるため、周波数スイープ時に蓄積されたイオンが全て排出されず、イオントラップ114内に残留する。この残留イオンが空間電荷効果を起こし続ける。
The inventors presume that such a decrease in correlation is caused by the following principle. First, when a high concentration sample is measured, a large amount of ions are accumulated in the ion trap 114. In this case, since the amount of ions accumulated in the ion trap 114 is excessive, all the ions accumulated during the frequency sweep are not discharged and remain in the ion trap 114. These residual ions continue to cause space charge effects.
しかし、残留イオンは質量スペクトル上では強度値として現れないため、上側強度積算値HICとしてカウントされない。そのため、HICではトラップ内のイオン量が正確に推定できず、式5及び式6のモデルと一致せず、補正ができなくなるためと考えられる。
However, since residual ions do not appear as intensity values on the mass spectrum, they are not counted as the upper intensity integrated value HIC. For this reason, it is considered that the amount of ions in the trap cannot be accurately estimated by HIC, does not match the models of Equations 5 and 6, and cannot be corrected.
この例では、質量分析部110を汚染せずに問題を顕在化させるため、比較的低濃度で問題が顕在化するように測定シーケンスを設定して実験を行っているが、イオン量のダイナミックレンジをより高濃度側にシフトさせた場合にも、上記の問題が起こる可能性がある。
In this example, in order to make the problem manifest without contaminating the mass spectrometer 110, an experiment is performed by setting a measurement sequence so that the problem becomes apparent at a relatively low concentration. The above-mentioned problem may also occur when the is shifted to a higher concentration side.
これに対し、図23は、同じ測定シーケンスについて、各濃度と測定されたピークの半値全幅の関係を表したものである。図23に示す通り、濃度が高くなるほど、半値全幅も増加する傾向が示されている。この原因を推測すると、イオントラップ114内のイオン量が大きい場合には、イオンが感じる擬ポテンシャルが浅くなり、本来のm/zよりも広がったm/zにてイオンが計測されるためと考えられる。実際、上側強度積算値HICとピーク位置m/zのシフト量との関係では相関が弱くなっていた閾値(0.1ppm、0.2ppm付近)付近でも、半値全幅は単調増加している。
On the other hand, FIG. 23 shows the relationship between each concentration and the full width at half maximum of the measured peak for the same measurement sequence. As shown in FIG. 23, the full width at half maximum tends to increase as the concentration increases. Assuming this cause, it is considered that when the amount of ions in the ion trap 114 is large, the pseudopotential felt by the ions becomes shallow, and the ions are measured at m / z that is wider than the original m / z. It is done. In fact, the full width at half maximum monotonously increases even near the threshold (0.1 ppm, around 0.2 ppm) where the correlation was weak in the relationship between the upper intensity integrated value HIC and the shift amount of the peak position m / z.
以上説明したように、イオントラップ114に導入されるイオン量が過剰に増加すると、イオン量の増大と上側強度積算値との間には相関関係が認められなくなる。そのため、上側強度積算値だけでは空間電荷効果の補正信頼度を判断することはできない。一方、ピークの半値全幅は、上側強度積算値HICとピーク位置m/zのシフト量との間の相関が弱くなる閾値付近(上記の例では0.1ppm、0.2ppm付近)でも、単調に増加する。このため、半値全幅を閾値処理することにより、空間電荷効果の補正結果を信頼できるか否か判断することができる。また、半値全幅は連続的に増加するため、空間電荷効果の補正結果が信頼できるか否かの連続的な信頼度として用いることができる。
As described above, when the amount of ions introduced into the ion trap 114 increases excessively, no correlation is recognized between the increase in the amount of ions and the upper integrated intensity value. Therefore, the correction reliability of the space charge effect cannot be determined only by the upper intensity integrated value. On the other hand, the full width at half maximum of the peak monotonously increases even near the threshold (around 0.1 ppm and 0.2 ppm in the above example) where the correlation between the upper intensity integrated value HIC and the shift amount of the peak position m / z weakens. . For this reason, it is possible to determine whether or not the correction result of the space charge effect is reliable by thresholding the full width at half maximum. Further, since the full width at half maximum increases continuously, it can be used as a continuous reliability indicating whether or not the correction result of the space charge effect is reliable.
なお、図23は、ピークの半値全幅と濃度との関係を示したが、ピークの半値半幅と濃度の間にも、ピーク付近の標準偏差や尖度kから計算されるexp(-k)と濃度の間にも、半値全幅と濃度と同様の関係が認められる。
FIG. 23 shows the relationship between the full width at half maximum of the peak and the concentration, but exp (−k) calculated from the standard deviation near the peak and the kurtosis k is also between the half width of the peak and the concentration. A similar relationship between the full width at half maximum and the concentration is also observed between the concentrations.
(まとめ)
以上の通り、本実施例に係る質量分析システム100を用いれば、空間電荷効果の補正結果の信頼度を計算し、補正信頼度としてオペレータに提示することができる(図5~図9)。また、補正信頼度を質量スペクトルの情報及び/又は補正後スペクトルの情報と共にユーザインタフェース画面に表示すれば、オペレータは、表示された質量スペクトルを正確に解釈することができる。 (Summary)
As described above, by using the mass spectrometry system 100 according to the present embodiment, the reliability of the correction result of the space charge effect can be calculated and presented to the operator as the correction reliability (FIGS. 5 to 9). Further, if the correction reliability is displayed on the user interface screen together with the mass spectrum information and / or the corrected spectrum information, the operator can correctly interpret the displayed mass spectrum.
この空間電荷効果の補正信頼度の提示機能は、オペレータに専門知識が無い又は少ない場合や携帯型の質量分析システムのように検査環境の厳密な調整が難しい場合に特に有用である。なお、携帯型の質量分析システムには、例えばオンサイト違法薬物検知装置がある。もっとも、この提示機能は、オペレータに専門知識がある場合や研究室内等で使用される質量分析システムの場合にも、測定環境を定量的に確認できる点で有用である。
This function of presenting the correction reliability of the space charge effect is particularly useful when the operator has little or no expertise or when it is difficult to strictly adjust the inspection environment such as a portable mass spectrometry system. Examples of portable mass spectrometry systems include on-site illegal drug detection devices. However, this presentation function is useful in that the measurement environment can be quantitatively confirmed even when the operator has expertise or in the case of a mass spectrometry system used in a laboratory or the like.
また、本実施例に係る質量分析システム100は、計算された補正信頼度に応じ、イオントラップ114に導入されるイオン量が適量になるように、自動的に測定シーケンスを選択することができる。これにより、空間電荷効果の補正信頼度が低かった場合でも、次回の測定シーケンスにおける空間電荷効果については、補正信頼度を高めることができる。
Also, the mass spectrometry system 100 according to the present embodiment can automatically select the measurement sequence so that the amount of ions introduced into the ion trap 114 becomes an appropriate amount according to the calculated correction reliability. Thereby, even when the correction reliability of the space charge effect is low, the correction reliability can be increased for the space charge effect in the next measurement sequence.
また、本実施例に係る質量分析システムの場合には、ユーザインタフェース画面を通じ、再測定、測定シーケンスの変更、測定の停止等をオペレータが選択することができる。当該機能の搭載により、オペレータの意図せぬ測定シーケンスの変更や測定動作の実行を防止できる。もっとも、本実施例に係る質量分析システムの場合には、測定シーケンスの変更等を補正信頼度と閾値の比較結果に基づいて自動化する機能が設けられている。また、各動作の実行を規定する閾値は、オペレータがユーザインタフェース画面を通じて自由に設定できるため、オペレータの意図を自動化処理に反映させることができる。
Further, in the case of the mass spectrometry system according to the present embodiment, the operator can select remeasurement, measurement sequence change, measurement stop, etc. through the user interface screen. By mounting this function, it is possible to prevent an operator from unintentionally changing the measurement sequence and executing the measurement operation. However, in the case of the mass spectrometry system according to the present embodiment, a function for automating the change of the measurement sequence or the like based on the comparison result between the correction reliability and the threshold value is provided. Moreover, since the threshold value that defines the execution of each operation can be freely set by the operator through the user interface screen, the operator's intention can be reflected in the automation process.
[実施例2]
本実施例では、実施例1に比して、一段と高精度に補正信頼度を計算することができる質量分析システムについて説明する。なお、本実施例に係る質量分析システムの基本的なハードウェア構成及び機能構成は実施例1と同じである。以下では、実施例1と相違する部分、すなわち補正信頼度算出処理(ステップS406)についてのみ説明する。 [Example 2]
In the present embodiment, a mass spectrometry system capable of calculating the correction reliability with higher accuracy than in the first embodiment will be described. The basic hardware configuration and functional configuration of the mass spectrometry system according to the present embodiment are the same as those of the first embodiment. Hereinafter, only the part different from the first embodiment, that is, the correction reliability calculation process (step S406) will be described.
図24は、本実施例で使用する補正信頼度算出処理(ステップS406)の詳細処理を示している。まず、補正信頼度算出部203は、現在までに測定した全スキャンの質量スペクトルを対象に、ピーク抽出処理を実行する(ステップS2401)。ピーク抽出処理の内容は、ステップS1501と同じで良い。
FIG. 24 shows the detailed process of the correction reliability calculation process (step S406) used in the present embodiment. First, the correction reliability calculation unit 203 performs a peak extraction process on the mass spectra of all the scans measured up to now (step S2401). The contents of the peak extraction process may be the same as in step S1501.
次に、補正信頼度算出部203は、抽出した複数のピークの中から補正信頼度の算出に用いる1個又は複数個のピークを選択する(ステップS2402)。補正信頼度算出部203は、例えば各スキャンに対応する複数の質量スペクトルのうち最も多くの数の質量スペクトルから共通に抽出される1個又は複数個のピークを選択する。
Next, the correction reliability calculation unit 203 selects one or a plurality of peaks used for calculation of the correction reliability from the extracted plurality of peaks (step S2402). The correction reliability calculation unit 203 selects, for example, one or a plurality of peaks extracted in common from the largest number of mass spectra among a plurality of mass spectra corresponding to each scan.
次に、補正信頼度算出部203は、各スキャンの質量スペクトルについて、前ステップで抽出されたピークの上側強度積算値HICを計算する(ステップS2403)。
Next, the correction reliability calculation unit 203 calculates the upper intensity integrated value HIC of the peak extracted in the previous step for the mass spectrum of each scan (step S2403).
次に、補正信頼度算出部203は、相関係数計算処理を実行する(ステップ2404)。相関係数計算処理において、補正信頼度算出部203は、全スキャンの質量スペクトルについて、同一のピークに対する上側強度積算値HICとピーク位置m/zの間の相関係数Rを計算する。すなわち、図22A~図22Gの各グラフに対して計算されるものと同等の相関係数Rを計算する。
Next, the correction reliability calculation unit 203 executes a correlation coefficient calculation process (step 2404). In the correlation coefficient calculation process, the correction reliability calculation unit 203 calculates the correlation coefficient R between the upper intensity integrated value HIC and the peak position m / z for the same peak for the mass spectra of all scans. That is, a correlation coefficient R equivalent to that calculated for each graph of FIGS. 22A to 22G is calculated.
次に、補正信頼度算出部203は、補正信頼度計算処理を実行する(ステップS2405)。補正信頼度計算処理において、補正信頼度算出部203は、相関係数Rを補正信頼度に代入し、補正信頼度算出処理を終了する。
Next, the correction reliability calculation unit 203 executes a correction reliability calculation process (step S2405). In the correction reliability calculation process, the correction reliability calculation unit 203 substitutes the correlation coefficient R for the correction reliability, and ends the correction reliability calculation process.
前述の通り、この実施例においては、あるピークの幅情報(例えば半値全幅)に代えて相関係数Rを使用する。このように、本実施例では、ある1つのピークの情報ではなく、複数のスキャンの結果から抽出される統計的に有意なピークについて得られる相関係数Rを補正信頼度として使用する。ここで、相関係数Rは、空間電荷効果の補正結果の良否と直接関係する。このため、実施例1の場合に比して、一段と高精度の補正信頼度を得ることができる。
As described above, in this embodiment, the correlation coefficient R is used instead of certain peak width information (for example, full width at half maximum). As described above, in this embodiment, the correlation coefficient R obtained for a statistically significant peak extracted from the results of a plurality of scans is used as the correction reliability instead of the information of a single peak. Here, the correlation coefficient R is directly related to the quality of the correction result of the space charge effect. For this reason, compared with the case of Example 1, the correction reliability of higher precision can be obtained.
[実施例3]
本実施例では、実施例1に比して、頑健かつ低処理量で補正信頼度を計算することができる質量分析システムについて説明する。なお、本実施例に係る質量分析システムの基本的なハードウェア構成及び機能構成は実施例1と同じである。以下では、実施例1と相違する部分、すなわち補正信頼度算出処理(ステップS406)についてのみ説明する。 [Example 3]
In the present embodiment, a mass spectrometry system capable of calculating the correction reliability more robustly and with a lower processing amount than that of the first embodiment will be described. The basic hardware configuration and functional configuration of the mass spectrometry system according to the present embodiment are the same as those of the first embodiment. Hereinafter, only the part different from the first embodiment, that is, the correction reliability calculation process (step S406) will be described.
図25は、本実施例で使用する補正信頼度算出処理(ステップS406)の詳細処理を示している。まず、補正信頼度算出部203は、強度積算値計算処理を実行する(ステップS2501)。強度積算値計算処理において、補正信頼度算出部203は、強度積算値TICを計算する。次に、補正信頼度算出部203は、補正信頼度計算処理を実行する(ステップS2502)。補正信頼度計算処理において、補正信頼度算出部203は、(式8)により、補正信頼度cを計算する。
[数8]
c=exp(-ν×TIC) …(式8)
ただし、νは予め設定された正の定数である。 FIG. 25 shows the detailed process of the correction reliability calculation process (step S406) used in this embodiment. First, the correction reliability calculation unit 203 executes intensity integrated value calculation processing (step S2501). In the integrated intensity value calculation process, the correction reliability calculation unit 203 calculates the integrated intensity value TIC. Next, the correction reliability calculation unit 203 executes a correction reliability calculation process (step S2502). In the correction reliability calculation process, the correction reliability calculation unit 203 calculates the correction reliability c using (Equation 8).
[Equation 8]
c = exp (−ν × TIC) (Formula 8)
Here, ν is a positive constant set in advance.
(式8)は、強度積算値TICが小さいほど補正信頼度cが高く、強度積算値TICが大きいほど補正信頼度cが小さいことを意味している。
(Equation 8) means that the smaller the integrated intensity value TIC, the higher the correction reliability c, and the larger the integrated intensity value TIC, the smaller the corrected reliability c.
この実施例では、ピーク抽出や半値全幅を計算することなく、補正信頼度を算出する。このため、夾雑成分などの影響でピーク抽出や半値全幅の計算が困難な場合でも頑健に補正信頼度を算出できる。また、本実施例の手法は、低処理量での動作が可能である。ただし、前述の通り、イオン量が過剰に増加すると、イオン量の増大と強度積算値は相関しなくなるので、実施例1に比べてイオン量のダイナミックレンジが狭いと考えられる。そのため、比較的低濃度において有効な実施例である。
In this embodiment, the correction reliability is calculated without calculating the peak extraction or the full width at half maximum. Therefore, even when it is difficult to extract a peak or calculate the full width at half maximum due to an influence of a contaminating component or the like, the correction reliability can be calculated robustly. Further, the method of this embodiment can operate with a low processing amount. However, as described above, if the amount of ions increases excessively, the increase in the amount of ions does not correlate with the integrated intensity value, so that the dynamic range of the amount of ions is considered to be narrower than in Example 1. Therefore, this embodiment is effective at a relatively low concentration.
[他の実施例]
なお、本発明は上記した実施例に限定されるものではなく、様々な変形例が含まれる。例えば上述した実施例は本発明を分かりやすく説明するために詳細に説明したものであり、必ずしも説明した全ての構成を備えるものに限定されるものではない。また、ある実施例の構成の一部を他の実施例の構成に置き換えることが可能であり、また、ある実施例の構成に他の実施例の構成を加えることも可能である。また、各実施例の構成の一部について、他の構成の追加・削除・置換をすることが可能である。 [Other examples]
In addition, this invention is not limited to an above-described Example, Various modifications are included. For example, the above-described embodiments have been described in detail for easy understanding of the present invention, and are not necessarily limited to those having all the configurations described. Further, a part of the configuration of one embodiment can be replaced with the configuration of another embodiment, and the configuration of another embodiment can be added to the configuration of one embodiment. Further, it is possible to add, delete, and replace other configurations for a part of the configuration of each embodiment.
また、上述した各構成、機能、処理部、処理手段等は、それらの一部又は全部を、例えば集積回路で設計する等によりハードウェアで実現してもよい。また、上記の各構成、機能等は、プロセッサがそれぞれの機能を実現するプログラムを解釈し、実行することによりソフトウェアで実現してもよい。各機能を実現するプログラム、テーブル、ファイル等の情報は、メモリや、ハードディスク、SSD(Solid State Drive)等の記録装置、または、ICカード、SDカード、DVD等の記録媒体に置くことができる。
In addition, each of the above-described configurations, functions, processing units, processing means, and the like may be realized by hardware by designing a part or all of them with, for example, an integrated circuit. Each of the above-described configurations, functions, and the like may be realized by software by interpreting and executing a program that realizes each function by the processor. Information such as programs, tables, and files for realizing each function can be stored in a memory, a recording device such as a hard disk or SSD (Solid State Drive), or a recording medium such as an IC card, SD card, or DVD.
また、制御線や情報線は説明上必要と考えられるものを示しており、製品上必ずしも全ての制御線や情報線を示しているとは限らない。実際にはほとんど全ての構成が相互に接続されていると考えてもよい。
Also, the control lines and information lines indicate what is considered necessary for the explanation, and not all the control lines and information lines on the product are necessarily shown. Actually, it may be considered that almost all the components are connected to each other.
100…質量分析システム
101…中央演算装置
102…ユーザインタフェース部
103…記憶媒体
104…揮発性メモリ
110…質量分析部
111…試料導入部
112…イオン化部
113…イオン輸送部
114…イオントラップ
115…検出器
116…高周波電源
117…真空ポンプ
118…真空ポンプ
119…真空ポンプ
201…測定制御部
202…空間電荷効果補正部
203…補正信頼度算出部
204…結果出力部
205…操作入力部 DESCRIPTION OF SYMBOLS 100 ...Mass spectrometry system 101 ... Central processing unit 102 ... User interface part 103 ... Storage medium 104 ... Volatile memory 110 ... Mass spectrometry part 111 ... Sample introduction part 112 ... Ionization part 113 ... Ion transport part 114 ... Ion trap 115 ... Detection 116: High frequency power source 117 ... Vacuum pump 118 ... Vacuum pump 119 ... Vacuum pump 201 ... Measurement control unit 202 ... Space charge effect correction unit 203 ... Correction reliability calculation unit 204 ... Result output unit 205 ... Operation input unit
101…中央演算装置
102…ユーザインタフェース部
103…記憶媒体
104…揮発性メモリ
110…質量分析部
111…試料導入部
112…イオン化部
113…イオン輸送部
114…イオントラップ
115…検出器
116…高周波電源
117…真空ポンプ
118…真空ポンプ
119…真空ポンプ
201…測定制御部
202…空間電荷効果補正部
203…補正信頼度算出部
204…結果出力部
205…操作入力部 DESCRIPTION OF SYMBOLS 100 ...
Claims (15)
- 試料を測定して質量スペクトルを出力する質量分析部と、
前記質量スペクトルに基づいて空間電荷効果を補正し、補正後スペクトルとして出力する空間電荷効果補正部と、
前記質量スペクトルに基づいて、前記補正をした場合の信頼度を算出する補正信頼度算出部と、
を有する質量分析システム。 A mass analyzer that measures a sample and outputs a mass spectrum;
A space charge effect correction unit that corrects the space charge effect based on the mass spectrum and outputs a corrected spectrum; and
Based on the mass spectrum, a correction reliability calculation unit that calculates the reliability when the correction is performed;
A mass spectrometry system. - 請求項1記載の質量分析システムにおいて、
算出された信頼度を画面に出力する出力部をさらに有し、
前記出力部は、前記補正後スペクトルを前記信頼度と共に画面に表示する
ことを特徴とする質量分析システム。 The mass spectrometry system of claim 1,
An output unit for outputting the calculated reliability on the screen;
The output unit displays the corrected spectrum together with the reliability on a screen. - 請求項1に記載の質量分析システムにおいて、
算出された信頼度を画面に出力する出力部をさらに有し、
前記出力部は、前記信頼度が所定の判定条件を満たすとき、前記質量スペクトルの補正が不可能であることを画面に表示する
ことを特徴とする質量分析システム。 The mass spectrometry system of claim 1,
An output unit for outputting the calculated reliability on the screen;
The output unit displays on the screen that the correction of the mass spectrum is impossible when the reliability satisfies a predetermined determination condition. - 請求項1に記載の質量分析システムにおいて、
算出された信頼度を画面に出力する出力部をさらに有し、
前記出力部は、前記信頼度と所定の判定閾値との比較結果に基づいて、前記質量スペクトルの空間電荷効果を補正した補正後スペクトル又は前記質量スペクトルの提示の有無を変更する
ことを特徴とする質量分析システム。 The mass spectrometry system of claim 1,
An output unit for outputting the calculated reliability on the screen;
The output unit changes the presence or absence of presentation of the corrected spectrum or the mass spectrum corrected for the space charge effect of the mass spectrum based on a comparison result between the reliability and a predetermined determination threshold value. Mass spectrometry system. - 請求項1に記載の質量分析システムにおいて、
算出された信頼度を画面に出力する出力部をさらに有し、
前記出力部は、前記信頼度が所定の判定条件を満たすとき、測定シーケンスの変更、測定停止又は測定開始の入力を受け付ける受付画面を表示する
ことを特徴とする質量分析システム。 The mass spectrometry system of claim 1,
An output unit for outputting the calculated reliability on the screen;
The output unit displays a reception screen for accepting input of change of measurement sequence, measurement stop, or measurement start when the reliability satisfies a predetermined determination condition. - 請求項1に記載の質量分析システムにおいて、
算出された信頼度を画面に出力する出力部をさらに有し、
前記出力部は、前記信頼度の判定閾値の設定を受け付ける受付画面を表示する
ことを特徴とする質量分析システム。 The mass spectrometry system of claim 1,
An output unit for outputting the calculated reliability on the screen;
The output unit displays a reception screen for accepting setting of the determination threshold for the reliability. - 請求項1に記載の質量分析システムにおいて、
前記信頼度に基づいて決定した測定シーケンス又は測定停止命令を前記質量分析部に出力する測定制御部を有する
ことを特徴とする質量分析システム。 The mass spectrometry system of claim 1,
A mass spectrometry system comprising: a measurement control unit that outputs a measurement sequence or a measurement stop command determined based on the reliability to the mass analysis unit. - 請求項1に記載の質量分析システムにおいて、
前記補正信頼度算出部は、前記質量スペクトルのピーク形状に基づいて前記信頼度を算出する
ことを特徴とする質量分析システム。 The mass spectrometry system of claim 1,
The mass spectrometry system, wherein the correction reliability calculation unit calculates the reliability based on a peak shape of the mass spectrum. - 請求項8に記載の質量分析システムにおいて、
前記補正信頼度算出部は、前記質量スペクトルの1個以上のピーク幅に基づいて前記信頼度を算出する
ことを特徴とする質量分析システム。 The mass spectrometry system of claim 8, wherein
The mass spectrometry system, wherein the correction reliability calculation unit calculates the reliability based on one or more peak widths of the mass spectrum. - 請求項1に記載の質量分析システムにおいて、
前記補正信頼度算出部は、前記質量スペクトルの1個以上のピークに対して高質量側の強度積算値とピーク位置の相関に基づいて前記信頼度を算出する
ことを特徴とする質量分析システム。 The mass spectrometry system of claim 1,
The mass spectrometry system, wherein the correction reliability calculation unit calculates the reliability based on a correlation between an integrated intensity value on a high mass side and a peak position with respect to one or more peaks of the mass spectrum. - 請求項1に記載の質量分析システムにおいて、
前記補正信頼度算出部は、前記質量スペクトルの強度積算値に基づいて前記信頼度を算出する
ことを特徴とする質量分析システム。 The mass spectrometry system of claim 1,
The mass spectrometry system, wherein the correction reliability calculation unit calculates the reliability based on an integrated intensity value of the mass spectrum. - 請求項8又は10に記載の質量分析システムにおいて、
前記補正信頼度算出部は、予め登録された質量対電荷比の範囲のピークを選択する
ことを特徴とする質量分析システム。 The mass spectrometry system according to claim 8 or 10,
The mass spectrometry system, wherein the correction reliability calculation unit selects a peak in a mass-to-charge ratio range registered in advance. - 請求項8又は10に記載の質量分析システムにおいて、
前記補正信頼度算出部は、強度に基づいてピークを選択する
ことを特徴とする質量分析システム。 The mass spectrometry system according to claim 8 or 10,
The mass spectrometry system, wherein the correction reliability calculation unit selects a peak based on intensity. - 請求項1に記載の質量分析システムにおいて、
前記質量スペクトルの空間電荷効果を補正した補正後スペクトル又は前記質量スペクトルと補正信頼度とを組としてデータベースに格納する
ことを特徴とする質量分析システム。 The mass spectrometry system of claim 1,
A corrected spectrum in which the space charge effect of the mass spectrum is corrected or the mass spectrum and the correction reliability are stored as a set in a database. - 質量分析部が測定した試料の質量スペクトルを出力する処理と、
補正信頼度算出部が、前記質量スペクトルに基づいて、空間電荷効果の補正結果の信頼度を算出する処理と、
出力部が、算出された信頼度を画面に表示する処理と
を有する質量分析方法。 Processing to output the mass spectrum of the sample measured by the mass analyzer;
A process of calculating a reliability of the correction result of the space charge effect based on the mass spectrum,
A mass spectrometry method, wherein the output unit includes processing for displaying the calculated reliability on a screen.
Applications Claiming Priority (2)
| Application Number | Priority Date | Filing Date | Title |
|---|---|---|---|
| JP2012202786A JP5993259B2 (en) | 2012-09-14 | 2012-09-14 | Mass spectrometry system |
| JP2012-202786 | 2012-09-14 |
Publications (1)
| Publication Number | Publication Date |
|---|---|
| WO2014041886A1 true WO2014041886A1 (en) | 2014-03-20 |
Family
ID=50278017
Family Applications (1)
| Application Number | Title | Priority Date | Filing Date |
|---|---|---|---|
| PCT/JP2013/068837 WO2014041886A1 (en) | 2012-09-14 | 2013-07-10 | Mass analysis system and method |
Country Status (2)
| Country | Link |
|---|---|
| JP (1) | JP5993259B2 (en) |
| WO (1) | WO2014041886A1 (en) |
Families Citing this family (3)
| Publication number | Priority date | Publication date | Assignee | Title |
|---|---|---|---|---|
| CN111684565A (en) * | 2018-02-05 | 2020-09-18 | 株式会社岛津制作所 | Mass spectrometer and mass calibration method for mass spectrometer |
| JP6783263B2 (en) | 2018-03-19 | 2020-11-11 | 日本電子株式会社 | Mass spectrometer |
| JP7380501B2 (en) | 2020-09-30 | 2023-11-15 | 株式会社島津製作所 | Molecular structure analysis system and molecular structure analysis method |
Citations (2)
| Publication number | Priority date | Publication date | Assignee | Title |
|---|---|---|---|---|
| JP2009014424A (en) * | 2007-07-03 | 2009-01-22 | Shimadzu Corp | Chromatograph mass spectrometer |
| JP2010529457A (en) * | 2007-06-02 | 2010-08-26 | セルノ・バイオサイエンス・エルエルシー | A self-calibration approach for mass spectrometry |
Family Cites Families (6)
| Publication number | Priority date | Publication date | Assignee | Title |
|---|---|---|---|---|
| JPH0381660A (en) * | 1989-08-24 | 1991-04-08 | Shimadzu Corp | Selective ion detection using mass spectrometer |
| JPH08212969A (en) * | 1995-02-08 | 1996-08-20 | Hitachi Ltd | Mass spectrometer date processing device |
| JPH1183803A (en) * | 1997-09-01 | 1999-03-26 | Hitachi Ltd | Mass marker correcting method |
| US6884996B2 (en) * | 2003-06-04 | 2005-04-26 | Thermo Finnigan Llc | Space charge adjustment of activation frequency |
| JP2005251594A (en) * | 2004-03-05 | 2005-09-15 | Hitachi High-Technologies Corp | Ion trap/time-of-flight type mass spectrometer |
| JP4636943B2 (en) * | 2005-06-06 | 2011-02-23 | 株式会社日立ハイテクノロジーズ | Mass spectrometer |
-
2012
- 2012-09-14 JP JP2012202786A patent/JP5993259B2/en active Active
-
2013
- 2013-07-10 WO PCT/JP2013/068837 patent/WO2014041886A1/en active Application Filing
Patent Citations (2)
| Publication number | Priority date | Publication date | Assignee | Title |
|---|---|---|---|---|
| JP2010529457A (en) * | 2007-06-02 | 2010-08-26 | セルノ・バイオサイエンス・エルエルシー | A self-calibration approach for mass spectrometry |
| JP2009014424A (en) * | 2007-07-03 | 2009-01-22 | Shimadzu Corp | Chromatograph mass spectrometer |
Non-Patent Citations (1)
| Title |
|---|
| YOSHIHIRO MIZUTANI ET AL.: "Molecular Dynamical Simulation of Space-Charge Effect in a Time-of-Flight Spectrometry", JOURNAL OF THE SPECTROSCOPICAL RESEARCH OF JAPAN, vol. 52, no. 5, 15 October 2003 (2003-10-15), pages 281 - 285 * |
Also Published As
| Publication number | Publication date |
|---|---|
| JP2014059964A (en) | 2014-04-03 |
| JP5993259B2 (en) | 2016-09-14 |
Similar Documents
| Publication | Publication Date | Title |
|---|---|---|
| US8428889B2 (en) | Methods of automated spectral peak detection and quantification having learning mode | |
| US7983852B2 (en) | Methods of automated spectral peak detection and quantification without user input | |
| JP4973628B2 (en) | Chromatograph mass spectrometry data analysis method and apparatus | |
| CN109308989B (en) | Tuning multipole RF amplitude for ions not present in calibrators | |
| US7985948B2 (en) | Systems and methods for analyzing substances using a mass spectrometer | |
| US9482642B2 (en) | Fast method for measuring collision cross section of ions utilizing ion mobility spectrometry | |
| EP2837933B1 (en) | Mass analysis device | |
| JP6176334B2 (en) | Mass spectrometry method, mass spectrometer, and mass spectrometry data processing program | |
| JP2005308741A (en) | Method, system and indication program for analyzing at least one sample based on two or more of techniques for characterizing sample in view point of at least one component and generated product, and for providing characterized data | |
| US9934946B2 (en) | Plasma processing apparatus and operating method of plasma processing apparatus | |
| US20210172800A1 (en) | Systems and Methods for Analyzing Unknown Sample Compositions Using a Prediction Model Based On Optical Emission Spectra | |
| JP6813033B2 (en) | Analytical data analysis method and analytical data analysis device | |
| US20120089342A1 (en) | Methods of Automated Spectral and Chromatographic Peak Detection and Quantification without User Input | |
| JP5757264B2 (en) | Chromatographic mass spectrometry data processor | |
| WO2019150576A1 (en) | Mass spectroscope and mass calibration method for mass spectroscope | |
| JP5993259B2 (en) | Mass spectrometry system | |
| US8026479B2 (en) | Systems and methods for analyzing substances using a mass spectrometer | |
| JP5464711B2 (en) | A method for improving signal-to-noise for quantification by mass spectrometry | |
| JP6748085B2 (en) | Interference detection and peak deconvolution of interest | |
| JP5947567B2 (en) | Mass spectrometry system | |
| CN114270473A (en) | Adaptive intrinsic lock quality correction | |
| CN108780073B (en) | Chromatograph device | |
| JP7334788B2 (en) | WAVEFORM ANALYSIS METHOD AND WAVEFORM ANALYSIS DEVICE | |
| US20220013344A1 (en) | Analysis method and non-transitory computer readable medium | |
| JP6896830B2 (en) | Systems and methods for determining the mass of ionic species |
Legal Events
| Date | Code | Title | Description |
|---|---|---|---|
| 121 | Ep: the epo has been informed by wipo that ep was designated in this application |
Ref document number: 13837567 Country of ref document: EP Kind code of ref document: A1 |
|
| NENP | Non-entry into the national phase |
Ref country code: DE |
|
| 122 | Ep: pct application non-entry in european phase |
Ref document number: 13837567 Country of ref document: EP Kind code of ref document: A1 |