WO2013145437A1 - メンソール含量測定方法 - Google Patents
メンソール含量測定方法 Download PDFInfo
- Publication number
- WO2013145437A1 WO2013145437A1 PCT/JP2012/080460 JP2012080460W WO2013145437A1 WO 2013145437 A1 WO2013145437 A1 WO 2013145437A1 JP 2012080460 W JP2012080460 W JP 2012080460W WO 2013145437 A1 WO2013145437 A1 WO 2013145437A1
- Authority
- WO
- WIPO (PCT)
- Prior art keywords
- menthol content
- measuring
- sample
- menthol
- gum
- Prior art date
- Legal status (The legal status is an assumption and is not a legal conclusion. Google has not performed a legal analysis and makes no representation as to the accuracy of the status listed.)
- Ceased
Links
Images

Classifications
-
- G—PHYSICS
- G01—MEASURING; TESTING
- G01N—INVESTIGATING OR ANALYSING MATERIALS BY DETERMINING THEIR CHEMICAL OR PHYSICAL PROPERTIES
- G01N21/00—Investigating or analysing materials by the use of optical means, i.e. using sub-millimetre waves, infrared, visible or ultraviolet light
- G01N21/17—Systems in which incident light is modified in accordance with the properties of the material investigated
- G01N21/25—Colour; Spectral properties, i.e. comparison of effect of material on the light at two or more different wavelengths or wavelength bands
- G01N21/31—Investigating relative effect of material at wavelengths characteristic of specific elements or molecules, e.g. atomic absorption spectrometry
- G01N21/35—Investigating relative effect of material at wavelengths characteristic of specific elements or molecules, e.g. atomic absorption spectrometry using infrared light
- G01N21/3563—Investigating relative effect of material at wavelengths characteristic of specific elements or molecules, e.g. atomic absorption spectrometry using infrared light for analysing solids; Preparation of samples therefor
-
- G—PHYSICS
- G01—MEASURING; TESTING
- G01N—INVESTIGATING OR ANALYSING MATERIALS BY DETERMINING THEIR CHEMICAL OR PHYSICAL PROPERTIES
- G01N21/00—Investigating or analysing materials by the use of optical means, i.e. using sub-millimetre waves, infrared, visible or ultraviolet light
- G01N21/17—Systems in which incident light is modified in accordance with the properties of the material investigated
- G01N21/25—Colour; Spectral properties, i.e. comparison of effect of material on the light at two or more different wavelengths or wavelength bands
- G01N21/31—Investigating relative effect of material at wavelengths characteristic of specific elements or molecules, e.g. atomic absorption spectrometry
- G01N21/35—Investigating relative effect of material at wavelengths characteristic of specific elements or molecules, e.g. atomic absorption spectrometry using infrared light
- G01N21/359—Investigating relative effect of material at wavelengths characteristic of specific elements or molecules, e.g. atomic absorption spectrometry using infrared light using near infrared light
-
- G—PHYSICS
- G01—MEASURING; TESTING
- G01N—INVESTIGATING OR ANALYSING MATERIALS BY DETERMINING THEIR CHEMICAL OR PHYSICAL PROPERTIES
- G01N2201/00—Features of devices classified in G01N21/00
- G01N2201/12—Circuits of general importance; Signal processing
- G01N2201/129—Using chemometrical methods
Definitions
- the present invention relates to a method for measuring the menthol content in a sample, and more particularly, to a method for measuring the menthol content in a sample using near infrared spectroscopy.
- Menthol is known as a fragrance ingredient added to tobacco products or foods such as gums. In order to impart a desired flavor, an appropriate addition amount is required.
- a method for measuring the menthol content in a sample a method is known in which menthol in a sample is extracted with an extract and quantified by gas chromatography.
- menthol is a highly volatile component, it decays with time. Therefore, in the conventional measurement method, it is necessary to perform measurement as soon as possible after sampling, and to work with great care so as not to cause volatilization loss as much as possible during analysis processing.
- Patent Document 1 discloses a tobacco product evaluation system constituted by related equipment and an infrared spectroscopic device for measuring tobacco components and a device for keeping the tobacco layer flowing on the line constant. However, it is not disclosed how to measure each component specifically.
- Patent Document 2 discloses a method for determining an insertion state of an insert (such as a fragrance capsule) in a cigarette filter.
- the method disclosed in Patent Document 2 is a method in which when a fragrance capsule is broken in a filter, a state in which the menthol has flowed into the filter is determined by a near infrared (NIR) sensor. Therefore, Patent Document 2 does not disclose a method for measuring the amount of menthol in the fragrance capsule.
- NIR near infrared
- the present invention has been made in view of the above problems, and an object thereof is to provide a method for measuring the menthol content in a short time by a simple operation.
- the menthol content measurement method includes a measurement step of irradiating a sample in which menthol is coated with a polysaccharide material with near infrared rays to measure a transmission absorption spectrum or a diffuse reflection spectrum, and the measured transmission absorption spectrum or And a calculation step of calculating an estimated value of menthol content from a calibration curve prepared in advance using the diffuse reflection spectrum.
- the menthol content in a sample can be measured easily and quickly.
- the method for measuring the menthol content in this embodiment includes a step of irradiating a sample in which menthol (also referred to as menthol) is added to a polysaccharide material with near-infrared rays, and measuring a transmission absorption spectrum or a diffuse reflection spectrum.
- menthol also referred to as menthol
- a method for measuring menthol content in a sample comprising the step of calculating an estimated value of menthol content from a calibration curve prepared in advance using a transmitted absorption spectrum or diffuse reflection spectrum.
- the method for measuring the menthol content of the present embodiment is suitably used for measuring the menthol content in a sheet material of tobacco products, for example.
- tobacco products mean cigarettes, cigars, smokeless tobacco, and the like.
- near infrared spectrum the transmission absorption spectrum and diffuse reflection spectrum by near infrared irradiation are referred to as “near infrared spectrum”.
- polysaccharide material refers to a material mainly composed of polysaccharides.
- polysaccharides include carrageenan, agar, gellan gum, tamarind gum, single-component system of psyllium seed gum or konjac glucomannan, or carrageenan, locust bean gum, guar gum, agar, xanthan gum, gellan gum, tamarind gum, tara gum, konjac gluco
- examples include a composite system in which two or more components selected from the group consisting of mannan, starch, cassia gum and psyllium seed gum are combined.
- a perfume-containing material in tobacco products is selected from the group consisting of a single-component polysaccharide gum of gellan gum, tamarind gum, or psyllium seed gum, or locust bean gum, guar gum, xanthan gum, gellan gum, tamarind gum, tara gum, cassia gum and psyllium seed gum.
- a complex polysaccharide gum in which two or more components are combined is preferred.
- the composite gum in which two or more components are combined include a mixture of gellan gum and tamarind gum.
- pulp materials mainly composed of cellulose can be cited.
- the pulp raw material is suitable for use as a packaging material in tobacco products.
- These samples may be colored with a colorant.
- Examples of the sample in which menthol is added to the polysaccharide material include a sample in which menthol is coated with a polysaccharide, a sample in which menthol is sprayed on a molded product of polysaccharide (menthol addition material), and the like. it can. In particular, it is preferable to apply the measurement method of the present embodiment to a sample in which menthol is coated with a polysaccharide gum or a sample in which menthol is sprayed on a molded product of polysaccharide.
- the form of the sample is not particularly limited, and may be the same form as the sample used when the calibration curve is created.
- the measurement method of the present embodiment is, for example, formed into a sheet shape (for example, a thickness of 0.1 mm to 2.0 mm), a capsule shape, a bead shape, a paper shape, and a plate shape in which menthol is coated with a polysaccharide gum. It can be applied to prepared samples. Especially, it uses suitably for a sheet-like and paper-like sample. The sheet may be chopped. Further, a plurality of sheets can be stacked to form a measurement sample.
- “paper” is intended to be a sheet formed from a pulp raw material.
- the sample may be on the substrate.
- a sample can be molded on a base material such as polyethylene terephthalate and aluminum, and the sample can be measured while being placed on the base material.
- the sample moisture content at the time of sample measurement need not be considered.
- the water content is preferably close to the water content of the sample used when the calibration curve was created.
- the moisture content of the sample used when preparing the calibration curve is preferably within the range of ⁇ 3 (%). In the examples described below, the moisture content of the sample is 3-8%.
- NIR near-infrared spectrometer
- the near infrared ray irradiated to the sample is in the wavelength range of 1100 nm to 2500 nm, and includes at least a specific wavelength used when calculating the menthol content from a calibration curve. That's fine.
- the menthol content is measured using the estimation formula (I) in Example 1 described later, it is only necessary to irradiate near infrared rays having a wavelength of about 1562.5 nm.
- the estimation formula (III) in Example 3 to be described later it is only necessary to irradiate near infrared rays having wavelengths near 1224.5 nm and 1562.5 nm.
- the near infrared rays of wavelength 1693.0nm vicinity should just be irradiated.
- wavelengths near 1540.0 nm, near 1562.0 nm, and near 1595.0 nm can also be suitably used for measurement, when performing measurement using these wavelengths, these wavelengths are irradiated. Just do it.
- PLS Partial Least Squares
- Example 5 in which the method of adding menthol to the polysaccharide material is different from that in Examples 1 to 3, the measurement was performed using a wavelength different from that in Examples 1 to 3. Therefore, it is presumed that the wavelength used depends on the addition method of menthol.
- the measurement method of the present embodiment it is possible to measure the menthol content in a sample by measuring a near-infrared spectrum of a single wavelength or a near-infrared spectrum of two wavelengths.
- the measurement can be performed in a short time.
- the configuration of the measuring instrument can be simplified. In other words, measurement can be performed with a simple near-infrared spectrometer.
- the calibration curve used for calculating the menthol content in the measurement method in the present embodiment is preferably created by multivariate analysis using near-infrared spectra of a plurality of samples whose menthol content is known. . Therefore, when the calibration curve does not exist, in the measurement method according to the present embodiment, after measuring near-infrared spectra of a plurality of samples having known menthol contents, the calibration curve is created by multivariate analysis. It is preferable to further include a step.
- MLR Multiple ⁇ LinearPartRegression
- PLS Partial Least Squares regression analysis
- principal component regression analysis principal component regression analysis
- Fourier transform analysis can be used, among which multiple regression analysis and PLS regression Analysis is preferred.
- a sample having a known menthol content refers to a sample whose menthol content is measured by a conventional measurement method.
- the conventional measuring method is a method for quantitatively determining an extract by a gas chromatograph after performing a pretreatment for transferring menthol in a sample into the liquid with an extract.
- the wavelength region of the near-infrared spectrum for creating the calibration curve may be appropriately selected, and is, for example, 1100 nm to 2500 nm. However, it is not limited to this wavelength region, and may be a narrower wavelength region.
- the near-infrared spectrum can be measured by scanning every arbitrary wavelength interval within the above wavelength range, for example, every 0.5 nm.
- a near-infrared light that has been spectrally separated into monochromatic light is irradiated to a sample having a known menthol content within a certain wavelength region (for example, 1100 nm to 2500 nm) at regular intervals (for example, 0.5 nm intervals). . Since near infrared transmission and / or diffuse reflection occurs in the sample, the intensity of monochromatic light not absorbed by the sample is measured by a detector. The spectrum of the absorption intensity of each wavelength in the sample is mapped from the difference from the reference intensity measured in advance, and the mapped spectrum information is acquired as data. The above-described processing is performed on a plurality of samples, thereby acquiring a plurality of pieces of spectral information data.
- each data after measuring a transmission absorption spectrum or a diffuse reflection spectrum, these are converted into a secondary differential spectrum.
- the principal component analysis is performed using the obtained second derivative spectrum and the menthol content measured using the conventional measurement method, and the principal component (main wavelength) contributing to the objective variable (menthol content) is selected.
- a calibration curve is created by performing multivariate analysis such as multiple regression analysis and PLS regression analysis.
- this calibration curve can be used from the next measurement, and the step of creating a calibration curve is not necessary.
- the irradiation position on the sample is usually changed and irradiated with near infrared rays a plurality of times, and the average of the plurality of absorption intensities is used.
- the measurement can be completed easily and in a short time as compared with the conventional measuring method using a gas chromatograph.
- the time required for measurement is shorter, and when only a single wavelength is used, the measurement can be completed in a shorter time.
- the measurement result obtained has a high correlation with the result obtained by the conventional measurement method.
- Example 1 A polysaccharide sheet in which menthol was coated with a polysaccharide gum was prepared as a sample for preparing a calibration curve. Specifically, an uncolored translucent sheet (about 0.1 mm thick) in which menthol was added to a polysaccharide gum made of a mixture of gellan gum and tamarind gum was prepared as a sample for preparing a calibration curve. The amount of menthol contained in each sheet is measured in advance using a conventional menthol content measurement method. Regarding the sample for preparing a calibration curve, the reflection diffusion spectrum was measured at 0.5 nm intervals in the near infrared wavelength region of 1100 to 2500 nm.
- a sample for preparing a calibration curve is cut into pieces (14 cm ⁇ 4 cm) of a size (14 cm ⁇ 4 cm) that fits into a measurement boat (inner diameter W15 cm ⁇ D5 cm ⁇ H4 cm, bottom: made of quartz glass).
- the near infrared rays are irradiated from the bottom surface of quartz glass using a near infrared spectrometer (model: XM-1100, manufactured by FOSS NIRSystems) and reflected for each wavelength. Near-infrared light was detected and the diffuse reflection spectrum was measured from the difference from the reference intensity.
- each diffuse reflection spectrum is spectrally converted by the second derivative method, and the objective variable is known menthol content, principal component
- a calibration curve was created by multiple regression analysis.
- Y obtained by the estimation formula (I) is an estimated value of menthol content (ratio per dry matter (%)).
- K (1) represents the absorbance at a wavelength of 1562.5 nm, which was subjected to differentiation after spectrum measurement.
- Estimation formula (I): Y 12391.5K (1) +56.6
- the coefficient of determination (R 2 ) was 0.94, and the standard error was 3.37.
- Example 2 A polysaccharide sheet similar to Example 1 to which menthol was added and formed on a polyethylene terephthalate film was prepared as a sample for preparing a calibration curve.
- a non-colored translucent sheet obtained by adding menthol to a polysaccharide gum consisting of a mixture of gellan gum and tamarind gum is a polyethylene terephthalate substrate (about 0.05 mm thick,
- a sheet attached to the substrate was prepared as a sample for preparing a calibration curve.
- the amount of menthol contained in each sheet with polyethylene terephthalate is measured in advance using a conventional menthol content measurement method.
- a diffuse reflection spectrum was measured at intervals of 0.5 nm in the near infrared wavelength region of 1100 to 2500 nm.
- a near-infrared spectrometer model: XM-1100, manufactured by FOSS NIRSystems
- estimation formula (II) could be obtained.
- Y obtained by the estimation formula (II) is an estimated value of menthol content (ratio per dry matter (%)).
- K (1) represents the absorbance at a wavelength of 1562.5 nm, which was subjected to differentiation after spectrum measurement.
- Estimation formula (II): Y 38764.38K (1) +24.43
- the coefficient of determination (R 2 ) was 0.96, and the standard error was 2.60.
- the menthol content (chemical analysis value) obtained by the conventional measurement method and the estimated menthol value (NIR) obtained by the near infrared spectroscopy using the estimation formula (II) (Measurement value) is shown in FIG. 2 (“CAL” in FIG. 2).
- a sample having an unknown menthol content was subjected to spectrum measurement by near infrared spectroscopy, and the menthol content was estimated using the calibration curve.
- a measurement sample having an unknown menthol content was prepared in the same manner as the calibration curve preparation sample.
- a diffuse reflectance spectrum was measured, and an estimated value of menthol content was calculated for 12 samples using the absorbance at a wavelength of 1562.5 nm and an estimation formula (II) subjected to differentiation after the spectrum measurement.
- Example 3 In the present example, a case where a two-wavelength diffuse reflection spectrum was used was studied for the purpose of measuring with higher accuracy.
- a sample for preparing a calibration curve with a polyethylene terephthalate substrate attached was prepared in the same manner as in Example 2 except that the polysaccharide gum was colored brown, and the diffuse reflection spectrum was measured.
- a calibration curve was prepared in the same manner as in Example 1. At that time, a calibration curve using absorbance at two wavelengths was extracted.
- Y obtained by the estimation formula (III) is an estimated value of menthol content (ratio per dry matter (%)).
- K (1) and K (2) indicate the absorbances at wavelengths of 1562.5 nm and 1224.5 nm, respectively, which were differentiated after the spectrum measurement.
- Estimation formula (III): Y 7819.17K (2) + 38764.38K (1) +24.43
- the coefficient of determination (R 2 ) was 0.99, and the standard error was 1.32.
- the menthol content (chemical analysis value) obtained by the conventional measurement method and the menthol estimate value (NIR) obtained by the near infrared spectroscopy using the estimation formula (III) (Measurement value) is shown in FIG. 3 (“CAL” in FIG. 3).
- a sample having an unknown menthol content was subjected to spectrum measurement by near infrared spectroscopy, and the menthol content was estimated using the calibration curve.
- a measurement sample having an unknown menthol content was prepared in the same manner as the calibration curve preparation sample. A diffuse reflection spectrum was measured, and an estimated value of menthol content was calculated for 12 samples using absorbance at wavelengths of 1562.5 nm and 1224.5 nm and an estimation formula (III) subjected to differential processing after the spectrum measurement.
- Example 4 In the same manner as in Example 2, a calibration curve preparation sample was prepared, and a diffuse reflection spectrum was measured.
- Example 5 a sample in which a solution containing menthol was sprayed on a molded product of a polysaccharide material was used as a measurement target. Specifically, a sample in which an aluminum foil was bonded to one side of cellulose paper made from pulp and a solution containing menthol was sprayed on the other side was used as a measurement target. Further, samples with different menthol addition amounts were prepared by changing the amount of menthol sprayed.
- a diffuse reflection spectrum was measured at 0.5 nm intervals in the near infrared wavelength region of 1100 to 2500 nm.
- a sample for preparing a calibration curve is cut into pieces (14 cm ⁇ 4 cm) of a size (14 cm ⁇ 4 cm) that fit into a measurement boat (inner diameter W15 cm ⁇ D5 cm ⁇ H4 cm, bottom surface: made of quartz glass), and the cellulose surface ( Place one sheet with the aluminum foil not attached), and irradiate near infrared rays from the bottom of quartz glass using a near infrared spectrophotometer (FOSS NIRSystems, model: XM-1100)
- the diffuse reflectance spectrum was measured in the same manner as in Examples 1 to 4.
- Y obtained by the estimation formula (IV) is an estimated value of menthol content (unit: mg / 100 cm 2 ).
- K (1) represents the absorbance at a wavelength of 1693.0 nm, which was subjected to differentiation after spectrum measurement.
- Estimation formula (IV): Y -12408.95K (1) -2.1815
- the coefficient of determination (R 2 ) was 0.98, and the standard error was 2.11.
- the menthol content (chemical analysis value) obtained by the conventional measurement method and the menthol estimate value (NIR) obtained by the near infrared spectroscopy using the estimation formula (IV) (Measurement value) is shown in FIG. 4 (“CAL” in FIG. 4).
- a sample having an unknown menthol content was subjected to spectrum measurement by near infrared spectroscopy, and the menthol content was estimated using the calibration curve.
- a measurement sample having an unknown menthol content was prepared in the same manner as the calibration curve preparation sample. A diffuse reflection spectrum was measured, and an estimated value of menthol content was calculated for 27 samples using the absorbance at a wavelength of 1693.0 nm subjected to differential processing after the spectrum measurement and the estimation formula (IV).
- the present invention can be used for the manufacture of tobacco product raw materials, packaging materials, and the like.
Landscapes
- Physics & Mathematics (AREA)
- Spectroscopy & Molecular Physics (AREA)
- Health & Medical Sciences (AREA)
- Life Sciences & Earth Sciences (AREA)
- Chemical & Material Sciences (AREA)
- Analytical Chemistry (AREA)
- Biochemistry (AREA)
- General Health & Medical Sciences (AREA)
- General Physics & Mathematics (AREA)
- Immunology (AREA)
- Pathology (AREA)
- Investigating Or Analysing Materials By Optical Means (AREA)
Description
本発明は、試料中のメンソール含量を測定する方法に関し、詳細には、試料中のメンソール含量を、近赤外分光法を利用して測定する方法に関する。
メンソールは、たばこ製品、あるいはガム等の食品等に添加される香料成分として知られている。所望の香味を付与するには、適正な添加量が求められる。試料中のメンソール含量を測定する方法としては、試料中のメンソールを抽出液で抽出し、これをガスクロマトグラフで定量する方法が知られている。
ところでメンソールは揮発性の高い成分であるため、時間とともに揮散減衰してしまう。そのため、従来の測定方法では、サンプリング後、できるだけ速やかに測定を実施し、分析処理中も揮散ロスが極力生じないよう細心の注意を払って作業を行なう必要がある。
また、従来の測定方法では、試料の対象となった材料のメンソール含量が所望の範囲内にあることを確認するのに最低でも1~2日の時間を要する。そのため、試料の対象となる材料を製造した後、測定されたメンソール量から製造におけるメンソール添加量をリアルタイムでフィードバック制御することは不可能である。さらに、乾物当たりのメンソール含量を知るためには、試料の水分測定も必要になるため、さらなる労力および時間を必要とする。
なお、上記特許文献1には、たばこの成分を測定するための関連設備および赤外線分光装置と、ライン上を流れるたばこの層を一定に保つための装置とによって構成されるたばこ製品評価システムが開示されているが、各成分を具体的にどのように測定するのかについては開示されていない。
また、上記特許文献2には、シガレットフィルタ中の挿入物(香料カプセル等)の挿入状態を判定する方法が開示されている。特許文献2に開示されている方法は、香料カプセルがフィルタ中で破損している場合に、メンソールがフィルタ中に流出した状態を近赤外線(NIR)センサにより判定する方法である。したがって、香料カプセル中のメンソール量を測定する方法については、特許文献2には開示されていない。
そこで、本発明は上記の問題点に鑑みてなされたものであり、その目的は、簡便な作業で短時間にメンソール含量を測定する方法を提供することにある。
本発明に係るメンソール含量測定方法は、メンソールが多糖類材料に被覆されてなる試料に近赤外線を照射し、透過吸収スペクトルまたは拡散反射スペクトルを測定する測定工程、および測定された上記透過吸収スペクトルまたは上記拡散反射スペクトルを用いて、予め作成された検量線からメンソール含量推定値を算出する算出工程、を含む構成である。
本発明に係るメンソール含量測定方法によれば、簡便かつ迅速に、試料中のメンソール含量を測定することができる。
本発明に係るメンソール含量の測定方法の一実施形態について説明すれば以下の通りである。
本実施の形態におけるメンソール含量の測定方法は、メンソール(メントールともいう)が多糖類材料に添加されてなる試料に近赤外線を照射し、透過吸収スペクトルまたは拡散反射スペクトルを測定する工程、および測定された透過吸収スペクトルまたは拡散反射スペクトルを用いて、予め作成された検量線からメンソール含量推定値を算出する工程、を含むことを特徴とする試料中のメンソール含量測定方法である。
本実施の形態のメンソール含量の測定方法は、例えば、たばこ製品のシート原料におけるメンソール含量の測定に好適に用いられる。なお、本明細書においてたばこ製品とは、シガレット、シガーおよび無煙たばこ等のことをいう。
以下、近赤外線照射による透過吸収スペクトルおよび拡散反射スペクトルのことを「近赤外スペクトル」と称する。
本実施の形態における測定方法が適用される試料としては、メンソールが多糖類材料に添加されてなるものである。本明細書において「多糖類材料」とは、主として多糖類によって構成されている材料を指す。多糖類としては、例えば、カラギーナン、寒天、ゲランガム、タマリンドガム、サイリウムシードガムもしくはコンニャクグルコマンナンの単成分系、またはカラギーナン、ローカストビーンガム、グアーガム、寒天、キサンタンガム、ゲランガム、タマリンドガム、タラガム、コンニャクグルコマンナン、デンプン、カシアガムおよびサイリウムシードガムからなる群より選択される2以上の成分を組み合わせた複合系が挙げられる。これらは、たばこ製品における香料含有材料としての用途に適しているものである。なかでも、ゲランガム、タマリンドガム、もしくはサイリウムシードガムの単成分系の多糖類のガム、またはローカストビーンガム、グアーガム、キサンタンガム、ゲランガム、タマリンドガム、タラガム、カシアガムおよびサイリウムシードガムからなる群より選択される2以上の成分を組み合わせた複合系の多糖類のガムが好ましい。2以上の成分を組み合わせた複合系のガムとしては、例えば、ゲランガムおよびタマリンドガムの混合物が挙げられる。
また、多糖類材料としては、上記した多糖類によって構成されるものの他にも、主としてセルロースによって構成されるパルプ原料が挙げられる。パルプ原料は、たばこ製品における包装材料としての用途に適しているものである。
これらの試料は、着色剤によって着色されていてもよい。
メンソールが多糖類材料に添加されてなる試料としては、例えば、メンソールが多糖類で被覆されてなるもの、多糖類による成形物にメンソールが噴霧されてなるもの(メンソール付加材)等を挙げることができる。中でも、メンソールが多糖類のガムで被覆されてなる試料または多糖類による成形物にメンソールが噴霧されてなる試料に本実施の形態の測定方法を適用することが好ましい。
本実施の形態の測定方法では試料の形態に特に制限はなく、検量線を作成したときに用いられた試料と同一の形態であればよい。本実施の形態の測定方法は、例えば、メンソールが多糖類のガムで被覆されてなるシート状(例えば厚さ0.1mm~2.0mm)、カプセル状、ビーズ状、紙状および板状に成形された試料に適用できる。なかでも、シート状および紙状の試料に好適に使用される。シートは刻み状にしたものであってもよい。また、複数枚のシートを重ねて、測定用試料とすることも可能である。なお、本明細書において「紙状」とは、パルプ原料によって成形されたシート状のものを意図している。また、近赤外線が試料に照射されるのであれば、当該試料が基材上にあるものであってもよい。例えば、ポリエチレンテレフタレート、およびアルミ等の基材上に試料を成形し、基材に載せた状態のまま試料を測定することも可能である。
本実施の形態の測定方法においては、試料測定時の試料水分含量は、特に考慮する必要はない。しかしながら、検量線を作成したときに用いられた試料の水分含量に近い水分含量であることが好ましい。例えば、検量線を作成したときに用いられた試料の水分含量±3(%)の範囲内であることが好ましい。後述する実施例においては、試料の水分含量は、3~8%である。
スペクトルの測定には、近赤外分光法に一般的に用いられている近赤外分光測定装置(NIR)を用いることができる。
メンソール含量が未知である試料の測定に際して、試料に照射する近赤外線は、1100nm~2500nmの波長領域であり、少なくとも、検量線からメンソール含量を算出する際に用いられる特定の波長が含まれていればよい。例えば、後述する実施例1における推定式(I)を利用してメンソール含量を測定する場合には、波長1562.5nm付近の近赤外線が照射されていればよい。また、後述する実施例3における推定式(III)を利用してメンソール含量を測定する場合には、波長1224.5nm付近および1562.5nm付近の近赤外線が照射されていればよい。また、後述する実施例5における推定式(V)を利用してメンソール含量を測定する場合には、波長1693.0nm付近の近赤外線が照射されていればよい。他にも、1540.0nm付近、1562.0nm付近および1595.0nm付近の波長も測定に好適に利用することができるため、これらを用いて測定を行なう場合には、これらの波長が照射されていればよい。なお、検量線がPLS(Partial Least Squares)回帰分析により得られたものである場合には、PLS回帰分析に利用したすべての波長を近赤外分光法によるメンソール含量の測定に利用する。
なお、後述する実施例(実施例1~3)においては、試料の重ね合わせ枚数、試料の着色の有無、および試料に付けられる基板の有無等、試料の形態に関係なく、何れも同一の波長を用いて測定されている。一方で、多糖類材料へのメンソールの添加方法が実施例1~3とは異なる実施例5においては、実施例1~3とは異なる波長を用いて測定されている。したがって、メンソールの添加方法によって、使用される波長が相違すると推察される。
本実施の形態の測定方法によれば、単一波長の近赤外スペクトルまたは2つの波長の近赤外スペクトルを測定することで、試料中のメンソール含量を測定することが可能である。単一波長の近赤外スペクトルのみを測定する場合には、測定を短時間で行うことができる。また、2つの波長の近赤外スペクトルのみを測定する場合には、測定を短時間で行うとともにより精度よく測定を行うことができる。また、単一波長もしくは2つの波長のみでもって測定を行う場合には、測定機器の構成を簡素にすることができる。換言すれば、簡易な近赤外分光測定装置でもって測定を行うことができる。
近赤外分光法を利用した他の項目の測定法(例えば、水分の測定)が知られている場合に、当該測定に用いられる波長を含めておくことにより、メンソール含量の測定と同時に、当該他の項目の測定も行うことができる。
本実施の形態における測定方法においてメンソール含量の算出に用いられる検量線は、メンソール含量が既知である複数の試料の近赤外スペクトルを用いて、多変量解析によって作成されたものであることが好ましい。そのため、当該検量線が存在しない場合には、本実施の形態における測定方法において、メンソール含量が既知である複数の試料の近赤外スペクトルを測定した後、多変量解析によって上記検量線を作成する工程をさらに含むことが好ましい。
多変量解析としては、重回帰分析(MLR:Multiple Linear Regression)、PLS(Partial Least Squares)回帰分析、主成分回帰分析、およびフーリエ変換解析を利用することができ、中でも、重回帰分析およびPLS回帰分析が好ましい。
本明細書において、「メンソール含量が既知である試料」とは、従来の測定方法によりメンソール含量を測定した試料のことを指す。従来の測定方法は、試料中のメンソールを抽出液で液中に移行させる前処理を行った後、抽出物をガスクロマトグラフで定量する方法である。
検量線を作成するための近赤外スペクトルの波長領域は、適宜選択すればよく、例えば1100nm~2500nmである。しかしながらこの波長領域に限定されるものではなく、より狭い波長領域であってもよい。また、近赤外スペクトルは、上記波長範囲内で任意の一定波長間隔毎、例えば0.5nm毎に走査して測定することができる。
次に、検量線の具体的な作成方法について説明する。
まず、メンソール含量が既知である試料に対して、分光されて単色光となった近赤外線を、ある波長領域内(例えば、1100nm~2500nm)、一定間隔(例えば、0.5nm間隔)で照射する。試料において近赤外線の透過吸収および/または拡散反射が起こるため、試料に吸収されなかった単色光強度を検出器によって測定する。事前に測定したレファレンス強度との違いから試料における各波長の吸収強度のスペクトルをマップし、マップしたスペクトル情報をデータとして取得する。複数の試料について上記の処理を行い、これにより、複数のスペクトル情報のデータを取得する。それぞれのデータについて、透過吸収スペクトルまたは拡散反射スペクトルを測定した後、これらを2次微分スペクトルに変換する。得られた2次微分スペクトルおよび従来の測定法を用いて測定されたメンソール含量を用いて主成分分析を行い、目的変数(メンソール含量)に寄与する主成分(主波長)を選択する。次いで、重回帰分析およびPLS回帰分析などの多変量解析を行うことによって、検量線を作成する。
なお検量線が作成されれば、その次の測定からはこの検量線を用いればよく、検量線を作成する工程は不要となる。
なお、スペクトル測定では、通常、試料における照射位置を変えて近赤外線を複数回照射し、その複数の吸収強度の平均を用いる。
以上のように、本実施の形態のメンソール含量の測定方法によれば、ガスクロマトグラフによる従来の測定方法に比べ、簡便かつ短時間に測定を完了することができる。測定に用いる波長が2つのみである場合には、測定に要する時間がより短くなり、単一の波長のみを用いる場合にはさらに短時間で測定を完了することができる。また、得られる測定結果は、従来の測定方法により得られる結果と高い相関がある。
以下に実施例を示し、本発明の実施の形態についてさらに詳しく説明する。もちろん、本発明は以下の実施例に限定されるものではなく、細部については様々な態様が可能であることはいうまでもない。さらに、本発明は上述した実施形態に限定されるものではなく、請求項に示した範囲で種々の変更が可能であり、それぞれ開示された技術的手段を適宜組み合わせて得られる実施形態についても本発明の技術的範囲に含まれる。また、本明細書中に記載された文献の全てが参考として援用される。
〔実施例1〕
メンソールが多糖類のガムで被覆されてなる多糖類シートを、検量線作成用試料として準備した。具体的には、ゲランガムおよびタマリンドガムの混合物からなる多糖類のガムにメンソールを添加した無着色の半透明シート(約0.1mm厚)を検量線作成用試料として準備した。各シートに含まれるメンソールの量は、従来のメンソール含量測定法を用いて予め測定されている。検量線作成用試料について、1100~2500nmの近赤外波長領域に関し、0.5nm間隔で反射拡散スペクトルを測定した。具体的には、検量線作成用試料を、測定用のボート(内径W15cm×D5cm×H4cm、底面:石英ガラス製)に入る大きさ(14cm×4cm)の断片に切り出し、測定用のボートに5枚重ねにして入れ、鎮圧板をのせた後、近赤外線分光測定装置(FOSS NIRSystems社製、型式:XM-1100)を用いて、石英ガラス張りの底面から近赤外線を照射し、波長毎に反射する近赤外線を検出してレファレンス強度との違いから拡散反射スペクトルを測定した。
メンソールが多糖類のガムで被覆されてなる多糖類シートを、検量線作成用試料として準備した。具体的には、ゲランガムおよびタマリンドガムの混合物からなる多糖類のガムにメンソールを添加した無着色の半透明シート(約0.1mm厚)を検量線作成用試料として準備した。各シートに含まれるメンソールの量は、従来のメンソール含量測定法を用いて予め測定されている。検量線作成用試料について、1100~2500nmの近赤外波長領域に関し、0.5nm間隔で反射拡散スペクトルを測定した。具体的には、検量線作成用試料を、測定用のボート(内径W15cm×D5cm×H4cm、底面:石英ガラス製)に入る大きさ(14cm×4cm)の断片に切り出し、測定用のボートに5枚重ねにして入れ、鎮圧板をのせた後、近赤外線分光測定装置(FOSS NIRSystems社製、型式:XM-1100)を用いて、石英ガラス張りの底面から近赤外線を照射し、波長毎に反射する近赤外線を検出してレファレンス強度との違いから拡散反射スペクトルを測定した。
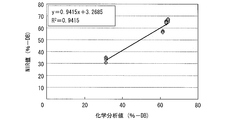
検量線作成用試料15サンプルについて拡散反射スペクトルを測定した後、当該スペクトルと、従来の測定法により得られていたメンソール含量との相関を多変量解析手法を用いて解析して、検量線を作成した。詳細には、上記近赤外線分光測定装置に内蔵された汎用VISIONソフト(FOSS NIRSystems社製)を用いて、各拡散反射スペクトルを2次微分法でスペクトル変換し、目的変数を既知メンソール含量、主成分を主波長として主成分分析を行った後に、重回帰分析によって検量線を作成した。
その結果、以下の推定式(I)を得ることができた。推定式(I)によって得られるYがメンソール含量の推定値(乾物あたりの割合(%))である。K(1)は、スペクトル測定後に微分処理された、波長1562.5nmにおける吸光度を示している。
推定式(I):
Y=12391.5K(1)+56.6
推定式(I)は、決定係数(R2)が0.94であり、標準誤差が3.37であった。
推定式(I):
Y=12391.5K(1)+56.6
推定式(I)は、決定係数(R2)が0.94であり、標準誤差が3.37であった。
本実施例における検量線作成用試料について、従来の測定法により得られたメンソール含量(化学分析値)と、推定式(I)を用いて近赤外分光法により得られたメンソール推定値(NIR測定値)との関係を図1に示す。
〔実施例2〕
ポリエチレンテレフタレート製のフィルム上に成形された、メンソールが添加された実施例1と同様の多糖類シートを、検量線作成用試料として準備した。具体的には、ゲランガムおよびタマリンドガムの混合物からなる多糖類のガムにメンソールを添加した無着色の半透明シート(約0.1mm厚)がポリエチレンテレフタレートの基板(約0.05mm厚、製造工程の基板)に付いたシートを、検量線作成用試料として準備した。各ポリエチレンテレフタレート付きシートに含まれるメンソールの量は、従来のメンソール含量測定法を用いて予め測定されている。検量線作成用試料について、1100~2500nmの近赤外波長領域に関し、0.5nm間隔で拡散反射スペクトルを測定した。具体的には、ポリエチレンテレフタレートの基板が付いたままの検量線作成用試料を、測定用のボート(内径W15cm×D5cm×H4cm、底面:石英ガラス製)に入る大きさ(14cm×4cm)の断片に切り出し、当該ボートにシート面を下にして(ポリエチレンテレフタレート側を上にして)1枚入れ、近赤外線分光測定装置(FOSS NIRSystems社製、型式:XM-1100)を用いて、石英ガラス張りの底面から近赤外線を照射し、実施例1と同様にして拡散反射スペクトルを測定した。
〔実施例2〕
ポリエチレンテレフタレート製のフィルム上に成形された、メンソールが添加された実施例1と同様の多糖類シートを、検量線作成用試料として準備した。具体的には、ゲランガムおよびタマリンドガムの混合物からなる多糖類のガムにメンソールを添加した無着色の半透明シート(約0.1mm厚)がポリエチレンテレフタレートの基板(約0.05mm厚、製造工程の基板)に付いたシートを、検量線作成用試料として準備した。各ポリエチレンテレフタレート付きシートに含まれるメンソールの量は、従来のメンソール含量測定法を用いて予め測定されている。検量線作成用試料について、1100~2500nmの近赤外波長領域に関し、0.5nm間隔で拡散反射スペクトルを測定した。具体的には、ポリエチレンテレフタレートの基板が付いたままの検量線作成用試料を、測定用のボート(内径W15cm×D5cm×H4cm、底面:石英ガラス製)に入る大きさ(14cm×4cm)の断片に切り出し、当該ボートにシート面を下にして(ポリエチレンテレフタレート側を上にして)1枚入れ、近赤外線分光測定装置(FOSS NIRSystems社製、型式:XM-1100)を用いて、石英ガラス張りの底面から近赤外線を照射し、実施例1と同様にして拡散反射スペクトルを測定した。
検量線作成用試料32サンプルについて拡散反射スペクトルを測定した後、実施例1と同様にして検量線を作成した。
その結果、以下の推定式(II)を得ることができた。推定式(II)によって得られるYがメンソール含量の推定値(乾物あたりの割合(%))である。K(1)は、スペクトル測定後に微分処理された、波長1562.5nmにおける吸光度を示している。
推定式(II):
Y=38764.38K(1)+24.43
推定式(II)は、決定係数(R2)が0.96であり、標準誤差が2.60であった。
推定式(II):
Y=38764.38K(1)+24.43
推定式(II)は、決定係数(R2)が0.96であり、標準誤差が2.60であった。
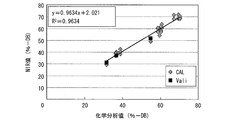
本実施例における検量線作成用試料について、従来の測定法により得られたメンソール含量(化学分析値)と、推定式(II)を用いて近赤外分光法により得られたメンソール推定値(NIR測定値)との関係を図2に示す(図2中、「CAL」)。
次に、メンソール含量が未知である試料について、近赤外分光法によりスペクトル測定を行い、上記検量線を用いてメンソール含量を推定した。まず、検量線作成用試料と同様にして、メンソール含量が未知である測定用試料を準備した。拡散反射スペクトルを測定し、スペクトル測定後に微分処理した波長1562.5nmにおける吸光度および推定式(II)を用いて、12サンプルについてメンソール含量推定値を算出した。
各測定用試料について近赤外分光法によりメンソール含量を推定した後、従来の測定法により同一試料のメンソール含量を測定し、近赤外分光法により得られたメンソール含量推定値と、従来の測定法により得られたメンソール含量との相関関係を調べた。結果を図2に示す(図2中、「Vali」)。
図2に示すとおり、従来の測定方法により得られたメンソール含量と、近赤外分光法により得られたメンソール含量の推定値との間には高い相関が見られた。以上から、近赤外分光法により、かつ単一波長のスペクトル測定により、短時間のうちに試料中のメンソール含量を精度よく測定することができる。
〔実施例3〕
本実施例では、より精度よく測定を行うことを目的として、2波長の拡散反射スペクトルを用いる場合について、検討を行った。
〔実施例3〕
本実施例では、より精度よく測定を行うことを目的として、2波長の拡散反射スペクトルを用いる場合について、検討を行った。
多糖類のガムを褐色に着色した以外は実施例2と同様にして、ポリエチレンテレフタレートの基板が付いたままの検量線作成用試料を準備し、拡散反射スペクトルを測定した。
検量線作成用試料32サンプルについて拡散反射スペクトルを測定した後、実施例1と同様にして検量線を作成した。その際、2つの波長の吸光度を利用している検量線を抽出した。
その結果、以下の推定式(III)を得ることができた。推定式(III)によって得られるYがメンソール含量の推定値(乾物あたりの割合(%))である。K(1)およびK(2)は、それぞれ、スペクトル測定後に微分処理された、波長1562.5nmおよび1224.5nmにおける吸光度を示している。
推定式(III):
Y=7819.17K(2)+38764.38K(1)+24.43
推定式(III)では、決定係数(R2)が0.99であり、標準誤差が1.32であった。
推定式(III):
Y=7819.17K(2)+38764.38K(1)+24.43
推定式(III)では、決定係数(R2)が0.99であり、標準誤差が1.32であった。
本実施例における検量線作成用試料について、従来の測定法により得られたメンソール含量(化学分析値)と、推定式(III)を用いて近赤外分光法により得られたメンソール推定値(NIR測定値)との関係を図3に示す(図3中、「CAL」)。
次に、メンソール含量が未知である試料について、近赤外分光法によりスペクトル測定を行い、上記検量線を用いてメンソール含量を推定した。まず、検量線作成用試料と同様にして、メンソール含量が未知である測定用試料を準備した。拡散反射スペクトルを測定し、スペクトル測定後に微分処理した波長1562.5nmおよび1224.5nmにおける吸光度および推定式(III)を用いて、12サンプルについてメンソール含量推定値を算出した。
各測定用試料について近赤外分光法によりメンソール含量を推定した後、従来の測定法により同一試料のメンソール含量を測定し、近赤外分光法により得られたメンソール含量推定値と、従来の測定法により得られたメンソール含量との相関関係を調べた。結果を図3に示す(図3中、「Vali」)。
図3に示すとおり、従来の測定方法により得られたメンソール含量と、近赤外分光法により得られたメンソール含量の推定値との間には高い相関が見られた。以上から、2つの波長を用いた近赤外分光法により、短時間のうちに試料中のメンソール含量をより精度よく測定することができる。
〔実施例4〕
実施例2と同様にして、検量線作成用試料を準備し、拡散反射スペクトルを測定した。
〔実施例4〕
実施例2と同様にして、検量線作成用試料を準備し、拡散反射スペクトルを測定した。
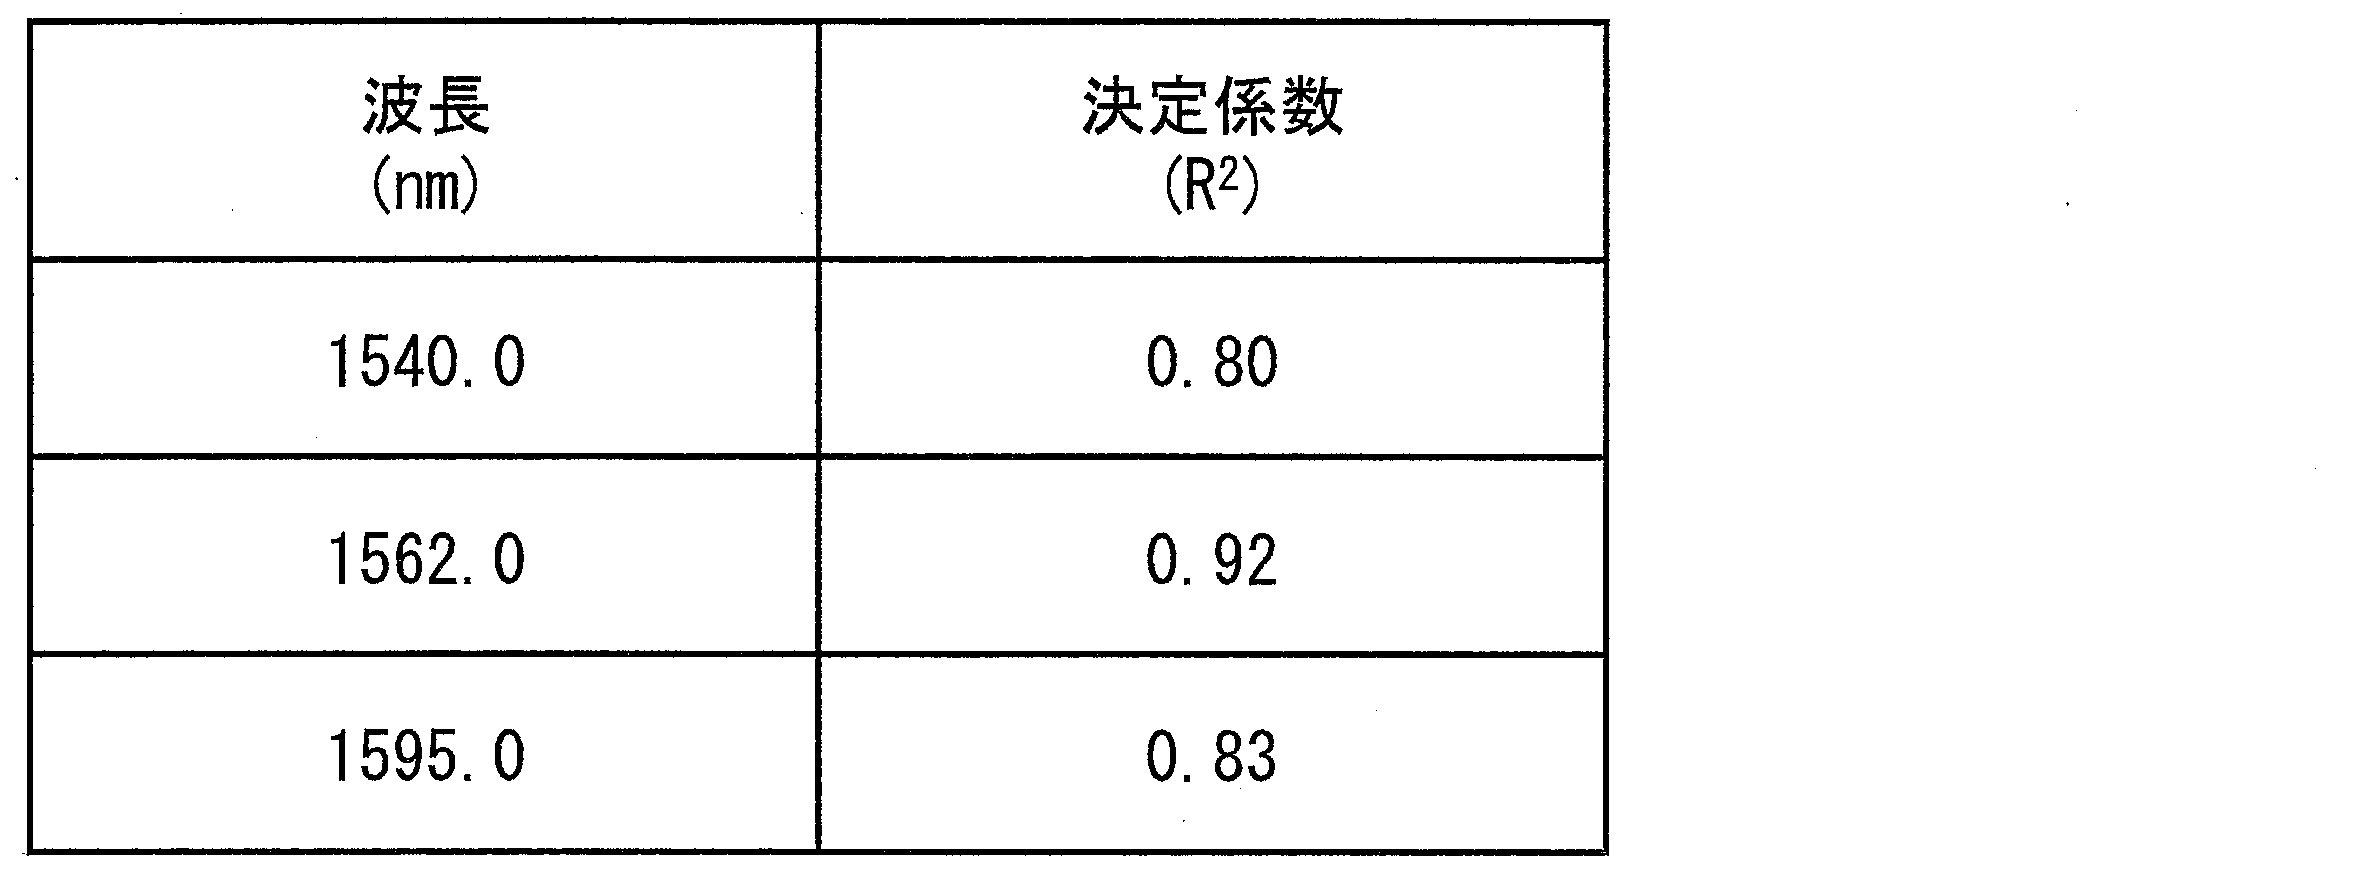
検量線作成用試料32サンプルについて拡散反射スペクトルを測定した後、波長1562.5nm以外の波長に関し、実施例1と同様にして検量線を作成し、その決定係数について調べた。その結果、表1に示すように、波長1540.0nm、1562.0nmまたは1595.0nmの波長を用いて測定を行なった場合にも、従来の測定方法から得られる結果と高い相関関係でもって、メンソール含量を測定できることが示された。
本実施例では、上述の実施例と異なり、メンソールを含む溶液を多糖類材料の成形物に噴霧した試料を測定対象とした。具体的には、パルプから作られるセルロースの紙の一方の面にアルミ箔が貼り合わされており、他方の面にはメンソールを含む溶液が吹き付けられている試料を測定対象とした。また吹き付けるメンソールの量を変え、メンソール添加量が異なる試料を準備した。
検量線作成用試料について、1100~2500nmの近赤外波長領域に関し、0.5nm間隔で拡散反射スペクトルを測定した。具体的には、検量線作成用試料を、測定用のボート(内径W15cm×D5cm×H4cm、底面:石英ガラス製)に入る大きさ(14cm×4cm)の断片に切り出し、当該ボートにセルロース面(アルミ箔が貼り合わされていない方の面)を下にして1枚入れ、近赤外線分光測定装置(FOSS NIRSystems社製、型式:XM-1100)を用いて、石英ガラス張りの底面から近赤外線を照射し、実施例1~4と同様にして拡散反射スペクトルを測定した。
検量線作成用試料27サンプルについて拡散反射スペクトルを測定した後、実施例1と同様にして検量線を作成した。
その結果、以下の推定式(IV)を得ることができた。推定式(IV)によって得られるYがメンソール含量の推定値(単位:mg/100cm2)である。K(1)は、スペクトル測定後に微分処理された、波長1693.0nmにおける吸光度を示している。
推定式(IV):
Y=-12408.95K(1)-2.1815
推定式(IV)は、決定係数(R2)が0.98であり、標準誤差が2.11であった。
推定式(IV):
Y=-12408.95K(1)-2.1815
推定式(IV)は、決定係数(R2)が0.98であり、標準誤差が2.11であった。
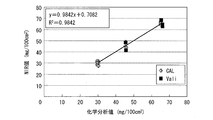
本実施例における検量線作成用試料について、従来の測定法により得られたメンソール含量(化学分析値)と、推定式(IV)を用いて近赤外分光法により得られたメンソール推定値(NIR測定値)との関係を図4に示す(図4中、「CAL」)。
次に、メンソール含量が未知である試料について、近赤外分光法によりスペクトル測定を行い、上記検量線を用いてメンソール含量を推定した。まず、検量線作成用試料と同様にして、メンソール含量が未知である測定用試料を準備した。拡散反射スペクトルを測定し、スペクトル測定後に微分処理した波長1693.0nmにおける吸光度および推定式(IV)を用いて、27サンプルについてメンソール含量推定値を算出した。
各測定用試料について近赤外分光法によりメンソール含量を推定した後、従来の測定法により同一試料のメンソール含量を測定し、近赤外分光法により得られたメンソール含量推定値と、従来の測定法により得られたメンソール含量との相関関係を調べた。結果を図4に示す(図4中、「Vali」)。
図4に示すとおり、従来の測定方法により得られたメンソール含量と、近赤外分光法により得られたメンソール含量の推定値との間には高い相関が見られた。以上から、近赤外分光法により、かつ単一波長のスペクトル測定により、短時間のうちに試料中のメンソール含量をより精度よく測定することができる。
本発明は、たばこ製品の原料、包装材料等の製造に利用することができる。
Claims (11)
- メンソールが多糖類材料に被覆されてなる試料に近赤外線を照射し、透過吸収スペクトルまたは拡散反射スペクトルを測定する測定工程、および、
測定された上記透過吸収スペクトルまたは上記拡散反射スペクトルを用いて、予め作成された検量線からメンソール含量推定値を算出する算出工程、
を含むことを特徴とする試料中のメンソール含量測定方法。 - 上記試料は、シート状の試料であることを特徴とする請求項1に記載のメンソール含量測定方法。
- 上記多糖類材料における多糖類は、カラギーナン、寒天、ゲランガム、タマリンドガム、サイリウムシードガムもしくはコンニャクグルコマンナンの単成分系、またはカラギーナン、ローカストビーンガム、グアーガム、寒天、キサンタンガム、ゲランガム、タマリンドガム、タラガム、コンニャクグルコマンナン、デンプン、カシアガムおよびサイリウムシードガムからなる群より選択される2以上の成分を組み合わせた複合系であることを特徴とする請求項1または2に記載のメンソール含量測定方法。
- 上記測定工程では、単一波長の透過吸収スペクトルまたは拡散反射スペクトルを測定することを特徴とする請求項1~3の何れか1項に記載のメンソール含量測定方法。
- 上記測定工程では、2つの波長の透過吸収スペクトルまたは拡散反射スペクトルを測定することを特徴とする請求項1~4の何れか1項に記載のメンソール含量測定方法。
- 上記測定工程では、1540.0nm、1562.0nm、1562.5nmおよび1595.0nmからなる群より選択される波長の透過吸収スペクトルまたは拡散反射スペクトルを少なくとも測定することを特徴とする請求項1~5の何れか1項に記載のメンソール含量測定方法。
- 上記試料は、メンソールが多糖類のガムで被覆されてなるものであり、
上記測定工程では、1540.0nm、1562.0nm、1562.5nmおよび1595.0nmからなる群より選択される波長の透過吸収スペクトルまたは拡散反射スペクトルを少なくとも測定することを特徴とする請求項1~6の何れか1項に記載のメンソール含量測定方法。 - 上記測定工程では、1562.5nmの波長の透過吸収スペクトルまたは拡散反射スペクトルを少なくとも測定することを特徴とする請求項7に記載のメンソール含量測定方法。
- 上記試料は、たばこ製品の原料であることを特徴とする請求項1~8の何れか1項に記載のメンソール含量測定方法。
- メンソール含量が既知である複数の上記試料の透過吸収スペクトルまたは拡散反射スペクトルを用いて、多変量解析によって上記検量線を作成する工程をさらに含むことを特徴とする請求項1~9の何れか1項に記載のメンソール含量測定方法。
- 上記多変量解析は、重回帰分析またはPLS回帰分析であることを特徴とする請求項10に記載のメンソール含量測定方法。
Applications Claiming Priority (2)
| Application Number | Priority Date | Filing Date | Title |
|---|---|---|---|
| JPPCT/JP2012/057699 | 2012-03-26 | ||
| JP2012057699 | 2012-03-26 |
Publications (1)
| Publication Number | Publication Date |
|---|---|
| WO2013145437A1 true WO2013145437A1 (ja) | 2013-10-03 |
Family
ID=49258770
Family Applications (1)
| Application Number | Title | Priority Date | Filing Date |
|---|---|---|---|
| PCT/JP2012/080460 Ceased WO2013145437A1 (ja) | 2012-03-26 | 2012-11-26 | メンソール含量測定方法 |
Country Status (1)
| Country | Link |
|---|---|
| WO (1) | WO2013145437A1 (ja) |
Cited By (5)
| Publication number | Priority date | Publication date | Assignee | Title |
|---|---|---|---|---|
| CN103604686A (zh) * | 2013-12-03 | 2014-02-26 | 岛津企业管理(中国)有限公司 | 一种快速测定稻米中镉元素含量的前处理及定量分析方法 |
| CN104713846A (zh) * | 2015-02-03 | 2015-06-17 | 贵州省烟草科学研究院 | 一种利用近红外光谱快速检测烟草淀粉含量的建模方法 |
| CN105352913A (zh) * | 2015-11-25 | 2016-02-24 | 浙江百山祖生物科技有限公司 | 一种近红外光谱检测灵芝提取物多糖含量的方法 |
| CN109307740A (zh) * | 2018-09-20 | 2019-02-05 | 云南中烟工业有限责任公司 | 一种快速估算烟支中烟丝的梗丝实掺比例的方法 |
| JP2022155551A (ja) * | 2021-03-30 | 2022-10-13 | 日清食品ホールディングス株式会社 | サイリウム種皮と糖との結着率を測定するための測定方法 |
Citations (6)
| Publication number | Priority date | Publication date | Assignee | Title |
|---|---|---|---|---|
| JPH03289539A (ja) * | 1990-04-05 | 1991-12-19 | Japan Tobacco Inc | ニコチンセンサ |
| JP2001272338A (ja) * | 2000-03-24 | 2001-10-05 | Snow Brand Milk Prod Co Ltd | 非破壊的熟度測定法 |
| JP2005257676A (ja) * | 2004-02-09 | 2005-09-22 | National Agriculture & Bio-Oriented Research Organization | 茶葉中に含まれる化学成分の定量方法 |
| JP2006238849A (ja) * | 2005-03-07 | 2006-09-14 | Iseki & Co Ltd | 果実の内成分情報の予測方法及び予測装置 |
| JP2009247473A (ja) * | 2008-04-03 | 2009-10-29 | Hochiki Corp | エチルアルコール検知装置 |
| JP2011518544A (ja) * | 2008-02-01 | 2011-06-30 | アール・ジエイ・レイノルズ・タバコ・カンパニー | 喫煙品に付随するフィルタ要素を分析するシステム、および関連方法 |
-
2012
- 2012-11-26 WO PCT/JP2012/080460 patent/WO2013145437A1/ja not_active Ceased
Patent Citations (6)
| Publication number | Priority date | Publication date | Assignee | Title |
|---|---|---|---|---|
| JPH03289539A (ja) * | 1990-04-05 | 1991-12-19 | Japan Tobacco Inc | ニコチンセンサ |
| JP2001272338A (ja) * | 2000-03-24 | 2001-10-05 | Snow Brand Milk Prod Co Ltd | 非破壊的熟度測定法 |
| JP2005257676A (ja) * | 2004-02-09 | 2005-09-22 | National Agriculture & Bio-Oriented Research Organization | 茶葉中に含まれる化学成分の定量方法 |
| JP2006238849A (ja) * | 2005-03-07 | 2006-09-14 | Iseki & Co Ltd | 果実の内成分情報の予測方法及び予測装置 |
| JP2011518544A (ja) * | 2008-02-01 | 2011-06-30 | アール・ジエイ・レイノルズ・タバコ・カンパニー | 喫煙品に付随するフィルタ要素を分析するシステム、および関連方法 |
| JP2009247473A (ja) * | 2008-04-03 | 2009-10-29 | Hochiki Corp | エチルアルコール検知装置 |
Cited By (7)
| Publication number | Priority date | Publication date | Assignee | Title |
|---|---|---|---|---|
| CN103604686A (zh) * | 2013-12-03 | 2014-02-26 | 岛津企业管理(中国)有限公司 | 一种快速测定稻米中镉元素含量的前处理及定量分析方法 |
| CN104713846A (zh) * | 2015-02-03 | 2015-06-17 | 贵州省烟草科学研究院 | 一种利用近红外光谱快速检测烟草淀粉含量的建模方法 |
| CN105352913A (zh) * | 2015-11-25 | 2016-02-24 | 浙江百山祖生物科技有限公司 | 一种近红外光谱检测灵芝提取物多糖含量的方法 |
| CN105352913B (zh) * | 2015-11-25 | 2018-06-12 | 浙江百山祖生物科技有限公司 | 一种近红外光谱检测灵芝提取物多糖含量的方法 |
| CN109307740A (zh) * | 2018-09-20 | 2019-02-05 | 云南中烟工业有限责任公司 | 一种快速估算烟支中烟丝的梗丝实掺比例的方法 |
| JP2022155551A (ja) * | 2021-03-30 | 2022-10-13 | 日清食品ホールディングス株式会社 | サイリウム種皮と糖との結着率を測定するための測定方法 |
| JP7773420B2 (ja) | 2021-03-30 | 2025-11-19 | 日清食品ホールディングス株式会社 | サイリウム種皮と糖との結着率を測定するための測定方法 |
Similar Documents
| Publication | Publication Date | Title |
|---|---|---|
| JP5822985B2 (ja) | 膨こう性測定方法 | |
| WO2012127617A1 (ja) | 見掛密度測定方法 | |
| Wang et al. | Measurement of the light absorption and scattering properties of onion skin and flesh at 633 nm | |
| Munawar et al. | Near infrared spectroscopic data for rapid and simultaneous prediction of quality attributes in intact mango fruits | |
| CN105092513B (zh) | 一种测定混合药物中的药物成分的含量的方法 | |
| CN103411906B (zh) | 珍珠粉和贝壳粉的近红外光谱定性鉴别方法 | |
| Cayuela et al. | Prediction of quality of intact olives by near infrared spectroscopy | |
| CN106442397B (zh) | 一种基于光谱比例扣除的稻谷近红外光谱模型优化方法 | |
| Sawale et al. | Development and validation of UV spectrophotometric method for simultaneous estimation of Olmesartan Medoxomil and Chlorthalidone in bulk and tablet | |
| Masithoh et al. | Determination of soluble solids content and titratable acidity of intact fruit and juice of satsuma mandarin using a hand-held near infrared instrument in transmittance mode | |
| CN103048278A (zh) | 机炒龙井茶叶水分含量在线检测方法 | |
| JP2019101040A (ja) | 硝酸イオン濃度非破壊計測方法、硝酸イオン濃度非破壊計測装置、及び硝酸イオン濃度非破壊計測プログラム | |
| CN103063648A (zh) | 利用拉曼光谱检测液体制剂的方法 | |
| CN102680427A (zh) | 一种应用近红外光谱分析技术鉴别卷烟表香质量的方法 | |
| CN110231305A (zh) | 一种测定奇亚籽中dpph自由基清除能力的方法 | |
| Yahaya et al. | Visible spectroscopy calibration transfer model in determining pH of Sala mangoes | |
| Phetpan et al. | Evaluation of the moisture content of tapioca starch using near-infrared spectroscopy | |
| Bonnier et al. | Quantification of low-content encapsulated active cosmetic ingredients in complex semi-solid formulations by means of attenuated total reflectance-infrared spectroscopy: Bonnier F. et al. | |
| CN113310926A (zh) | 基于近红外光谱技术检测心可舒片有效成分含量的方法 | |
| Khuriyati et al. | Non-destructive measurement of antioxidant activity and water content in chili powder (Capsicum annuum L.) using near-infrared spectroscopy. | |
| Zhao et al. | Non-destructive determination of metronidazole powder by using artificial neural networks on short-wavelength NIR spectroscopy | |
| Dong et al. | Nondestructive Method for Analysis of the Soybean Quality. | |
| CN105466878B (zh) | 一种利用红外光谱测定番茄酱中番茄红素的方法 | |
| EP4413351A1 (en) | Quantification method | |
| CN104237140B (zh) | 一种植物叶片反射光谱的背景扣除方法 |
Legal Events
| Date | Code | Title | Description |
|---|---|---|---|
| 121 | Ep: the epo has been informed by wipo that ep was designated in this application |
Ref document number: 12872905 Country of ref document: EP Kind code of ref document: A1 |
|
| NENP | Non-entry into the national phase |
Ref country code: DE |
|
| 122 | Ep: pct application non-entry in european phase |
Ref document number: 12872905 Country of ref document: EP Kind code of ref document: A1 |
|
| NENP | Non-entry into the national phase |
Ref country code: JP |