WO2010146758A1 - 蛍光分析方法 - Google Patents
蛍光分析方法 Download PDFInfo
- Publication number
- WO2010146758A1 WO2010146758A1 PCT/JP2010/002678 JP2010002678W WO2010146758A1 WO 2010146758 A1 WO2010146758 A1 WO 2010146758A1 JP 2010002678 W JP2010002678 W JP 2010002678W WO 2010146758 A1 WO2010146758 A1 WO 2010146758A1
- Authority
- WO
- WIPO (PCT)
- Prior art keywords
- dispersion
- pixels
- base
- analysis method
- fluorescence
- Prior art date
- Legal status (The legal status is an assumption and is not a legal conclusion. Google has not performed a legal analysis and makes no representation as to the accuracy of the status listed.)
- Ceased
Links
Images
















Classifications
-
- G—PHYSICS
- G01—MEASURING; TESTING
- G01N—INVESTIGATING OR ANALYSING MATERIALS BY DETERMINING THEIR CHEMICAL OR PHYSICAL PROPERTIES
- G01N21/00—Investigating or analysing materials by the use of optical means, i.e. using sub-millimetre waves, infrared, visible or ultraviolet light
- G01N21/62—Systems in which the material investigated is excited whereby it emits light or causes a change in wavelength of the incident light
- G01N21/63—Systems in which the material investigated is excited whereby it emits light or causes a change in wavelength of the incident light optically excited
- G01N21/64—Fluorescence; Phosphorescence
- G01N21/645—Specially adapted constructive features of fluorimeters
- G01N21/648—Specially adapted constructive features of fluorimeters using evanescent coupling or surface plasmon coupling for the excitation of fluorescence
-
- G—PHYSICS
- G01—MEASURING; TESTING
- G01N—INVESTIGATING OR ANALYSING MATERIALS BY DETERMINING THEIR CHEMICAL OR PHYSICAL PROPERTIES
- G01N21/00—Investigating or analysing materials by the use of optical means, i.e. using sub-millimetre waves, infrared, visible or ultraviolet light
- G01N21/62—Systems in which the material investigated is excited whereby it emits light or causes a change in wavelength of the incident light
- G01N21/63—Systems in which the material investigated is excited whereby it emits light or causes a change in wavelength of the incident light optically excited
- G01N21/64—Fluorescence; Phosphorescence
- G01N21/645—Specially adapted constructive features of fluorimeters
- G01N21/6452—Individual samples arranged in a regular 2D-array, e.g. multiwell plates
-
- G—PHYSICS
- G01—MEASURING; TESTING
- G01N—INVESTIGATING OR ANALYSING MATERIALS BY DETERMINING THEIR CHEMICAL OR PHYSICAL PROPERTIES
- G01N21/00—Investigating or analysing materials by the use of optical means, i.e. using sub-millimetre waves, infrared, visible or ultraviolet light
- G01N21/62—Systems in which the material investigated is excited whereby it emits light or causes a change in wavelength of the incident light
- G01N21/63—Systems in which the material investigated is excited whereby it emits light or causes a change in wavelength of the incident light optically excited
- G01N21/64—Fluorescence; Phosphorescence
- G01N21/645—Specially adapted constructive features of fluorimeters
- G01N21/6456—Spatial resolved fluorescence measurements; Imaging
- G01N21/6458—Fluorescence microscopy
-
- G—PHYSICS
- G01—MEASURING; TESTING
- G01N—INVESTIGATING OR ANALYSING MATERIALS BY DETERMINING THEIR CHEMICAL OR PHYSICAL PROPERTIES
- G01N33/00—Investigating or analysing materials by specific methods not covered by groups G01N1/00 - G01N31/00
- G01N33/48—Biological material, e.g. blood, urine; Haemocytometers
- G01N33/50—Chemical analysis of biological material, e.g. blood, urine; Testing involving biospecific ligand binding methods; Immunological testing
- G01N33/53—Immunoassay; Biospecific binding assay; Materials therefor
- G01N33/543—Immunoassay; Biospecific binding assay; Materials therefor with an insoluble carrier for immobilising immunochemicals
- G01N33/54366—Apparatus specially adapted for solid-phase testing
-
- G—PHYSICS
- G01—MEASURING; TESTING
- G01N—INVESTIGATING OR ANALYSING MATERIALS BY DETERMINING THEIR CHEMICAL OR PHYSICAL PROPERTIES
- G01N33/00—Investigating or analysing materials by specific methods not covered by groups G01N1/00 - G01N31/00
- G01N33/48—Biological material, e.g. blood, urine; Haemocytometers
- G01N33/50—Chemical analysis of biological material, e.g. blood, urine; Testing involving biospecific ligand binding methods; Immunological testing
- G01N33/53—Immunoassay; Biospecific binding assay; Materials therefor
- G01N33/543—Immunoassay; Biospecific binding assay; Materials therefor with an insoluble carrier for immobilising immunochemicals
- G01N33/54393—Improving reaction conditions or stability, e.g. by coating or irradiation of surface, by reduction of non-specific binding, by promotion of specific binding
-
- G—PHYSICS
- G01—MEASURING; TESTING
- G01N—INVESTIGATING OR ANALYSING MATERIALS BY DETERMINING THEIR CHEMICAL OR PHYSICAL PROPERTIES
- G01N21/00—Investigating or analysing materials by the use of optical means, i.e. using sub-millimetre waves, infrared, visible or ultraviolet light
- G01N21/62—Systems in which the material investigated is excited whereby it emits light or causes a change in wavelength of the incident light
- G01N21/63—Systems in which the material investigated is excited whereby it emits light or causes a change in wavelength of the incident light optically excited
- G01N21/64—Fluorescence; Phosphorescence
- G01N2021/6417—Spectrofluorimetric devices
- G01N2021/6419—Excitation at two or more wavelengths
-
- G—PHYSICS
- G01—MEASURING; TESTING
- G01N—INVESTIGATING OR ANALYSING MATERIALS BY DETERMINING THEIR CHEMICAL OR PHYSICAL PROPERTIES
- G01N21/00—Investigating or analysing materials by the use of optical means, i.e. using sub-millimetre waves, infrared, visible or ultraviolet light
- G01N21/62—Systems in which the material investigated is excited whereby it emits light or causes a change in wavelength of the incident light
- G01N21/63—Systems in which the material investigated is excited whereby it emits light or causes a change in wavelength of the incident light optically excited
- G01N21/64—Fluorescence; Phosphorescence
- G01N2021/6417—Spectrofluorimetric devices
- G01N2021/6421—Measuring at two or more wavelengths
-
- G—PHYSICS
- G01—MEASURING; TESTING
- G01N—INVESTIGATING OR ANALYSING MATERIALS BY DETERMINING THEIR CHEMICAL OR PHYSICAL PROPERTIES
- G01N21/00—Investigating or analysing materials by the use of optical means, i.e. using sub-millimetre waves, infrared, visible or ultraviolet light
- G01N21/62—Systems in which the material investigated is excited whereby it emits light or causes a change in wavelength of the incident light
- G01N21/63—Systems in which the material investigated is excited whereby it emits light or causes a change in wavelength of the incident light optically excited
- G01N21/64—Fluorescence; Phosphorescence
- G01N21/6428—Measuring fluorescence of fluorescent products of reactions or of fluorochrome labelled reactive substances, e.g. measuring quenching effects, using measuring "optrodes"
- G01N2021/6439—Measuring fluorescence of fluorescent products of reactions or of fluorochrome labelled reactive substances, e.g. measuring quenching effects, using measuring "optrodes" with indicators, stains, dyes, tags, labels, marks
- G01N2021/6441—Measuring fluorescence of fluorescent products of reactions or of fluorochrome labelled reactive substances, e.g. measuring quenching effects, using measuring "optrodes" with indicators, stains, dyes, tags, labels, marks with two or more labels
Definitions
- the present invention relates to an optical analyzer, and for example, relates to an optical measurement / analyzer that performs optical analysis by irradiating a biological material such as DNA, RNA, or protein with light.
- Patent Document 1 discloses that an evanescent wave is generated on a substrate surface by irradiating a transparent substrate with excitation light output from an excitation light source and totally reflecting the excitation light inside the substrate.
- An apparatus for detecting evanescent wave scattered light is described.
- the apparatus described in Patent Document 1 does not split scattered light.
- Patent Document 2 describes an apparatus that separates fluorescence and scattered light from a sample component excited by an evanescent wave.
- the sample component is not fixed to the flow path boundary surface.
- Patent Document 1 there is an apparatus that fixes a plurality of biomolecules on the substrate surface, generates an evanescent wave in a certain range of the substrate surface, and images the emission of the biomolecule excited by the evanescent wave, as in Patent Document 1.
- a non-fluorescent biomolecule is immobilized on a substrate, a reaction solution containing the fluorescent molecule is allowed to flow onto the substrate, and fluorescence from the biomolecule fixing position is observed. Thereby, the binding reaction between the biomolecule and the molecule in the reaction solution can be observed.
- unmodified single-stranded DNA is immobilized on a substrate, a reaction solution containing a fluorescent modified base modified with a different fluorophore for each base species is introduced, and a complementary base is bound to the single-stranded DNA. If the fluorescence from the position where the molecule is fixed is dispersed, the sequence of the fixed DNA can be decoded.
- Non-Patent Document 2 it has been proposed to fix DNA or the like on a substrate and determine its base sequence.
- a sample DNA fragment to be analyzed at random is captured on the substrate surface one molecule at a time, extended by approximately one base, and the result is detected by fluorescence measurement to determine the base sequence.
- four types of dNTP derivatives (MdNTPs) having a label that can be incorporated into a template DNA as a substrate for DNA polymerase and can stop the DNA chain elongation reaction due to the presence of a protecting group and can be detected are used.
- the step of performing a DNA polymerase reaction, the step of detecting the incorporated MdNTP by fluorescence or the like, and the step of returning the MdNTP to a state where it can be extended are made into one cycle, and the base sequence of the sample DNA is determined by repeating this cycle. .
- the base sequence of the sample DNA is determined by repeating this cycle.
- Non-Patent Document 3 and Patent Document 3 the sensitivity of fluorescence detection is further improved by the nano-aperture evanescent irradiation detection method that can further reduce the excitation light irradiation volume than the total reflection evanescent irradiation detection method.
- Two glass substrates, a glass substrate A and a glass substrate B, are arranged in parallel, and a planar aluminum with a film thickness of about 100 nm having a nano-opening with a diameter of 50 nm on the surface of the glass substrate A facing the glass substrate B.
- Laminate thin films The aluminum thin film needs to have a light shielding performance.
- a reaction vessel is formed between two glass substrates, and a solution layer is formed between the two glass substrates by filling the reaction vessel with a solution.
- the reaction tank has an inlet and an outlet for the solution. By injecting the solution from the inlet and discharging the solution from the outlet, the solution can flow in a direction parallel to the glass substrate and the aluminum thin film. Thereby, it is possible to exchange the solution of a solution layer into arbitrary compositions.
- excitation light with a wavelength of 488 nm oscillated from an Ar ion laser is squeezed with an objective lens perpendicularly to the glass substrate A from the opposite direction to the glass substrate B, it is excited to the solution layer near the bottom plane inside the nano aperture.
- a light evanescent field is formed, and excitation light does not propagate further into the solution layer.
- the fluorescence emission is detected by forming an image on a two-dimensional CCD using the objective lens.
- the excitation light intensity is exponentially attenuated as the distance from the nano-aperture bottom plane increases, and the excitation light intensity becomes 1/10 at a distance of about 30 nm from the nano-aperture bottom plane.
- the excitation light irradiation width in the direction parallel to the glass substrate is limited to the opening diameter, that is, 50 nm, so that the excitation light irradiation volume is further reduced. For this reason, it becomes possible to drastically reduce background light including fluorescence emission of free phosphors and Raman scattering of water. As a result, it becomes possible to selectively detect only the fluorescent substance labeled with the target biomolecule in the presence of a higher concentration of free fluorescent substance, and it is possible to realize extremely sensitive fluorescence detection.
- the above fluorescence detection method is applied to the measurement of dNTP uptake by the elongation reaction of DNA molecules.
- the plane where the evanescent field is started such as the sample component fixed surface, is referred to as the evanescent field boundary plane.
- an apparatus for analyzing biomolecules by imaging fluorescence of biomolecules immobilized on the surface of the substrate different types of biomolecules are generally immobilized for each fixed region (spot) on the substrate, Fluorescence from each spot is detected separately by imaging.
- spot In order to analyze many types of biomolecules in the shortest possible time and reduce the amount of reagent consumed, the spots are immobilized on the substrate as densely as possible within the optically decomposable range. It is preferable to do this. In order to reduce the reagent consumption per spot, the smaller the number of biomolecules immobilized in one spot, the more convenient, and one molecule is ideal.
- the fluorescence detection method has a sensitivity of detecting even one molecule, but in order to obtain a good S / N by spectroscopic detection of fluorescence from a small number of molecules, Spectral imaging methods with low loss are preferred. Accordingly, a dispersion spectral imaging method using a dispersion element such as a prism or a diffraction grating, or a method of obtaining images with a plurality of image sensors by performing spectroscopy with a dichroic mirror (dichroic / multisensor spectral imaging method) is preferable.
- the plurality of spots are preferably arranged as densely as possible on the substrate within the optically resolvable range.
- the number of image sensors is the same as the number of fluorescent labels to be used. Since this is necessary, there is a problem that the cost of the detection device increases.
- the fluorescent image is divided by a dichroic mirror or the like, the S / N is not always large.
- Dispersive spectroscopic imaging has the advantage that detection can be performed with a minimum (for example, one) image sensor.
- fluorescent images obtained by wavelength-dispersing fluorescence emitted from the spots approach each other. It overlaps with the fluorescent image of another spot.
- An object of the present invention relates to a method for efficiently detecting an image with a small number of pixels.
- the present invention relates to providing a method for efficiently detecting a fluorescent image from a molecule of a DNA fragment captured on a substrate with a two-dimensional sensor with a small number of pixels.
- the present invention also relates to providing a detection method that is inexpensive or has good operability when, for example, a fluorescence image from a DNA fragment molecule immobilized on a substrate and captured is detected with a two-dimensional sensor.
- the present invention relates to precisely arranging a plurality of measurement objects and forming images of the respective measurement objects on specific pixels of a detector having a plurality of detection pixels.
- the substrate on which the oligonucleotide is fixed is irradiated with excitation light for fluorescence measurement, the resulting fluorescence is collected, the collected light is dispersed, the light is imaged on the sensor, and the fluorescence is detected by a two-dimensional sensor.
- the substrate is provided with a plurality of regions to which oligonucleotides and the like are fixed, and these are disposed on the substrate, perform wavelength dispersion, and perform wavelength dispersion under a wavelength dispersion condition different from the wavelength dispersion. And calculating the intensity for each wavelength and the position of the spectral object.
- the number of pixels of a two-dimensional sensor required for a region to which an oligonucleotide to be measured is to be fixed is as low as several hundred times to 10 times or less without impairing measurement accuracy. Can be detected efficiently. Therefore, when the same two-dimensional sensor is used, fluorescent images from more regions can be obtained at one time, and high throughput can be achieved. In addition, when a camera with a small number of pixels is used, measurement can be performed at a lower cost.
- the optical resolution can be set to the interval between the regions where the oligonucleotide is fixed, it is not necessary to use a condensing lens having a large numerical aperture, an inexpensive lens can be used, and an immersion lens is also used. Since it is not necessary to use, operability can be improved.
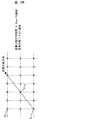
- FIG. Structure diagram of substrate, prism, and flow path.
- substrate Explanatory drawing of the system which carries out wavelength dispersion
- Explanatory drawing of the fluorescence spectrum of a lattice point (without phosphor).
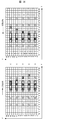
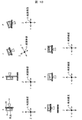
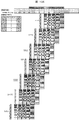
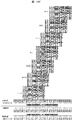
- Base identification at 3 ⁇ 3 pixels / grid point [grid point (10, b) is adenine].
- Base identification at 3 ⁇ 3 pixels / grid point [grid point (10, b) is adenine].
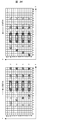
- Base identification at 3 ⁇ 3 pixels / grid point [grid point (10, b) is guanine].
- Base identification at 3 ⁇ 3 pixels / grid point [grid point (10, b) is cytosine].
- Base identification at 3 ⁇ 3 pixels / grid point [grid point (10, b) is thymine].
- Base identification at 3 ⁇ 3 pixels / grid point [grid point (10, b) is thymine].
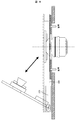
- FIG. 3 is a structural diagram of a joint portion between a substrate and a prism for evanescent illumination.
- FIG. 3 is a structural diagram of a joint portion between a substrate and a prism for evanescent illumination.
- FIG. 3 is a structural diagram of a joint portion between a substrate and a prism for evanescent illumination.
- FIG. 10 is a structural diagram of a substrate according to a fifth embodiment of the present invention. Flow cell vertical layout diagram.
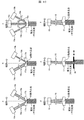
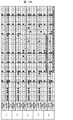
- Base identification at 1 ⁇ 1 pixel / grid point [lattice point (6, 5) is adenine, lattice point (6, 4) is guanine, lattice point (6, 3) is cytosine, lattice point (6, 2) is thymine ].
- Base sequence candidate identification at 1 ⁇ 1 pixel / grid point (right side dispersion).
- Base sequence candidate identification at 1 ⁇ 1 pixel / grid point (left side dispersion).
- Base sequence candidate identification at 1 ⁇ 1 pixel / grid point (right side dispersion and left side dispersion).
- Base sequence identification by comparison of fluorescence intensity of reference sequence and base sequence candidate at 1 ⁇ 1 pixel / grid point. Fluorescence intensity when the intensity of right side dispersion and left side dispersion (dispersion rate) at 1 ⁇ 1 pixel / grid point is changed.
- the step of detecting the incorporated dNTP derivative by fluorescence or the like, and the step of returning the dNTP derivative to an extendable state are defined as one cycle, and the base sequence of the sample DNA is determined by repeating this cycle.
- this operation is based on the single molecule fluorescence detection method, it is desirable to perform the measurement in a clean room-like environment via a HEPA filter.
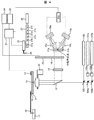
- FIG. 1 is a block diagram of a DNA testing apparatus using the fluorescence analysis method of the present invention.
- the apparatus has an apparatus configuration similar to a microscope, and the elongation state of DNA molecules captured on the substrate 8 is measured by fluorescence detection.
- the substrate 8 has a structure as shown in FIG. At least a part of the substrate 8 is made of a transparent material, and synthetic quartz or the like can be used as the material.
- the substrate 8 has a reaction region 8a, which is made of a transparent material, and a reagent or the like contacts this portion. A plurality of regions 8ij to which DNA is immobilized are formed in the reaction region 8a.
- the region 8ij where the DNA is fixed is arranged in an array in the reaction region 8a.
- Each size of the region 8ij is 1000 nm or less in diameter, and more preferably 100 nm or less.
- This region is subjected to a surface treatment for capturing DNA.
- a region other than the region 8ij and the region 8ij in the reaction region 8a can be formed on the region 8ij by using only a material that reacts with the surface treatment agent using a thin film formation or etching technique. Only surface treatment can be applied. The surface treatment is performed by, for example, binding streptavidin and reacting with a biotin-labeled DNA fragment.
- a poly-T oligonucleotide can be immobilized, one end of the DNA fragment can be poly-A-treated, and captured by a hybrid reaction.
- the DNA fragment concentration is high, a plurality of molecules of DNA enter the individual regions 8ij, but by appropriately adjusting the DNA fragment concentration, only a single molecule of DNA enters the individual regions 8ij. can do.
- the region 8ij can be made smaller so that one molecule can be captured in the region.
- the beads can be arranged in the region 8ij on the array by fixing biotinylated DNA to streptavidinated beads and dispersing the beads in the reaction region 8a.
- beads having a large number of duplicated templates having the same DNA sequence are dispersed in the reaction region 8a, so that the beads can be placed in the region 8ij on the array. Can be arranged.
- the region 8ij where the DNA is immobilized is randomly aligned in the reaction region 8a.
- This is a case where the same surface treatment such as streptavidin is applied to the region 8ij and a place other than the region 8ij in the reaction region 8a. Therefore, in this case, the region 8ij indicates a region where DNA is fixed.
- the DNA fixing density increases.
- the DNA fixing density decreases, and single molecule DNA can be obtained with sufficient optical resolution. It can be a fixed density that can be identified.
- the beads can be randomly arranged by fixing biotinylated DNA to streptavidinated beads and dispersing the beads in the reaction region 8a.
- the beads can be randomly arranged by using emulsion PCR to disperse beads in which many templates having the same DNA sequence are replicated in the reaction region 8a.
- the size of the beads is 2000 nm or less, more preferably 10 to 1000 nm.
- DNA when single molecule DNA is immobilized on all regions 8ij, DNA may be immobilized only on a part of the region 8ij.
- the region 8ij When only a part of the DNA is immobilized, it is not immobilized in the remaining region 8ij and is in an empty state.
- the interval dx between the regions 8ij was 1 micron, and the interval dy was 3 microns.
- the region 8ij thus forms a lattice structure (two-dimensional rectangular lattice structure), and the region 8ij is arranged at the position of the lattice point.
- Such a method of creating a substrate having a uniform interval is, for example, created by the method described in Japanese Patent Laid-Open No. 2002-214142. It should be noted that dx and dy are larger than the individual sizes of the region 8ij and are preferably about 4000 nm or less.
- the reaction area 8a of the substrate was a slide glass size of 76.2 mm ⁇ 25.4 mm.
- the size of the reaction region 8a can be larger, for example, a size of 0.5 mm ⁇ 0.5 mm can be arranged in a one-dimensional or two-dimensional manner at regular intervals. Good.
- a metal structure may be disposed in the region 8ij.
- the metal structure can also be created by a semiconductor process. Electron beam drawing, dry etching, wet etching, etc. can be used.
- the metal structure is made of gold, copper, aluminum, chrome, or the like and has a shape having a size equal to or smaller than the wavelength of the excitation light, and a rectangular parallelepiped, a cone, a cylinder, or a structure having a partially protruding shape is used.
- Various fluorescent substances can be used as a fluorescent label for dNTP.
- Bodipy-FL-510, R6G, ROX, Bodipy-650 four different dNTPs (3′-O3) labeled with four different phosphors and modified with an allyl group at the 3 ′ end are labeled.
- -Allyl-dGTP-PC-Bodipy-FL-510, 3'-O-allyl-dTTP-PC-R6G, 3'-O-allyl-dATP-PC-ROX, 3'-O-allyl-dCTP-PC- Bodipy-650) is used.
- the laser light from the laser device 101a for fluorescence excitation (Ar laser, 488 nm: Bodipy-FL-510, for R6G excitation) is circularly polarized through the ⁇ / 4 wavelength plate 102a.
- Laser light from the laser device 101b for excitation of fluorescence (He—Ne laser, 594.1 nm: for excitation of ROX, Bodipy-650) is converted into circularly polarized light through the ⁇ / 4 wavelength plate 102b.
- Both laser beams are overlapped by the mirror 104b and the dichroic mirror 104a (reflects 520 nm or less), and are incident on the quartz prism 7 for total reflection illumination through the mirror 5 perpendicularly to the incident surface as shown in the figure, and DNA molecules Irradiate from the back side of the captured substrate 8.
- the quartz prism 7 and the substrate 8 are brought into contact with each other via matching oil (non-fluorescent glycerin or the like), and the laser light is introduced into the substrate 8 without being reflected at the interface.
- the surface of the substrate 8 is covered with a reaction solution (water), and the laser beam is totally reflected at the interface to provide evanescent illumination. Thereby, fluorescence measurement is possible with high S / N.
- the temperature controller is arrange
- the temperature can be controlled by using a heater or a Peltier in which the region through which the excitation light passes is optically transparent between the prism 7 and the substrate 8. A hole may be formed in a region through which excitation light passes, and a structure filled with matching oil may be used.
- a structure in which halogen illumination is possible from the lower part of the prism is omitted, but this is omitted in the figure.
- a laser device 100 (YAG laser, 355 nm) is arranged so that the laser light of the laser devices 101a and 101b can be superimposed and coaxially irradiated by the dichroic mirror 103 (reflecting 400 nm or less). I made it.
- This laser is used for the step of returning the dNTP derivative to a state where it can be extended after fluorescence detection of the incorporated dNTP derivative.
- a flow chamber 9 for allowing a reagent or the like to flow and react is formed on the substrate 8.
- the chamber has a reagent introduction port 12, and a target reagent solution is injected by a dispensing unit 25 having a dispensing nozzle 26, a reagent storage unit 27, and a chip box 28.
- a sample liquid container 27a, a dNTP derivative solution container 27b, 27c, 27d, 27e (27c, d, e are preliminary), a cleaning liquid container 27f, and the like are prepared.
- the type and number of reagents can be increased.
- a dispensing tip in the tip box 28 is attached to the dispensing nozzle 26, an appropriate reagent solution is sucked, introduced into the reaction region of the substrate from the chamber inlet, and reacted.
- the waste liquid is discharged to the waste liquid container 11 through the waste liquid tube 10.
- the flow chamber is made of a transparent material in the direction of the optical axis, and fluorescence is detected.
- the fluorescent light 13 is collected by a condensing lens (objective lens) 14 controlled by an automatic focusing device 29, and a fluorescent light having a necessary wavelength is taken out by a filter unit 15 and light having an unnecessary wavelength is removed.
- Fluorescence having a required wavelength that has passed through the objective lens 14 becomes a parallel light beam and is split in two directions by the wavelength dispersion prisms 17a and 17b.
- four colors can be detected simultaneously by performing spectroscopy with the wavelength dispersion prism, and the throughput is improved as compared with the case of detecting one color at a time.
- the image is formed on the two-dimensional sensor cameras 19a and 19b (high-sensitivity cooled CCD camera) by the imaging lenses 18a and 18b and detected.
- the filter unit 15 uses two types of notch filters for removing laser light (488 nm and 594 nm) and a band-pass interference filter (transmission band: 510 to 700 nm) that transmits a wavelength body to be detected.
- the apparatus is provided with a transmitted light observation barrel 16, a TV camera 23, and a monitor 24 for adjustment and the like, so that the state of the substrate 8 can be observed in real time by halogen illumination or the like.
- the prisms 17a and 17b may be integrated as shown in the figure, or may be separate prisms close to each other or separated by a certain distance.
- the dispersion angles of the prisms 17a and 17b can be set arbitrarily, and the angles may be changed continuously. Moreover, the angle set with respect to a parallel light beam can be set arbitrarily. Further, it is not necessary to match the dispersion angle intersection (the intersection between the dotted line on the prism and the reflecting surface from the prism) of the prisms 17a and 17b with the center of the parallel beam (the dotted line on the prism). In the case where the dispersion angle intersection is aligned with the center of the parallel light beam, the intensities split in two directions in FIG. 1 are equal.
- the ratio of the signal intensities split in two directions can be changed.
- noise components such as fluctuations in the excitation light source can be offset, so the S / N is high Become.
- the maximum number of two-dimensional sensor cameras is the number in the dispersion direction, but a single two-dimensional sensor camera can be obtained by combining optical elements. In FIG.
- the optical axis is tilted by the wavelength dispersion prisms 17a and 17b, but a plurality of prisms having different dispersions may be combined to prevent the optical axis from tilting. Thereby, an image dispersed in a plurality of directions by one CCD can be acquired.
- positioning markers 30 and 31 are engraved on the substrate 8.
- the markers 30 and 31 are arranged in parallel with the arrangement of the regions 8ij, and the intervals are defined. Therefore, the position of the region 8ij can be calculated by detecting the marker by observation with transmitted illumination. If the wavelength dispersion prisms 17a and 17b where the parallel light beams enter and reflect are accidentally touched and contaminated, or if matching oil adheres to them, irregular reflection occurs and correct fluorescence intensity cannot be obtained. In such a case, if necessary, a depression is made so as not to touch the portions of the wavelength dispersion prisms 17a and 17b where the parallel light beam is incident and reflected, or the parallel light beam is parallel to a portion where the parallel light beam is not incident and reflected. A jig that cuts through the portion where the light beam enters and reflects may be bonded.
- a CCD area sensor was used as the two-dimensional sensor camera used in this example.
- a cooled CCD camera with a pixel size of 7.4 ⁇ 7.4 microns and a pixel count of 2048 ⁇ 2048 pixels is used.
- an imaging camera such as a C-MOS area sensor can be generally used as the two-dimensional sensor camera.
- An electron multiplying CCD camera having a signal multiplying function inside the element is also effective in achieving high sensitivity.
- the sensor is preferably a cooling type, and by setting it to about ⁇ 20 ° C. or less, dark noise of the sensor can be reduced and measurement accuracy can be improved.
- Fluorescence image from the reaction region 8a may be detected at once or divided.
- an XY movement mechanism unit for moving the position of the substrate is disposed below the stage, and the control PC controls the movement to the irradiation position, light irradiation, and fluorescence image detection.
- the XY moving mechanism is not shown.
- reaction process The step of stepwise extension reaction is shown below.
- the reaction process was performed with reference to Non-Patent Document 2 and Non-Patent Document 4.
- a buffer added with streptavidin is introduced into the chamber through the inlet 12, and streptavidin is bound to biotin immobilized on the metal structure to form a biotin-avidin complex.
- a primer is hybridized to a single-stranded template DNA that is a biotin-modified target, a buffer to which the template DNA-primer complex and a large excess of biotin are added is introduced into the chamber, and a single molecule is bound via a biotin-avidin bond.
- the template DNA-primer complex is fixed to a metal structure arranged at a lattice point.
- dNTP incorporated into the template DNA-primer complex is modified with an allyl group at the 3 ′ end, one or more bases are not incorporated into the template DNA-primer complex.
- various unreacted dNTPs and polymerase are washed away with a washing buffer, and laser light emitted from each of the Ar laser light source 101a and the He—Ne laser light source 101b is simultaneously irradiated onto the chip.
- a fluorescent substance labeled with dNTP incorporated in the template DNA-primer complex is excited by laser irradiation, and fluorescence emitted therefrom is detected.
- the base species of the dNTP can be specified.
- the phosphor existing in the region other than the surface is not excited and measurement with little background light can be performed. Therefore, in the above, washing is performed after the extension reaction.
- concentration of the fluorescently labeled dNTP is small, measurement may be possible without washing.
- the chip is irradiated with laser light oscillated from the YAG laser light source 100, and the phosphor labeled with dNTP taken in the composite is removed by light cutting.
- a solution containing palladium is introduced into the flow path, and the allyl group at the 3 ′ end of dNTP incorporated into the complex is changed to a hydroxyl group by a palladium catalytic reaction.
- the extension reaction of the template DNA-primer complex can be resumed.
- the chamber is washed with a washing buffer. By repeating this, the sequence of the fixed single-stranded template DNA is determined.
- the fluorescence intensity obtained increases as the output of the laser light source increases. Therefore, the output may be increased by using a device configuration using LEDs instead of lasers. In the case of an LED, there are advantages such as being able to be turned on / off without using a shutter and not generating electromagnetic waves. However, the fluorescence lifetime becomes shorter as the phosphor is irradiated with higher intensity.
- FIG. 3 is an explanatory diagram of a method for detecting the fluorescence of the substrate by wavelength dispersion.
- FIG. 3A is a schematic view of a part of the surface of the substrate 8, and a plurality of regions 8ij (lattice points) to which DNA is to be fixed are formed.
- the closest distance between the lattice points is 1 ⁇ m, and when dispersed in that direction, the dispersion is 40 nm per pixel.
- the grid point spacing is 3.6 ⁇ m.
- the dispersion is 11 nm per pixel. From the above, it can be understood that the fluorescence from the four types of phosphors in the range of 500 nm to 700 nm can be easily identified by increasing the dispersion distance. This is because it becomes easier to distinguish the fluorescence from the four types of phosphors as the lattice point interval is increased. However, increasing the lattice point interval reduces the number of regions 8ij (lattice points) captured in the field of view of the CCD.
- Template DNA sequencing throughput is reduced.
- four types of phosphors in the 200 nm range of 500 nm to 700 nm are dispersed by four pixels, it may be 50 nm (200 nm / 4 pixels) or less per pixel.
- FIG. 3C shows a fluorescence / emission spectrum when gold nanostructures are created in a plurality of regions 8ij (lattice points) to which DNA is to be fixed and detected in the direction of FIG. 3B.
- regions 8ij lattice points
- spectra from lattice points 8-11 and 8-32 are detected. It is known that luminescence is generated from the gold nanostructure, and the spectrum in the figure shows this. There is a portion where the strength sharply decreases in the middle, because this is cut by the 594 nm notch filter in the filter unit 15. By analyzing and marking the position of this valley, the wavelength axis of fluorescence from each lattice point can be configured.
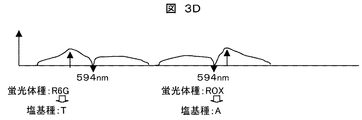
- FIG. 3D is a fluorescence spectrum after the extension reaction of dNTP, and a peak based on the fluorescence of the phosphor is observed.
- the phosphor species can be determined by calculating the fluorescence peak based on the reference point of 594 nm.
- R6G and ROX, and the base types are determined as T and A, respectively.
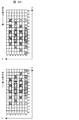
- 3E to 3L are schematic views of a part of the surface of the substrate 8, and a plurality of regions 8ij (lattice points) to which DNA is to be fixed are formed.
- the closest distance between the lattice points is 1 ⁇ m in both the X and Y directions, and when dispersed with 4 pixels (/ phosphor) in the X direction, the dispersion is 50 nm per pixel.
- 3E shows images taken by the two-dimensional sensor 19a or 19b of FIG. 1, respectively. Circles indicate the positions of the lattice points, and squares indicate one pixel of the CCD, and the coordinates of the CCD pixels are described for the number of pixels from 0 in each of the X and Y directions. However, since the CCD has 1000 ⁇ 1000 or 2000 ⁇ 2000 pixels and all pixels cannot be described, the lower left portion of the CCD is shown in an enlarged manner.
- the chromatic dispersion directions are the positive direction and the negative direction of X, but are not limited thereto.
- FIG. 3E it is assumed that the displacement amount from the lattice point of A (adenine) is 1 pixel, the displacement amount from the lattice point of G (guanine) is 2 pixels, the displacement amount from the lattice point of C (cytosine) is 3 pixels, The displacement amount from the lattice point of T (thymine) will be described as 4 pixels.
- the magnitude of dispersion is determined by the wavelength of the phosphor
- the amount of displacement is determined by the phosphor modified with each base. Therefore, the relationship between the phosphor and the amount of displacement is not limited to the above.
- Such an optical arrangement can be realized by adjusting the angle of the dispersion prism, the distance between the prism and the CCD, and the CCD position. Therefore, when adenine is dispersed in the right direction, it is detected at a location where X is moved +1 from the lattice point, and when it is dispersed in the left direction, it is detected at a location where X is moved -1 from the lattice point. Can do.
- the number of chromatic dispersion pixels per phosphor may be one or more, the fluorescence intensity per pixel is small. Accordingly, the number of chromatic dispersion pixels per phosphor is desirably 3 pixels or less. However, it is not limited to this.
- pixels in which chromatic dispersion is strongly detected in a specific dispersion direction are painted in gray (hereinafter, this point is substituted with a gray pixel).
- this point is substituted with a gray pixel.
- pixels with high fluorescence intensity can be identified by calculating an approximate curve from the fluorescence intensity of neighboring pixels. Therefore, it does not mean that the fluorescence intensity of pixels other than gray pixels is zero.
- the lattice points of (4, 5) have a dispersion wavelength peak at (6, 5).
- the wavelength dispersion of the lattice point of (7, 5) is any of (8, 5) to (11, 5), so it is dispersed to (6, 5)
- the wavelength peak is a phosphor existing at the lattice point (4, 5). Since it is guanine that moves +2, it can be concluded that guanine is present at the lattice point (4, 5).
- the phosphors at the lattice points in the row (a, 5) are all guanine.
- the phosphor at the lattice point (10, 5) can be identified from the displacement.
- the lattice point of (4, 2) is identified as cytosine because of the peak of the dispersion wavelength at (7, 2). It can also be seen that the phosphors at the lattice points in the row (a, 2) are all cytosine.
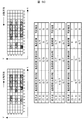
- FIG. 3F shows a case where there are two gray pixels in the pixels surrounded by a thick line in FIG. 3E. This can occur in the case of adenine (displacement amount + 1 pixel) or thymine (displacement amount + 4 pixels). Therefore, it is necessary to identify which of these bases. This problem does not occur when the dispersion distance is shorter than the interstitial distance.
- FIG. 3F is shown when all the lattice points are the same adenine. With respect to the lattice points of (10, 2), (10, 5), (10, 8), (10, 11), (10, 14), the left and right dispersion directions of the pixels surrounded by the thick lines described in FIG. In each case, 2 pixels (distance between 1 and 4) are all gray pixels.
- the base can be identified in order from the information of the lattice point on the most opposite side in the dispersion direction.
- the range of (5, 2) to (8, 2) is (5, 2) and (8, 2).
- the gray cell of (8, 2) is obtained by wavelength dispersion of the lattice point (7, 2), and is identified as adenine. From the above, it is understood that all lattice points are adenine in a daisy chain. This identification method can also be realized by arbitrarily deleting at least one lattice point in the dispersion direction.
- FIG. 3G shows a case where there are two gray pixels in the pixels surrounded by a thick line, as in FIG. 3F.
- the case where at least one different base exists in the dispersion direction will be described.
- the grid points of (10, 2), (10, 5), (10, 8), (10, 11), and (10, 14) the left and right dispersion directions of the pixels surrounded by thick lines are all seen.
- Two pixels (distance between 1 and 4) are gray pixels. Therefore, it is not possible to distinguish adenine or thymine just by looking inside the bold line.
- the base can be determined in a daisy chain as in FIG. 3F by determining the base of the lattice point.
- the base at the grid point (4, 8) is identified as guanine because (6, 8) is a gray pixel. This is because even if the grid point (1, 8) exists and is most dispersed, it is focused on the pixel (5, 8), so the grid point where (6, 8) can be a gray pixel is (4, 8 ) Only exists. Then, when considering the dispersion to the left of the grid point (7, 8), only (6, 8) is a gray pixel in the range of (3, 8) to (6, 8). Therefore, the base at the lattice point (7, 8) can be identified as adenine.
- (8, 8) and (11, 8) are gray pixels in the range of (8, 8) to (11, 8). Since the base of the grid point (7, 8) is identified as adenine, (8, 8) is a gray pixel when this grid point is dispersed to the right. Therefore, the gray pixel of (11, 8) is not derived from the grid point (7, 8). Therefore, it is identified as being derived from the lattice point (10, 8), and it is understood that it is adenine.
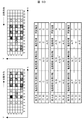
- FIG. 3H shows a case where there are two gray pixels in the pixels surrounded by a thick line, as in FIG. 3G.
- the grid points of (10, 2), (10, 5), (10, 8), (10, 11), (10, 14) the dispersion to the right of the pixels surrounded by the thick line is two or more.
- (12, 2), (12, 5), (12, 8), (12, 11), and (12, 14) are gray pixels.
- FIG. 3I shows a case where there are two gray pixels in the pixels surrounded by a thick line, as in FIG. 3G.
- the lattice points of (10, 2), (10, 5), (10, 8), (10, 11), (10, 14) the dispersion to the right side of the pixels surrounded by the bold line shows that there are two.
- (13, 2), (13, 5), (13, 8), (13, 11), (13, 14) are gray pixels.
- FIG. 3J shows a case where there are two gray pixels in the pixels surrounded by a thick line in FIG. 3E. This can occur in the case of adenine (displacement amount + 1 pixel) or thymine (displacement amount + 4 pixels). Therefore, it is necessary to identify which of these bases. This problem does not occur when the dispersion distance is shorter than the interstitial distance.
- FIG. 3J is shown when the lattice points are all the same thymine. Regarding the lattice points of (10, 2), (10, 5), (10, 8), (10, 11), and (10, 14), the left and right dispersion directions of the pixels surrounded by thick lines are all seen. Two pixels (distance between 1 and 4) are gray pixels.
- the base can be identified in order from the information of the lattice point on the most opposite side in the dispersion direction. For example, in the grid point (4, 2) existing on the leftmost side when dispersed on the right side, gray pixels are only in (8, 2) in the range of (5, 2) to (8, 2). Exists. Therefore, the lattice point (4, 2) is identified as thymine. From the above, it is understood that all lattice points are thymine in a daisy chain. This identification method can also be realized by arbitrarily deleting at least one lattice point in the dispersion direction.
- FIG. 3K shows a case where there are two gray pixels in the pixels surrounded by a thick line, as in FIG. 3F.
- the case where at least one different base exists in the dispersion direction will be described.
- the grid points of (10, 2), (10, 5), (10, 8), (10, 11), and (10, 14) the left and right dispersion directions of the pixels surrounded by thick lines are all seen.
- Two pixels (distance between 1 and 4) are gray pixels. Therefore, it is not possible to distinguish adenine or thymine just by looking inside the bold line.
- the base can be determined in a daisy chain as in FIG. 3J by determining the base of the lattice point.
- the base of the grid point (4, 1) is a gray pixel only in the range of (0, 1) to (3, 1) in the left side dispersion in the range (0, 1). Accordingly, the base at the lattice point (4, 1) can be identified as thymine. Therefore, when considering the dispersion to the right of the grid point (7, 1), (8, 1) and (11, 1) are gray pixels in the range of (8, 1) to (11, 1). Since the base of the grid point (4, 1) is identified as thymine, (8, 1) is a gray pixel when this grid point is dispersed to the right. Therefore, the gray pixel of (11, 1) is not derived from the grid point (10, 1).
- the lattice point (10, 1) is also identified as thymine. From the above, the bases of all lattice points in the dispersion direction can be identified in a daisy chain.
- FIG. 3L shows gray pixels and their coordinates for the right side dispersion and the left side dispersion.
- cytosine and guanine are identified. This is focused on a specific grid point, and can be identified as guanine when the right-side dispersion is +2 and when the left-side dispersion is ⁇ 2 pixels are gray pixels. Focusing on a specific grid point, it can be identified as cytosine when +3 is for right-side dispersion and -3 pixels are gray pixels for left-side dispersion. This identifies the base indicated by the circled number 1 in FIG. 3L. In FIG.
- the grid point grayed out by the circled numeral 1 indicates adenine or thymine.
- the bases of the lattice points (7, 10), (13, 10) on both the left and right sides are thymine.
- a specific lattice point is adenine or thymine, and further, both lattice points [(7, 10), (13, 10)] in the left and right dispersion directions are thymine or adenine.
- the base at a specific grid point (10, 10) cannot be specified at this time. In this case, as described in FIG. 3F, FIG. 3G, FIG. 3J, and FIG.
- the base sequences of specific lattice points can be identified in a daisy chain using base sequence information of other lattice points.
- the gray pixels of (11, 10) to (14, 10) are (11, 10) and (14, 10).
- the base of the grid point (7, 10) is thymine in the gray pixel (11, 10)
- the right-side dispersion of the grid point (10, 10) is specified as the gray pixel of (14, 10). Therefore, the lattice point (10, 10) is identified as thymine.
- the method described above with reference to FIG. 3L can also be applied to cases where arbitrary lattice points are missing or phosphors are not present.
- the base sequence can be identified from the dispersed images in multiple directions.
- the dispersion distance is 4 pixels
- the distance between adjacent lattices is 5 dispersion pixels (dispersion distance (4 pixels) +1)
- the number of grid points that can be detected in one field of view is approximately 2.8 times (5 ⁇ 5) / (3 ⁇ 3) in the examples of FIGS. 3E to 3L, compared to FIGS. 3A to 3D.
- Many base sequences can be identified, and throughput is improved.
- this ratio is further increased by examining the dispersion direction and the lattice arrangement. For example, under the condition that two grids are not skipped, the displacement amount from the lattice point of A (adenine) is 0 pixel, the displacement amount from the lattice point of G (guanine) is 1 pixel, and the displacement amount from the lattice point of C (cytosine) The same can be realized by setting the amount to 2 pixels, the displacement amount from the lattice point of T (thymine) to 3 pixels, and the interval between the lattice points to 2 ⁇ 2 pixels. As a result, the number of grid points that can be detected in one field of view is improved by about 6.25 times in the case of FIGS. 3E to 3L at (5 ⁇ 5) / (2 ⁇ 2) compared to FIGS. 3A to 3D. .
- the fluorescent image emitted from a specific lattice point is dispersed in a plurality of chromatic dispersion directions, thereby identifying the phosphor and the wavelength.
- the position of the dispersion target can be identified with high accuracy.
- the wavelength reference can be obtained for each reaction point of the substrate, and the type determination of the emitted phosphor, which was difficult with the dispersion spectroscopy imaging method, can be performed with high accuracy. As a result, it becomes possible to determine the base sequence with high accuracy.
- Metal structures on the substrate surface can be constructed of chromium, silver, aluminum, etc.
- the wavelength reference can be obtained not only from the center wavelength of the filter but also from the spectrum of laser scattering.
- four different phosphors are labeled with different dNTPs, but the same one phosphor can be labeled with four types of dNTPs.
- the excitation laser light source is one type. It is necessary to carry out the reaction in order of A ⁇ C ⁇ G ⁇ T ⁇ A ⁇ C. Further, the laser beam is incident on the quartz prism 7 perpendicularly. Thereby, a board
- FIG. 4 is a block diagram of a DNA testing apparatus using the fluorescence analysis method of the present invention.
- 1 is a prism total reflection type microscope
- FIG. 4 is a microscope in which the laser incident direction and the fluorescence detection direction are the same.
- an objective lens total reflection type microscope capable of detecting one molecule by irradiating a laser beam from an edge of the objective lens at an angle that makes total reflection, and can be used in the following embodiments.
- the apparatus has an apparatus configuration similar to a microscope, and the elongation state of DNA molecules captured on the substrate 8 is measured by fluorescence detection.
- the substrate 8 has a structure as shown in FIG.
- the substrate 8 is made of a transparent material, and synthetic quartz or the like can be used as the material.
- the substrate 8 has a reaction region 8a, which is a transparent material, and a reagent or the like is in contact with this portion.
- a plurality of regions 8ij to which DNA is immobilized are formed in the reaction region 8a.
- the region 8ij where the DNA is fixed is arranged in an array in the reaction region 8a.
- Each size of the region 8ij is 1000 nm or less in diameter, and more preferably 100 nm or less.
- This region is subjected to a surface treatment for capturing DNA.
- a region other than the region 8ij and the region 8ij in the reaction region 8a can be formed on the region 8ij by using only a material that reacts with the surface treatment agent using a thin film formation or etching technique. Only surface treatment can be applied. The surface treatment is performed by, for example, binding streptavidin and reacting with a biotin-labeled DNA fragment.
- a poly-T oligonucleotide can be immobilized, one end of the DNA fragment can be poly-A-treated, and captured by a hybrid reaction.
- the DNA fragment concentration is high, a plurality of molecules of DNA enter the individual regions 8ij, but by appropriately adjusting the DNA fragment concentration, only a single molecule of DNA enters the individual regions 8ij. can do.
- the region 8ij can be made smaller so that one molecule can be captured in the region.
- the beads can be arranged in the region 8ij on the array by fixing biotinylated DNA to streptavidinated beads and dispersing the beads in the reaction region 8a.
- beads having a large number of duplicated templates having the same DNA sequence are dispersed in the reaction region 8a, so that the beads can be placed in the region 8ij on the array. Can be arranged.
- the region 8ij where the DNA is immobilized is randomly aligned in the reaction region 8a.
- This is a case where the same surface treatment such as streptavidin is applied to the region 8ij and a place other than the region 8ij in the reaction region 8a. Therefore, in this case, the region 8ij indicates a region where DNA is fixed.
- the DNA fixing density increases.
- the DNA fixing density decreases, and single molecule DNA can be obtained with sufficient optical resolution. It can be a fixed density that can be identified.
- the beads can be randomly arranged by fixing biotinylated DNA to streptavidinated beads and dispersing the beads in the reaction region 8a.
- the beads can be randomly arranged by using emulsion PCR to disperse beads in which many templates having the same DNA sequence are replicated in the reaction region 8a.
- the size of the beads is 2000 nm or less, more preferably 10 to 1000 nm.
- DNA when single molecule DNA is immobilized on all regions 8ij, DNA may be immobilized only on a part of the region 8ij. When only a part of the DNA is immobilized, it is not immobilized in the remaining region 8ij and is in an empty state.
- the interval dx between the regions 8ij was 1 micron, and the interval dy was 3 microns.
- the region 8ij thus forms a lattice structure (two-dimensional rectangular lattice structure), and the region 8ij is arranged at the position of the lattice point.
- Such a method of creating a substrate having a uniform interval is, for example, created by the method described in Japanese Patent Laid-Open No. 2002-214142. It should be noted that dx and dy are larger than the individual sizes of the region 8ij and are preferably about 4000 nm or less.
- the reaction area 8a of the substrate was a slide glass size of 76.2 mm ⁇ 25.4 mm.
- the size of the reaction region 8a can be larger, for example, a size of 0.5 mm ⁇ 0.5 mm can be arranged in a one-dimensional or two-dimensional manner at regular intervals. Good.
- a metal structure may be disposed in the region 8ij. The metal structure can also be created by a semiconductor process.
- Electron beam drawing, dry etching, wet etching, etc. can be used.
- the metal structure is made of gold, copper, aluminum, chrome, or the like and has a shape having a size equal to or smaller than the wavelength of the excitation light, and a rectangular parallelepiped, a cone, a cylinder, or a structure having a partially protruding shape is used.
- Various fluorescent substances can be used as a fluorescent label for dNTP.
- -Allyl-dGTP-PC-Bodipy-FL-510, 3'-O-allyl-dTTP-PC-R6G, 3'-O-allyl-dATP-PC-ROX, 3'-O-allyl-dCTP-PC- Bodipy-650 is used.
- the laser light from the laser device 101a for fluorescence excitation (Ar laser, 488 nm: Bodipy-FL-510, for R6G excitation) is circularly polarized through the ⁇ / 4 wavelength plate 102a.
- Laser light from the laser device 101b for excitation of fluorescence (He—Ne laser, 594.1 nm: for excitation of ROX, Bodipy-650) is converted into circularly polarized light through the ⁇ / 4 wavelength plate 102b.
- Both laser beams are superimposed by a mirror 104b and a dichroic mirror 104a (reflects 520 nm or less), and are irradiated vertically from the back side of the substrate 8 that has captured the DNA molecules through the mirror 5.
- the surface of the substrate 8 is covered with a reaction solution (water).
- the temperature controller is arrange
- a structure in which halogen illumination is possible from the lower part of the prism is omitted, but this is omitted in the figure.
- a laser device 100 (YAG laser, 355 nm) is arranged so that the dichroic mirror 103 (reflects 400 nm or less) overlaps with the laser beams of the laser devices 101a and 101b so as to be irradiated coaxially. I made it. This laser is used for the step of returning the dNTP derivative to a state where it can be extended after fluorescence detection of the incorporated dNTP derivative.
- a flow chamber 9 for allowing a reagent or the like to flow and react is formed on the substrate 8.
- the chamber has a reagent introduction port 12, and a target reagent solution is injected by a dispensing unit 25 having a dispensing nozzle 26, a reagent storage unit 27, and a chip box 28.
- a sample liquid container 27a, dNTP derivative solution containers 27b, 27c, 27d, and 27e (27c, 27d, and 27e are reserved), a cleaning liquid container 27f, and the like are prepared.
- the type and number of reagents can be increased.
- a dispensing tip in the tip box 28 is attached to the dispensing nozzle 26, an appropriate reagent solution is sucked, introduced into the reaction region of the substrate from the chamber inlet, and reacted.
- the waste liquid is discharged to the waste liquid container 11 through the waste liquid tube 10.
- the flow chamber is made of a transparent material in the direction of the optical axis, and fluorescence is detected.
- the fluorescent light 13 is collected by a condensing lens (objective lens) 14 controlled by an automatic focusing device 29, and the parallel light beam is bent by the dichroic mirror 7, and the filter unit 15 extracts fluorescent light of a necessary wavelength, which is unnecessary. Remove light of wavelength.
- Fluorescence having a required wavelength that has passed through the objective lens 14 is converted into a parallel light beam and dispersed in two directions by the wavelength dispersion prisms 17a and 17b. For example, four colors can be detected simultaneously by performing spectroscopy with the wavelength dispersion prism, and the throughput is improved as compared with the case of detecting one color at a time.
- the image is formed on the two-dimensional sensor cameras 19a and 19b (high-sensitivity cooled CCD camera) by the imaging lenses 18a and 18b and detected.
- the filter unit 15 uses two types of notch filters for removing laser light (488 nm and 594 nm) and a band-pass interference filter (transmission band: 510 to 700 nm) that transmits a wavelength body to be detected.
- the apparatus includes a transmission light observation barrel 16, a TV camera 23, and a monitor 24 for adjustment and the like, so that the state of the substrate 8 can be observed in real time by halogen illumination or the like.
- the prisms 17a and 17b may be integrated as shown in the figure, or may be separate prisms close to each other or separated by a certain distance.
- the dispersion angles of the prisms 17a and 17b can be set arbitrarily, and the angles may be changed continuously. Moreover, the angle set with respect to a parallel light beam can be set arbitrarily. Further, it is not necessary to match the dispersion angle intersection (the intersection between the dotted line on the prism and the reflecting surface from the prism) of the prisms 17a and 17b with the center of the parallel beam (the dotted line on the prism). In the case where the dispersion angle intersection is aligned with the center of the parallel light beam, the intensities split in two directions in FIG. 1 are equal.
- the ratio of the signal intensities split in two directions can be changed.
- the maximum number of two-dimensional sensor cameras is the number in the dispersion direction, but a single two-dimensional sensor camera can be obtained by combining optical elements.
- the optical axis is tilted by the wavelength dispersion prisms 17a and 17b, but a plurality of prisms having different dispersions may be combined to prevent the optical axis from tilting. Thereby, an image dispersed in a plurality of directions by one CCD can be acquired. As shown in FIG.
- positioning markers 30 and 31 are engraved on the substrate 8.
- the markers 30 and 31 are arranged in parallel with the arrangement of the regions 8ij, and the intervals are defined. Therefore, the position of the region 8ij can be calculated by detecting the marker by observation with transmitted illumination.
- a CCD area sensor was used as the two-dimensional sensor camera used in this example.
- a cooled CCD camera with a pixel size of 7.4 ⁇ 7.4 microns and a pixel count of 2048 ⁇ 2048 pixels is used.
- an imaging camera such as a C-MOS area sensor can be generally used as the two-dimensional sensor camera.
- An electron multiplying CCD camera having a signal multiplying function inside the element is also effective in achieving high sensitivity.
- the sensor is preferably a cooling type, and by setting it to about ⁇ 20 ° C. or less, dark noise of the sensor can be reduced and measurement accuracy can be improved.
- Fluorescence image from the reaction region 8a may be detected at once or divided.
- an XY movement mechanism unit for moving the position of the substrate is disposed below the stage, and the control PC controls the movement to the irradiation position, light irradiation, and fluorescence image detection.
- the XY moving mechanism is not shown.
- ⁇ Third Embodiment> 5A to 5F are schematic views of a part of the surface of the substrate 8, and a plurality of regions 8ij (lattice points) to which DNA is to be fixed are formed.
- the closest distance between the lattice points is 1 ⁇ m in both the X and Y directions, and when dispersed with 4 pixels (/ phosphor) in the X direction, the dispersion is 50 nm per pixel.
- FIG. 5A shows images taken by the two-dimensional sensor 19a or 19b of FIG. Circles indicate the positions of the lattice points, and squares indicate one pixel of the CCD, and the coordinates of the CCD pixels are described for the number of pixels from 0 in each of the X and Y directions.
- the CCD has 1000 ⁇ 1000 or 2000 ⁇ 2000 pixels and all pixels cannot be described, the lower left portion of the CCD is shown in an enlarged manner.
- (0, 0) is the lower leftmost pixel of the CCD.
- there are lattice points at positions such as (3, 0) (5, 2). From FIG.
- the chromatic dispersion directions are the positive direction and the negative direction of X, but are not limited thereto.
- the displacement amount from the lattice point of A (adenine) is 0 pixel
- the displacement amount from the lattice point of G (guanine) is 1 pixel
- the displacement amount from the lattice point of C cytosine
- the displacement amount from the lattice point of T (thymine) will be described as 3 pixels.
- the magnitude of dispersion is determined by the wavelength of the phosphor
- the amount of displacement is determined by the phosphor modified with each base. Therefore, the relationship between the phosphor and the amount of displacement is not limited to the above.
- Such an optical arrangement can be realized by adjusting the angle of the dispersion prism, the distance between the prism and the CCD, and the CCD position. Therefore, when adenine is dispersed in the right direction, it is detected at a place where X moves ⁇ 0 from the lattice point, and when it is dispersed in the left direction, it is detected at a place where X moves ⁇ 0 from the lattice point. be able to.
- the number of chromatic dispersion pixels per phosphor may be one or more, the fluorescence intensity per pixel is small. Accordingly, the number of chromatic dispersion pixels per phosphor is desirably 3 pixels or less. However, it is not limited to this. Although the interstitial distance is different from those in FIGS. 3E to 3L, it will be described below that the base sequence is identified by the same concept.
- FIG. 5A to FIG. 5F pixels in which chromatic dispersion is strongly detected in a specific dispersion direction are painted in gray (hereinafter, this point is substituted with a gray pixel). In actual measurement, pixels with high fluorescence intensity can be identified by calculating an approximate curve from the fluorescence intensity of neighboring pixels.
- FIG. 5A describes a case where all base sequences are the same in the dispersion direction.
- the grid point (7, 6) is focused and dispersed in the right direction (left figure)
- the gray pixels in the range (7, 6) to (10, 6) are (7, 6). 6) and (9, 6). Therefore, the base candidate is A or C.
- the gray pixels in the range of (4, 6) to (7, 6) are (5, 6) and (7, 6). Therefore, the base candidate is A or C. Therefore, the base candidate is A or C in both the right and left dispersion directions, and the base cannot be identified.
- the bases of the grid points (5, 6) and (9, 6) existing on the left and right of the grid point (7, 6) are also A or C, and the base cannot be identified.
- the bases existing in the other dispersion directions can be identified in a daisy chain. For example, when the right side dispersion is performed, the lattice point on the most opposite side (left side) with respect to the dispersion direction is (3, 6).
- the gray pixels in the range of (3, 6) to (6, 6) are (3, 6) and (5, 6) when distributed rightward (left figure). Therefore, the base candidate is A or C.
- the gray pixels in the range of (0, 6) to (3, 6) are only (3, 6). Therefore, the base at the lattice point (3, 6) is identified as adenine.
- Gray pixels in the range of (5, 6) to (8, 6) are (5, 6) and (7, 6).
- the grid point (3, 6) is adenine
- the gray pixel is (3, 6) and (5, 6) is not a gray pixel when dispersed rightward. Therefore, in order for (5, 6) to be a gray pixel, the grid point (5, 6) must be adenine.
- the base at the lattice point (5, 6) is identified as adenine.
- the gray pixels in the range of (7, 6) to (10, 6) are (7, 6) and (10, 6).
- the grid point (5, 6) is adenine
- the gray pixel is (5, 6) and (7, 6) is not a gray pixel when dispersed rightward. Therefore, in order for (7, 6) to be a gray pixel, the grid point (7, 6) must be adenine. Therefore, the base at the lattice point (7, 6) is identified as adenine.
- the bases in the wavelength dispersion direction are all the same, the bases can be identified in a daisy chain. This method can be realized even if at least one lattice point is lost in the dispersion direction or the phosphor is not taken in.
- the base candidate is G or T.
- the gray pixels in the range of (4, 4) to (7, 4) are (4, 4) and (6, 4). Therefore, the base candidate is G or T. Therefore, the base candidate is G or T in both the right and left dispersion directions, and the base cannot be identified.
- the bases of the grid points (5, 4) and (9, 4) existing on the left and right of the grid point (7, 4) are also G or T, and the base cannot be identified.
- the bases existing in the other dispersion directions can be identified in a daisy chain. For example, when the right side dispersion is performed, the lattice point on the most opposite side (left side) with respect to the dispersion direction is (3, 4).
- the gray pixels in the range of (3, 4) to (6, 4) are (4, 4) and (6, 4).
- the base candidate is G or T.
- the gray pixels in the range of (0, 4) to (3,4) are only (2, 4). Therefore, the base at the lattice point (3, 4) is identified as guanine.
- the gray pixels in the range of (5, 4) to (8, 4) are (6, 4) and (8, 4). However, since the grid point (3, 4) is guanine, the gray pixel is (5, 4) when dispersed rightward, and (6, 4) and (8, 4) are not gray pixels.
- (6, 4) can be gray pixels at (6 or less, 4) grid points. Since the grid point (3, 4) is guanine, (6, 4) cannot be a gray pixel, and the grid point (1, 4) cannot be a gray pixel two neighboring grid points in the dispersion direction. It can be seen that only the grid point (5, 4) can make (6, 4) a gray pixel. Therefore, the grid point (5, 4) is identified as guanine.
- the gray pixels in the range of (7, 4) to (10, 4) are (8, 4) and (10, 4).
- the gray pixel is (6, 4) when dispersed rightward, and (8, 4) and (10, 4) are not gray pixels.
- (8, 4) can be a gray pixel in (8 or less, 4) grid points. Since grid point (5, 4) is guanine, (8, 4) cannot be a gray pixel, and grid point (3, 4) is a condition that the grid point adjacent to the dispersion direction cannot be a gray pixel. From this, it can be seen that only the grid point (7, 4) can make (8, 4) a gray pixel. Therefore, the lattice point (7, 4) is identified as guanine.
- the bases in the wavelength dispersion direction are all the same, the bases can be identified in a daisy chain. This method can be realized even if at least one lattice point is lost in the dispersion direction or the phosphor is not taken in.
- the base candidate is A or C.
- the gray pixels in the range (4, 2) to (7, 2) are ( 7, 2) and (9, 2). Therefore, the base candidate is A or C.
- the gray pixels in the range (4, 2) to (7, 2) are (5, 2) and (7, 2). Therefore, the base candidate is A or C. Therefore, the base candidate is A or C in both the right and left dispersion directions, and the base cannot be identified.
- the bases of the grid points (5, 2) and (9, 2) existing on the left and right of the grid point (7, 2) are also A or C, and the base cannot be identified.
- the bases existing in the other dispersion directions can be identified in a daisy chain. For example, when the right side dispersion is performed, the lattice point on the most opposite side (left side) with respect to the dispersion direction is (3, 2).
- the gray pixels in the range of (3, 2) to (6, 2) are only (5, 2).
- the base at the lattice point (3, 2) is identified as cytosine.
- the gray pixels in the range of (5, 2) to (8, 2) are (5, 2) and (7, 2).
- the gray pixel of (7, 2) can be a gray pixel at either the grid point (5, 2) or the grid point (7, 2). Therefore, the base at the lattice point (5, 2) is A or C only by the right side dispersion and cannot be identified.
- the gray pixels in the range of (2, 2) to (5, 2) are (3, 2) and (5, 2).
- the grid point (3, 2) is cytosine
- (3, 2) cannot be a gray pixel
- the grid point (7, 2) is the grid point next to the gray pixel in the dispersion direction. Since this is not possible, it is understood that only the grid point (5, 2) can be used as a gray pixel in (3, 2). Therefore, the grid point (5, 2) is identified as cytosine.
- the gray pixels in the range of (7, 2) to (10, 2) are (7, 2) and (9, 2).
- the gray pixel is (7, 2) when dispersed on the right side.
- the gray pixel (9, 2) can be a gray pixel at either the grid point (7, 2) or the grid point (9, 2). Therefore, the base at the lattice point (7, 2) is A or C only by the right side dispersion, and cannot be identified.
- the gray pixels in the range of (4, 2) to (7, 2) are (5, 2) and (7, 2).
- the grid point (5, 2) is cytosine
- (5, 2) cannot be a gray pixel
- the grid point (9, 2) is a gray pixel with two grid points next to each other in the dispersion direction.
- the lattice point (7, 2) is identified as cytosine. In this way, even when the bases in the wavelength dispersion direction are all the same, the bases can be identified in a daisy chain. This method can be realized even if at least one lattice point is lost in the dispersion direction or the phosphor is not taken in.
- the base candidate is G or T.
- the gray pixels in the range of (4,0) to (7,0) are (4,0) and (6,0). Therefore, the base candidate is G or T. Therefore, the base candidate is G or T in both the right and left dispersion directions, and the base cannot be identified.
- the bases of the grid points (5, 0), (9, 0) existing on the left and right of the grid point (7, 0) are also G or T, and the base cannot be identified.
- the bases existing in the other dispersion directions can be identified in a daisy chain. For example, when the right side dispersion is performed, the lattice point on the most opposite side (left side) with respect to the dispersion direction is (3, 0).
- the gray pixels in the range of (3, 0) to (6, 0) are only (6, 0).
- the base at the lattice point (3, 0) is identified as thymine.
- Gray pixels in the range of (5, 0) to (8, 0) are (6, 0) and (8, 0).
- the gray pixel is (6, 0) when the right side dispersion is performed.
- the gray pixel (8, 0) can be a gray pixel at either the grid point (5, 0) or the grid point (7, 0). Therefore, the base at the lattice point (5, 0) is G or T only by the right side dispersion and cannot be identified.
- Gray pixels in the range of (2, 0) to (5, 0) are (2, 0) and (4, 0).
- the grid point (3, 0) is cytosine, (2, 0) cannot be a gray pixel
- the grid point (7, 0) is a grid pixel that is two adjacent grid points in the dispersion direction. Since this is not possible, it is understood that only the grid point (5, 0) can be used as a gray pixel for (2, 0). Therefore, the lattice point (5, 0) is identified as thymine.
- Gray pixels in the range of (7,0) to (10,0) are (8,0) and (10,0).
- the grid point (5, 0) is thymine
- the gray pixel is (8, 0) when dispersed on the right side.
- the gray pixel of (10, 0) can be a gray pixel at either the grid point (7, 0) or the grid point (9, 0).
- the base at the lattice point (7, 0) is G or T only by the right side dispersion, and cannot be identified.
- Gray pixels in the range of (4,0) to (7,0) are (4,0) and (6,0).
- the grid point (5,0) is thymine
- (5,0) cannot be a gray pixel
- the grid point (9,0) is a grid pixel that is two adjacent grid points in the dispersion direction. Since this is not possible, it can be seen that only the grid point (7, 0) can be used to make (4, 0) a gray pixel. Therefore, the lattice point (7, 0) is identified as thymine. In this way, even when the bases in the wavelength dispersion direction are all the same, the bases can be identified in a daisy chain. This method can be realized even if at least one lattice point is lost in the dispersion direction or the phosphor is not taken in. As described above, in FIG. 5A, when only a specific base among the four types of bases exists at the lattice points in the dispersion direction, the base sequence can be determined.
- FIG. 5B explains a method of identifying a base when the base of at least one lattice point is different from the base (adenine) of the other lattice point at the lattice point in the dispersion direction.
- base candidates are listed from gray pixels [grid point pixels to (grid point pixels + 3 pixels)] in the right dispersion direction.
- base candidates are listed from gray pixels [grid point pixels to (grid point pixels-3 pixels)] in the left dispersion direction.
- the base can be identified at that point. For other lattice points, only base candidates are determined. The result is described in the column of “base candidate” in the above table.
- the base is specified from the information of the grid point for which a base has been identified.
- the base can be identified by applying the same concept to other unidentified grid points.
- the gray pixels in the range of (5, 4) to (8, 4) are (6, 4) and (7, 4).
- the gray pixels in the range of (2, 4) to (5, 4) are (3, 4) and (4, 4).
- the base on the right side of the grid point (5, 4) is identified as adenine.
- the identified grid point (7, 4) is adenine at the grid point (5, 4)
- the dispersion in the direction opposite to the grid point (left side dispersion) is considered.
- the gray pixels in the left dispersion of the grid point (5, 4) are (3, 4) and (4, 4).
- the grid point (7, 4) is adenine
- (4, 4) cannot be a gray pixel
- the grid point (9, 4) is a grid pixel that is two adjacent grid points in the dispersion direction.
- the grid point (5, 4) can be a gray pixel of (4, 4). Therefore, the grid point (5, 4) is identified as guanine. In this way, bases were identified for all grid points having a plurality of “base candidates” in the above table, and the results were listed in the “identified base” column.
- FIG. 5C illustrates a method for identifying a base when the base of at least one lattice point is different from the base (guanine) of the other lattice point at the lattice point in the dispersion direction.
- base candidates are listed from gray pixels [grid point pixels to (grid point pixels + 3 pixels)] in the right-side dispersion direction.
- base candidates are listed from gray pixels [grid point pixels to (grid point pixels-3 pixels)] in the left dispersion direction.
- the base can be identified at that point. For other lattice points, only base candidates are determined. The result is described in the column of “base candidate” in the above table.
- the base is specified from the information of the grid point for which a base has been identified.
- the base can be identified by applying the same concept to other unidentified grid points.
- the gray pixels in the range of (5, 4) to (8, 4) are (5, 4) and (8, 4).
- the gray pixels in the range of (2, 4) to (5, 4) are (2, 4) and (5, 4).
- the base on the right side of the grid point (5, 4) is identified as guanine.
- the identified grid point (7, 4) is guanine at the grid point (5, 4)
- the dispersion in the direction opposite to the grid point (left side dispersion) is considered.
- the gray pixels in the left dispersion of the grid point (5, 4) are (2, 4) and (5, 4).
- the grid point (7, 4) is guanine
- (5, 4) cannot be a gray pixel
- the grid point (9, 4) is a grid pixel that is two adjacent grid points in the dispersion direction.
- the grid point (5, 4) can be a gray pixel of (5, 4). Therefore, the grid point (5, 4) is identified as adenine. In this way, bases were identified for all grid points having a plurality of “base candidates” in the above table, and the results were listed in the “identified base” column.
- the base can be identified at that point. For other lattice points, only base candidates are determined. The result is described in the column of “base candidate” in the above table.
- the base is specified from the information of the grid point for which a base has been identified.
- the base can be identified by applying the same concept to other unidentified grid points.
- the gray pixels in the range of (9, 4) to (12, 4) are (9, 4) and (11, 4).
- the gray pixels in the range of (6, 4) to (9, 4) when dispersed on the left side are (7, 4) and (9, 4).
- the base on the left side of the lattice point (9, 4) is identified as cytosine.
- the identified grid point (7, 4) is a cytosine at the grid point (9, 4)
- the dispersion in the same direction left-side dispersion
- the gray pixels in the left dispersion of the grid point (9, 4) are (7, 4) and (9, 4).
- the grid point (7, 4) is cytosine, (7, 4) cannot be made a gray pixel, and the grid point (11, 4) has a grid point next to the gray pixel in the dispersion direction.
- the grid point (9, 4) can make (7, 4) a gray pixel. Therefore, the grid point (9, 4) is identified as cytosine. In this way, bases were identified for all grid points having a plurality of “base candidates” in the above table, and the results were listed in the “identified base” column.
- FIG. 5E explains a method for identifying a base when the base of at least one lattice point is different from the base (thymine) of the other lattice point at the lattice point in the dispersion direction.
- base candidates are listed from gray pixels [grid point pixels to (grid point pixels + 3 pixels)] in the right dispersion direction.
- base candidates are listed from gray pixels [grid point pixels to (grid point pixels-3 pixels)] in the left dispersion direction.
- the base can be identified at that point. For other lattice points, only base candidates are determined. The result is described in the column of “base candidate” in the above table.
- the base is specified from the information of the grid point for which a base has been identified.
- the base can be identified by applying the same concept to other unidentified grid points.
- Gray pixels in the range of (9, 4) to (12, 4) are (10, 4) and (12, 4).
- the gray pixels in the range of (6, 4) to (9, 4) are (6, 4) and (8, 4).
- the base on the left side of the grid point (9, 4) is identified as thymine.
- the identified grid point (7, 4) is thymine at the grid point (9, 4)
- the dispersion in the same direction left-side dispersion
- the gray pixels in the left dispersion of the grid point (9, 4) are (6, 4) and (8, 4).
- (6, 4) cannot be a gray pixel
- the grid point (11, 4) is a grid pixel that is two neighboring grid points in the dispersion direction.
- the grid point (9, 4) can make (6, 4) a gray pixel. Therefore, the grid point (9, 4) is identified as thymine. In this way, bases were identified for all grid points having a plurality of “base candidates” in the above table, and the results were listed in the “identified base” column.
- FIG. 5F shows the gray pixels and their coordinates for each of the right side dispersion and the left side dispersion.
- base candidates are listed from gray pixels [grid point pixels to (grid point pixels + 3 pixels)] in the right-side dispersion direction.
- base candidates are listed from gray pixels [grid point pixels to (grid point pixels-3 pixels)] in the left dispersion direction. This was performed for all grid points in FIG. 5F.
- the results for the grid points in the fourth column (a, 4) are shown below.
- the lattice point (7, 2) is identified as cytosine.
- the base of the grid point (7, 2) is determined from the base information of the grid point (5, 2), but can also be identified from the base information of the grid point (9, 2).
- the identified grid point (9, 2) is cytosine, the dispersion in the same direction as the lattice point (right-side dispersion) is considered.
- the gray pixels in the right dispersion of the grid point (7, 2) are (7, 2) and (9, 2) in the range of (7, 2) to (10, 2).
- the grid point (9, 2) is cytosine
- (9, 2) cannot be made a gray pixel
- the grid point (5, 2) has a grid point next to the gray pixel in the dispersion direction. Since this is not possible, it can be seen that only the grid point (7, 2) can make (9, 2) a gray pixel. Therefore, the lattice point (7, 2) is identified as cytosine.
- the base of the grid point (7, 2) was identified as cytosine by using the base information of the grid point (5, 2) and the grid point (9, 2). As described above, the base sequence determination accuracy is improved by identifying the base at a specific lattice point from the bases adjacent to each other in the wavelength dispersion direction.
- mark information can be attached to the coordinates of the lattice points and the identified base data. For example, when a new genome sequence is determined, DNA is made into short fragments, a large number of fragments are randomly separated and sequenced, and the genome sequence is determined by superimposing the fragment sequence information (de novo sequence).
- the lattice point (5, 0) is A or G
- the lattice point (7, 0) is C or T
- the lattice point (9, 0) is A or G
- the base is not identified. Therefore, it is necessary to identify the base from the information of the lattice points on both sides of the dispersion direction where the base is identified. Since the lattice point (5,0) is the thymine at the lattice point (3,0), the lattice point (9,0) is the thymine because the lattice point (11,0) is the thymine.
- Gray pixels in the right dispersion of the grid point (5, 0) are (5, 0) and (6, 0) in the range of (5, 0) to (8, 0).
- the grid point (5,0) is thymine, (5,0) cannot be a gray pixel, and the grid point (3,0) is a gray pixel with two grid points adjacent in the dispersion direction. Since this is not possible, it is understood that only the grid point (5, 0) can be used as a gray pixel for (5, 0). Therefore, the lattice point (5, 0) is identified as adenine.
- the lattice point (9, 0) when the identified lattice point (11, 0) is thymine, the dispersion in the direction opposite to that lattice point (left-side dispersion) is considered.
- the gray pixels in the left dispersion of the grid point (9, 0) are (8, 0) and (9, 0) in the range of (6, 0) to (9, 0).
- (9,0) cannot be a gray pixel
- the grid point (13,0) is a grid pixel that is two neighbors in the dispersion direction.
- the lattice point (9, 0) is identified as adenine. From the above, both the lattice point (5, 0) and the lattice point (11, 0) were identified as adenine, and the result of the base candidate at this point was entered in “base candidate circle number 2” in the above table.
- the lattice point of the base not identified at the time of “base candidate circle number 2” is the lattice point (7, 0).
- a base is identified for a lattice point (7, 0) having two base candidates C and T.
- the dispersion in the same direction as the lattice point (left-side dispersion) is considered.
- Gray pixels in the left dispersion of the grid point (7, 0) are (4, 0) and (5, 0) in the range of (4, 0) to (7, 0).
- the grid point (5,0) is adenine
- (4,0) cannot be a gray pixel
- the grid point (9,0) is a grid pixel that is two adjacent grid points in the dispersion direction. Since this is not possible, it is understood that only the grid point (7, 0) can be used as a gray pixel for (4, 0).
- the lattice point (7, 0) is identified as thymine.
- the base of the grid point (7, 0) is determined from the base information of the grid point (5, 0), but can also be identified from the base information of the grid point (9, 0).
- the identified lattice point (9, 0) is adenine, the dispersion in the same direction as the lattice point (rightward dispersion) is considered.
- Gray pixels in the right dispersion of the grid point (7, 0) are (9, 0) and (10, 0) in the range of (7, 0) to (10, 0).
- the grid point (9, 0) is adenine, (10, 0) cannot be made a gray pixel, and the grid point (5, 0) has a grid point next to the gray pixel in the dispersion direction. Since this is not possible, it can be seen that only the grid point (7, 0) can make (10, 0) a gray pixel. Therefore, the lattice point (7, 0) is identified as thymine. The base of the grid point (7, 0) was identified as thymine by using the base information of the grid point (5, 0) and the grid point (9, 0).
- the base sequence determination accuracy is improved by identifying the base at a specific lattice point from the bases adjacent to each other in the wavelength dispersion direction.
- the base sequence determination accuracy is improved by identifying the base at a specific lattice point from the bases adjacent to each other in the wavelength dispersion direction. For example, when one of the lattice points in the dispersion direction is missing or a phosphor is not incorporated or a phosphor is incorporated but it is difficult to identify the base at a specific lattice point, the opposite direction A base at a specific lattice point can be identified only from the bases at the lattice points.
- mark information can be attached to the coordinates of the lattice points and the identified base data.
- mark information can be attached to the coordinates of the lattice points and the identified base data.
- mark information can be attached to the coordinates of the lattice points and the identified base data.
- the base sequence can be identified from the dispersed images in multiple directions.
- the dispersion distance is 4 pixels
- the distance between adjacent lattices is 4 pixels in the examples of FIGS. 3A to 3D, but the distance between lattices is 2 pixels in the examples of FIGS. 5A to 5F.
- Similar analysis can be realized. Therefore, the number of grid points that can be detected in one field of view is four times (4 ⁇ 4) / (2 ⁇ 2) in the examples of FIGS. 5A to 5F compared to FIGS. 3A to 3D. Many can be identified and throughput is improved. It goes without saying that this ratio is further increased by examining the dispersion direction and the lattice arrangement.
- the displacement from the lattice point of A is 0 pixel
- the displacement from the lattice point of G is 1 pixel
- the displacement from the lattice point of C cytosine
- the number of grid points that can be detected in one field of view is (4 ⁇ 4) / (1 ⁇ 1), which is 16 times higher in throughput in the examples of FIGS. 3E to 3L than in FIGS. 3A to 3D.
- the fluorescent image emitted from a specific lattice point is dispersed in a plurality of chromatic dispersion directions, thereby identifying the phosphor and the wavelength.
- the position of the dispersion target can be identified with high accuracy.
- the wavelength reference can be obtained for each reaction point of the substrate, and the type determination of the emitted phosphor, which was difficult with the dispersion spectroscopy imaging method, can be performed with high accuracy. As a result, it becomes possible to determine the base sequence with high accuracy.
- Metal structures on the substrate surface can be constructed of chromium, silver, aluminum, etc.
- the wavelength reference can be obtained not only from the center wavelength of the filter but also from the spectrum of laser scattering.
- four different phosphors are labeled with different dNTPs, but the same one phosphor can be labeled with four types of dNTPs.
- the excitation laser light source is one type. It is necessary to carry out the reaction in order of A ⁇ C ⁇ G ⁇ T ⁇ A ⁇ C. Further, the laser beam is incident on the quartz prism 7 perpendicularly. Thereby, a board
- FIG. 6 shows another structure of the junction between the substrate and the prism for evanescent illumination.
- the substrate 8 is coupled to the quartz prism 7.
- the measurement visual field in the substrate can be moved on the XY stage including the prism.
- the measurement substrate 200 is embedded and fixed in a dedicated holder 203.
- the flow chamber 204 is fixed to this lower part (reaction surface side, lattice structure formation side).
- the flow chamber 204 is formed of PDMS and is adhered to the holder 203 so that a reagent, a cleaning solution, or the like can flow into the reaction region of the measurement substrate 200. This is brought into contact with the substrate holder 205 fixed to the XY stage 209 (shown in FIG. 8).
- the flow path 208 and the through-hole 206 of the flow chamber 204 are aligned.
- the through hole 206 is connected to an external flow system.
- the substrate holder 205 has a large opening 207 in the center thereof, so that the condenser lens 14 and the measurement substrate 200 can be brought close to each other, and the fluorescence can be condensed with high efficiency.
- Matching oil is held in the recess 202 in the holder 203 on the back surface (upper side in the drawing) of the measurement substrate 200, and the prism 7 is disposed. Matching may be performed by filling the depression 202 with a PDMS resin instead of the matching oil.
- the prism 7 is fixed to the prism holder 210 and has a function of attaching to and detaching from the substrate, and adheres to the substrate when evanescent illumination is performed. It is also possible to use a prism made of acrylic or the like, which is integrated with the substrate and fixed.
- FIG. 6 Another example of a reaction substrate is shown.
- the structure of the substrate 60 in this embodiment is shown in FIG.
- the substrate 60 has a reaction region 60a, in which a plurality of regions 60ij to which DNA is immobilized are formed, and the periphery of the plurality of 60ij is covered with an optically opaque mask 60b.
- the mask material metals such as aluminum and chromium, silicon carbide, and the like can be applied, and the film is thinned by vapor deposition.
- Each size of the region 60ij is 100 nm or less in diameter.
- the opening in the mask 60b it is created by vapor deposition by a projection method (deposition is carried out by arranging an appropriate mask between the vapor deposition source and the substrate), direct drawing by electron beam lithography or photolithography. it can. Dry etching or wet etching may be used. Also in this example, the same effect as in the first embodiment can be obtained. Further, since the region other than the reaction region 60ij is masked, unnecessary stray light and fluorescence can be reduced, and measurement can be performed with higher sensitivity. In the case of a metal thin film substrate having a minute opening, the biomolecule is fixed in the opening.
- the spatial position of the structure can be detected by detecting the Raman scattered light of the sample liquid around the biomolecule and the photoluminescence and light scattering of the metal structure in the vicinity of the biomolecule.
- Can be used as A metal structure may be created in the opening.
- the present invention provides various automated sequencing systems that can be used to collect sequence information from one or more templates in parallel and substantially simultaneously.
- the mold is in an array on a substantially planar substrate.
- An example of the system of the present invention includes a CCD camera, a fluorescence microscope, a movable stage, a flow cell, a temperature control device, a liquid operation device, a prism, a dispersion prism, a spectral filter, a condensing lens, as described in FIGS.
- a computer is provided.
- the fluorescence analysis method of the present invention can be performed by various sequencing methods, such as, but not limited to, sequencing by synthesis (Sequence by Synthesis), sequencing by fluorescence in situ (FISSEQ) (e.g., Mitra RD et al., AnalchemBiochem). 320 (l): 55-65, 2003), sequencing by ligation (for example, US Patent 2008/0003571), single molecule sequencing by sequential synthesis (for example, US 2002/2002) 0164629), a single molecule sequencing method by a real-time reaction method (for example, JonasonaKorlash et al., PNAS., Vol. 105, 1176-1181, 2008) and the like.
- FISSEQ was directly bound to the substrate on a semi-solid support or on a template immobilized directly on the support, on a template immobilized on a semi-solid support or on a microparticle on the support. It can be performed on a mold or the like.
- One important element of the system of the present invention is the flow cell.
- a flow cell includes a chamber having an inflow port and an outflow port through which fluid can flow.
- Various flow cells and materials and methods for their manufacture are described, for example, in US Pat. Nos. 6,406,848 and 6,654,505 and PCT Publication No. WO98053300.
- a flow cell suitable for use in the sequencing system of the present invention is provided with a substrate on which a fluid flows on its surface, for example a substantially planar substrate such as a slide, and illumination. It is equipped with a window that enables excitation and signal acquisition.
- entities such as microparticles are typically arrayed on a substrate prior to placement in a flow cell.
- the flow cell is oriented vertically, which allows air bubbles to escape from the top surface of the flow cell.
- the flow cell is arranged such that the fluid path flows from the bottom of the flow cell to the top, for example, the inflow port is at the bottom of the cell and the outflow port is at the top of the cell. Since the air bubbles that can be introduced are buoyant, they quickly float to the outflow port without obstructing the illumination window. Bubbles are raised to the surface of the liquid by its density being lower than that of the liquid.
- the substrate directly bonded or fixed to the mold, fine particles directly or indirectly bonded to itself (for example, bonded to the substrate by covalent bonding or non-covalent bonding), or half bonded or fixed to the substrate.
- a substrate having fine particles immobilized in or on a solid support is perpendicular to the flow cell, that is, the largest planar surface of the substrate is perpendicular to the installation surface.
- Install as follows. The following two methods can be considered as a configuration in which the flow cells are arranged vertically. In the following two methods, the portion near the objective lens 14 in the configuration of FIG. 4 was enlarged. However, it can also be applied to other systems such as the prism type total reflection microscope of FIG. The first is a configuration in which the stage itself is vertical as shown in FIG. 10a. In this configuration, the stage 32 required for scanning the flow cell plane is an XY stage.
- an XYZ stage can be assembled in place of the XY stage, or a stage corresponding to the Z direction can be installed in the objective lens 14.
- the flow chamber 9 is installed on the side opposite to the objective lens 14.
- the material of the flow chamber 14 is not limited and an opaque material ( A metal such as aluminum or SUS can be used.
- the temperature can be adjusted by connecting a heater or Peltier to the flow chamber 14. Note that the substrate 8 in FIG. 4 is omitted.
- a black circle between the flow chamber 9 and the stage 32 indicates bubbles or dissolved oxygen from the liquid feeding tube.
- the second is a configuration in which a flow cell holder for supporting the flow cell is vertically arranged on an XYZ stage arranged horizontally as shown in FIG. 10b.
- the stage required to scan the flow cell plane is an XZ stage.
- an XYZ stage can be assembled in place of the XZ stage, or a stage corresponding to the Y direction can be installed in the objective lens.
- the microparticles are immobilized in or on the support or substrate so that they are maintained in a substantially fixed position relative to each other, thereby providing sequential image acquisition and image registration. Becomes easier.
- the flow cell instead of placing the flow cell vertically, can be tilted to dissipate bubbles from the top surface of the flow cell.
- the following two methods are conceivable as the configuration in which the flow cell is arranged in an inclined manner.
- the first is a configuration in which the stage itself is tilted as shown in FIG. 10c.
- the stage required to scan the flow cell plane is an XY stage.
- an XYZ stage can be assembled in place of the XY stage, or a stage corresponding to the Z direction can be installed in the objective lens.
- the angle at which the stage is inclined is desirably about 20 °, but is not limited thereto.
- the second is a configuration in which a flow cell holder for supporting the flow cell and an objective lens are inclinedly arranged on an XYZ stage arranged horizontally as shown in FIG. 10d.
- the stage required to scan the flow cell plane is an XZ stage.
- an XYZ stage can be assembled instead of the XZ stage, or a stage corresponding to the flow cell plane can be installed in the objective lens.
- the microparticles are immobilized in or on the support or substrate so that they are maintained in a substantially fixed position relative to each other, thereby providing sequential image acquisition and image registration. Becomes easier.
- the flow cell instead of vertically or tilting the flow cell, it is possible to place the flow cell horizontally.
- the following three methods are conceivable as a configuration in which the flow cells are horizontally arranged.
- the first is a configuration in which the stage and the flow cell are horizontally arranged as shown in FIG. 10e.
- the stage required to scan the flow cell plane is an XY stage.
- an XYZ stage can be assembled in place of the XyY stage, or a stage corresponding to the Z direction can be installed in the objective lens. Bubbles can be removed by flowing a liquid through the flow cell.
- the stage and the flow cell are horizontally arranged, and the height of the upper surface of the flow cell through which the liquid flows is inclined with respect to the stage surface. Thereby, bubbles can be removed.
- the inclination angle is preferably about 20 °, but is not limited thereto.
- the stage required to scan the flow cell plane is an XY stage.
- an XYZ stage can be assembled in place of the XY stage, or a stage corresponding to the Z direction can be installed in the objective lens.
- Bubbles can be removed by flowing a liquid through the flow cell.
- the stage and the flow cell are horizontally arranged, and the height of the upper surface of the flow cell through which the liquid flows is inclined with respect to the stage surface.
- the inclined position is limited to a region that does not affect detection such as fluorescence detection. Thereby, bubbles can be removed.
- the inclination angle is preferably about 20 °, but is not limited thereto.
- the stage required to scan the flow cell plane is an XY stage.
- an XYZ stage can be assembled in place of the XY stage, or a stage corresponding to the Z direction can be installed in the objective lens.
- Bubbles can be removed by flowing a liquid through the flow cell.
- 11a to 11c are top views in which the height of the upper surface of the flow cell 9 through which the liquid flows is inclined with respect to the stage surface in a region that does not affect detection such as fluorescence detection. The figures are only examples and are not limited to these. In any of the drawings, the hatched portion including the reagent inlet (shown by a black circle) and the outlet (shown by a white circle) is inclined so that bubbles can be discharged.
- the flow cell of the invention can be used for any of a variety of purposes, including but not limited to analytical methods (eg, nucleic acid analysis methods such as sequencing, hybridization assays; protein analysis methods, binding assays, screening assays, etc.). .
- the flow cell can also be used to perform synthesis, for example, to create a combinatorial library.
- the flow cell is mounted on an automatic temperature control stage and connected to a liquid handling system (eg, a syringe pump with a multi-port valve).
- the stage accommodates multiple flow cells to allow one flow cell to be imaged while other reaction steps, such as extension, reaction, washing, etc. are performed in another flow cell. To do. This approach maximizes the use of expensive optical systems and increases throughput.
- the maximum number of flow cells that can be processed simultaneously is determined by the time required to detect one substrate and the reaction process time.
- the fluid line is equipped with optical and conductivity sensors for detecting air bubbles and for monitoring reagent usage. Temperature control and sensors in the fluidics system maintain the reagent at a suitable temperature for long-term stability, but do not increase at or above the working temperature when entering the flow cell, during the annealing, ligation and cutting process It is ensured that temperature fluctuations are avoided.
- the reagent is preferably preloaded in the kit to avoid false loads.
- the optical device two CCD cameras are included in FIG. 1, and an image dispersed by a dispersion prism is taken.
- the number of CCD cameras may be prepared as many as the number of spectral directions by the dispersive prism, and the number can be reduced depending on the optical element.
- the dispersion from the dispersion prisms 17a and 17b in FIG. 1 is condensed on the central axis of the field of view (dotted line in FIG. 1)
- the CCD cameras 19a and 19b are combined into one, and the condenser lenses 18a and 18b are also combined.
- information distributed in two directions is detected by one CCD.
- the illumination optical device is designed to avoid multiple illumination around the field of view so that only the area imaged by the image sensor is illuminated. possible.
- the CCD sensor is square (square), and the excitation light (for example, laser light) is circular. If the entire surface of a CCD sensor having a square shape is irradiated with a circular beam, the ratio of illumination to parts other than the CCD sensor is as follows: Thus, about 14% of illumination is generated in each of the adjacent visual fields on the top, bottom, left and right. This ratio increases as the diameter of the excitation light is larger than the diagonal length of the CCD sensor.
- the excitation density distribution of excitation light is strongest at the center and weaker toward the periphery, so the beam diameter needs to be larger than the diagonal length of the CCD.
- the ratio of the multiple illuminations before detection is at least 28% (14 ⁇ 2) of the entire visual field.
- the laser 101 is reflected by the dichroic mirror 34 through the slit 33 corresponding to the shape of the CCD sensor 19, passes through the objective lens 14, and is irradiated onto the substrate 8. Since the laser 101 is incident on the substrate 8 at an angle at which total reflection occurs (about 68 ° in the case of glass and water), the shape of the excitation light after passing through the slit 33 is formed by cutting the excitation light 101 into a ring at the total reflection angle. Sometimes the shape is matched with the shape of the CCD sensor 19. The excited fluorescence passes through the objective lens 14 and the dichroic mirror 34 again and is detected by the CCD sensor 19. Since the excitation light matched to the shape of the CCD sensor can be irradiated, the above-described multiple illumination can be avoided.
- the position of the slit 33 is preferably close to the substrate 8, but is not limited thereto.
- an optional optical filter may be installed as necessary.
- a filter for adjusting the fluorescence intensity of the four-color phosphor is installed at the position of the parallel light beam before the dispersion prisms 17a and 17b or the back of the dispersion prism.
- Wavelength dispersion can be performed after the fluorescence intensity is made uniform. Thereby, the intensity
- FIG. 3L when the detection is performed by a specific pixel having chromatic dispersion from two lattice points, it is possible to identify how many phosphor signals are provided if the fluorescence intensities of the respective phosphors are equal.
- the pixel of (a, b) A fluorescence signal derived from guanine is measured.
- the intensity of the four-color phosphor in advance, for example, if the ratio of the fluorescence intensity of guanine to the fluorescence intensity of cytosine is 1: 1, if the fluorescence intensity is 2 in the pixel (a, b), cytosine and guanine It can be seen that both are derived. This ratio need not be 1: 1. For example, by shifting the fluorescence intensity ratio of adenine, guanine, cytosine, and thymine at a constant ratio such as 1: 2: 3: 4, the base sequence can be more easily specified.
- the wavelength characteristics of the filter that adjusts the fluorescence intensity of the four-color phosphor can be determined by the phosphor capture efficiency of the template, the phosphor wavelength, the molar extinction coefficient of the phosphor, etc. It is possible. A plurality of such optical filters can be mounted on the turret and used while switching as necessary.
- the intensity of the fluorescence signal that has been dispersed in different directions may be adjusted as necessary.
- the fluorescence signals dispersed by the dispersion prisms 17a and 17b can be adjusted by placing an ND filter in front of or behind the condenser lenses 18a and 18b.
- the fluorescence intensity ratio detected by the CCD sensors 19a and 19b can be changed by shifting the position of the dispersion angle intersection of the dispersion prisms 17a and 17b to the left and right from the center of the visual field (dotted line in FIG. 1). Accordingly, for example, in FIG.
- the lattice point (a + 1, b) may be thymine.
- This is information for determining the base sequence.
- the intensity ratio of fluorescence signals dispersed in different directions or changing the fluorescence intensity ratio for each phosphor it is detected by a CCD sensor and is detected between different images (for example, multiple images acquired by right-side dispersion).
- the phosphor can also be identified from the comparison in (image comparison). For example, in FIG.
- the optical filter for blocking the fluorescence wavelength of thymine in the left side dispersion with the turret and detecting it with the CCD sensor even in the same left side dispersion image, 7: 6 at the lattice point (a-2, b).
- the ratio of the fluorescence intensity is 7: 3, and it is easy to identify that the lattice point (a, b) is guanine and the lattice point (a + 1, b) is thymine.
- the dispersion distance of the phosphor can be changed. For example, it can be realized by setting the dispersion angle of the dispersion prism in FIGS. 1 and 4 to a different angle, adding a dispersion prism, or using a beam expander. A plurality of dispersion prisms can be arranged on the turret to achieve different dispersion distances.
- the right side dispersion is the lattice point (a + 2, b) and the left side dispersion is the lattice point (a ⁇ 2, b) with a fluorescence intensity ratio of 7: 3.
- this ratio is 7: 6
- it is suspected that another lattice point detected at the lattice point (a ⁇ 2, b) by left side dispersion for example, the lattice point (a + 1, b) is thymine.
- thymine is dispersed into the pixels on the left side of cytosine, and the distance can be known in advance by setting the dispersion angle or the like. Therefore, it is easy to identify that the lattice point (a, b) is guanine and the lattice point (a + 1, b) is thymine.
- temporal variation in the fluorescence intensity of the phosphor can be used. As can be seen from the examples of FIGS. 1 and 4, this can be realized because the fluorescence (parallel light flux) at a certain moment is dispersed in different dispersion directions.
- the fluorescence signal is measured again after a certain period of time, even when excitation light continues to be emitted, and becomes zero. A phenomenon called blinking occurs. It is known that blinking is more likely to occur as the excitation light intensity is higher, and that there is a difference depending on the phosphor.
- blinking can be suppressed by placing a scavenger reagent such as ⁇ -mercaptoethanol in the phosphor, but it is difficult to completely suppress it.
- Blinking is a major issue in measurement of a single molecule.
- the method of determining the incorporated base while capturing fluorescent molecules in a single molecule template in real time without stopping the elongation when the same fluorescent signal flashes, blinking occurs and the phosphor again transmits the fluorescent signal. It is difficult to distinguish whether it has occurred or has been taken multiple times with the same base sequence.
- the right side dispersion is the lattice point (a + 2, b) and the left side dispersion is the lattice point ( Detected at a-2, b) at a fluorescence intensity ratio of 7: 3.
- the lattice point (a, b) is derived from cytosine.
- the fluorescence intensity of the right-hand dispersion becomes half and the fluorescence intensity of the left-hand dispersion becomes 0 at a certain moment, one phosphor [(a, b) is detected in the right dispersion (a + 2, b). ), It is presumed that there are a plurality of them. This can be applied even to an assembly of multimolecular phosphors (for example, when a plurality of identical templates are fixed to minute beads by emulsion PCR or the like). If necessary, the spectral direction of the prism can be changed. For example, when an image is acquired by a CCD sensor while changing the dispersion direction by 360 °, a circle centered on the lattice point can be drawn, which makes it easier to identify the phosphor present at the lattice point.
- the right side dispersion is the lattice point (a + 2, b) and the left side dispersion is the lattice point (a ⁇ 2, b) with a fluorescence intensity ratio of 7: 3.
- this ratio is 7: 6
- it is suspected that another lattice point detected at the lattice point (a ⁇ 2, b) by left side dispersion for example, the lattice point (a + 1, b) is thymine.
- the position of the CCD sensor or condenser lens is moved and detected accordingly, or the dispersion direction is changed continuously (dispersion prism toward the intersection of dispersion angles)
- Concentric circles centering on the lattice points can be observed by using the prisms of the above structure or conical dispersion prisms having vertexes at the intersections of the dispersion angles.
- the lattice point (a, b) is guanine, a circle with a radius of 1 pixel centering on the lattice point (a, b), and if the lattice point (a + 1, b) is thymine, the lattice point (a + 1, b) It is possible to draw a circle with a radius of 3 pixels centering on, making it easy to identify. Also, depending on the shape of the dispersion prism, an ellipse can be drawn instead of a circle centered on the lattice point, making it easier to identify the base. Further, instead of the dispersion prism, a stage on which the substrate is placed may be rotated. In this case, a circle centered on the rotation center of the stage can be drawn instead of a circle centered on the lattice point. From the above, it is understood that the methods described above can be performed in combination.
- the shape of the dispersion prism can be changed as necessary.
- FIG. FIG. 13 shows the structure around the dispersion prism of FIG. 1 or FIG.
- the shape of the dispersion prism 17 may be the same in the direction perpendicular to the paper surface (in the case of FIG. 13a, the dispersion is in four directions, so the number of lenses and CCDs is increased), or around the dotted line at the center of the field of view. It may be a rotated shape (in the case of FIG. 13a, it is a mortar-shaped shape toward the dispersion angle intersection).
- the dispersion prism intersection (dispersion angle intersection) of the dispersion prisms 17a and 17b is at the center of the visual field.
- the parallel light beam is divided into two by the dispersion prism, and the fluorescence intensity ratio at the CCD sensor is 1: 1.
- the fluorescence intensity becomes half that when not dispersing.
- FIG. 13B shows an arrangement in which the center of the visual field and the dispersion prism intersection (dispersion angle intersection) of the dispersion prisms 17a and 17b are shifted. Thereby, the fluorescence intensity ratio in the CCDs 19a and 19b can be changed.
- FIG. 13c shows a prism arrangement in which the central part of the parallel light beam is not dispersed.
- FIG. 13d shows a dispersion prism shape changed to reduce the number of CCDs.
- the right-side dispersion image and the left-side dispersion image are temporally different images, so that even if there is a phenomenon such as blinking, it may be detected only in the dispersion image in one direction. It can be corrected by switching the shutter at high speed, but it is not perfect. However, when many phosphors exist at the same lattice point, the number of CCDs can be reduced, which is an effective method.
- FIG. 13f shows an arrangement in which the center of the field of view and the dispersion prism intersection (dispersion angle intersection) of the dispersion prism 17 are shifted as in FIG. 13b. By combining the shutter of FIG. 13e, the fluorescence intensity ratio at the CCD 19 can be changed.
- the throughput of the sequencing system is mainly defined by the number of images that the device can deliver per day and the number of nucleotides (bases) of sequence data per image.
- the device is preferably designed such that the camera is kept in operation at all times and the calculation is based on 100% camera utilization.
- each bead is imaged in four colors to determine the identity of one base, either four images with one camera, two images with two cameras, or one image with four cameras are used. obtain. Imaging with multiple CCD sensors provides more chromatic dispersion information than one alternative to other CCD sensors, and the preferred system uses this approach.
- the stage moving time for three (three colors) and the exposure time for three (three colors) having a short exposure time is because signals for the remaining three colors can be obtained by exposing the field of view with the exposure time of the fluorescent dye having the longest exposure time.
- one image may be used to determine the entity of one base, the image alignment is unnecessary, and the memory capacity for storing the remaining three images is unnecessary.
- the process in the dispersion-1 CCD system will be described below, but the process is not limited to this. First, the fluorescently labeled beads fixed in the flow cell are detected, and the positions of all the beads in the flow cell are specified.
- the bead position is specified by acquiring a scattered image instead of fluorescence.
- the position where the four color fluorescent dyes transmitted through the dispersion prism are detected is detected with respect to the fluorescently labeled beads. Since the detection position changes according to the fluorescence wavelength by transmitting the dispersion prism, it is possible to specify which fluorescent dye has been detected among the four colors by obtaining the displacement amount with respect to the specified bead position. . Since the position where the beads shine changes depending on the fluorescent dye, if alignment of the image is difficult, a marker for image alignment (an object whose position does not change) can be installed as necessary.
- a template that takes in only the same fluorescent dye for example, a template that takes in all adenine
- a cross mark or irregularities can be provided in the substrate.
- the displacement of the detection position by using the dispersion prism is defined by the angle of the dispersion prism and the distance from the dispersion prism to the CCD sensor detection surface. Therefore, when the dispersion interval of the four colors of the fluorescent dye is larger than the average interval at which the beads are arranged, it cannot be determined which bead fluorescence is detected. Therefore, it is necessary to make the dispersion interval of the four colors smaller than the average interval of the beads.
- the following can be considered as a method for increasing the throughput in the dispersion-1 CCD system.
- the beads are not arranged randomly but on the array.
- the dispersion interval By setting the dispersion interval to be equal to or less than the distance between adjacent beads, the throughput can be improved.
- the beads are arranged randomly, it is impossible to determine which bead fluorescence is detected because the bead interval is smaller than the dispersion interval of the four colors when the bead interval is small, and the bead interval is large.
- the bead interval is sufficiently larger than the dispersion interval of the four colors, so that the throughput is inferior. Therefore, more preferably, the beads are placed on the array.
- the beads By setting the dispersion intervals of the four colors to the minimum values that can be identified, the beads can be arranged in the most dense manner, so that the throughput is the highest.
- the permissible dispersion interval becomes wide depending on the angle at which the array is arranged. This can also be understood from the fact that, when beads are arranged at the vertices of a square, for example, if the dispersion is performed on a diagonal line, the allowable dispersion interval becomes twice the root.
- the dispersion direction can be changed by rotating the dispersion prism. For example, by measuring by changing 180 °, the average value matches the original bead, so that the reliability is increased. Further, by changing the dispersion direction by 45 °, four colors can be determined even with an array of 1 bead / 3 ⁇ 2 pixels.
- a locus of concentric circles centering on the beads can be drawn, and the base can be identified. If it is difficult to rotate the prism, it is possible to prepare a plurality of prisms and perform the same function by switching the optical axis with a mirror, a shutter or the like.
- a concentric circle is formed by combining images in the dispersion direction of the prism, and the fluorescent dye is identified.
- the fluorescent dye can be identified even when the dispersion interval of the four colors is larger than the bead interval, the bead density can be increased and the throughput is further increased. Further, the distance for dispersing the four-color fluorescent dyes can be widened, and the discrimination ability of fluorescent dye identification is improved.
- the fluorescence intensity of the fluorescent dye having the largest dispersion is reduced by the rotation of the dispersion prism. Therefore, it is necessary to measure by rotating and stopping the dispersion prism, or while rotating at a speed that can be detected.
- the throughput can be improved by detecting under the condition that one color having the longest dispersion distance is not detected.
- overlapping pixels can be used for dispersion, so that the throughput is further increased.
- filter switching-1 CCD system there is a system (filter switching-1 CCD system) in which the filters of four color fluorescent dyes are switched at high speed and detected by one CCD sensor.
- the filter switching-1 CCD system the time required for moving the visual field for detecting the fluorescent dyes for the three colors can be eliminated, so that the throughput is improved.
- throughput can be improved by preventing detection of one color having a long exposure time.
- a dispersion-2 CCD system or the like can be considered as a combination of the above.
- the imaging optics can consist of a standard infinity corrected microscope objective and standard beam splitters and filters. A standard 2,000 ⁇ 2,000 pixel CCD camera can be used to acquire the image.
- the system incorporates a suitable mechanical support for the optical device.
- the illumination intensity is preferably monitored and recorded for later use by analysis software.
- a high speed autofocus system is preferably used for the system to quickly acquire multiple images (eg, approximately 1000 or more non-overlapping image fields in the exemplary embodiment).
- Autofocus systems based on analysis of the image itself are well known in the art. This generally requires at least 5 frames for a single focusing event. This is both slow and expensive in that extra illumination is required to acquire the focusing image.
- an alternative autofocus system is used, such as a system based on an independent optical device that can focus as fast as the mechanical system can respond.
- Such a system is known in the art, and includes, for example, a focusing system (which realizes submicron focusing) used for a CD player.
- the system is operated remotely.
- Scripts for executing specific protocols can be stored in a central database and downloaded for each sequencing run.
- Samples can be barcoded or RFID tagged to maintain sample tracking integrity and association between sample and final data. Real-time central monitoring enables quick resolution of process errors.
- images collected by the device are immediately uploaded to the central multiterabyte storage system and one or more processor banks. Using tracking data from a central database, images are analyzed by processor (s) and sequence data is generated, optionally, for example, background fluorescence levels and bead density to adjust instrument performance. And other metrics are processed.
- the control software is used to properly sequence the pump, stage, camera, filter, temperature control, and to annotate and store image data.
- a user interface is provided, for example, to assist the operator in setting up and maintaining the equipment, preferably the ability to align the stage for slide loading / unloading and fluid line priming Is included.
- a display function may be included to show the operator various execution parameters such as temperature, stage position, current status of optical filter configuration, execution protocol status, and the like.
- an interface to a database that records tracking data such as reagent lots and sample IDs is included.
- the present invention also provides a computer readable medium for storing information obtained by applying the sequencing method of the present invention.
- Information includes raw data (ie, data that has not been further processed or analyzed), processed or analyzed data, and the like.
- the data includes images and numerical values.
- the information can typically be stored in a database, i.e., a collection of information (e.g., data), arranged for easy retrieval, e.g., stored in computer memory.
- Information includes, for example, sequences and arbitrary information on sequences (for example, partial sequences), comparison between sequences and reference sequences, results of sequence analysis, genome information, for example, polymorphism information (for example, a specific template Linkage information (ie, information about the physical position of a nucleic acid sequence within a chromosome relative to another nucleic acid sequence), disease-related information (ie, the presence of a disease or And information relating the subject's susceptibility to a disease with a physical trait of the subject, for example, an allele of the subject).
- the information can be related to sample ID, subject ID, and the like. Further information regarding the sample, subject, etc.
- the invention also includes a method that includes receiving any of the foregoing information in a computer readable form, eg, storing it on a computer readable medium.
- the method may further include providing diagnostic, prognostic or predictive information based on the information, or simply providing information stored on a computer readable medium, preferably to a third party.
- An exemplary automated sequencing system of the present invention that can be used to collect sequence information from one or more templates is described.
- the mold is placed on a substantially planar substrate, such as a glass microscope slide.
- the template can be bound to beads that are arrayed on a substrate.
- the cell may be sufficiently filled with air so that all reagents are ejected prior to each wash step.
- the flow cell allows delivery of air to the flow cell via a probe mixture labeled with four fluorophores, a cleavage reagent, any other desired reagent, enzyme parallelization buffer, wash buffer and a single port It is connected with the fluid handling part which has a syringe pump with a valve.
- the operation of the system is fully automated and can be programmed by control software using a dedicated computer having multiple I / O ports.
- the Cooke Sensicam camera incorporates a 1.3 megapixel cooled CCD, but cameras with lower or higher sensitivity can also be used. CCD sensors can also be used, eg, 4 megapixels, 8 megapixels, etc.).
- the flow cell uses a 0.25 micron stage and is 1 micron in shape.
- This example describes a representative method for acquisition and processing of images from an array of beads having labeled nucleic acids attached to them. Accurate feature identification and alignment is important for reliable analysis of each acquired image.
- a method for specifying the position of the grid point at the sub-pixel level for example, there is US / 20080003571, but it is not limited thereto.
- the cluster-type base sequence determination method as the number of bases for decoding increases, dephasing that causes a phase difference in the extension reaction occurs. This is because the probability that the fluorescent dye is incorporated into the template on the bead in the template is not 100%, so that the extension reaction shifts with each cycle.
- FIG. 14 shows the principle. As an example, a case where an AGCT sequence is read is shown. When the extension efficiency is 90%, 66% extends continuously for 4 bases, whereas 29% extends only 3 bases. For this 29%, the next extending base can be expected to be T, and 90% (0.29 ⁇ 0.9) of the reaction imperial family is extended, so this effect is excluded by software and sequence analysis is performed. The reading base length can be increased. Sequencing of the Invention It should be noted that the methods described herein can be implemented using a variety of different sequencing systems, image capture and processing methods, and the like.
- FIGS. 3E to 3L show that the base sequence can be determined when one grid point exists in 3 ⁇ 3 pixels.
- 5A to 5F show that the base sequence can be determined when one grid point exists in 2 ⁇ 2 pixels.
- the base sequence can be determined when one grid point exists in 1 ⁇ 1 pixel. If this is possible, it is obvious that the base sequence can be determined even when an arbitrary lattice point is removed from it, so that there is one lattice point of 2 ⁇ 2 or 3 ⁇ 3 pixels, or random
- the same method can also be applied to the case where there are grid points. The same method can be applied regardless of whether the dispersion distance is larger or smaller than four pixels.
- FIG. 15 is a schematic view of a part of the surface of the substrate 8, and a plurality of regions 8ij (lattice points) to which DNA is to be fixed are formed.
- the closest distance between the lattice points is 1 ⁇ m in both the X and Y directions, and when dispersed with 4 pixels (/ phosphor) in the X direction, the dispersion is 50 nm per pixel.
- FIG. 15A shows images taken by the two-dimensional sensor 19a or 19b of FIG. 1, respectively. Circles indicate the positions of the lattice points, and squares indicate one pixel of the CCD, and the coordinates of the CCD pixels are described for the number of pixels from 0 in each of the X and Y directions. However, since the CCD has 1000 ⁇ 1000 or 2000 ⁇ 2000 pixels and all pixels cannot be described, the lower left portion of the CCD is shown in an enlarged manner. Since one grid point is arranged for 1 ⁇ 1 pixel, 4 million grid points can be detected at a time with a 2000 ⁇ 2000 CCD.
- (0, 0) is the lower leftmost pixel of the CCD.
- the chromatic dispersion directions are the positive direction and the negative direction of X, but are not limited thereto.
- the displacement amount from the lattice point of A is 0 pixel
- the displacement amount from the lattice point of G is 1 pixel
- the displacement amount from the lattice point of C is 2 pixels
- the displacement amount from the lattice point of T will be described as 3 pixels. Since the magnitude of dispersion is determined by the wavelength of the phosphor, the amount of displacement is determined by the phosphor modified with each base. Therefore, the relationship between the phosphor and the amount of displacement is not limited to the above.
- Such an optical arrangement can be realized by adjusting the angle of the dispersion prism, the distance between the prism and the CCD, and the CCD position.
- the number of chromatic dispersion pixels per phosphor may be one or more, the fluorescence intensity per pixel is small. Accordingly, the number of chromatic dispersion pixels per phosphor is desirably 3 pixels or less. However, it is not limited to this.
- pixels in which chromatic dispersion is strongly detected are painted in gray with respect to a specific dispersion direction (hereinafter, this point is substituted with a gray pixel). In actual measurement, pixels with high fluorescence intensity can be identified by calculating an approximate curve from the fluorescence intensity of neighboring pixels.
- FIG. 15A describes a case where all base sequences are the same with respect to the dispersion direction.
- FIG. 15A shows a case where all lattice points (a, 5) are adenine, all lattice points (a, 4) are guanine, all lattice points (a, 3) are cytosine, and all lattice points (a, 2) are thymine. .
- adjacent pixels corresponding to three grid points can be gray pixels. Therefore, the base sequence conditions in which (a, b) are gray pixels and non-gray pixels (hereinafter referred to as white pixels) are shown in FIG.
- FIG. 15C shows in gray the lattice points for writing the bases that are candidate sequences in FIG. 15B.
- the circled numbers 2 to 16 are the array combinations in the case of all the gray pixels.
- FIG. 15E shows an appropriate selection of possible sequence candidates when dispersed to the right. Since the white pixels are only (a, b), the right-hand side dispersion of (a, b) is an array of circle numbers 1. Therefore, in (a, b) in the middle of the figure, the row of circled numbers 1 is represented by black circles (final number circled number 1). All other coordinates are white pixels. Accordingly, it is necessary to select an arbitrary sequence candidate from circle numbers 2 to 16 and verify whether such a sequence can be taken. In FIG. 15E, for gray pixels, sequence candidates with all round numbers 2 were selected (final number circle numbers 2).
- the row of circled numbers 2 is represented by black circles, and for all coordinates, overlapping base candidates are represented by black circles in the base candidate (right side dispersion) column.
- (a-3, b), (a-2, b), (a-1, b) are adenine
- (a, b) is no lattice point or phosphor incorporation
- (a + 1, b) ) (A + 2, b), and (a + 3, b)
- (a + 4, b) to (a + 6, b) all sequences can be taken in the case of right-side dispersion.
- (a-3, b) is a circled number 2
- (a-2, b) is a circled number 2
- (a-1, b) is a circled number 2
- (a, b) is a circled number 1
- (a + 1, b) b) is a round number 2 or 8
- (a + 2, b) is a round number 2 or 7 or a round number 8 or 14
- (a + 3, b) is a round number 2 or 6 or 7
- FIG. 15D is obtained for both the right-side dispersion and the left-side dispersion if the sequence number is circle number 8, circle number 12, circle number 13, circle number 14, or circle number 16.
- Such a base sequence was designated as a “base candidate”.
- base candidates can also be obtained by combinations of other sequence candidates, and examples thereof are shown in FIG. 15G. There are combinations other than those shown here, but they are omitted here.
- the arrangement combinations of FIGS. 15E and 15F are shown in the column No. 1 of FIG. 15G. It can be seen that there are many other “base candidates”. Therefore, it is necessary to narrow down which sequence among these base candidates using another method.
- the sequence currently read is (a-3, b) -AAAGAAAA- (a + 3, b), which is the reference sequence shown in FIG. 15H.
- the bases detected by the right side dispersion and the left side dispersion are indicated by black circles.
- fluorescent signals derived from adenine and guanine are detected at the coordinates (a + 1, b), and black circles are displayed in the A and G columns.
- A is derived from the lattice point (a + 1, b)
- G is derived from the lattice point (a, b).
- the total value of the fluorescent bases detected in each pixel is shown in the “Total” column.
- the candidate sequence (a-3, b) -AAAGAAAA- (a + 3, b) of 3-1 is the base candidate to be obtained. Further, by setting the intensity ratio (dispersion rate) between the right side dispersion and the left side dispersion, an image of the pixel and fluorescence intensity corresponding to the base sequence shown in FIG. 15J can be obtained, and the base sequence can be easily specified. Furthermore, the reliability of base identification becomes high by using the method described in the sixth embodiment. As described above, the base sequence can be identified from the dispersed images in a plurality of directions. When the dispersion distance is 4 pixels, the distance between adjacent lattices is required to be 4 pixels in the examples of FIGS.
- the distance between lattices is 1 pixel in the examples of FIGS. 5A to 5F. Similar analysis can be realized. Therefore, the number of grid points that can be detected in one field of view is 16 times (4 ⁇ 4) / (1 ⁇ 1) in the examples of FIGS. 5A to 5F compared to FIGS. 3A to 3D. Many can be identified and throughput is improved.
- the fluorescent image emitted from a specific lattice point is dispersed in a plurality of chromatic dispersion directions, so that the phosphor can be identified and wavelength.
- the position of the dispersion target can be identified with high accuracy.
Landscapes
- Health & Medical Sciences (AREA)
- Immunology (AREA)
- Life Sciences & Earth Sciences (AREA)
- Chemical & Material Sciences (AREA)
- Engineering & Computer Science (AREA)
- Biochemistry (AREA)
- Analytical Chemistry (AREA)
- General Health & Medical Sciences (AREA)
- General Physics & Mathematics (AREA)
- Physics & Mathematics (AREA)
- Pathology (AREA)
- Molecular Biology (AREA)
- Biomedical Technology (AREA)
- Hematology (AREA)
- Urology & Nephrology (AREA)
- Nuclear Medicine, Radiotherapy & Molecular Imaging (AREA)
- Biotechnology (AREA)
- Cell Biology (AREA)
- Microbiology (AREA)
- Food Science & Technology (AREA)
- Medicinal Chemistry (AREA)
- Chemical Kinetics & Catalysis (AREA)
- Investigating, Analyzing Materials By Fluorescence Or Luminescence (AREA)
- Measuring Or Testing Involving Enzymes Or Micro-Organisms (AREA)
Abstract
DNA配列解析などのスループットが向上する、蛍光分析方法を提供する。 オリゴヌクレオチド等の生体関連分子が固定される基板に蛍光測定用の光を照射し、生じる蛍光を集光し、集光された光を分光し、2次元センサに光を結像させ、2次元センサにて蛍光検出する方法であって、異なる方向に波長分散を行い、それらを同時に検出することで、波長分散距離が格子間距離よりも長い場合でも、分光された波長毎の強度と分光対象物の位置を算定できる。
Description
本発明は、光分析装置に関し、例えば、DNA,RNA、又はタンパク質等の生体関連物質に光を照射して光分析する光計測・分析装置に関する。
従来から、基板の表面に配置された物体に対して励起光を照射して物体の形状を観察する方法が提案されている。例えば、特許文献1には、励起光源から出力された励起光を透明な基板に照射し、その内部で励起光を全反射させることにより、基板表面にエバネセント波を生成し、基板上の試料によるエバネセント波の散乱光を検出する装置が記載されている。ただし、特許文献1に記載の装置では散乱光を分光していない。
また、例えば、特許文献2には、エバネセント波で励起された試料成分からの蛍光及び散乱光を分光する装置が記載されている。ただし、特許文献2に記載の装置では試料成分が流路境界面に固定されていない。
一方、基板表面に複数の生体分子を固定し、特許文献1と同様に基板表面の一定範囲にエバネセント波を生成し、そのエバネセント波によって励起された生体分子の発光を画像化する装置がある。基板上に非蛍光性の生体分子を固定し、蛍光性の分子を含む反応液を基板上に流入させ、生体分子固定位置からの蛍光を観測するものである。これにより、生体分子と反応液中の分子との結合反応を観察することができる。例えば、はじめに基板に非修飾一本鎖のDNAを固定し、塩基種ごとに異なる蛍光体で修飾された蛍光修飾塩基を含む反応液を導入し、一本鎖DNAに対して相補な塩基を結合させながら、分子固定位置からの蛍光を分光すれば、固定されたDNAの配列を解読することが可能である。
近年、非特許文献2にあるように、基板にDNAなどを固定してその塩基配列を決定することが提案されている。基板表面にランダムに分析すべき試料DNA断片を1分子ずつ捕捉し、ほぼ1塩基ずつ伸長させて、その結果を蛍光計測より検出することにより塩基配列を決定するものである。具体的には、DNAポリメラーゼの基質として鋳型DNAに取り込まれてDNA鎖伸長反応を保護基の存在により停止することができ、かつ検出され得る標識を持つ4種のdNTPの誘導体(MdNTP)を用いてDNAポリメラーゼ反応を行わせる工程、次いで取り込まれたMdNTPを蛍光等で検出する工程、及びMdNTPを伸長可能な状態に戻す工程を1サイクルとし、それを繰り返すことにより試料DNAの塩基配列を決定する。本技術では、DNA断片を1分子ずつ配列決定することができるため、同時に数多くの断片を解析することができ、解析スループットを大きくすることができる。また、本方式では、単一DNA分子毎に塩基配列が決定できる可能性があるため、従来技術の問題であったクローニングやPCR等での試料DNAを精製,増幅が不要にできる可能性があり、ゲノム解析や遺伝子診断の迅速化が期待できる。なお、本方法では、分析すべき試料DNA断片分子が基板面にランダムに固定されるため、捕捉されたDNA断片分子数に対して数100倍の画素数を有する高価なカメラが必要となる。つまり、DNA断片分子同士の間隔が平均1ミクロンになるように調整した場合、より大きな間隔同士の分子もいれば、より近接した間隔の分子同士も存在し、これらを互いに分離して検出するには、基板面に換算して、より細かな間隔で蛍光像を検出する必要がある。通常、数10分の1の間隔で計測する必要がある。
また、一方、非特許文献3および特許文献3では、全反射エバネッセント照射検出方式よりも励起光照射体積の一層の低減が可能となるナノ開口エバネッセント照射検出方式によって、蛍光検出の感度を更に向上させている。2枚のガラス基板,ガラス基板Aとガラス基板Bを平行に配置し、ガラス基板Aのガラス基板Bと対面する側の表面に、径50nmのナノ開口を有する膜厚約100nmの平面状のアルミニウム薄膜を積層する。アルミニウム薄膜は遮光性能を有している必要がある。2枚のガラス基板の中間に反応槽を構成し、反応槽に溶液を充填することによって、2枚のガラス基板の間に溶液層を形成する。反応槽には溶液の注入口と排出口があり、注入口から溶液を注入し、排出口から溶液を排出させることで、溶液をガラス基板およびアルミニウム薄膜と平行方向にフローさせることができる。これにより、溶液層の溶液を任意の組成に交換することが可能である。Arイオンレーザから発振した波長488nmの励起光を、ガラス基板Bと反対方向より、ガラス基板Aに対して垂直に、対物レンズで絞って照射すると、ナノ開口内部の底平面近傍の溶液層に励起光のエバネッセント場が形成され、それ以上先の溶液層内部に励起光が伝播することはない。一方、蛍光発光は、前記対物レンズを用いて2次元CCD上に結像することによって検出される。エバネッセント場では、励起光強度がナノ開口底平面から離れるに従って指数関数的に減衰し、ナノ開口底平面から30nm程度の距離で励起光強度が1/10となる。更に、ナノ開口エバネッセント照射検出方式では、全反射エバネッセント照射検出法と異なり、ガラス基板と平行方向の励起光照射幅が開口径すなわち50nmに限定されるため、励起光照射体積が一層低減される。このため、遊離の蛍光体の蛍光発光や水のラマン散乱を始めとする背景光を飛躍的に低減することが可能となる。その結果、より高濃度の遊離の蛍光体存在下で、対象とする生体分子に標識された蛍光体だけを選択的に検出することが可能となり、非常に高感度な蛍光検出を実現できる。本文献では、以上の蛍光検出方式をDNA分子の伸長反応によるdNTPの取り込み計測に応用している。
以降では、試料成分固定面のように、エバネッセント場が開始される平面をエバネッセント場境界平面と呼ぶ。
Nature Vol. 374, 555-559 (1995).
Proc. Natl. Acad. Sci. USA, vol.100, pp3960, 2003
SCIENCE 2003, Vol.299, pp. 682-686.
Proc. Natl. Acad. Sci. USA, vol.102, pp5932, 2005
基板表面上に固定された生体分子の蛍光を画像化することにより生体分子を分析する装置においては、一般に基板上の個々の固定された領域(スポット)ごとに異なる種類の生体分子を固定し、各スポットからの蛍光を画像化によって分離して検出する。できる限り短時間で多数種の生体分子を分析し、また、消費される試薬量を低減するには、スポットは光学的に分解可能な範囲でできる限り基板上に高密度に生体分子を固定化するのが好ましい。また、1スポットあたりの試薬消費量を低減するためには、1スポット内に固定化する生体分子数は少ないほど好都合であり、1分子が理想的である。非特許文献1に記載されているように、蛍光検出法は1分子をも検出する感度を有しているけれども、少数分子からの蛍光を分光検出して良好なS/Nを得るには、損失の少ない分光イメージング法が好ましい。したがって、プリズムや回折格子などの分散素子による分散分光イメージング法、もしくはダイクロイックミラーで分光して複数のイメージセンサで画像を取得する方法(ダイクロ/マルチセンサ分光イメージング法)が好ましい。
上記複数のスポットは光学的に分解可能な範囲でできる限り基板上に高密度に配置するのが好ましいが、ダイクロ/マルチセンサ分光イメージング法では、使用する蛍光標識物の種類の数だけイメージセンサが必要になるため、検出装置のコストが高くなるという問題がある。また、蛍光像をダイクロイックミラーなどで分割するため、S/Nが必ずしも大きくならない場合も多い。分散分光イメージング法にすれば、最小限の(たとえば1個)のイメージセンサで検出できるというメリットがあるが、スポット同士の間隔が狭くなると、スポットから発する蛍光を波長分散させた蛍光像が近接する別のスポットの蛍光像と重なってしまう。別のスポットの蛍光像と重ならない方向へ波長分散させることで、画素を有効に使う方法もあるが、どの角度に波長分散させたとしても、必ず別スポットと重なってしまうため、分散させる距離にはおのずと限界がある。従って蛍光検出精度を向上させるには、基板上に生体分子を固定化したスポットの間隔を広くしなければならなくなり、高密度化しにくいという問題があった。
また従来の光学系においては、生体分子が基板上にランダムに固定された場合、基板上のスポット数に対して、数100倍以上の画素数が必要であり、検出速度が低下すると共に、高価な2次元センサが必要になるという問題点があった。さらに、また、より高解像度で蛍光像を検出しなければならないため、開口数NAの大きな集光レンズを使う必要があり、高価な系になるという問題点があった。
本発明の目的は、少ない画素数で効率よく画像を検出する方法に関する。例えば、基板上に捕捉するDNA断片の分子からの蛍光像を2次元センサにて蛍光検出する際、少ない画素数で、効率よく検出する方法を提供することに関する。また、例えば基板上に固定化して捕捉するDNA断片の分子からの蛍光像を2次元センサにて蛍光検出する際、安価に、または操作性の良い検出方法を提供することに関する。
本発明は、複数の測定対象物を精密配置し、複数の検出画素を備えた検出器の特定画素に各測定対象物をそれぞれ結像させることに関する。オリゴヌクレオチド等が固定される基板に蛍光測定用の励起光を照射し、生じる蛍光を集光し、集光された光を分光し、センサに光を結像させ、2次元センサにて蛍光検出する方法であって、該基板には、オリゴヌクレオチド等が固定される領域が複数設けられ、それらが基板上に配置され、波長分散を行い、該波長分散とは異なる波長分散条件で波長分散を行い、分光された波長ごとの強度と分光対象物の位置を算定することを特徴とする。本発明の特徴は、以下本発明を実施するための最良の形態および添付図面によって明らかになるものである。
本発明により、例えば、測定すべきオリゴヌクレオチドが固定されるべき領域に対して、必要な2次元センサの画素数は、測定精度を損なわずに、従来の数100倍から、10倍以下と少なくすることができ、効率よく検出することができる。そのため、同じ2次元センサを使う場合、一時により多くの領域からの蛍光像を得ることができ、高スループットが達成できる。また、少ない画素数のカメラを使う場合には、より安価に測定できることになる。
また、本発明により、例えば、測定すべきオリゴヌクレオチドが固定された領域数が同じ場合、少ない画素数で、効率よく検出でき、2次元センサの価格を安価することができるようになる。また、光学分解能をオリゴヌクレオチドが固定される領域同士の間隔程度にすることができるため、大きな開口数の集光レンズを使う必要がなくなり、安価なレンズを使用することができ、液浸レンズも使う必要がないので、操作性が向上できる。
上記の課題に対して鋭意検討した結果、光学素子を用いて波長分散させて検出する操作を、複数の方向に対して行い、データ解析を行うことで、隣接するビーズとの距離よりも大きい分散距離であっても蛍光色素の同定と波長分散対象物の位置を算定できるとの結論に達し、本発明を完成するに至った。以下、本発明を実施の形態例により説明するが、本発明は本例に限定されるものではない。
〔実施例〕
以下、本発明を実施の形態例により説明するが、本発明は本例に限定されるものではない。
以下、本発明を実施の形態例により説明するが、本発明は本例に限定されるものではない。
<第1の実施形態>
基板表面に分析すべき試料DNA断片を1分子ずつ均等間隔で捕捉し、ほぼ1塩基ずつ伸長させて、取り込まれた蛍光標識を1分子ごと検出して塩基配列を決定する装置,方法について説明する。具体的には、DNAポリメラーゼの基質として鋳型DNAに取り込まれてDNA鎖伸長反応を保護基の存在により停止することができかつ検出され得る標識を持つ4種のdNTPの誘導体を用いてDNAポリメラーゼ反応を行わせる工程、次いで取り込まれたdNTP誘導体を蛍光等で検出する工程、及びdNTP誘導体を伸長可能な状態に戻す工程を1サイクルとし、それを繰り返すことにより試料DNAの塩基配列を決定する。なお、本操作は単分子蛍光検出法に基づくため、測定はHEPAフィルタを介したクリーンルーム様の環境にて行うことが望ましい。
基板表面に分析すべき試料DNA断片を1分子ずつ均等間隔で捕捉し、ほぼ1塩基ずつ伸長させて、取り込まれた蛍光標識を1分子ごと検出して塩基配列を決定する装置,方法について説明する。具体的には、DNAポリメラーゼの基質として鋳型DNAに取り込まれてDNA鎖伸長反応を保護基の存在により停止することができかつ検出され得る標識を持つ4種のdNTPの誘導体を用いてDNAポリメラーゼ反応を行わせる工程、次いで取り込まれたdNTP誘導体を蛍光等で検出する工程、及びdNTP誘導体を伸長可能な状態に戻す工程を1サイクルとし、それを繰り返すことにより試料DNAの塩基配列を決定する。なお、本操作は単分子蛍光検出法に基づくため、測定はHEPAフィルタを介したクリーンルーム様の環境にて行うことが望ましい。
(装置構成)
図1は、本発明の蛍光分析方法を使ったDNA検査装置の構成図である。装置は顕微鏡に類似する装置の構成であり、基板8に捕捉するDNA分子の伸長状態を蛍光検出にて測定する。
図1は、本発明の蛍光分析方法を使ったDNA検査装置の構成図である。装置は顕微鏡に類似する装置の構成であり、基板8に捕捉するDNA分子の伸長状態を蛍光検出にて測定する。
基板8は、図2に示すような構造をしている。基板8は少なくともその一部が透明材質でできており、材質としては合成石英などが使用できる。基板8には反応領域8aがあり、この部分は透明材質であり、この部分に試薬などが接触する。反応領域8a内にDNAが固定される領域8ijが複数形成されている。
DNAが固定される領域8ijを、反応領域8a内にアレイ状に整列させる場合について説明する。領域8ijの個々の大きさは直径1000nm以下であり、より好ましくは100nm以下である。この領域にはDNAを捕捉するための表面処理を施す。例えば領域8ijと、反応領域8a内の領域8ij以外の場所を、薄膜形成、エッチング技術などを用いて、領域8ijのみが表面処理剤が反応する材料で作製しておくことで、領域8ij上にのみ表面処理を施すことができる。その表面処理は、例えば、ストレプトアビジンを結合させておき、ビオチン標識したDNA断片を反応させることで、捕捉する。また、ポリTのオリゴヌクレオチドを固定化しておき、DNA断片の一端をポリA化処理して、ハイブリ反応にて捕捉することもできる。この際、DNA断片濃度が高い場合には個々の領域8ijに複数分子のDNAが入るが、DNA断片濃度を適当に調製することで、個々の領域8ijに単一分子のDNAのみが入るようにすることができる。なお、領域8ijをより小さくしていくことで、領域内に捕捉できる分子が1個になるようにすることができる。或いはビオチン化DNAをストレプトアビジン化ビーズに固定し、ビーズを反応領域8a内にばら撒くことでも、ビーズを領域8ijにアレイ上に配置することができる。或いはNature 437(7057):376-380に記載のエマルジョンPCRを用いて、同一のDNA配列を持つ鋳型が多数複製されたビーズを反応領域8a内にばら撒くことでも、ビーズを領域8ijにアレイ上に配置することができる。
次にDNAが固定される領域8ijを、反応領域8a内にランダムに整列させる場合について説明する。これは領域8ijと、反応領域8a内の領域8ij以外の場所が、例えばストレプトアビジンなどの同一の表面処理が施されている場合である。従ってこの場合には、領域8ijはDNAが固定された領域を指す。この場合、DNA断片濃度が高い場合にはDNAの固定密度は高くなるが、DNA断片濃度を適当に調製することで、DNAの固定密度は低くなり、単一分子のDNAを十分な光学分解能で識別できる固定密度にすることできる。或いはビオチン化DNAをストレプトアビジン化ビーズに固定し、ビーズを反応領域8a内にばら撒くことでも、ビーズをランダムに配置することができる。或いはエマルジョンPCRを用いて、同一のDNA配列を持つ鋳型が多数複製されたビーズを反応領域8a内にばら撒くことでも、ビーズをランダムに配置することができる。ビーズの大きさは2000nm以下であり、より好ましくは10~1000nmである。
以後アレイ状の基板について説明するが、ランダム配置された基板を計測する場合においても、以下に記述する方法を適用することができる。アレイ状の基板では、すべての領域8ijに単一分子のDNAが固定化されている場合、領域8ijの一部のみDNAが固定化されている場合がある。
一部のみDNAが固定化されている場合は、残りの領域8ijには固定化されておらず、空きの状態となる。なお、領域8ij同士の間隔dxは1ミクロン、間隔dyは3ミクロンとした。領域8ijはこのように、格子構造(2次元の長方格子構造)を形成し、その格子点の位置に領域8ijが配置される。このような、均等間隔の基板の作成法は、例えば、特開2002-214142号公報に記載の手法などで、作成する。なお、dx,dyは領域8ijの個々の大きさより大きく、4000nm程度以下が好ましい。基板の反応領域8aは76.2mm×25.4mmのスライドガラスの大きさとした。反応領域8aの大きさは、それより大きくても可であるし、例えば0.5mm×0.5mmの大きさのものを一定間隔で、1次元または2次元に複数個並べたようなものでもよい。なお、領域8ijには金属構造体を配置してもよい。金属構造体は半導体プロセスにて作成することもできる。電子線描画,ドライエッチング,ウェットエッチングなどが使用できる。金属構造体は、金,銅,アルミ,クロム等で、励起光の波長以下の大きさを有する形状であり、直方体,円錐,円柱,一部が突起状のものを有する構造などを使用する。
dNTPの蛍光標識として種々の蛍光体を使うことができる。たとえば、Bodipy-FL-510,R6G,ROX,Bodipy-650を使用し、これらそれぞれ異なる4種の蛍光体で標識された3′末端がアリル基で修飾された4種のdNTP(3′-O-allyl-dGTP-PC-Bodipy-FL-510,3′-O-allyl-dTTP-PC-R6G,3′-O-allyl-dATP-PC-ROX,3′-O-allyl-dCTP-PC-Bodipy-650)を使用する。
蛍光励起用のレーザ装置101a(Arレーザ,488nm:Bodipy-FL-510,R6G励起用)からのレーザ光をλ/4波長板102aを通して円偏光とする。蛍光励起用のレーザ装置101b(He-Neレーザ,594.1nm:ROX,Bodipy-650励起用)からのレーザ光をλ/4波長板102bを通して円偏光とする。両レーザ光をミラー104bとダイクロイックミラー104a(520nm以下を反射)で重ね合わせ、ミラー5を介して全反射照明用の石英製プリズム7に図のように入射面に垂直に入射し、DNA分子を捕捉した基板8の裏側から照射する。石英製プリズム7と基板8はマッチングオイル(無蛍光グリセリン等)を介して接触させており、レーザ光はその界面で反射することなく、基板8に導入される。基板8表面は反応液(水)で覆われており、その界面にてレーザ光は全反射し、エバネッセント照明となる。これにより、高いS/Nで蛍光測定が可能になる。
なお、基板の近傍には、温調器が配置されているが、図では省略した。プリズム7と基板8の間で、励起光が通過する領域が光学的に透明であるヒーターまたはペルチエを用いることで温調を行うことができる。励起光が通過する領域に穴が開いており、そのなかにマッチングオイルを満たした構造であっても良い。また、通常観察のため、プリズム下部よりハロゲン照明ができる構造としているが、図ではこれを省略している。
また、レーザ装置101a,101bとは別にレーザ装置100(YAGレーザ,355nm)を配置し、ダイクロイックミラー103(400nm以下を反射)でレーザ装置101a,101bのレーザ光と重ね合わせ同軸にして照射できるようにした。本レーザは、取り込まれたdNTP誘導体の蛍光検出後、dNTP誘導体を伸長可能な状態に戻す工程に使用するものである。
基板8の上部には、試薬などを流し、反応させるためのフローチャンバ9が構成されている。チャンバには試薬導入口12があり、分注ノズル26を有する分注ユニット25,試薬保管ユニット27,チップボックス28により、目的の試薬液の注入などを行う。試薬保管ユニット27には、試料液容器27a,dNTP誘導体溶液容器27b,27c,27d,27e(27c,d,eは予備)及び洗浄液容器27f等が用意される。反応プロトコルに応じて、試薬の種類や数を増やすことができる。チップボックス28内の分注チップを分注ノズル26に取り付け、適当な試薬液を吸引し、チャンバ導入口から基板の反応領域に導入し、反応させる。廃液は廃液チューブ10を介して廃液容器11に排出される。これらは制御PC21により自動的に行われる。
フローチャンバは光軸方向に透明材で形成され、蛍光検出される。蛍光13は、自動ピントあわせ装置29で制御される集光レンズ(対物レンズ)14で集められ、フィルタユニット15で必要な波長の蛍光を取り出し、不必要な波長の光を除去する。対物レンズ14を通過した必要な波長の蛍光は、平行光束となって波長分散プリズム17a,17bで2方向に分光される。波長分散プリズムで分光することで、例えば4色同時検出が可能になり、1色ずつ検出する場合と比較してスループットが向上する。また1色ずつ検出する場合は、データ容量が増えるだけではなく、各蛍光体の画像を重ね合わせて解析する必要があるため、解析時間が長くなってしまう。その像を結像レンズ18a,18bで、2次元センサカメラ19a,19b(高感度冷却CCDカメラ)に結像させ、検出する。
カメラの露光時間の設定,蛍光画像の取り込みのタイミングなどの制御は、2次元センサカメラコントローラ20aを介して制御PC21が行う。フィルタユニット15には、レーザ光除去用のノッチフィルタ2種(488nm,594nm)、検出する波長体を透過させるバンドパス干渉フィルタ(透過帯域:510-700nm)を用いる。
なお、装置は、調整などのため、透過光観察用鏡筒16とTVカメラ23とモニタ24を備えており、ハロゲン照明などで基板8の状態をリアルタイムで観察できるようになっている。
プリズム17a,17bは図に示すように一体であってもよいし、別々のプリズムを近接、または一定距離離したものであっても良い。またプリズム17a,17bの分散角度は任意に設定でき、連続的に角度を変化させても良い。また平行光束に対して設置する角度は任意に設定できる。また平行光束の中心(プリズム上の点線)にプリズム17a,17bの分散角交点(プリズム上の点線とプリズムからの反射面の交点)を合わせる必要はない。平行光束の中心に分散角交点を合わせた場合、図1で2方向に分光される強度は等しくなる。分散角交点を平行光束中心からずらすことで、2方向に分光される信号強度の比率を変えることができる。この比率の違いを利用して、波長成分の信号強度の算定や、分光対象物の位置の特定を行うこともできる。また1方向へ波長分散した波長成分の信号強度で、もう1方向の波長分散した波長成分の信号強度を規格化することで、励起光源のふらつきなどノイズ成分を相殺できるため、S/Nは高くなる。また最大の2次元センサカメラの数は、分散方向の数になるが、光学素子を組み合わせることで、1つの2次元センサカメラにすることもできる。図1では、波長分散プリズム17a,17bにより光軸は傾くが、分散の異なるプリズムを複数枚組み合わせ、光軸が傾かないようにすることもできる。これにより1CCDで複数方向に分散させた画像を取得できる。
図2にあるように、基板8には位置きめマーカ30,31が刻印されている。マーカ30,31は領域8ijの並びと平行に配置され、その間隔が規定されている。そこで、透過照明での観測でマーカを検出することで、領域8ijの位置を計算することができる。平行光束が入射,反射する波長分散プリズム17a,17bの部分に誤って手が触れて汚れたり、マッチングオイルが付着するなどしてしまうと、乱反射などが起こり正しい蛍光強度が得られなくなる。このような場合には、必要に応じて平行光束が入射,反射する波長分散プリズム17a,17bの部分に触れないように、くぼみをつけておくか、平行光束が入射,反射しない部分に、平行光束が入射,反射する部分をくり貫いた治具を接着しても良い。
本実施例で使用する2次元センサカメラとして、CCDエリアセンサを使用した。画素サイズが7.4×7.4ミクロンで、画素数2048×2048画素の冷却CCDカメラを使用する。なお、2次元センサカメラとしては、CCDエリアセンサの他、C-MOSエリアセンサなどの撮像カメラなどを一般に使うことができる。CCDエリアセンサにも、構造によって、背面照射型,正面照射型があり、どちらも使用できる。また、素子内部に信号の増倍機能を有する電子増倍型CCDカメラなども高感度化を図る上で有効である。また、センサは冷却型が望ましく、-20℃程度以下にすることで、センサの持つダークノイズを低減でき、測定の精度を高めることができる。
反応領域8aからの蛍光像を一度に検出してもいいし、分割することもできる。この場合、基板の位置を移動させるためのX-Y移動機構部をステージ下部に配置し、制御PCで照射位置への移動,光照射,蛍光像検出を制御する。本例ではX-Y移動機構部は図示していない。
(反応の工程)
段階的伸長反応の工程を以下に示す。反応工程は非特許文献2および非特許文献4を参考に行った。ストレプトアビジンを加えたバッファを導入口12よりチャンバに導入し、ストレプトアビジンを金属構造体に固定されているビオチンに結合させ、ビオチン-アビジン複合体を形成させる。ビオチン修飾したターゲットである一本鎖鋳型DNAにプライマをハイブリさせ、前記鋳型DNA-プライマ複合体と大過剰のビオチンを加えたバッファをチャンバへ導入し、ビオチン-アビジン結合を介して、単分子の前記鋳型DNA-プライマ複合体を格子点に配置された金属構造体に固定する。固定反応後に、余剰な鋳型DNA-プライマ複合体およびビオチンを洗浄用バッファにてチャンバより洗い流した。次に、それぞれ異なる4種の蛍光体で標識された3′末端がアリル基で修飾された4種のdNTP(3′-O-allyl-dGTP-PC-Bodipy-FL-510,3′-O-allyl-dTTP-PC-R6G,3′-O-allyl-dATP-PC-ROX,3′-O-allyl-dCTP-PC-Bodipy-650)およびThermo Sequenaseポリメラーゼを加えたThermo Sequenase Reactionバッファを導入口12よりチャンバへ導入し、伸長反応を行った。鋳型DNA-プライマ複合体に取り込まれたdNTPは、3′末端はアリル基で修飾されているため、前記鋳型DNA-プライマ複合体に1塩基以上取り込まれることはない。伸長反応後、未反応の各種dNTPおよびポリメラーゼを洗浄用バッファで洗い流し、Arレーザ光源101a,He-Neレーザ光源101bのそれぞれの光源から発振するレーザ光を同時にチップに照射する。レーザ照射により鋳型DNA-プライマ複合体に取り込まれたdNTPに標識された蛍光体を励起し、そこから発する蛍光を検出する。鋳型DNA-プライマ複合体に取り込まれたdNTPに標識された蛍光体の蛍光波長を特定することにより、前記dNTPの塩基種を特定できる。なお、エバネッセント照射であり、反応領域表面近傍のみが励起光照射領域となるため、前記表面以外の領域に存在する蛍光体を励起することはなく、背景光の少ない測定ができる。そのため、上記では、伸長反応後洗浄しているが、蛍光標識dNTP濃度が小さい場合、洗浄不要で測定が可能になる場合もある。
段階的伸長反応の工程を以下に示す。反応工程は非特許文献2および非特許文献4を参考に行った。ストレプトアビジンを加えたバッファを導入口12よりチャンバに導入し、ストレプトアビジンを金属構造体に固定されているビオチンに結合させ、ビオチン-アビジン複合体を形成させる。ビオチン修飾したターゲットである一本鎖鋳型DNAにプライマをハイブリさせ、前記鋳型DNA-プライマ複合体と大過剰のビオチンを加えたバッファをチャンバへ導入し、ビオチン-アビジン結合を介して、単分子の前記鋳型DNA-プライマ複合体を格子点に配置された金属構造体に固定する。固定反応後に、余剰な鋳型DNA-プライマ複合体およびビオチンを洗浄用バッファにてチャンバより洗い流した。次に、それぞれ異なる4種の蛍光体で標識された3′末端がアリル基で修飾された4種のdNTP(3′-O-allyl-dGTP-PC-Bodipy-FL-510,3′-O-allyl-dTTP-PC-R6G,3′-O-allyl-dATP-PC-ROX,3′-O-allyl-dCTP-PC-Bodipy-650)およびThermo Sequenaseポリメラーゼを加えたThermo Sequenase Reactionバッファを導入口12よりチャンバへ導入し、伸長反応を行った。鋳型DNA-プライマ複合体に取り込まれたdNTPは、3′末端はアリル基で修飾されているため、前記鋳型DNA-プライマ複合体に1塩基以上取り込まれることはない。伸長反応後、未反応の各種dNTPおよびポリメラーゼを洗浄用バッファで洗い流し、Arレーザ光源101a,He-Neレーザ光源101bのそれぞれの光源から発振するレーザ光を同時にチップに照射する。レーザ照射により鋳型DNA-プライマ複合体に取り込まれたdNTPに標識された蛍光体を励起し、そこから発する蛍光を検出する。鋳型DNA-プライマ複合体に取り込まれたdNTPに標識された蛍光体の蛍光波長を特定することにより、前記dNTPの塩基種を特定できる。なお、エバネッセント照射であり、反応領域表面近傍のみが励起光照射領域となるため、前記表面以外の領域に存在する蛍光体を励起することはなく、背景光の少ない測定ができる。そのため、上記では、伸長反応後洗浄しているが、蛍光標識dNTP濃度が小さい場合、洗浄不要で測定が可能になる場合もある。
次に、YAGレーザ光源100より発振するレーザ光をチップへ照射し、前記複合体に取り込まれたdNTPに標識された蛍光体を光切断により取り除く。次いで、パラジウムを含んだ溶液を流路内に導入し、パラジウム触媒反応により、前記複合体に取り込まれたdNTPの3′末端のアリル基を水酸基に変える。前記3′末端のアリル基を水酸基に変えることにより、前記鋳型DNA-プライマ複合体の伸長反応が再開可能となる。前記触媒反応後に、洗浄用バッファにてチャンバを洗浄する。これを繰り返すことにより、固定された一本鎖鋳型DNAの配列を決定する。なお、レーザ光源の出力を上げるほど、得られる蛍光強度は増加する。従ってレーザの替わりにLEDを用いた装置構成にして出力を上げてもよい。LEDの場合、シャッターを用いずにON/OFFができ、また電磁波を発生しないなどの利点がある。但し蛍光体は強い強度で照射するほど、蛍光寿命は短くなる。
本システムでは、反応領域8aの複数の領域8ijからの発光を同時計測できるため、領域8ijにそれぞれ異なる鋳型DNAを固定した場合、前記複数の異なる鋳型DNA-プライマ複合体に取り込まれたdNTPの塩基種を、つまり複数の鋳型DNAの配列を同時に決定できる。
(蛍光の分散像検出)
図3は、基板の蛍光を波長分散して検出する方式の説明図である。図3Aは、基板8の表面の一部の概略図であり、DNAが固定されるべき複数の領域8ij(格子点)が形成されている。CCDカメラへの結像倍率を37倍とし、dx=1μmの距離を5分割してCCD画素で検出する。格子点の最も近接する間隔は1μmであり、その方向に分光させると、1画素あたり40nmの分散になる。
図3は、基板の蛍光を波長分散して検出する方式の説明図である。図3Aは、基板8の表面の一部の概略図であり、DNAが固定されるべき複数の領域8ij(格子点)が形成されている。CCDカメラへの結像倍率を37倍とし、dx=1μmの距離を5分割してCCD画素で検出する。格子点の最も近接する間隔は1μmであり、その方向に分光させると、1画素あたり40nmの分散になる。
図3Bのように最隣接している格子点ではなく、dy=3μmのため、3番目の距離で隣接する点(図中の8-32)の方向に分光すると、格子点間隔は3.6μmであり、1画素あたり11nmの分散になる。以上より分散距離を広く取ることで、500nm-700nmの範囲にある4種の蛍光体からの蛍光を識別しやすくなることがわかる。これは格子点間隔を広げるほど4種の蛍光体からの蛍光を識別しやすくなるが、格子点間隔を広げることはCCDの視野内に捉えられる領域8ij(格子点)の数が少なくなるため、鋳型DNAの配列決定のスループットが低下する。4種類の蛍光体の蛍光を識別するためには、1色の蛍光体を1画素ずつ分光させることが望ましい。500nm-700nmの200nm範囲にある4種類の蛍光体を4画素で分散させる場合には、1画素あたり50nm(200nm/4画素)以下であればよい。但しこの値に限定されるものではなく、識別したい蛍光帯の種類よりも少ない画素数(サブピクセル単位)で識別することも可能である。
図3Cは、DNAが固定されるべき複数の領域8ij(格子点)に金のナノ構造物を作成し、図3Bの方向に分光して検出したときの蛍光・発光スペクトルを示す。図では、格子点8-11と8-32からのスペクトルが検出されている。金のナノ構造体からはルミネッセンスが発生することが知られており、図のスペクトルはそれを示している。途中に強度が急激に小さくなっている部分があるが、これは、フィルタユニット15内の、594nmノッチフィルタにより、カットされているためである。この谷の位置を解析し、マーキングすることで、各格子点からの蛍光の波長軸を構成することができる。
図3DはdNTPを伸長反応させた後の蛍光スペクトルであり、蛍光体の蛍光に基づくピークが観察される。594nmの基準点を元に、蛍光ピークを算定することで蛍光体種を決定できる。図では、R6GとROXであり、塩基種がそれぞれ、T,Aと決定される。
図3E以降では、図1に示すように少なくとも2つ以上の分散方向を持たせた場合に、図3A~図3Dで説明した波長分散距離の制約となる格子間距離や格子配置の影響を受けないため、高密度にアレイを配置してCCD画素を有効に使用し、スループットが向上することについて説明する。
図3E~図3Lは、基板8の表面の一部の概略図であり、DNAが固定されるべき複数の領域8ij(格子点)が形成されている。CCDカメラへの結像倍率を22.2倍とし、dx=1μmの距離を3分割してCCD画素で検出する。格子点の最も近接する間隔は、X,Y方向共に1μmであり、X方向に4画素(/蛍光体)で分光させると、1画素あたり50nmの分散となる。
図3Eの図は、図1の19aまたは19bの2次元センサで撮影した画像をそれぞれ示している。丸が格子点の位置を、四角がCCDの1画素を示しており、CCDの画素の座標をX,Y方向それぞれに0から画素数分記載している。但しCCDは1000×1000や2000×2000画素で、全ての画素は記載できないため、CCDの左下の部分を拡大して示している。以降では、(a,b)はX=a,Y=bの座標を示す。例えば(0,0)はCCDの一番左下の画素である。また(4,2)(7,2)などの位置に格子点があることがわかる。図1より、波長分散方向はXの正方向と負方向になるが、これに限定されるものではない。例えばYの正方向と負方向に波長分散させることもできるし、Y=Xの方向(傾き45°)の方向にも波長分散させることもできる。図3Eでは、仮にA(アデニン)の格子点からの変位量を1画素、G(グアニン)の格子点からの変位量を2画素、C(シトシン)の格子点からの変位量を3画素、T(チミン)の格子点からの変位量を4画素として説明する。蛍光体の波長により分散の大きさが決まるため、各塩基に修飾した蛍光体で変位量は決定される。従って上述の蛍光体と変位量との関係に限定されるものではない。そのような光学的配置は分散プリズムの角度,プリズムとCCDとの距離,CCD位置の調整によって実現可能である。従ってアデニンを右方向に分散させた場合には、格子点からXが+1移動した場所に検出され、左方向に分散させた場合には、格子点からXが-1移動した場所に検出させることができる。チミンの場合4画素移動するが、この距離は格子点2つ分(3画素×2格子+1=7画素)未満である。1つの蛍光体あたりの波長分散画素数を1画素以上にしてもよいが、1画素あたりの蛍光強度は小さくなる。従って1つの蛍光体あたりの波長分散画素数は3画素以下が望ましい。但しこれに限定されるものではない。
図3Eでは、特定の分散方向に対して、波長分散が強く検出された画素を灰色で塗りつぶしている(以降この点を灰色画素という表現で代用する)。実際の測定では、近隣の画素の蛍光強度から近似曲線を算出することで、蛍光強度の高い画素を特定することができる。従って灰色画素以外の画素の蛍光強度が0であることを意味しない。右方向に分散させた場合(左図)、(4,5)の格子点は(6,5)に分散波長のピークがある。(4,5)の左側にビーズがない場合、(7,5)の格子点の波長分散は(8,5)~(11,5)のいずれかになるため、(6,5)に分散波長のピークは格子点(4,5)に存在する蛍光体であることがわかる。+2移動するのはグアニンであるため、格子点(4,5)に存在するのはグアニンと結論できる。同様に(a,5)の行の格子点の蛍光体は、全てグアニンであることがわかる。右方向に分散させた場合、例えば格子点(10,5)の場合は、(11,5)~(14,5)(太線で囲んだ画素)に注目して、1つしか灰色の画素がなければその変位量から格子点(10,5)における蛍光体を同定できる。同様に左方向に分散させた場合、例えば格子点(10,5)の場合は、(6,5)~(9,5)(太線で囲んだ画素)に注目して、1つしか灰色の画素がなければその変位量から格子点(10,5)における蛍光体を同定できる。以上より、(4,2)の格子点は(7,2)に分散波長のピークがあることから、シトシンと同定される。また(a,2)の行の格子点の蛍光体は、全てシトシンであることがわかる。
図3Fは、図3Eにおいて太線で囲んだ画素に2つの灰色の画素がある場合である。これはアデニン(変位量+1画素)またはチミン(変位量+4画素)の場合に起こりうる。従ってこのどちらの塩基であるかを同定する必要がある。なおこの課題は、分散距離が格子間距離よりも短い場合には発生しない。図3Fは全て格子状の点が同じアデニンである場合に記載した。(10,2),(10,5),(10,8),(10,11),(10,14)の格子点について、図3Eで説明した太線で囲んだ画素について左右の分散方向をそれぞれみると、全て2画素(1と4の距離)が灰色画素となっている。従って太線内を見ただけでは、アデニンかチミンかを区別できない。この場合には、分散方向の一番反対側にある格子点の情報から順番に塩基を同定することができる。例として、右側に分散させた時の一番左側に存在する格子点(4,2)において、(5,2)~(8,2)の範囲には(5,2)と(8,2)に灰色画素が存在するが、(5,2)が灰色画素となるのは、右側に分光しているため、格子点(4,2)にアデニンが存在する時だけである。従って(8,2)の灰色セルは、格子点(7,2)を波長分散したものであり、アデニンと同定される。以上より、数珠繋ぎ的に全ての格子点がアデニンであることが理解される。この同定方法は、分散方向に少なくとも1つの格子点を任意に欠落させることでも実現できる。
図3Gは、図3F同様、太線で囲んだ画素に2つの灰色の画素がある場合である。但し分散方向に少なくとも1箇所異なる塩基が存在する場合について説明する。(10,2),(10,5),(10,8),(10,11),(10,14)の格子点について、太線で囲んだ画素について左右の分散方向をそれぞれみると、全て2画素(1と4の距離)が灰色画素になっている。従って太線内を見ただけでは、アデニンかチミンかを区別できない。但し分散方向に少なくとも1箇所異なる塩基が存在する場合、その格子点の塩基を決定することで、図3F同様に数珠繋ぎ的に塩基を決定できる。格子点(4,8)の塩基は、(6,8)が灰色画素であることから、グアニンと同定される。なぜならば仮に格子点(1,8)が存在して最も分散したとしても、(5,8)の画素に集光するため、(6,8)が灰色画素となりうる格子点は(4,8)しか存在しないからである。そうすると格子点(7,8)の左側への分散を考えた場合、(3,8)~(6,8)の範囲には(6,8)のみが灰色画素である。従って格子点(7,8)の塩基はアデニンと同定できる。従って格子点(7,8)の右側への分散を考えた場合、(8,8)~(11,8)の範囲には(8,8)と(11,8)が灰色画素であるが、格子点(7,8)の塩基はアデニンと同定されているため、この格子点を右側分散した場合には(8,8)が灰色画素となる。従って(11,8)の灰色画素は、格子点(7,8)由来ではない。従って格子点(10,8)由来と同定され、アデニンであることがわかる。仮に格子点(4,8)が存在して最も分散したとしても、(8,8)の画素に集光するため、(11,8)が灰色画素となりうる格子点は(10,8)しか存在しないからである。以上より、数珠繋ぎ的に分散方向全ての格子点の塩基を同定することができる。なお右方向への分散における(8,2)の灰色セルが、(11,2)などの灰色セルより濃く表示しているのは、2つの格子点の波長が同一画素に集光しているためである。以後の図でも同様の考え方で表示した。
図3Hは、図3G同様、太線で囲んだ画素に2つの灰色の画素がある場合である。但しグアニン,シトシンの場合には図3F,図3Hのように図の太線枠以外の場所から塩基を数珠繋ぎ的に同定する必要はない。これについて以下に説明する。(10,2),(10,5),(10,8),(10,11),(10,14)の格子点について、太線で囲んだ画素について右側への分散みると、2つないし3つの灰色画素が存在する。但し2つないし3つの灰色画素のうち、(12,2),(12,5),(12,8),(12,11),(12,14)が灰色画素となっている。右側への分散で、(12,2)を灰色画素にする格子点は(10,2)しか存在しない。なぜならば仮に格子点(7,2)が存在して最も分散したとしても、(11,2)の画素に集光するため、(12,2)が灰色画素となりうる格子点は(10,8)しか存在しないからである。従って図の太線枠に複数の灰色画素が存在した場合でも、格子点から+2画素の画素が灰色画素である場合には、他の太線内の灰色画素に関係なく、グアニンと同定できる。これは格子点(10,5)の場合、右への分散も左側への分散も、太線内には2つの灰色画素があるが、(8,5)と(12,5)が灰色画素であるため、グアニンと同定される。これは左側への分散においても同様にあてはまる。(12,2),(12,5),(12,8),(12,11),(12,14)が灰色画素の場合、(13,2),(13,5),(13,8),(13,11),(13,14)は灰色画素にはなりえない。
図3Iは、図3G同様、太線で囲んだ画素に2つの灰色の画素がある場合である。但しグアニン,シトシンの場合には図3F、図3Hのように図の太線枠以外の場所から塩基を数珠繋ぎ的に同定する必要はない。これについて以下に説明する。(10,2),(10,5),(10,8),(10,11),(10,14)の格子点について、太線で囲んだ画素について右側への分散を見ると、2つないし3つの灰色画素が存在する。但し2つないし3つの灰色画素のうち、(13,2),(13,5),(13,8),(13,11),(13,14)が灰色画素となっている。右側への分散で、(13,2)を灰色画素にする格子点は(10,2)しか存在しない。なぜならば仮に格子点(7,2)が存在して最も分散したとしても、(11,2)の画素に集光するため、(13,2)が灰色画素となりうる格子点は(10,2)しか存在しないからである。従って図の太線枠に複数の灰色画素が存在した場合でも、格子点から+3画素の画素が灰色画素である場合には、他の太線内の灰色画素に関係なく、シトシンと同定できる。これは左側への分散においても同様にあてはまる。これは格子点(10,5)の場合、右への分散も左側への分散も、太線内には2つの灰色画素があるが、(7,5)と(13,5)が灰色画素であるため、シトシンと同定される。(13,2),(13,5),(13,8),(13,11),(13,14)が灰色画素の場合、(12,2),(12,5),(12,8),(12,11),(12,14)は灰色画素にはなりえない。
図3Jは、図3Eにおいて太線で囲んだ画素に2つの灰色の画素がある場合である。これはアデニン(変位量+1画素)またはチミン(変位量+4画素)の場合に起こりうる。従ってこのどちらの塩基であるかを同定する必要がある。なおこの課題は、分散距離が格子間距離よりも短い場合には発生しない。図3Jは全て格子状の点が同じチミンである場合に記載した。(10,2),(10,5),(10,8),(10,11),(10,14)の格子点について、太線で囲んだ画素について左右の分散方向をそれぞれみると、全て2画素(1と4の距離)が灰色画素となっている。従って太線内を見ただけでは、アデニンかチミンかを区別できない。この場合には、分散方向の一番反対側にある格子点の情報から順番に塩基を同定することができる。例として、右側に分散させた時の一番左側に存在する格子点(4,2)において、(5,2)~(8,2)の範囲には(8,2)にのみ灰色画素が存在する。従って格子点(4,2)はチミンと同定される。以上より、数珠繋ぎ的に全ての格子点がチミンであることが理解される。この同定方法は、分散方向に少なくとも1つの格子点を任意に欠落させることでも実現できる。
図3Kは、図3F同様、太線で囲んだ画素に2つの灰色の画素がある場合である。但し分散方向に少なくとも1箇所異なる塩基が存在する場合について説明する。(10,2),(10,5),(10,8),(10,11),(10,14)の格子点について、太線で囲んだ画素について左右の分散方向をそれぞれみると、全て2画素(1と4の距離)が灰色画素になっている。従って太線内を見ただけでは、アデニンかチミンかを区別できない。但し分散方向に少なくとも1箇所異なる塩基が存在する場合、その格子点の塩基を決定することで、図3J同様に数珠繋ぎ的に塩基を決定できる。格子点(4,1)の塩基は、左側分散で(0,1)~(3,1)の範囲で(0,1)のみが灰色画素であるためである。従って格子点(4,1)の塩基はチミンと同定できる。従って格子点(7,1)の右側への分散を考えた場合、(8,1)~(11,1)の範囲には(8,1)と(11,1)が灰色画素であるが、格子点(4,1)の塩基はチミンと同定されているため、この格子点を右側分散した場合には(8,1)が灰色画素となる。従って(11,1)の灰色画素は、格子点(10,1)由来ではない。従って格子点(7,1)由来と同定され、チミンであることがわかる。同様に格子点(10,1)もチミンと同定される。以上より、数珠繋ぎ的に分散方向全ての格子点の塩基を同定することができる。
図3E~図3Kに記載した塩基配列同定方法を図3Lに適用して、塩基配列を同定する。図3Lには右側分散と左側分散それぞれの灰色画素とその座標を表示した。まずはじめにシトシンとグアニンについて同定する。これはある特定の格子点について注目し、右側分散の時は+2、左側分散の時には-2画素が灰色画素である場合にはグアニンと同定できる。またある特定の格子点について注目し、右側分散の時は+3、左側分散の時には-3画素が灰色画素である場合にはシトシンと同定できる。これより図3Lの丸数字1に示す塩基が同定される。図3L丸数字1で灰色表示した格子点は、アデニンまたはチミンであることを示す。次に図3L丸数字1で灰色表示した格子点の中で、ある特定の格子点について注目し、右側分散させた時に+1または+4の画素のどちらか1つのみが灰色画素である場合、ある特定の格子点+1画素が灰色画素であればアデニン、ある特定の格子点+4画素が灰色画素であればチミンと同定できる。これより図3Lの丸数字2に示す塩基が同定される。この時点で同定されていない格子点(10,10)は左右両側の格子点(7,10),(13,10)の塩基がチミンである。格子点(10,10)のように、ある特定の格子点がアデニンまたはチミンであり、更に左右の分散方向の格子点[(7,10),(13,10)]の両方がチミンまたはアデニンである場合、この時点ではある特定の格子点(10,10)の塩基を特定できない。この場合、図3F,図3G,図3J,図3Kで説明したように、他の格子点の塩基配列情報を利用して数珠繋ぎ的に特定の格子点の塩基配列を同定することができる。格子点(10,10)の右側分散において、(11,10)~(14,10)の灰色画素は(11,10)と(14,10)である。但し灰色画素(11,10)は格子点(7,10)の塩基がチミンであることから、格子点(10,10)の右側分散は(14,10)の灰色画素と特定される。従って格子点(10,10)はチミンであると同定される。以上図3Lで説明した方法は、任意の格子点が欠落しているか或いは蛍光体が存在しない場合にも適用することができる。
以上より複数方向への分散画像より、塩基配列を同定することができる。また分散距離が4画素の場合、図3A~図3Dの例では、隣接する格子間距離を分散距離(4画素)+1の計5画素必要であったが、図3E~図3Lの例では、格子間距離は3画素で同様の解析が実現できる。従って1視野で検出できる格子点数は、図3E~図3Lの例では図3A~図3Dと比較して、(5×5)/(3×3)で約2.8倍になり、その分塩基配列を多く同定でき、スループットは向上する。分散方向や格子配置の検討により、この割合は更に高くなることはいうまでもない。例えば格子を2つ飛び越えない条件では、A(アデニン)の格子点からの変位量を0画素、G(グアニン)の格子点からの変位量を1画素、C(シトシン)の格子点からの変位量を2画素、T(チミン)の格子点からの変位量を3画素として、格子点の間隔を2×2画素にすることで、同様のことを実現できる。これにより1視野で検出できる格子点数は、図3E~図3Lの例では図3A~図3Dと比較して、(5×5)/(2×2)で約6.25倍スループットが向上する。
以上のように、第1の実施形態によれば、分散分光イメージング法に基づくシステムにおいて、特定の格子点から発する蛍光像を、複数の波長分散方向に分散させることで、蛍光体の識別と波長分散対象物の位置の同定を精度よく行うことができる。また、金属構造物からの光ルミネセンスを検出することにより、波長基準を基板の反応点ごとに得ることができ、分散分光イメージング方式では困難であった発光した蛍光体の種別判定が高精度に行えるようになり、結果として高精度な塩基配列決定が可能となる。基板表面上に金属の構造物は金のほか、クロム,銀,アルミなどで構築することもできる。また、波長基準は、フィルタの中心波長だけではなく、レーザ散乱のスペクトルなどからも得ることができる。なお、本実施例では4種の異なる蛍光体を異なるdNTPに標識したが、4種のdNTPに同じ1種の蛍光体を標識することもできる。この場合、励起レーザ光源は1種となる。反応はA→C→G→T→A→C・・・と順番に行う必要がある。また、石英製プリズム7に対してレーザ光を垂直に入射している。これにより、基板とプリズムを一体化して移動させることができる。
<第2の実施形態>
図4は、本発明の蛍光分析方法を使ったDNA検査装置の構成図である。図1はプリズム全反射方式の顕微鏡であったが、図4はレーザ入射方向と蛍光検出方向が同じ方向である顕微鏡である。このような装置としては、対物レンズの辺縁部よりレーザを全反射となる角度で照射することで、1分子検出可能な対物レンズ全反射方式の顕微鏡もあり、以下の実施例でも使用されうる。装置は顕微鏡に類似する装置の構成であり、基板8に捕捉するDNA分子の伸長状態を蛍光検出にて測定する。基板8は、図2に示すような構造をしている。基板8は少なくともその一部が透明材質でできており、材質としては合成石英などが使用できる。基板8には反応領域8aがあり、この部分は透明材質であり、この部分に試薬などが接触する。反応領域8a内にDNAが固定される領域8ijが複数形成されている。
図4は、本発明の蛍光分析方法を使ったDNA検査装置の構成図である。図1はプリズム全反射方式の顕微鏡であったが、図4はレーザ入射方向と蛍光検出方向が同じ方向である顕微鏡である。このような装置としては、対物レンズの辺縁部よりレーザを全反射となる角度で照射することで、1分子検出可能な対物レンズ全反射方式の顕微鏡もあり、以下の実施例でも使用されうる。装置は顕微鏡に類似する装置の構成であり、基板8に捕捉するDNA分子の伸長状態を蛍光検出にて測定する。基板8は、図2に示すような構造をしている。基板8は少なくともその一部が透明材質でできており、材質としては合成石英などが使用できる。基板8には反応領域8aがあり、この部分は透明材質であり、この部分に試薬などが接触する。反応領域8a内にDNAが固定される領域8ijが複数形成されている。
DNAが固定される領域8ijを、反応領域8a内にアレイ状に整列させる場合について説明する。領域8ijの個々の大きさは直径1000nm以下であり、より好ましくは100nm以下である。この領域にはDNAを捕捉するための表面処理を施す。例えば領域8ijと、反応領域8a内の領域8ij以外の場所を、薄膜形成、エッチング技術などを用いて、領域8ijのみが表面処理剤が反応する材料で作製しておくことで、領域8ij上にのみ表面処理を施すことができる。その表面処理は、例えば、ストレプトアビジンを結合させておき、ビオチン標識したDNA断片を反応させることで、捕捉する。また、ポリTのオリゴヌクレオチドを固定化しておき、DNA断片の一端をポリA化処理して、ハイブリ反応にて捕捉することもできる。この際、DNA断片濃度が高い場合には個々の領域8ijに複数分子のDNAが入るが、DNA断片濃度を適当に調製することで、個々の領域8ijに単一分子のDNAのみが入るようにすることができる。なお、領域8ijをより小さくしていくことで、領域内に捕捉できる分子が1個になるようにすることができる。或いはビオチン化DNAをストレプトアビジン化ビーズに固定し、ビーズを反応領域8a内にばら撒くことでも、ビーズを領域8ijにアレイ上に配置することができる。或いはNature 437(7057):376-380に記載のエマルジョンPCRを用いて、同一のDNA配列を持つ鋳型が多数複製されたビーズを反応領域8a内にばら撒くことでも、ビーズを領域8ijにアレイ上に配置することができる。
次にDNAが固定される領域8ijを、反応領域8a内にランダムに整列させる場合について説明する。これは領域8ijと、反応領域8a内の領域8ij以外の場所が、例えばストレプトアビジンなどの同一の表面処理が施されている場合である。従ってこの場合には、領域8ijはDNAが固定された領域を指す。この場合、DNA断片濃度が高い場合にはDNAの固定密度は高くなるが、DNA断片濃度を適当に調製することで、DNAの固定密度は低くなり、単一分子のDNAを十分な光学分解能で識別できる固定密度にすることできる。或いはビオチン化DNAをストレプトアビジン化ビーズに固定し、ビーズを反応領域8a内にばら撒くことでも、ビーズをランダムに配置することができる。或いはエマルジョンPCRを用いて、同一のDNA配列を持つ鋳型が多数複製されたビーズを反応領域8a内にばら撒くことでも、ビーズをランダムに配置することができる。ビーズの大きさは2000nm以下であり、より好ましくは10~1000nmである。
以後アレイ状の基板について説明するが、ランダム配置された基板を計測する場合においても、以下に記述する方法を適用することができる。アレイ状の基板では、すべての領域8ijに単一分子のDNAが固定化されている場合、領域8ijの一部のみDNAが固定化されている場合がある。一部のみDNAが固定化されている場合は、残りの領域8ijには固定化されておらず、空きの状態となる。なお、領域8ij同士の間隔dxは1ミクロン、間隔dyは3ミクロンとした。領域8ijはこのように、格子構造(2次元の長方格子構造)を形成し、その格子点の位置に領域8ijが配置される。このような、均等間隔の基板の作成法は、例えば、特開2002-214142号公報に記載の手法などで、作成する。なお、dx,dyは領域8ijの個々の大きさより大きく、4000nm程度以下が好ましい。基板の反応領域8aは76.2mm×25.4mmのスライドガラスの大きさとした。反応領域8aの大きさは、それより大きくても可であるし、例えば0.5mm×0.5mmの大きさのものを一定間隔で、1次元または2次元に複数個並べたようなものでもよい。なお、領域8ijには金属構造体を配置してもよい。金属構造体は半導体プロセスにて作成することもできる。電子線描画,ドライエッチング,ウェットエッチングなどが使用できる。金属構造体は、金,銅,アルミ,クロム等で、励起光の波長以下の大きさを有する形状であり、直方体,円錐,円柱,一部が突起状のものを有する構造などを使用する。
dNTPの蛍光標識として種々の蛍光体を使うことができる。例えば、Bodipy-FL-510,R6G,ROX,Bodipy-650を使用し、これらそれぞれ異なる4種の蛍光体で標識された3′末端がアリル基で修飾された4種のdNTP(3′-O-allyl-dGTP-PC-Bodipy-FL-510,3′-O-allyl-dTTP-PC-R6G,3′-O-allyl-dATP-PC-ROX,3′-O-allyl-dCTP-PC-Bodipy-650)を使用する。
蛍光励起用のレーザ装置101a(Arレーザ,488nm:Bodipy-FL-510,R6G励起用)からのレーザ光をλ/4波長板102aを通して円偏光とする。蛍光励起用のレーザ装置101b(He-Neレーザ,594.1nm:ROX,Bodipy-650励起用)からのレーザ光をλ/4波長板102bを通して円偏光とする。両レーザ光をミラー104bとダイクロイックミラー104a(520nm以下を反射)で重ね合わせ、ミラー5を通りDNA分子を捕捉した基板8の裏側から垂直に照射する。基板8表面は反応液(水)で覆われている。なお、基板の近傍には、温調器が配置されているが、図では省略した。また、通常観察のため、プリズム下部よりハロゲン照明ができる構造としているが、図ではこれを省略している。また、レーザ装置101a,101bとは別にレーザ装置100(YAGレーザ,355nm)を配置し、ダイクロイックミラー103(400nm以下を反射)でレーザ装置101a,101bのレーザ光と重ね合わせ同軸にして照射できるようにした。本レーザは、取り込まれたdNTP誘導体の蛍光検出後、dNTP誘導体を伸長可能な状態に戻す工程に使用するものである。
基板8の上部には、試薬などを流し、反応させるためのフローチャンバ9が構成されている。チャンバには試薬導入口12があり、分注ノズル26を有する分注ユニット25,試薬保管ユニット27,チップボックス28により、目的の試薬液の注入などを行う。試薬保管ユニット27には、試料液容器27a,dNTP誘導体溶液容器27b,27c,27d,27e(27c,27d,27eは予備)及び洗浄液容器27f等が用意される。反応プロトコルに応じて、試薬の種類や数を増やすことができる。チップボックス28内の分注チップを分注ノズル26に取り付け、適当な試薬液を吸引し、チャンバ導入口から基板の反応領域に導入し、反応させる。廃液は廃液チューブ10を介して廃液容器11に排出される。これらは制御PC21により自動的に行われる。
フローチャンバは光軸方向に透明材で形成され、蛍光検出される。蛍光13は、自動ピントあわせ装置29で制御される集光レンズ(対物レンズ)14で集められ、平行光束はダイクロイックミラー7で曲げられ、フィルタユニット15で必要な波長の蛍光を取り出し、不必要な波長の光を除去する。対物レンズを14を通過した必要な波長の蛍光は、平行光束となって波長分散プリズム17a,17bで2方向に分光される。波長分散プリズムで分光することで、例えば4色同時検出が可能になり、1色ずつ検出する場合と比較してスループットが向上する。また1色ずつ検出する場合は、データ容量が増えるだけではなく、各蛍光体の画像を重ね合わせて解析する必要があるため、解析時間が長くなってしまう。その像を結像レンズ18a,18bで、2次元センサカメラ19a,19b(高感度冷却CCDカメラ)に結像させ、検出する。
カメラの露光時間の設定,蛍光画像の取り込みのタイミングなどの制御は、2次元センサカメラコントローラ20aを介して制御PC21が行う。フィルタユニット15には、レーザ光除去用のノッチフィルタ2種(488nm,594nm)、検出する波長体を透過させるバンドパス干渉フィルタ(透過帯域:510-700nm)を用いる。なお、装置は、調整などのため、透過光観察用鏡筒16とTVカメラ23とモニタ24を備えており、ハロゲン照明などで基板8の状態をリアルタイムで観察できるようになっている。
プリズム17a,17bは図に示すように一体であってもよいし、別々のプリズムを近接、または一定距離離したものであっても良い。またプリズム17a,17bの分散角度は任意に設定でき、連続的に角度を変化させても良い。また平行光束に対して設置する角度は任意に設定できる。また平行光束の中心(プリズム上の点線)にプリズム17a,17bの分散角交点(プリズム上の点線とプリズムからの反射面の交点)を合わせる必要はない。平行光束の中心に分散角交点を合わせた場合、図1で2方向に分光される強度は等しくなる。分散角交点を平行光束中心からずらすことで、2方向に分光される信号強度の比率を変えることができる。この比率の違いを利用して、波長成分の信号強度の算定や、分光対象物の位置の特定を行うこともできる。また最大の2次元センサカメラの数は、分散方向の数になるが、光学素子を組み合わせることで、1つの2次元センサカメラにすることもできる。図1では、波長分散プリズム17a,17bにより光軸は傾くが、分散の異なるプリズムを複数枚組み合わせ、光軸が傾かないようにすることもできる。これにより1CCDで複数方向に分散させた画像を取得できる。図2にあるように、基板8には位置きめマーカ30,31が刻印されている。マーカ30,31は領域8ijの並びと平行に配置され、その間隔が規定されている。そこで、透過照明での観測でマーカを検出することで、領域8ijの位置を計算することができる。
本実施例で使用する2次元センサカメラとして、CCDエリアセンサを使用した。画素サイズが7.4×7.4ミクロンで、画素数2048×2048画素の冷却CCDカメラを使用する。なお、2次元センサカメラとしては、CCDエリアセンサの他、C-MOSエリアセンサなどの撮像カメラなどを一般に使うことができる。CCDエリアセンサにも、構造によって、背面照射型,正面照射型があり、どちらも使用できる。また、素子内部に信号の増倍機能を有する電子増倍型CCDカメラなども高感度化を図る上で有効である。また、センサは冷却型が望ましく、-20℃程度以下にすることで、センサの持つダークノイズを低減でき、測定の精度を高めることができる。
反応領域8aからの蛍光像を一度に検出してもいいし、分割することもできる。この場合、基板の位置を移動させるためのX-Y移動機構部をステージ下部に配置し、制御PCで照射位置への移動,光照射,蛍光像検出を制御する。本例ではX-Y移動機構部は図示していない。
<第3の実施形態>
図5A~図5Fは、基板8の表面の一部の概略図であり、DNAが固定されるべき複数の領域8ij(格子点)が形成されている。CCDカメラへの結像倍率を14.4倍とし、dx=1μmの距離を2分割してCCD画素で検出する。格子点の最も近接する間隔は、X,Y方向共に1μmであり、X方向に4画素(/蛍光体)で分光させると、1画素あたり50nmの分散となる。
図5A~図5Fは、基板8の表面の一部の概略図であり、DNAが固定されるべき複数の領域8ij(格子点)が形成されている。CCDカメラへの結像倍率を14.4倍とし、dx=1μmの距離を2分割してCCD画素で検出する。格子点の最も近接する間隔は、X,Y方向共に1μmであり、X方向に4画素(/蛍光体)で分光させると、1画素あたり50nmの分散となる。
図5Aの図は、図1の19aまたは19bの2次元センサで撮影した画像をそれぞれ示している。丸が格子点の位置を、四角がCCDの1画素を示しており、CCDの画素の座標をX,Y方向それぞれに0から画素数分記載している。但しCCDは1000×1000や2000×2000画素で、全ての画素は記載できないため、CCDの左下の部分を拡大して示している。以降では、(a,b)はX=a,Y=bの座標を示す。例えば(0,0)はCCDの一番左下の画素である。また(3,0)(5,2)などの位置に格子点があることがわかる。図1より、波長分散方向はXの正方向と負方向になるが、これに限定されるものではない。例えばYの正方向と負方向に波長分散させることもできるし、Y=Xの方向(傾き45°)の方向にも波長分散させることもできる。図5Aでは、仮にA(アデニン)の格子点からの変位量を0画素、G(グアニン)の格子点からの変位量を1画素、C(シトシン)の格子点からの変位量を2画素、T(チミン)の格子点からの変位量を3画素として説明する。蛍光体の波長により分散の大きさが決まるため、各塩基に修飾した蛍光体で変位量は決定される。従って上述の蛍光体と変位量との関係に限定されるものではない。そのような光学的配置は分散プリズムの角度,プリズムとCCDとの距離,CCD位置の調整によって実現可能である。従ってアデニンを右方向に分散させた場合には、格子点からXが±0移動した場所に検出され、左方向に分散させた場合には、格子点からXが±0移動した場所に検出させることができる。チミンの場合3画素移動するが、この距離は格子点2つ分(2画素×2格子+1=5画素)未満である。1つの蛍光体あたりの波長分散画素数を1画素以上にしてもよいが、1画素あたりの蛍光強度は小さくなる。従って1つの蛍光体あたりの波長分散画素数は3画素以下が望ましい。但しこれに限定されるものではない。図3E~図3Lとは格子間距離が異なるが、同様の考え方で塩基配列が同定されることを以下に説明する。図5A~図5Fでは、特定の分散方向に対して、波長分散が強く検出された画素を灰色で塗りつぶしている(以降この点を灰色画素という表現で代用する)。実際の測定では、近隣の画素の蛍光強度から近似曲線を算出することで、蛍光強度の高い画素を特定することができる。
図5Aは、分散方向に対して全ての塩基配列が同じ場合について記述している。格子点(7,6)に注目して右方向に分散させた場合(左図)、(7,6)~(10,6)の範囲(太線枠で表示)の灰色画素は、(7,6)と(9,6)である。従って塩基の候補は、AまたはCである。一方左側に分散させた場合(右図)、(4,6)~(7,6)の範囲(太線枠で表示)の灰色画素は、(5,6)と(7,6)である。従って塩基の候補は、AまたはCである。ゆえに右側の分散方向、左側の分散方向共に塩基の候補はAまたはCとなり、塩基を同定できない。これは格子点(7,6)の左右に存在する格子点(5,6),(9,6)の塩基もAまたはCとなり、塩基を同定できない。この場合は、分散方向に対して一番反対側の格子点の塩基を同定することで、その他の分散方向に存在する塩基を数珠繋ぎ的に同定できる。例えば右側分散させる場合、分散方向に対して一番反対側(左側)の格子点は(3,6)である。この格子に注目すると、右側分散させた場合(左図)、(3,6)~(6,6)の範囲の灰色画素は、(3,6)と(5,6)である。従って塩基の候補は、AまたはCである。一方左側に分散させた場合、(0,6)~(3,6)の範囲の灰色画素は、(3,6)のみである。従って、格子点(3,6)の塩基はアデニンと同定される。次に格子点(3,6)の隣の格子点(5,6)の右側分散を考える。(5,6)~(8,6)の範囲の灰色画素は、(5,6)と(7,6)である。但し格子点は(3,6)はアデニンであるため、右側分散させた場合に灰色画素は(3,6)であり、(5,6)は灰色画素とはならない。従って(5,6)が灰色画素となるためには、格子点(5,6)はアデニンでなければならない。ゆえに格子点(5,6)の塩基はアデニンと同定される。次に格子点(5,6)の隣の格子点(7,6)の右側分散を考える。(7,6)~(10,6)の範囲の灰色画素は、(7,6)と(10,6)である。但し格子点(5,6)はアデニンであるため、右側分散させた場合に灰色画素は(5,6)であり、(7,6)は灰色画素とはならない。従って(7,6)が灰色画素となるためには、格子点(7,6)はアデニンでなければならない。ゆえに格子点(7,6)の塩基はアデニンと同定される。このようにして、波長分散方向の塩基が全て同じである場合でも、数珠繋ぎ的に塩基を同定することができる。この方法は分散方向に対して少なくとも1つの格子点を欠損させておくか、或いは蛍光体を取り込ませないようにしておいても実現できる。
同様に格子点(7,4)に注目して右方向に分散させた場合(左図)、(7,4)~(10,4)の範囲(太線枠で表示)の灰色画素は、(8,4)と(10,4)である。従って塩基の候補は、GまたはTである。一方左側に分散させた場合(右図)、(4,4)~(7,4)の範囲(太線枠で表示)の灰色画素は、(4,4)と(6,4)である。従って塩基の候補は、GまたはTである。ゆえに右側の分散方向、左側の分散方向共に塩基の候補はGまたはTとなり、塩基を同定できない。これは格子点(7,4)の左右に存在する格子点(5,4),(9,4)の塩基もGまたはTとなり、塩基を同定できない。この場合は、分散方向に対して一番反対側の格子点の塩基を同定することで、その他の分散方向に存在する塩基を数珠繋ぎ的に同定できる。例えば右側分散させる場合、分散方向に対して一番反対側(左側)の格子点は(3,4)である。この格子に注目すると、右側分散させた場合(左図)、(3,4)~(6,4)の範囲の灰色画素は、(4,4)と(6,4)である。従って塩基の候補は、GまたはTである。一方左側に分散させた場合、(0,4)~(3,4)の範囲の灰色画素は、(2,4)のみである。従って、格子点(3,4)の塩基はグアニンと同定される。次に格子点(3,4)の隣の格子点(5,4)の右側分散を考える。(5,4)~(8,4)の範囲の灰色画素は、(6,4)と(8,4)である。但し格子点(3,4)はグアニンであるため、右側分散させた場合に灰色画素は(5,4)であり、(6,4)と(8,4)は灰色画素とはならない。ここで右側分散の場合、(6,4)を灰色画素にできるのは、(6以下、4)の格子点である。格子点(3,4)はグアニンであるため(6,4)を灰色画素にできないこと、格子点(1,4)は分散方向へ2つ隣の格子点を灰色画素にはできないことから、(6,4)を灰色画素にできるのは格子点(5,4)のみであることがわかる。ゆえに格子点(5,4)はグアニンと同定される。次に格子点(5,4)の隣の格子点(7,4)の右側分散を考える。(7,4)~(10,4)の範囲の灰色画素は、(8,4)と(10,4)である。但し格子点(5,4)はグアニンであるため、右側分散させた場合に灰色画素は(6,4)であり、(8,4)と(10,4)は灰色画素とはならない。ここで右側分散の場合、(8,4)を灰色画素にできるのは、(8以下、4)の格子点である。格子点(5,4)はグアニンであるため(8,4)を灰色画素にできないこと、格子点(3,4)は分散方向へ2つ隣の格子点を灰色画素にはできない条件であることから、(8,4)を灰色画素にできるのは格子点(7,4)のみであることがわかる。ゆえに格子点(7,4)はグアニンと同定される。このようにして、波長分散方向の塩基が全て同じである場合でも、数珠繋ぎ的に塩基を同定することができる。この方法は分散方向に対して少なくとも1つの格子点を欠損させておくか、或いは蛍光体を取り込ませないようにしておいても実現できる。
同様に格子点(7,2)に注目して右方向に分散させた場合(左図)、(7,2)~(10,2)の範囲(太線枠で表示)の灰色画素は、(7,2)と(9,2)である。従って塩基の候補は、AまたはCである。一方左側に分散させた場合(右図)、(4,2)~(7,2)の範囲(太線枠で表示)の灰色画素は、(5,2)と(7,2)である。従って塩基の候補は、AまたはCである。ゆえに右側の分散方向、左側の分散方向共に塩基の候補はAまたはCとなり、塩基を同定できない。これは格子点(7,2)の左右に存在する格子点(5,2),(9,2)の塩基もAまたはCとなり、塩基を同定できない。この場合は、分散方向に対して一番反対側の格子点の塩基を同定することで、その他の分散方向に存在する塩基を数珠繋ぎ的に同定できる。例えば右側分散させる場合、分散方向に対して一番反対側(左側)の格子点は(3,2)である。この格子に注目すると、右側分散させた場合(左図)、(3,2)~(6,2)の範囲の灰色画素は、(5,2)のみである。従って、格子点(3,2)の塩基はシトシンと同定される。次に格子点(3,2)の隣の格子点(5,2)の右側分散を考える。(5,2)~(8,2)の範囲の灰色画素は、(5,2)と(7,2)である。但し格子点(3,2)はシトシンであるため、右側分散させた場合に灰色画素は(5,2)である。また(7,2)の灰色画素は、格子点(5,2)でも格子点(7,2)でも灰色画素とすることが可能である。従って右側分散だけでは格子点(5,2)の塩基は、AまたはCとなり、同定できない。次に格子点(5,2)の左側分散を考える。(2,2)~(5,2)の範囲の灰色画素は、(3,2)と(5,2)である。ここで格子点(3,2)はシトシンであるため、(3,2)を灰色画素にはできないこと、格子点(7,2)は分散方向へ2つ隣の格子点を灰色画素にはできないことから、(3,2)を灰色画素にできるのは格子点(5,2)のみであることがわかる。ゆえに格子点(5,2)はシトシンと同定される。次に格子点(5,2)の隣の格子点(7,2)の右側分散を考える。(7,2)~(10,2)の範囲の灰色画素は、(7,2)と(9,2)である。但し格子点(5,2)はシトシンであるため、右側分散させた場合に灰色画素は(7,2)である。また(9,2)の灰色画素は、格子点(7,2)でも格子点(9,2)でも灰色画素とすることが可能である。従って右側分散だけでは格子点(7,2)の塩基は、AまたはCとなり、同定できない。次に格子点(7,2)の左側分散を考える。(4,2)~(7,2)の範囲の灰色画素は、(5,2)と(7,2)である。ここで格子点(5,2)はシトシンであるため、(5,2)を灰色画素にはできないこと、格子点(9,2)は分散方向へ2つ隣の格子点を灰色画素にはできないことから、(5,2)を灰色画素にできるのは格子点(7,2)のみであることがわかる。ゆえに格子点(7,2)はシトシンと同定される。このようにして、波長分散方向の塩基が全て同じである場合でも、数珠繋ぎ的に塩基を同定することができる。この方法は分散方向に対して少なくとも1つの格子点を欠損させておくか、或いは蛍光体を取り込ませないようにしておいても実現できる。
同様に格子点(7,0)に注目して右方向に分散させた場合(左図)、(7,0)~(10,0)の範囲(太線枠で表示)の灰色画素は、(8,0)と(10,0)である。従って塩基の候補は、GまたはTである。一方左側に分散させた場合(右図)、(4,0)~(7,0)の範囲(太線枠で表示)の灰色画素は、(4,0)と(6,0)である。従って塩基の候補は、GまたはTである。ゆえに右側の分散方向,左側の分散方向共に塩基の候補はGまたはTとなり、塩基を同定できない。これは格子点(7,0)の左右に存在する格子点(5,0),(9,0)の塩基もGまたはTとなり、塩基を同定できない。この場合は、分散方向に対して一番反対側の格子点の塩基を同定することで、その他の分散方向に存在する塩基を数珠繋ぎ的に同定できる。例えば右側分散させる場合、分散方向に対して一番反対側(左側)の格子点は(3,0)である。この格子に注目すると、右側分散させた場合(左図)、(3,0)~(6,0)の範囲の灰色画素は、(6,0)のみである。従って、格子点(3,0)の塩基はチミンと同定される。次に格子点(3,0)の隣の格子点(5,0)の右側分散を考える。(5,0)~(8,0)の範囲の灰色画素は、(6,0)と(8,0)である。但し格子点(3,0)はチミンであるため、右側分散させた場合に灰色画素は(6,0)である。また(8,0)の灰色画素は、格子点(5,0)でも格子点(7,0)でも灰色画素とすることが可能である。従って右側分散だけでは格子点(5,0)の塩基は、GまたはTとなり、同定できない。次に格子点(5,0)の左側分散を考える。(2,0)~(5,0)の範囲の灰色画素は、(2,0)と(4,0)である。ここで格子点(3,0)はシトシンであるため、(2,0)を灰色画素にはできないこと、格子点(7,0)は分散方向へ2つ隣の格子点を灰色画素にはできないことから、(2,0)を灰色画素にできるのは格子点(5,0)のみであることがわかる。ゆえに格子点(5,0)はチミンと同定される。次に格子点(5,0)の隣の格子点(7,0)の右側分散を考える。(7,0)~(10,0)の範囲の灰色画素は、(8,0)と(10,0)である。但し格子点(5,0)はチミンであるため、右側分散させた場合に灰色画素は(8,0)である。また(10,0)の灰色画素は、格子点(7,0)でも格子点(9,0)でも灰色画素とすることが可能である。従って右側分散だけでは格子点(7,0)の塩基は、GまたはTとなり、同定できない。次に格子点(7,0)の左側分散を考える。(4,0)~(7,0)の範囲の灰色画素は、(4,0)と(6,0)である。ここで格子点(5,0)はチミンであるため、(5,0)を灰色画素にはできないこと、格子点(9,0)は分散方向へ2つ隣の格子点を灰色画素にはできないことから、(4,0)を灰色画素にできるのは格子点(7,0)のみであることがわかる。ゆえに格子点(7,0)はチミンと同定される。このようにして、波長分散方向の塩基が全て同じである場合でも、数珠繋ぎ的に塩基を同定することができる。この方法は分散方向に対して少なくとも1つの格子点を欠損させておくか、或いは蛍光体を取り込ませないようにしておいても実現できる。以上より図5Aにおいて、4種類の塩基のうちある特定の塩基のみが分散方向の格子点に存在する場合に、その塩基配列を決定することができる。
図5Bで、分散方向の格子点において、少なくとも1つの格子点の塩基がそれ以外の格子点の塩基(アデニン)とは異なる場合に、塩基を同定する方法について説明する。図5Bに示すある特定の格子点について、右側分散方向における灰色画素〔格子点画素~(格子点画素+3画素)〕より、塩基候補を列挙する。同様に左側分散方向における灰色画素〔格子点画素~(格子点画素-3画素)〕より、塩基候補を列挙する。図では5列の格子点があるが中央3列の格子点について、以下にその結果を示す。
ここで右側分散と左側分散から得られる塩基候補のうち、ある特定の塩基のみが共通する場合にはその時点で、塩基を同定できる。またそれ以外の格子点については塩基の候補のみ決定される。上表の“塩基候補”の欄にその結果を記載した。次に塩基が同定されていない格子点について、塩基が同定されている格子点の情報からその塩基を特定する。例として、格子点(5,4)の場合について考える。それ以外の同定されていない格子点についても同様の考え方を適用することで塩基を同定できる。格子点(5,4)の右側分散を考える。(5,4)~(8,4)の範囲の灰色画素は、(6,4)と(7,4)である。また左側分散させたときに(2,4)~(5,4)の範囲の灰色画素は、(3,4)と(4,4)である。ここで格子点(5,4)の右側の塩基はアデニンと同定されている。格子点(5,4)において、同定されている格子点(7,4)がアデニンの場合、その格子点とは反対方向への分散(左側分散)を考える。格子点(5,4)の左側分散における灰色画素は、(3,4)と(4,4)である。ここで格子点(7,4)はアデニンであるため、(4,4)を灰色画素にはできないこと、格子点(9,4)は分散方向へ2つ隣の格子点を灰色画素にはできないことから、(4,4)を灰色画素にできるのは格子点(5,4)のみであることがわかる。ゆえに格子点(5,4)はグアニンと同定される。このようにして、上表において“塩基候補”が複数ある格子点全てについて、塩基を同定し、その結果を“同定塩基”の欄に記載した。
図5Cで、分散方向の格子点において、少なくとも1つの格子点の塩基がそれ以外の格子点の塩基(グアニン)とは異なる場合に、塩基を同定する方法について説明する。図5Cに示すある特定の格子点について、右側分散方向における灰色画素〔格子点画素~(格子点画素+3画素)〕より、塩基候補を列挙する。同様に左側分散方向における灰色画素〔格子点画素~(格子点画素-3画素)〕より、塩基候補を列挙する。図では5列の格子点があるが中央3列の格子点について、以下にその結果を示す。
ここで右側分散と左側分散から得られる塩基候補のうち、ある特定の塩基のみが共通する場合にはその時点で、塩基を同定できる。またそれ以外の格子点については塩基の候補のみ決定される。上表の“塩基候補”の欄にその結果を記載した。次に塩基が同定されていない格子点について、塩基が同定されている格子点の情報からその塩基を特定する。例として、格子点(5,4)の場合について考える。それ以外の同定されていない格子点についても同様の考え方を適用することで塩基を同定できる。格子点(5,4)の右側分散を考える。(5,4)~(8,4)の範囲の灰色画素は、(5,4)と(8,4)である。また左側分散させたときに(2,4)~(5,4)の範囲の灰色画素は、(2,4)と(5,4)である。ここで格子点(5,4)の右側の塩基はグアニンと同定されている。格子点(5,4)において、同定されている格子点(7,4)がグアニンの場合、その格子点とは反対方向への分散(左側分散)を考える。格子点(5,4)の左側分散における灰色画素は、(2,4)と(5,4)である。ここで格子点(7,4)はグアニンであるため、(5,4)を灰色画素にはできないこと、格子点(9,4)は分散方向へ2つ隣の格子点を灰色画素にはできないことから、(5,4)を灰色画素にできるのは格子点(5,4)のみであることがわかる。ゆえに格子点(5,4)はアデニンと同定される。このようにして、上表において“塩基候補”が複数ある格子点全てについて、塩基を同定し、その結果を“同定塩基”の欄に記載した。
図5Dで、分散方向の格子点において、少なくとも1つの格子点の塩基がそれ以外の格子点の塩基(シトシン)とは異なる場合に、塩基を同定する方法について説明する。図5Dに示すある特定の格子点について、右側分散方向における灰色画素〔格子点画素~(格子点画素+3画素)〕より、塩基候補を列挙する。同様に左側分散方向における灰色画素〔格子点画素~(格子点画素-3画素)〕より、塩基候補を列挙する。図では5列の格子点があるが中央3列の格子点について、以下にその結果を示す。
ここで右側分散と左側分散から得られる塩基候補のうち、ある特定の塩基のみが共通する場合にはその時点で、塩基を同定できる。またそれ以外の格子点については塩基の候補のみ決定される。上表の“塩基候補”の欄にその結果を記載した。次に塩基が同定されていない格子点について、塩基が同定されている格子点の情報からその塩基を特定する。例として、格子点(9,4)の場合について考える。それ以外の同定されていない格子点についても同様の考え方を適用することで塩基を同定できる。格子点(9,4)の右側分散を考える。(9,4)~(12,4)の範囲の灰色画素は、(9,4)と(11,4)である。また左側分散させたときに(6,4)~(9,4)の範囲の灰色画素は、(7,4)と(9,4)である。ここで格子点(9,4)の左側の塩基はシトシンと同定されている。格子点(9,4)において、同定されている格子点(7,4)がシトシンの場合、それと同一方向への分散(左側分散)を考える。格子点(9,4)の左側分散における灰色画素は、(7,4)と(9,4)である。ここで格子点(7,4)はシトシンであるため、(7,4)を灰色画素にはできないこと、格子点(11,4)は分散方向へ2つ隣の格子点を灰色画素にはできないことから、(7,4)を灰色画素にできるのは格子点(9,4)のみであることがわかる。ゆえに格子点(9,4)はシトシンと同定される。このようにして、上表において“塩基候補”が複数ある格子点全てについて、塩基を同定し、その結果を“同定塩基”の欄に記載した。
図5Eで、分散方向の格子点において、少なくとも1つの格子点の塩基がそれ以外の格子点の塩基(チミン)とは異なる場合に、塩基を同定する方法について説明する。図5Eに示すある特定の格子点について、右側分散方向における灰色画素〔格子点画素~(格子点画素+3画素)〕より、塩基候補を列挙する。同様に左側分散方向における灰色画素〔格子点画素~(格子点画素-3画素)〕より、塩基候補を列挙する。図では5列の格子点があるが中央3列の格子点について、以下にその結果を示す。
ここで右側分散と左側分散から得られる塩基候補のうち、ある特定の塩基のみが共通する場合にはその時点で、塩基を同定できる。またそれ以外の格子点については塩基の候補のみ決定される。上表の“塩基候補”の欄にその結果を記載した。次に塩基が同定されていない格子点について、塩基が同定されている格子点の情報からその塩基を特定する。例として、格子点(9,4)の場合について考える。それ以外の同定されていない格子点についても同様の考え方を適用することで塩基を同定できる。格子点(9,4)の右側分散を考える。(9,4)~(12,4)の範囲の灰色画素は、(10,4)と(12,4)である。また左側分散させたときに(6,4)~(9,4)の範囲の灰色画素は、(6,4)と(8,4)である。ここで格子点(9,4)の左側の塩基はチミンと同定されている。格子点(9,4)において、同定されている格子点(7,4)がチミンの場合、それと同一方向への分散(左側分散)を考える。格子点(9,4)の左側分散における灰色画素は、(6,4)と(8,4)である。ここで格子点(7,4)はチミンであるため、(6,4)を灰色画素にはできないこと、格子点(11,4)は分散方向へ2つ隣の格子点を灰色画素にはできないことから、(6,4)を灰色画素にできるのは格子点(9,4)のみであることがわかる。ゆえに格子点(9,4)はチミンと同定される。このようにして、上表において“塩基候補”が複数ある格子点全てについて、塩基を同定し、その結果を“同定塩基”の欄に記載した。
図5A~図5Eに記載した塩基配列同定方法を図5Fの全ての格子点に適用して、塩基配列を同定する。図5Fには右側分散と左側分散それぞれの灰色画素とその座標を表示した。図5Fに示すある特定の格子点について、右側分散方向における灰色画素〔格子点画素~(格子点画素+3画素)〕より、塩基候補を列挙する。同様に左側分散方向における灰色画素〔格子点画素~(格子点画素-3画素)〕より、塩基候補を列挙する。これを図5Fの全ての格子点について実施した。4列目(a,4)の格子点についての結果を以下に示す。
4列目(a,4)の格子点では上表の“塩基候補”の時点で全ての塩基が同定されている。次に2列目(a,2)の格子点についての結果を以下に示す。
2列目(a,2)の格子点では上表の“塩基候補”の時点で全ての塩基は同定されていない。塩基候補がAとCの2つある格子点(7,2)について、塩基を同定する。同定されている格子点(5,2)がシトシンの場合、その格子点と同一方向への分散(左側分散)を考える。格子点(7,2)の左側分散における灰色画素は、(4,2)~(7,2)の範囲で(5,2)と(7,2)である。ここで格子点(5,2)はシトシンであるため、(5,2)を灰色画素にはできないこと、格子点(9,2)は分散方向へ2つ隣の格子点を灰色画素にはできないことから、(5,2)を灰色画素にできるのは格子点(7,2)のみであることがわかる。ゆえに格子点(7,2)はシトシンと同定される。この方法では格子点(7,2)の塩基を、格子点(5,2)の塩基情報から決定したが、格子点(9,2)の塩基情報からも同定できる。同定されている格子点(9,2)がシトシンの場合、その格子点と同一方向への分散(右側分散)を考える。格子点(7,2)の右側分散における灰色画素は、(7,2)~(10,2)の範囲で(7,2)と(9,2)である。ここで格子点(9,2)はシトシンであるため、(9,2)を灰色画素にはできないこと、格子点(5,2)は分散方向へ2つ隣の格子点を灰色画素にはできないことから、(9,2)を灰色画素にできるのは格子点(7,2)のみであることがわかる。ゆえに格子点(7,2)はシトシンと同定される。格子点(7,2)の塩基を、格子点(5,2)と格子点(9,2)の塩基情報を利用することで、それぞれシトシンと同定された。このようにある特定の格子点の塩基を、波長分散方向に近接した両隣の塩基から同定することで、塩基配列の決定精度は高くなる。例えばある特定の格子点において、分散方向のどちらかの格子点が欠落している場合や蛍光体を取り込んでいない場合や蛍光体を取り込んでいるが塩基の同定が難しい場合、それらとは反対方向の格子点の塩基からのみある特定の格子点の塩基を同定できる。この現象により塩基配列の決定精度が悪くなる場合には、その格子点の座標と同定した塩基データに目印の情報(フラグ)をつけておくことができる。例えば新規にゲノム配列を決定する際に、DNAを短い断片にして、ランダムに多数の断片を分離して配列決定し、その断片配列情報の重ねあわせによりゲノム配列を決定する(デノボシークエンス)。断片配列情報の重ねあわせの過程において、上述したフラグのついた塩基がある場合には、例えばその塩基情報を除外、或いは重ねあわせに対する制約(アルゴリズム)を小さくして断片配列情報を重ねあわせることにより、配列決定精度を高めることができる。最後に0列目(a,0)の格子点についての結果を以下に示す。
0列目(a,0)の格子点では上表の“塩基候補丸数字1”の時点で全ての塩基は同定されていない。格子点(5,0)はAまたはG、格子点(7,0)はCまたはT、格子点(9,0)はAまたはGであり、塩基が同定されていない。従って塩基が同定された分散方向両隣にある格子点の情報から、塩基を同定する必要がある。格子点(5,0)は格子点(3,0)がチミンであることから、格子点(9,0)は格子点(11,0)がチミンであることからそれぞれの格子点の塩基を同定できる。但し格子点(7,0)に関しては、分散方向両隣にある格子点〔格子点(5,0)と格子点(9,0)〕の塩基が同定されていないため、この時点では格子点(7,0)の塩基を同定できない。従ってまずは格子点(5,0)と格子点(9,0)の塩基を同定する必要がある。格子点(5,0)に関しては、同定されている格子点(3,0)がチミンの場合、その格子点と反対方向への分散(右側分散)を考える。格子点(5,0)の右側分散における灰色画素は、(5,0)~(8,0)の範囲で(5,0)と(6,0)である。ここで格子点(5,0)はチミンであるため、(5,0)を灰色画素にはできないこと、格子点(3,0)は分散方向へ2つ隣の格子点を灰色画素にはできないことから、(5,0)を灰色画素にできるのは格子点(5,0)のみであることがわかる。ゆえに格子点(5,0)はアデニンと同定される。次に格子点(9,0)に関しては、同定されている格子点(11,0)がチミンの場合、その格子点と反対方向への分散(左側分散)を考える。格子点(9,0)の左側分散における灰色画素は、(6,0)~(9,0)の範囲で(8,0)と(9,0)である。ここで格子点(11,0)はチミンであるため、(9,0)を灰色画素にはできないこと、格子点(13,0)は分散方向へ2つ隣の格子点を灰色画素にはできないことから、(9,0)を灰色画素にできるのは格子点(9,0)のみであることがわかる。ゆえに格子点(9,0)はアデニンと同定される。以上より格子点(5,0)、格子点(11,0)共にアデニンと同定され、この時点での塩基候補の結果を上表の“塩基候補丸数字2”へ記入した。“塩基候補丸数字2”の時点で同定されていない塩基の格子点は、格子点(7,0)である。塩基候補がCとTの2つある格子点(7,0)について、塩基を同定する。同定されている格子点(5,0)がアデニンの場合、その格子点と同一方向への分散(左側分散)を考える。格子点(7,0)の左側分散における灰色画素は、(4,0)~(7,0)の範囲で(4,0)と(5,0)である。ここで格子点(5,0)はアデニンであるため、(4,0)を灰色画素にはできないこと、格子点(9,0)は分散方向へ2つ隣の格子点を灰色画素にはできないことから、(4,0)を灰色画素にできるのは格子点(7,0)のみであることがわかる。ゆえに格子点(7,0)はチミンと同定される。この方法では格子点(7,0)の塩基を、格子点(5,0)の塩基情報から決定したが、格子点(9,0)の塩基情報からも同定できる。同定されている格子点(9,0)がアデニンの場合、その格子点と同一方向への分散(右側分散)を考える。格子点(7,0)の右側分散における灰色画素は、(7,0)~(10,0)の範囲で(9,0)と(10,0)である。ここで格子点(9,0)はアデニンであるため、(10,0)を灰色画素にはできないこと、格子点(5,0)は分散方向へ2つ隣の格子点を灰色画素にはできないことから、(10,0)を灰色画素にできるのは格子点(7,0)のみであることがわかる。ゆえに格子点(7,0)はチミンと同定される。格子点(7,0)の塩基を、格子点(5,0)と格子点(9,0)の塩基情報を利用することで、それぞれチミンと同定された。このようにある特定の格子点の塩基を、波長分散方向に近接した両隣の塩基から同定することで、塩基配列の決定精度は高くなる。このようにある特定の格子点の塩基を、波長分散方向に近接した両隣の塩基から同定することで、塩基配列の決定精度は高くなる。例えばある特定の格子点において、分散方向のどちらかの格子点が欠落している場合や蛍光体を取り込んでいない場合や蛍光体を取り込んでいるが塩基の同定が難しい場合、それらとは反対方向の格子点の塩基からのみある特定の格子点の塩基を同定できる。この現象により塩基配列の決定精度が悪くなる場合には、その格子点の座標と同定した塩基データに目印の情報(フラグ)をつけておくことができる。例えば新規にゲノム配列を決定する際に、DNAを短い断片にして、ランダムに多数の断片を分離して配列決定し、その断片配列情報の重ねあわせによりゲノム配列を決定する(デノボシークエンス)。断片配列情報の重ねあわせの過程において、上述したフラグのついた塩基がある場合には、例えばその塩基情報を除外、或いは重ねあわせに対する制約(アルゴリズム)を小さくして断片配列情報を重ねあわせることにより、配列決定精度を高めることができる。これまではX方向の分散のみ扱ってきたが、XYの4方向に分光させることでデータの信頼性は更に増す。図1のプリズム17a,17bに17c,17dを加えて4つの集光レンズと4つのCCDで検出することもできる。
以上より複数方向への分散画像より、塩基配列を同定することができる。また分散距離が4画素の場合、図3A~図3Dの例では、隣接する格子間距離を分散距離4画素必要であったが、図5A~図5Fの例では、格子間距離は2画素で同様の解析が実現できる。従って1視野で検出できる格子点数は、図5A~図5Fの例では図3A~図3Dと比較して、(4×4)/(2×2)で4倍になり、その分塩基配列を多く同定でき、スループットは向上する。分散方向や格子配置の検討により、この割合は更に高くなることはいうまでもない。例えば格子を2つ飛び越えない条件では、A(アデニン)の格子点からの変位量を0画素、G(グアニン)の格子点からの変位量を1画素、C(シトシン)の格子点からの変位量を2画素、T(チミン)の格子点からの変位量を3画素として、格子点の間隔を1×1画素にすることで、同様のことを実現できる。これにより1視野で検出できる格子点数は、図3E~図3Lの例では図3A~図3Dと比較して、(4×4)/(1×1)で16倍スループットが向上する。
以上のように、第6の実施形態によれば、分散分光イメージング法に基づくシステムにおいて、特定の格子点から発する蛍光像を、複数の波長分散方向に分散させることで、蛍光体の識別と波長分散対象物の位置の同定を精度よく行うことができる。また、金属構造物からの光ルミネセンスを検出することにより、波長基準を基板の反応点ごとに得ることができ、分散分光イメージング方式では困難であった発光した蛍光体の種別判定が高精度に行えるようになり、結果として高精度な塩基配列決定が可能となる。基板表面上に金属の構造物は金のほか、クロム,銀,アルミなどで構築することもできる。また、波長基準は、フィルタの中心波長だけではなく、レーザ散乱のスペクトルなどからも得ることができる。なお、本実施例では4種の異なる蛍光体を異なるdNTPに標識したが、4種のdNTPに同じ1種の蛍光体を標識することもできる。この場合、励起レーザ光源は1種となる。反応はA→C→G→T→A→C・・・と順番に行う必要がある。また、石英製プリズム7に対してレーザ光を垂直に入射している。これにより、基板とプリズムを一体化して移動させることができる。
<第4の実施形態>
図6は基板とエバネッセント照明のためのプリズムとの接合部の別の構造を示す。図1と同じく、石英製プリズム7に基板8をカップリングする。カップリング材として透明な弾性体、たとえば、PDMS樹脂201(屈折率=1.42,内部透過率=0.966/厚み2mm材)を介して接合する。PDMS樹脂の屈折率はガラスに近く、また透明であるため、基板とプリズムで挟み押し付けることで光学的に接着する。測定中、基板内の測定視野の移動は、プリズム込みでXYステージにて行うことができる。
図6は基板とエバネッセント照明のためのプリズムとの接合部の別の構造を示す。図1と同じく、石英製プリズム7に基板8をカップリングする。カップリング材として透明な弾性体、たとえば、PDMS樹脂201(屈折率=1.42,内部透過率=0.966/厚み2mm材)を介して接合する。PDMS樹脂の屈折率はガラスに近く、また透明であるため、基板とプリズムで挟み押し付けることで光学的に接着する。測定中、基板内の測定視野の移動は、プリズム込みでXYステージにて行うことができる。
図7,図8は、基板とエバネッセント照明のためのプリズムとの接合部の別の構造を示す。測定基板200は専用のホルダ203に埋め込まれて固定される。この下部(反応表面側,格子構造形成側)にフローチャンバ204を固定される。フローチャンバ204はPDMSで形成し、ホルダ203と接着され、測定基板200の反応領域に試薬,洗浄液などをフローできるようになっている。これをXYステージ209(図8に図示)に固定された基板保持具205に接触させる。フローチャンバ204の流路208と貫通孔206の位置をそろえて配置する。貫通孔206は外部のフローシステムと連結される。また、基板保持具205は、その中央に大きな開口部207を有しており、集光レンズ14と測定基板200とが近接でき、蛍光を高効率で集光できる。測定基板200の裏面(図では上側)のホルダ203内の窪み202にマッチングオイルを保持し、プリズム7を配置する。窪み202にマッチングオイルに替えてPDMS樹脂を埋めることでマッチングすることでもよい。プリズム7はプリズムホルダ210に固定されており、基板との着脱機能を有しており、エバネッセント照明する場合に基板と接着する。なお、プリズムをアクリルなどで作成し、それを基板と一体化して固着した状態のものを使うこともできる。
<第5の実施形態>
反応基板の別の実施例を示す。本実施例での基板60の構造を図9に示す。基板60は、反応領域60aを有し、その内部にDNAが固定される領域60ijが複数形成されており、さらに複数の60ijの周りを光学的に不透明なマスク60bで覆う構造とする。マスク材料としては、アルミニウム,クロムなどの金属,炭化シリコンなどが適用でき、蒸着などで、薄膜化する。領域60ijの個々の大きさは直径100nm以下である。この開口をマスク60bのなかに作成する方法としては、プロジェクション法での蒸着(蒸着源と基板との間に適当なマスクを配置して蒸着する)、電子ビームリソグラフィー,フォトリソグラフィーによる直接描画によって作成できる。ドライエッチング、ウェットエッチングを用いても良い。本例によっても、上記実施例1と同様の効果が得られる。また、反応領域60ij以外はマスクされているため、不要な迷光,蛍光が低減でき、より高感度に測定することができるようになる。微小開口を有する金属薄膜の基板の場合は、生体分子は開口中に固定する。この場合、生体分子周囲の試料液のラマン散乱光と生体分子近傍の金属構造物の光ルミネセンス・光散乱を検出することで、構造物の空間位置を検出することができ、位置の基準マーカとして活用できる。開口中に金属構造体を作成してもよい。
反応基板の別の実施例を示す。本実施例での基板60の構造を図9に示す。基板60は、反応領域60aを有し、その内部にDNAが固定される領域60ijが複数形成されており、さらに複数の60ijの周りを光学的に不透明なマスク60bで覆う構造とする。マスク材料としては、アルミニウム,クロムなどの金属,炭化シリコンなどが適用でき、蒸着などで、薄膜化する。領域60ijの個々の大きさは直径100nm以下である。この開口をマスク60bのなかに作成する方法としては、プロジェクション法での蒸着(蒸着源と基板との間に適当なマスクを配置して蒸着する)、電子ビームリソグラフィー,フォトリソグラフィーによる直接描画によって作成できる。ドライエッチング、ウェットエッチングを用いても良い。本例によっても、上記実施例1と同様の効果が得られる。また、反応領域60ij以外はマスクされているため、不要な迷光,蛍光が低減でき、より高感度に測定することができるようになる。微小開口を有する金属薄膜の基板の場合は、生体分子は開口中に固定する。この場合、生体分子周囲の試料液のラマン散乱光と生体分子近傍の金属構造物の光ルミネセンス・光散乱を検出することで、構造物の空間位置を検出することができ、位置の基準マーカとして活用できる。開口中に金属構造体を作成してもよい。
<第6の実施形態>
本発明の蛍光分析方法を使ったDNA検査装置について説明する。本発明は、配列情報を1つまたは複数の鋳型から、並行して、実質的に同時に収集するために使用され得るさまざまな自動配列決定システムを提供する。好ましくは、鋳型は、実質的に平面状の基材上でアレイ状である。本発明のシステムの一例は、図1,図4で説明したように、CCDカメラ,蛍光顕微鏡,可動ステージ,フローセル,温度制御装置,液体操作装置,プリズム,分散プリズム,分光フィルタ,集光レンズおよびコンピュータ等を備えている。これらの構成要素の置き換えや、システムにより構成要素の数の増減がなされること、フィルタの光学特性を変更すること、構成要素の置き換えに伴う光学素子の追加や変更がされることは言うまでもない。例えば、CCDカメラの代わりにTDIなどのイメージセンサを用いたり、励起光源としてレーザの替わりにLED(Laser Emitted Diode)を用いたり、2台のCCDカメラの替わりに1台または4台のCCDカメラを用いたりできる。LEDを用いた励起方法については、例えばWO2007/054301,WO2008/043500などに記述されている。
本発明の蛍光分析方法を使ったDNA検査装置について説明する。本発明は、配列情報を1つまたは複数の鋳型から、並行して、実質的に同時に収集するために使用され得るさまざまな自動配列決定システムを提供する。好ましくは、鋳型は、実質的に平面状の基材上でアレイ状である。本発明のシステムの一例は、図1,図4で説明したように、CCDカメラ,蛍光顕微鏡,可動ステージ,フローセル,温度制御装置,液体操作装置,プリズム,分散プリズム,分光フィルタ,集光レンズおよびコンピュータ等を備えている。これらの構成要素の置き換えや、システムにより構成要素の数の増減がなされること、フィルタの光学特性を変更すること、構成要素の置き換えに伴う光学素子の追加や変更がされることは言うまでもない。例えば、CCDカメラの代わりにTDIなどのイメージセンサを用いたり、励起光源としてレーザの替わりにLED(Laser Emitted Diode)を用いたり、2台のCCDカメラの替わりに1台または4台のCCDカメラを用いたりできる。LEDを用いた励起方法については、例えばWO2007/054301,WO2008/043500などに記述されている。
本発明の蛍光分析方法は、様々な配列決定法、例えば限定されないが、合成方法による配列決定(Sequence by Synthesis)、合成による蛍光インサイチュで配列決定(FISSEQ)(例えば、Mitra RDら.、Anal Biochem.、320(l):55-65,2003)、ライゲーション(Sequence by ligation)による配列決定方法(例えば、US特許2008/0003571),逐次合成方式による単一分子シーケンス法(例えば、US特許2002/0164629),リアルタイム反応方式による単一分子シーケンス法(例えば、Jonas Korlashら.、PNAS.、Vol.105,1176-1181,2008)などを行うために使用され得る。FISSEQは、半固相支持体内または該支持体上に直接固定化された鋳型上、半固相支持体内または該支持体上の微粒子上に固定化された鋳型上、基材に直接結合された鋳型上などで行われ得る。本発明のシステムの重要な要素の1つは、フローセルである。一般にフローセルは、内部を流体が流動し得る流入ポートおよび流出ポートを有するチャンバを含む。種々のフローセルならびにその製造のための材料および方法については、例えば、米国特許第6,406,848号および同第6,654,505号ならびにPCT公開公報WO98053300に記述されている。流体の流動により、種々の試薬をフローセル内に位置する存在体(例えば、鋳型,微粒子,解析物など)に添加し、これらから除去することが可能になる。好ましくは、本発明の配列決定システムにおける使用に適したフローセルは、流体がその表面を流動するような基材、例えば、スライドなどの実質的に平面状の基材が取り付けられる位置、および照光,励起,シグナル取得などを可能にする窓を備える。本発明の方法によれば、微粒子などの存在体は、典型的にはフローセル内に配置する前に、基材上にアレイ状にする。
本発明のある特定の実施形態において、フローセルは垂直に配向させ、これにより、気泡をフローセルの上面から散逸させることが可能になる。フローセルは、流体経路がフローセルの下部から上に流れるように、例えば、流入ポートがセルの下部に存在し、流出ポートがセルの上に存在するように配設する。導入され得る気泡は浮揚性であるため、これは、照光窓を障害することなく速やかに流出ポートに浮揚する。気泡を液体の表面まで、その密度が該液体のものより低いことによって上昇させる。好ましくは、鋳型を直接接着もしくは固定した基材、自身に直接もしくは間接的に結合された微粒子(例えば、共有結合もしくは非共有結合により基材に結合)、または基材に接着もしくは固定された半固相支持体内または該支持体上に固定化された微粒子を有する基材をフローセル内に垂直になるように、すなわち、基材の最大の平面状の表面が、設置面に対して垂直になるように取り付ける。フローセルを垂直配置する構成として、以下の2方式が考えられる。以下の2方式では、図4の構成における対物レンズ14近傍の部分を拡大した。但し図1のプリズム型全反射顕微鏡などその他のシステムにも適用できる。1つ目は、図10aに示すようにステージ自体を垂直にする構成である。この構成において、フローセル平面をスキャンするために要求されるステージ32は、XYステージである。但し焦点が合わないなどの理由で更に必要な場合には、XYステージの替わりにXYZステージを組み付けるか、対物レンズ14にZ方向に対応するステージを設置することができる。なおフローチャンバ9は対物レンズ14とは反対側に設置されており、励起光の入射,蛍光信号の取得共に対物レンズ14側から行う場合、フローチャンバ14の材質に制約はなく、不透明な材質(アルミやSUSなどの金属)を用いることができる。フローチャンバ14にヒーターまたはペルチエなどを接続することで、温度調節を行うことができる。なお図4における基板8は省略した。またフローチャンバ9とステージ32の間の黒丸は、送液チューブからの気泡や溶存酸素を示している。2つ目は、図10bに示すように水平に配置したXYZステージに、フローセルを支えるフローセルホルダを垂直に配置する構成である。この構成において、フローセル平面をスキャンするために要求されるステージは、XZステージである。但し焦点が合わないなどの理由で更に必要な場合には、XZステージの替わりにXYZステージを組み付けるか、対物レンズにY方向に対応するステージを設置することができる。好ましい実施形態では、微粒子は、支持体または基材内またはその上面に固定化されているため、互いに対して実質的に固定された位置に維持され、これにより逐次的な画像取得と画像レジストレーションが容易になる。また本発明のある特定の実施形態において、フローセルを垂直配置する替わりに、フローセルを傾斜配置させ、気泡をフローセルの上面から散逸させることができる。フローセルを傾斜配置する構成として、以下の2方式が考えられる。1つ目は、図10cに示すようにステージ自体を傾斜させる構成である。この構成において、フローセル平面をスキャンするために要求されるステージは、XYステージである。但し焦点が合わないなどの理由で更に必要な場合には、XYステージの替わりにXYZステージを組み付けるか、対物レンズにZ方向に対応するステージを設置することができる。ステージを傾斜配置する角度は20°程度が望ましいが、これに限定されるものではない。2つ目は、図10dに示すように水平に配置したXYZステージに、フローセルを支えるフローセルホルダと対物レンズを傾斜配置する構成である。この構成において、フローセル平面をスキャンするために要求されるステージは、XZステージである。但し焦点が合わないなどの理由で更に必要な場合には、XZステージの替わりにXYZステージを組み付けるか、対物レンズにフローセル平面に垂直に対応するステージを設置することができる。好ましい実施形態では、微粒子は、支持体または基材内またはその上面に固定化されているため、互いに対して実質的に固定された位置に維持され、これにより逐次的な画像取得と画像レジストレーションが容易になる。更に本発明のある特定の実施形態において、フローセルを垂直または傾斜配置する替わりに、フローセルを水平配置させることも可能である。フローセルを水平配置する構成として、以下の3方式が考えられる。1つ目は、図10eに示すようにステージとフローセルを水平配置する構成である。この構成において、フローセル平面をスキャンするために要求されるステージは、XYステージである。但し焦点が合わないなどの理由で更に必要な場合には、XyYステージの替わりにXYZステージを組み付けるか、対物レンズにZ方向に対応するステージを設置することができる。フローセル内に液体を流すことにより、気泡を除去することができる。また液体の流れるフローセル上面に付着した気泡が、蛍光検出などの検出系に影響しない場合には必ずしも気泡を除供する必要がない。2つ目は、図10fに示すようにステージとフローセルを水平配置し、液体の流れるフローセル上面の高さをステージ面に対して傾斜させる構成である。これにより気泡を除去することができる。傾斜させる角度は20°程度が望ましいが、これに限定されるものではない。この構成において、フローセル平面をスキャンするために要求されるステージは、XYステージである。但し焦点が合わないなどの理由で更に必要な場合には、XYステージの替わりにXYZステージを組み付けるか、対物レンズにZ方向に対応するステージを設置することができる。フローセル内に液体を流すことにより、気泡を除去することができる。3つ目は、図10gに示すようにステージとフローセルを水平配置し、液体の流れるフローセル上面の高さをステージ面に対して傾斜させる構成である。但し傾斜させる位置は、蛍光検出などの検出に影響しない領域に限定する。これにより気泡を除去することができる。傾斜させる角度は20°程度が望ましいが、これに限定されるものではない。この構成において、フローセル平面をスキャンするために要求されるステージは、XYステージである。但し焦点が合わないなどの理由で更に必要な場合には、XYステージの替わりにXYZステージを組み付けるか、対物レンズにZ方向に対応するステージを設置することができる。フローセル内に液体を流すことにより、気泡を除去することができる。蛍光検出などの検出に影響しない領域で、液体の流れるフローセル9上面の高さをステージ面に対して傾斜させた上視図を図11a~図11cに示す。図はあくまでも例であり、これらに限定されるものではない。いずれの図も試薬の注入口(黒丸で図示)から排出口(白丸で図示)を含む斜線部に示す部分が傾斜しており、気泡を排出することができる。斜線部中の矢印は気泡の移動方向を示している。また検出面(非斜線部)は水平面になっている。本発明のフローセルは、任意のさまざまな目的、例えば、限定されないが、解析方法(例えば、配列決定,ハイブリダイゼーションアッセイなどの核酸解析法;タンパク質解析法,結合アッセイ,スクリーニングアッセイなど)に使用され得る。フローセルはまた、合成を行うため、例えば、コンビナトリアルライブラリーを作製するためなどに使用され得る。フローセルは、自動温度制御ステージ上に取り付けられ、液体操作システム(例えば、マルチポートバルブを有するシリンジポンプなど)に接続されている。該ステージは、他の反応工程、例えば、伸長,反応,洗浄などが別のフローセルで行われている間に、1つのフローセルが画像化されるのを可能にするために、多数のフローセルを収容する。このアプローチは、高価な光学システムの利用を最大限にするとともに、処理量を増大させる。同時処理可能なフローセルの枚数は、1枚の基板を検出するのに要する時間と、反応工程時間とによってその最大値が決定される。流体ラインには、気泡を検出するため、および試薬の使用をモニタするための光学および伝導性センサが設置されている。流体工学システム内の温度制御およびセンサにより、試薬が、長時間の安定に適切な温度に維持されるが、フローセル内に侵入するとき作業温度またはで上昇せず、アニーリング,ライゲーションおよび切断工程中での温度変動が回避されることが確保される。試薬は、好ましくは、誤負荷を回避するためキット内に予め装填しておく。
光学装置としては、図1では2つのCCDカメラが含まれ、分散プリズムにより分光された画像を撮影する。但しCCDカメラの個数は分散プリズムによる分光方向の数だけ準備してもよく、光学素子によってはその数を減らすことも可能である。例えば図1の分散プリズム17a,17bからの分散が視野の中心軸(図1の点線)上に集光するようにすれば、CCDカメラ19a,19bは1つに、集光レンズ18a,18bも1つにすることができる。但しこの場合、2方向に分散させた情報を1つのCCDで検出することになる。従って例えば図5aの右側分散と左側分散の画像が重なった画像が得られることになる。そうすると実施例3で示した解析方法では、塩基配列の特定が困難な場合がある。その場合には、例えば図1の分散プリズム17a,17bに入る平行光束をどちらか一方のみにするためのシャッターを分散プリズム手前に設置することで、1つのCCDであってもシャッターの切替えにより2方向に分散させた情報を1つのCCDでそれぞれ取得することができる。
また蛍光体の光退色性効果を低減させるため、照光光学装置は、イメージセンサで画像化される領域だけに照光されるように、視野周辺の多重照光が回避されるように設計されたものであり得る。通常CCDセンサは四角形(正方形),励起光(例えばレーザ光)は円形である。仮に正方形形状を有するCCDセンサ全面に、円形のビームを照射した場合、CCDセンサ以外の部分へ照光される割合は、

となり、上下左右の隣接視野にそれぞれ約14%の照光が発生する。励起光の直径がCCDセンサの対角線長さより大きいほどこの割合は増加する。一般的に励起光の励起密度分布は中心が最も強く、周辺ほど弱くなるため、ビーム直径はCCDの対角線長さより大きくする必要がある。この結果、例えば左上から右下にスキャンする方式の場合、検出前に既に多重照光されている割合は、少なくとも視野全体の28%(14×2)となる。蛍光強度が弱い場合、検出前に蛍光強度が0になる蛍光消光現象が発生する可能性があるため、回避する必要がある。そこでこれを回避するための光学素子の配置例を図12に示す。図12は図4の装置構成を模したものであるが、あくまでも一例であり、これに限定されるものではない。レーザ101をCCDセンサ19の形状に対応するスリット33を通して、ダイクロイックミラー34で反射させ、対物レンズ14を通過し、基板8へ照射させる。基板8へは全反射が発生する角度(ガラスと水の場合約68°)でレーザ101が入射するため、スリット33通過後の励起光の形状は、励起光101を全反射角度で輪切りにした時にその形状がCCDセンサ19の形状と一致するようにする。励起された蛍光は再び対物レンズ14とダイクロイックミラー34を透過して、CCDセンサ19で検出される。CCDセンサの形状に合わせた励起光を照射することができるため、前述の多重照光を回避することができる。スリット33の位置は基板8に近い方が良いが、これに制約されるものではない。
となり、上下左右の隣接視野にそれぞれ約14%の照光が発生する。励起光の直径がCCDセンサの対角線長さより大きいほどこの割合は増加する。一般的に励起光の励起密度分布は中心が最も強く、周辺ほど弱くなるため、ビーム直径はCCDの対角線長さより大きくする必要がある。この結果、例えば左上から右下にスキャンする方式の場合、検出前に既に多重照光されている割合は、少なくとも視野全体の28%(14×2)となる。蛍光強度が弱い場合、検出前に蛍光強度が0になる蛍光消光現象が発生する可能性があるため、回避する必要がある。そこでこれを回避するための光学素子の配置例を図12に示す。図12は図4の装置構成を模したものであるが、あくまでも一例であり、これに限定されるものではない。レーザ101をCCDセンサ19の形状に対応するスリット33を通して、ダイクロイックミラー34で反射させ、対物レンズ14を通過し、基板8へ照射させる。基板8へは全反射が発生する角度(ガラスと水の場合約68°)でレーザ101が入射するため、スリット33通過後の励起光の形状は、励起光101を全反射角度で輪切りにした時にその形状がCCDセンサ19の形状と一致するようにする。励起された蛍光は再び対物レンズ14とダイクロイックミラー34を透過して、CCDセンサ19で検出される。CCDセンサの形状に合わせた励起光を照射することができるため、前述の多重照光を回避することができる。スリット33の位置は基板8に近い方が良いが、これに制約されるものではない。
また必要に応じて任意の光学フィルタを設置してもよい。例えば図1,図4に示す装置において、分散プリズム17a,17b手前の平行光束または分散プリズム後ろの位置に、4色蛍光体の蛍光強度を調整するフィルタを設置することで、4色蛍光体の蛍光強度を揃えてから波長分散させることができる。これにより蛍光体毎の強度を揃えることができる。これにより、例えば図3Lなどで2つの格子点からの波長分散がある特定の画素で検出される場合、各蛍光体の蛍光強度が等しければ、何個の蛍光体信号であるかを識別できる。例えば図5において、右側分散で、格子点座標(a-2,b)の塩基がシトシン、(a-1,b)の塩基がグアニンであった場合、(a,b)の画素にシトシンとグアニン由来の蛍光信号が計測される。グアニンの蛍光強度とシトシンの蛍光強度比が例えば10:1であった場合、その蛍光強度がグアニン単独(10)か、グアニンとシトシン(10+1=11)かを判別することは難しい。予め4色蛍光体強度を調整しておくことで、例えばグアニンの蛍光強度とシトシンの蛍光強度比が1:1であれば、(a,b)の画素で蛍光強度2であればシトシンとグアニンの両方が由来であることがわかる。この比は1:1に揃える必要はない。例えばアデニン,グアニン,シトシン,チミンの蛍光強度比を1:2:3:4などの一定の比率でずらしておくことで、塩基配列をより特定しやすくすることもできる。4色蛍光体の蛍光強度を調整するフィルタの波長特性は、鋳型の蛍光体の取り込み効率,蛍光体波長,蛍光体のモル吸光係数などによって決めることができ、光学メーカーにてフィルタを特注製作することが可能である。このような光学フィルタをターレットに複数搭載し、必要に応じて切り替えながら使用することもできる。
また必要に応じて異なる方向に分光した蛍光信号の強度を調整してもよい。例えば図1において、分散プリズム17a,17bにより分散させた蛍光信号を、集光レンズ18a,18bの手前あるいは後ろにNDフィルタを置くことで調整できる。或いは分散プリズム17a,17bの分散角交点の位置を視野中心(図1の点線)から左右にずらすことでもCCDセンサ19a,19bで検出される蛍光強度比を変えることができる。これにより例えば図5Fにおいて、右側分散させたときと左側分散させた時の蛍光強度比が、調整した蛍光強度比になっているかを比較することで、塩基を特定しやすくすることができる。例えば図5において右側分散と左側分散の比を7:3として、格子点(a,b)がシトシンであった場合、右側分散は格子点(a+2,b)に左側分散は格子点(a-2,b)に7:3の蛍光強度比で検出される。例えばこの比が7:6であった時には、左側分散で格子点(a-2,b)に検出される他の格子点、例えば格子点(a+1,b)がチミンであることなどが考えられ、塩基配列を決定するための情報となる。これに加えて異なる方向に分光した蛍光信号の強度比を連続的に変えたり、蛍光体毎の蛍光強度比を変えながら、CCDセンサで検出して、異なる画像間(例えば右側分散で取得した複数の画像比較)での比較からも、蛍光体を同定することができる。例えば図5において右側分散と左側分散の比を7:3として、格子点(a,b)がシトシンであった場合、右側分散は格子点(a+2,b)に左側分散は格子点(a-2,b)に7:3の蛍光強度比で検出される。例えばこの比が7:6であった時には、左側分散で格子点(a-2,b)に検出される他の格子点、例えば格子点(a+1,b)がチミンであることなどが疑われる。この際に例えば左側分散におけるチミンの蛍光波長を遮断する光学フィルタをターレットで切り替えてCCDセンサで検出しておくことで、同じ左側分散の画像でも格子点(a-2,b)に7:6の蛍光強度比であったものが、例えば7:3となり、格子点(a,b)がグアニン、格子点(a+1,b)がチミンであると同定しやすくなる。
また必要に応じて、蛍光体の分散距離を変化させることもできる。例えば図1,図4における分散プリズムの分散角を異なる角度に設定したり、分散プリズムを追加したり、ビームエキスパンダーを用いるなどして実現できる。また分散プリズムをターレットに複数配置して、異なる分散距離を実現することもできる。
例えば図5において右側分散と左側分散の比を7:3として、格子点(a,b)がシトシンであった場合、右側分散は格子点(a+2,b)に左側分散は格子点(a-2,b)に7:3の蛍光強度比で検出される。例えばこの比が7:6であった時には、左側分散で格子点(a-2,b)に検出される他の格子点、例えば格子点(a+1,b)がチミンであることなどが疑われる。この際に例えば左側分散の距離を大きくすることで、チミンはシトシンよりもより左側の画素へ分光され、その距離は分散角度などの設定により予め知ることができる。従って格子点(a,b)がグアニン、格子点(a+1,b)がチミンであると同定しやすくなる。
また必要に応じて、蛍光体の蛍光強度の時間的ばらつきを利用することもできる。これは図1,図4の例でわかるように、ある瞬間における蛍光(平行光束)を異なる分散方向へ分光しているために実現できることである。蛍光強度の時間的ばらつきについて、蛍光体の1分子計測の知見では、励起光を照射し続けているにもかかわらず、蛍光強度が有る瞬間に0になり、一定時間後に蛍光信号が再び計測されるブリンキングと呼ばれる現象が発生する。ブリンキングは励起光強度が高いほど発生しやすく、蛍光体によっても差があることが知られている。対策としてβメルカプトエタノールなどのスカベンジャー試薬を、蛍光体に入れておくことによりブリンキングを抑制できるが、完全に抑えることは困難である。ブリンキングは1分子を対象とした計測においては、大きな課題となっている。特に1分子の鋳型に蛍光分子を伸長停止させないでリアルタイムで取り込みながら、取り込んだ塩基を決定する方法では、同じ蛍光信号が明滅した場合に、ブリンキングが発生して再びその蛍光体が蛍光信号を発生したのか、同じ塩基配列のものを複数回取り込んだのかを区別することが難しい。多分子の蛍光体の集合体の場合、1個1個の蛍光体がブリンキングを起こしたとしても、集合体自体がブリンキングを起こすほどにはならないが、蛍光強度は時間によりばらつく。また蛍光体は励起光を当て続けるとその蛍光信号が0になる消光現象が発生する。従って多分子の蛍光体の集合体であっても、励起光をあて続けるとその蛍光強度が現象し、やがて0になる。この時間は蛍光体ごとに異なるため、この情報を利用することもできる。例えば図5において右側分散と左側分散の比を7:3として、格子点(a,b)がシトシン1分子であった場合、右側分散は格子点(a+2,b)に左側分散は格子点(a-2,b)に7:3の蛍光強度比で検出される。例えばある瞬間に右側分散と左側分散の蛍光強度が0になった場合、格子点(a,b)はシトシン由来であることがわかる。仮にある瞬間に右側分散の蛍光強度が半分に、左側分散の蛍光強度が0になった場合には、右側分散で(a+2,b)に検出されている蛍光体は1つ〔(a,b)のシトシン〕ではなく、複数存在することが推定される。これは多分子の蛍光体の集合体(例えば微小なビーズにエマルジョンPCRなどで同一の鋳型を複数固定した場合)であっても適用できる。また必要に応じて、プリズムの分光方向を変えることもできる。例えば分散方向を360°変えながらCCDセンサで画像取得するなどした場合、格子点を中心とした円を描くことができ、それにより、格子点に存在する蛍光体を特定しやすくなる。
例えば図5において右側分散と左側分散の比を7:3として、格子点(a,b)がシトシンであった場合、右側分散は格子点(a+2,b)に左側分散は格子点(a-2,b)に7:3の蛍光強度比で検出される。例えばこの比が7:6であった時には、左側分散で格子点(a-2,b)に検出される他の格子点、例えば格子点(a+1,b)がチミンであることなどが疑われる。この際に例えば分散プリズムを回転させながら、それに応じてCCDセンサや集光レンズの位置を移動して検出するか、あるいは分散方向を連続的に換えた分散プリズム(分散角交点へ向かってすり鉢上の構造であるプリズムまたは分散角交点を頂点とした円錐形状の分散プリズム)を利用することで、格子点を中心とする同心円を観察できる。従って格子点(a,b)がグアニンであれば格子点(a,b)を中心とする半径1画素の円、格子点(a+1,b)がチミンであれば、格子点(a+1,b)を中心とする半径3画素の円を描くことができ、同定しやすくなる。また分散プリズムの形状によっては、格子点を中心とする円ではなく楕円を描かせることもでき、塩基を同定しやすくなる。また分散プリズムではなく、基板を載せているステージを回転させても良い。この場合は格子点を中心とする円ではなく、ステージの回転中心を中心とした円を描くことができる。以上より、これまで上述してきた方法は、組み合わせて行うこともできることが理解される。
分散プリズムの形状も必要に応じて変更することができる。図13に例を示す。図13は図1または図4の分散プリズム周辺の構造である。なお分散プリズム17の形状は、紙面垂直方向にも同様な形状(図13aであれば4方向への分散なので、レンズ、CCDの数も増える)であってもよいし、視野中心の点線周りに回転させた形状でもあってもよい(図13aであれば分散角交点へ向けたすり鉢型形状である)。図13aは視野中心に分散プリズム17a,17bの分散プリズム交点(分散角交点)がきている。従って分散プリズムで平行光束は2分割され、CCDセンサでの蛍光強度比は1:1となる。この配置では、分散をすることで、蛍光強度は分散をさせない場合の半分になる。図13bは視野中心と分散プリズム17a,17bの分散プリズム交点(分散角交点)とがずれた配置である。これによりCCD19a,19bでの蛍光強度比を変えることができる。図13cは平行光束中心部が分散しないプリズム配置である。従ってCCDセンサ19cでは、分散をさせない時の格子点の位置を特定できるため、仮に平行光束が分散プリズムに垂直に入射しないなどの理由で相対的な位置ずれが発生した場合でも、その位置を補正することができる。図13dはCCDの数を減らすために分散プリズム形状を変えたものである。但し1CCDで検出する場合は2方向へ分散させた情報を同時に検出してしまう。これを防ぐ必要がある場合には、図13eに示すシャッター33を移動させることで、ある特定方向への分散画像のみを取得できる。但しこの場合は例えば右側分散と左側分散の画像が時間的に異なる画像のため、ブリンキングなどの現象があっても一方向への分散画像の中でしか検出されないことがある。高速にシャッターを切り替えることで補正することもできるが、完全ではない。但し同じ格子点に多くの蛍光体が存在する場合には、CCDの数を減らせるため、有効な方法である。図13fは図13b同様に視野中心と分散プリズム17の分散プリズム交点(分散角交点)とがずれた配置である。図13eのシャッターを組み合わせることで、CCD19での蛍光強度比を変えることができる。
配列決定システムの処理量は、主に、装置が1日あたりにもたらすことができる画像の数および1つの画像あたりの配列データのヌクレオチド(塩基)の数によって規定される。装置は、好ましくは、カメラが常時作動中で維持されるように設計され、計算は、100%カメラ利用に基づいて行う。1つの塩基の実体を決定するのに各ビーズが4色で画像化される実施において、1つのカメラで4画像、2つのカメラで2画像、または4つのカメラで1画像のいずれかが使用され得る。複数のCCDセンサでの画像化により、1つのCCDセンサ他の選択肢よりも得られる波長分散情報が多くなり、好ましいシステムでは、該アプローチが用いられる。
通常の方法では、1つの塩基の実体を決定するのに4枚の画像を取得し、それらの画像をアライメントして、ビーズ位置を特定することで塩基配列を決定する。従って4枚の画像を取得する時間がかかること、4枚の画像をアライメントする時間がかかること、4枚の画像を保存するメモリ容量が必要となる。そこで更に劇的に高い処理のアプローチとして、図1,図4で示したように4色を1画像で取得する方式を説明した。図13eに示す分散プリズムを図1または図4に示す装置に配置することにより、1CCDで4色を検出する方式(分散-1CCD方式)である。従って1つの塩基の実体を決定するのに1枚の画像を取得すれば良い。従って残り3枚の画像取得が不要となるため、3枚(3色)分のステージ移動時間と、露光時間の短い3枚(3色)分の露光時間を短縮することができる。これは露光時間の最も長い蛍光色素の露光時間で、視野を露光することで、残り3色分の信号を得ることができるためである。また1つの塩基の実体を決定するのに1枚の画像で良いため、画像のアライメントが不要なこと、残り3枚の画像を保存するメモリ容量が不要となることが特徴である。分散-1CCD方式での工程を以下に説明するが、これに限定されたものではない。まずフローセル内に固定された蛍光標識ビーズを検出して、フローセル内の全ビーズ位置を特定する。或いは蛍光の替わりに散乱像を取得することで、ビーズ位置を特定する。次に蛍光標識したビーズに対して、分散プリズムを透過した4色の蛍光色素が検出される位置を把握する。分散プリズムを透過させることで、蛍光波長に応じて検出位置が変化するため、特定したビーズ位置に対する変位量を求めることで、4色のうちでどの蛍光色素が検出されたかを特定することができる。ビーズの光る位置が蛍光色素により変化するため、画像のアライメントが困難な場合には、必要に応じて画像アライメント用のマーカ(位置不変の対象物)を設置することができる。マーカは、同じ蛍光色素のみを取り込む鋳型(例えば全てアデニンを取り込む鋳型)を用いることができるほか、基板内に十字マークや、凹凸を施すなどすることができる。分散プリズムを用いることによる検出位置の変位は、分散プリズムの角度や分散プリズムからCCDセンサ検出面までの距離によって規定される。従ってビーズが配置されている平均間隔よりも、蛍光色素4色の分散間隔の方が大きい場合には、どちらのビーズの蛍光を検出しているか判断できない。従ってビーズの平均間隔よりも、4色の分散間隔を小さくする必要がある。一方でビーズの平均間隔を小さくしてビーズ密度を上げることで、1画像あたりに撮影されるビーズ数が増えることから、スループットは向上する。以上の制約を鑑みたうえで、分散-1CCD方式でスループットを上げる方法としては以下が考えられる。
1つ目は、ビーズの配置をランダムに配置するのではなく、アレイ上に配置する。分散間隔を隣接するビーズ距離以下に設定することで、スループットを向上できる。ランダムにビーズを配置した場合には、ビーズの間隔が小さい場所では4色の分散間隔よりもビーズ間隔が小さいことからどちらのビーズの蛍光を検出しているか判断できず、またビーズの間隔が大きい場所では4色の分散間隔よりもビーズ間隔が十分に大きいことから、スループットの点で劣ってしまう。従ってより好ましくは、ビーズはアレイ上に配置することが望ましい。4色の分散間隔を識別できる最小値に設定することで、ビーズを最密に配置できるため、スループットは最も高くなる。またアレイ上に配置したビーズにおいて、アレイの配置する角度によっても、許容される分散間隔は広くなる。これは例えば正方形の頂点にビーズを配置した場合、対角線上に分散させる方が、許容される分散間隔がルート2倍になることからも理解される。また分散プリズムを回転させて分散方向を変えることもできる。例えば180°変えて測定することで、その平均値は元のビーズに一致するため、信頼性は高くなる。また分散方向を45°変えることで、1ビーズ/3×2画素のアレイでも4色を判定することができる。更にプリズムを回転させながら検出することで、ビーズを中心とした同心円の軌跡を描くことができ、塩基を同定することができる。プリズムを回転させることが困難な場合は、複数のプリズムを用意して光軸をミラー,シャッターなどで切り替えて同様の機能を行うこともできる。プリズムの分散方向の画像を組み合わせることで、同心円を形成し、蛍光色素を同定する。この方式では、4色の分散間隔が、ビーズ間隔よりも大きい場合であっても蛍光色素を同定することができるため、ビーズ密度を高くでき、スループットは更に高くなる。また4色蛍光色素を分散させる距離を広く取ることもでき、蛍光色素同定の識別能が向上する。この方式では分散の最も大きい蛍光色素の蛍光強度が、分散プリズムの回転により小さくなる。従って分散プリズムを回転,停止させて測定するか、検出できる程度の速度で回転させながら測定する必要がある。或いは常に4色の蛍光色素のいずれかが検出されることがわかっている場合には、分散距離の最も大きい1色を検出しない条件で検出することで、スループットを向上させることができる。この方式では重なり合うピクセルを分散に使えるため、スループットは更に大きくなる。上述の方法で同心円を描くことにより、近接したビーズにそれぞれ取り込まれた蛍光色素を識別することも可能である。またその他にも4色蛍光色素のフィルタを高速で切り替えて1つのCCDセンサで検出する方式(フィルタ切替-1CCD方式)もある。フィルタ切替-1CCD方式では、3色分の蛍光色素を検出するための視野移動の時間をなくすことができるため、スループットが向上する。また常に4色の蛍光色素のいずれかが検出されることがわかっている場合には、露光時間の長い1色を検出しないようにすることで、スループットを向上させることができる。または以上の組み合わせとして分散-2CCD方式などが考えられる。画像化光学装置は、標準的な無限遠補正顕微鏡対物レンズおよび標準的なビームスプリッタおよびフィルタから構成されたものであり得る。標準的な2,000×2,000ピクセルCCDカメラは、画像を取得するために使用され得る。該システムには、光学装置のための適切な機械的支持体が組み込まれている。照光強度は、好ましくは、後の解析ソフトウエアによる使用のためにモニタされ、記録される。
複数の画像(例えば、代表的な実施形態において、およそ1000以上の非重複画像フィールド)を速やかに取得するため、該システムには、好ましくは、高速オートフォーカスシステムを用いる。画像自体の解析に基づくオートフォーカスシステムは、当該技術分野でよく知られている。これは、一般的に、1回のフォーカシング事象に少なくとも5フレームを必要とする。これは、フォーカシング画像を取得するために余分な照光が必要とされるという点で、低速および高価の両方である。本発明のある特定の実施形態において、択一的なオートフォーカスシステム、例えば、該機械的システムが応答し得るのと同等に高速にフォーカシングし得る独立した光学装置に基づくシステムが使用される。かかるシステムは当該技術分野で知られており、例えば、CDプレーヤーに用いられるフォーカシングシステム(サブミクロンフォーカシングを実現)が挙げられる。
本発明のある特定の実施形態において、該システムは、遠隔操作される。特定のプロトコルを実行するためのスクリプトは、セントラルデータベース内に保存し、各配列決定実行のためにダウンロードされ得る。試料は、バーコードまたはRFIDタグを付けて、試料追跡の完全性および試料と最終データとの関連付けが維持され得る。リアルタイムのセントラルモニタリングにより、プロセスエラーの迅速な解決が可能になる。ある特定の実施形態において、機器によって収集された画像は、直ちにセントラルマルチテラバイト保存システムおよび1つ以上のプロセッサバンクにアップロードされる。セントラルデータベースからの追跡データを用い、プロセッサ(1つまたは複数)により画像が解析され、配列データが作製され、任意選択で、例えば、機器の性能を調節するために、バックグラウンド蛍光レベルおよびビーズ密度などのメトリクスが処理される。
制御ソフトウエアは、ポンプ,ステージ,カメラ,フィルタ,温度制御を適正にシーケンス処理するため、ならびに画像データの注記付けおよび保存のために使用される。ユーザーインターフェースは、例えば、作業者が機器をセットアップし、維持するのを補助するために設けられ、好ましくは、スライドの負荷/取り出しおよび流体ラインの準備(プライミング)のためのステージを位置合わせする機能を含むものである。例えば、作業者に、種々の実行パラメータ、例えば、温度,ステージ位置,光学フィルタ構成の現状、実行プロトコルの状態などを示すためのディスプレイ機能を含め得る。好ましくは、試薬ロットおよび試料IDなどの追跡データを記録するデータベースへのインターフェースを含める。
また、本発明は、本発明の配列決定法を適用することにより得られた情報を保存するコンピュータ可読媒体を提供する。情報としては、生データ(すなわち、さらなる処理または解析がされていないデータ)、処理または解析されデータなどが挙げられる。データには、画像,数値も含まれる。情報は、典型的には、検索が容易なように配設された、例えば、コンピュータメモリ内に保存されたデータベース、すなわち、情報(例えば、データ)のコレクションに保存され得る。情報としては、例えば、配列および配列に関する任意の情報(例えば、部分配列),配列と参照配列との比較,配列解析の結果,ゲノム情報、例えば、多型情報など(例えば、ある特定の鋳型が多型を含むか否か)または変異情報など、連鎖情報(すなわち、例えば、染色体内での核酸配列の別の核酸配列に対する物理的な位置に関する情報),疾患関連情報(すなわち、疾患の存在または疾患に対する感受性を、被験体の身体的形質、例えば、被験体の対立遺伝子と相関させる情報)などが挙げられる。情報は、試料ID,被験体IDなどと関連したものであり得る。試料,被験体などに関するさらなる情報は、例えば、限定されないが、試料の供給源,試料において行われた処理工程,情報の解釈,試料または被験体の供給源などに含まれ得る。本発明はまた、前述の任意の情報をコンピュータ可読形式に受信する、例えば、コンピュータ可読媒体に保存することを含む方法を含む。該方法は、該情報に基づく診断的,予後的もしくは予測的情報を提供する工程、または第3者に、好ましくはコンピュータ可読媒体に保存された情報を単に提供する工程をさらに含み得る。1つ以上の鋳型から配列情報を収集するために使用され得る代表的な本発明の自動配列決定システムを記載する。好ましくは、鋳型を、実質的に平面状の基材、例えば、ガラス顕微鏡スライド上に配置させる。例えば、鋳型は、基材上でアレイ状であるビーズに結合されたものであり得る。セルは、各洗浄工程前にすべての試薬が噴出されるように、空気が充分充填されたものであり得る。フローセルは、4種類の蛍光体で標識されたプローブ混合物,切断試薬,任意の他の所望の試薬,酵素並行化バッファ,洗浄バッファおよび単一のポートを介するフローセルへの空気の送達を可能にするバルブ付きシリンジポンプを有する流体取り扱い部と接続されている。システムの操作は完全に自動化されており、多数のI/Oポートを有する専用のコンピュータを用いて、制御ソフトウエアによりプログラミング可能である。Cooke Sensicamカメラには1.3メガピクセル冷却CCDが組み込まれているが、より低いまたはより高い感度を有するを有するカメラもまた使用され得る。CCDセンサは例えば、4メガピクセル,8メガピクセルなども使用され得る)。フローセルには、0.25ミクロンステージが用いられており、形状は1ミクロンである。
この実施例では、自身に結合された標識された核酸を有するビーズのアレイからの画像の取得および処理のための代表的な方法を記載する。正確な素性の同定およびアライメントは、各取得画像の信頼できる解析に重要である。サブピクセルレベルでの格子点位置の特定方法としては、例えばUS/20080003571があるが、これに限定されるものではない。一般的にクラスタ方式の塩基配列決定方式では、解読塩基数が増えるほど、伸長反応に位相差を生じるディフェージングが生じる。これは鋳型に蛍光色素がビーズ上の鋳型に取り込まれる確率が100%ではないため、サイクル数を重ねるごとに伸長反応にずれを生じるためである。これを回避する方法として、予めディフェージングをソフト解析により予想しておく方法がある。図14に原理を示す。例としてAGCTの配列を読む場合を示す。伸長効率が90%の場合、66%が4塩基連続で伸長するが、29%は3塩基しか伸長しない。この29%については次に伸びる塩基がTと予想でき、かつ反応皇室からその90%(0.29×0.9)が伸長するため、この効果をソフトで除外して配列解析を行うことにより、読取塩基長を長くすることができる。本発明の配列決定本明細書に記載の方法は、さまざまな異なる配列決定システム,画像捕捉および処理方法などを用いて実施され得ることに注意されたい。
<第7の実施形態>
図3E~図3Lでは、3×3画素に1つの格子点が存在する場合について、その塩基配列を決定できることを示した。また図5A~図5Fでは、2×2画素に1つの格子点が存在する場合について、その塩基配列を決定できることを示した。本実施形態では1×1画素に1つの格子点が存在する場合について、その塩基配列を決定できることを以下に示す。これが可能であれば、そこから任意の格子点を除いた場合についてもその塩基配列を決定できることは自明であるため、2×2や3×3画素の1つの格子点が存在する場合や、ランダムに格子点が存在する場合についても同様の方法が適用できることになる。また分散距離が4画素より大きくても小さくても同様の方法が適用できることになる。1×1画素に1つの格子点が存在する場合には、2×2画素や3×3画素に1つの格子点が存在する場合に用いた方法だけでは、その塩基配列を特定することは難しい。
図3E~図3Lでは、3×3画素に1つの格子点が存在する場合について、その塩基配列を決定できることを示した。また図5A~図5Fでは、2×2画素に1つの格子点が存在する場合について、その塩基配列を決定できることを示した。本実施形態では1×1画素に1つの格子点が存在する場合について、その塩基配列を決定できることを以下に示す。これが可能であれば、そこから任意の格子点を除いた場合についてもその塩基配列を決定できることは自明であるため、2×2や3×3画素の1つの格子点が存在する場合や、ランダムに格子点が存在する場合についても同様の方法が適用できることになる。また分散距離が4画素より大きくても小さくても同様の方法が適用できることになる。1×1画素に1つの格子点が存在する場合には、2×2画素や3×3画素に1つの格子点が存在する場合に用いた方法だけでは、その塩基配列を特定することは難しい。
図15では、基板8の表面の一部の概略図であり、DNAが固定されるべき複数の領域8ij(格子点)が形成されている。CCDカメラへの結像倍率を7.2倍とし、dx=1μmの距離を1分割してCCD画素で検出する。格子点の最も近接する間隔は、X,Y方向共に1μmであり、X方向に4画素(/蛍光体)で分光させると、1画素あたり50nmの分散となる。
図15Aの図は、図1の19aまたは19bの2次元センサで撮影した画像をそれぞれ示している。丸が格子点の位置を、四角がCCDの1画素を示しており、CCDの画素の座標をX,Y方向それぞれに0から画素数分記載している。但しCCDは1000×1000や2000×2000画素で、全ての画素は記載できないため、CCDの左下の部分を拡大して示している。1×1画素に1つの格子点を配置しているため、2000×2000のCCDであれば400万の格子点を一度に検出できる。
以降では、(a,b)はX=a,Y=bの座標を示す。例えば(0,0)はCCDの一番左下の画素である。また(3,0)(5,2)などの位置に格子点があることがわかる。図1より、波長分散方向はXの正方向と負方向になるが、これに限定されるものではない。例えばYの正方向と負方向に波長分散させることもできるし、Y=Xの方向(傾き45°)の方向にも波長分散させることもできる。図15Aでは、仮にA(アデニン)の格子点からの変位量を0画素、G(グアニン)の格子点からの変位量を1画素、C(シトシン)の格子点からの変位量を2画素、T(チミン)の格子点からの変位量を3画素として説明する。蛍光体の波長により分散の大きさが決まるため、各塩基に修飾した蛍光体で変位量は決定される。従って上述の蛍光体と変位量との関係に限定されるものではない。そのような光学的配置は分散プリズムの角度,プリズムとCCDとの距離,CCD位置の調整によって実現可能である。1つの蛍光体あたりの波長分散画素数を1画素以上にしてもよいが、1画素あたりの蛍光強度は小さくなる。従って1つの蛍光体あたりの波長分散画素数は3画素以下が望ましい。但しこれに限定されるものではない。図15では、特定の分散方向に対して、波長分散が強く検出された画素を灰色で塗りつぶしている(以降この点を灰色画素という表現で代用する)。実際の測定では、近隣の画素の蛍光強度から近似曲線を算出することで、蛍光強度の高い画素を特定することができる。図15Aは、分散方向に対して全ての塩基配列が同じ場合について記述している。格子点(6,2)の右側分散を考えると、(6,2)~(9,2)の範囲が全て灰色画素になっている。このように1×1画素の格子点配置では、全ての画素が灰色画素である可能性がある。図15Aは格子点(a,5)が全てアデニン、格子点(a,4)が全てグアニン、格子点(a,3)が全てシトシン、格子点(a,2)が全てチミンの場合である。このように格子点3つ分隣の画素を灰色画素にできる。そこで(a,b)が灰色画素と非灰色画素(以降白色画素と表現する)である塩基配列の条件を、右側分散と左側分散のそれぞれについて図15Bに示す。塩基配列の可能性としては、A(アデニン),G(グアニン),C(シトシン),T(チミン),-(格子点なしまたは蛍光体取り込みなし)の5種類が考えられる。これより白色画素であるのは丸数字1の場合であり、灰色画素であるのは丸数字2~丸数字16までの15通りのいずれかの場合である。従って例えば格子点(a,b)が右側分散で白色画素となるのは、44=256通りである。全ての配列組み合わせは54=625通りであるため、灰色画素となるのは625-256=369通りである。これは左側分散についても同様である。また右側分散も左側分散も白色画素になるのは、47=16384通りである。全ての配列組み合わせは57=78125通りであるため、右側分散または左側分散のどちらかで灰色画素となるのは、78125-16384=61741通りである。図15Cは図15Bの配列候補となる塩基を書く格子点について灰色で示したものである。右側分散,左側分散共に丸数字1の行(斜線の灰色セル)のみが白色画素であり、丸数字2~丸数字16は全て灰色画素の場合の配列組み合わせである。
ここで図15dに示す(a-3,b)~(a+3,b)の右側分散,左側分散の結果が得られている時の塩基配列を考える。(a-3,b)で、右側分散で検出されるのは(a-6,b)~(a-3,b),(a+3,b)で、左側分散で検出されるのは(a+6,b)~(a-3,b)であるため、(a-6,b)~(a+6,b)までの格子点について考える。図15dでは、右側分散,左側分散共に格子点(a,b)のみが白色画素でありそれ以外は右側分散,左側分散共に灰色画素である。まず右側分散について考える。
図15Eは右側分散させたときに、取り得る可能性のある配列候補を適当に選択したものである。白色画素は(a,b)のみであるため、(a,b)の右側分散は丸数字1の配列である。従って図の真ん中にある(a,b)の中で丸数字1の列を黒丸で表現した(最終番号丸数字1)。それ以外の座標については全て白色画素である。従って丸数字2~丸数字16の配列候補のうち、任意のものを選択して、そのような配列を取り得るかを検証する必要がある。図15Eでは灰色画素について、全て丸数字2の配列候補を選択した(最終番号丸数字2)。丸数字2の列を黒丸で表現し、全ての座標に関して、重なる塩基候補について、塩基候補(右側分散)の欄に黒丸で表現した。この時点で、例えば(a-3,b),(a-2,b),(a-1,b)はアデニン、(a,b)は格子点なしまたは蛍光体取り込みなし、(a+1,b),(a+2,b),(a+3,b)はアデニンの塩基候補を得ることができる。なお(a-4,b)については2つの塩基候補、(a-5,b)については3つの塩基候補、(a-6,b)については4つの塩基候補がある。(a+4,b)~(a+6,b)に関しては、右側分散の場合全ての配列を取りうる。
次に右側分散で得られた塩基候補を満たす左側分散の候補があるかを図15Fで検討する。各座標について、右側分散で得られた塩基候補を満たすことができる配列候補の組み合わせを検討し、可能である場合にはその配列候補の組み合わせを黒丸で表現した。例えば(a-3,b)は丸数字2、(a-2,b)は丸数字2、(a-1,b)は丸数字2、(a,b)は丸数字1、(a+1,b)は丸数字2または丸数字8、(a+2,b)は丸数字2または丸数字7または丸数字8または丸数字14、(a+3,b)は丸数字2または丸数字6または丸数字7または丸数字8または丸数字12または丸数字13または丸数字14または丸数字16の配列候補であれば、右側分散,左側分散共に図15Dの結果が得られることがわかる。そのような塩基配列を“塩基候補”とした。このような“塩基候補”は他の配列候補の組み合わせでも得られ、図15Gにそれらの例を示した。なおここで示した以外の組み合わせもあるが、ここでは省略する。図15Eと図15Fの配列組み合わせは、図15GのNo.1の欄に示している。これより他にも多くの“塩基候補”が存在することがわかる。従って更に別の方法を用いてこれらの塩基候補の中でどの配列であるかを絞り込む必要がある。
ここで現在読んでいる配列を図15Hに示す参照配列である(a-3,b)-AAAGAAA-(a+3,b)であるとする。この場合に右側分散と左側分散でそれぞれ検出される塩基を黒丸で表示した。例えば右側分散では、(a+1,b)の座標でアデニンとグアニン由来の蛍光信号が検出されるため、AとGの欄に黒丸を表示している。ここでAは格子点(a+1,b)由来、Gは格子点(a,b)由来である。そうした際に各画素で検出される蛍光塩基の合計値を“合計”欄に示した。右側分散の時は、(a-3,b)-1,1,1,0,2,1,1-(a+3,b)であり、左側分散の時は、(a-3,b)-1,1,2,0,1,1,1-(a+3,b)である。各蛍光体の蛍光強度を同一にする方法については、第6の実施形態で述べたとおりである。従ってこの蛍光強度の情報により、図15Gの塩基候補の中で参照配列が絞り込めるかを検討する。図15Iはその結果の一例である。図15Gの“塩基候補”の中でNo.1~3について計算した。その結果参照塩基以外の配列では、蛍光塩基の合計値が参照配列と異なるため、塩基候補から除外できることが分かる。従って3-1の候補配列(a-3,b)-AAAGAAA-(a+3,b)が求める塩基候補であることがわかる。また右側分散と左側分散の強度比(分散率)を設定することで、図15Jに示す塩基配列に対応した画素と蛍光強度の画像が得られ、塩基配列を特定しやすくなる。更に第6の実施形態で述べた方法などを用いることで、塩基同定の信頼性は高くなる。以上より複数方向への分散画像より、塩基配列を同定することができる。また分散距離が4画素の場合、図3A~図3Dの例では、隣接する格子間距離を分散距離4画素必要であったが、図5A~図5Fの例では、格子間距離は1画素で同様の解析が実現できる。従って1視野で検出できる格子点数は、図5A~図5Fの例では図3A~図3Dと比較して、(4×4)/(1×1)で16倍になり、その分塩基配列を多く同定でき、スループットは向上する。
以上のように、第7の実施形態によれば、分散分光イメージング法に基づくシステムにおいて、特定の格子点から発する蛍光像を、複数の波長分散方向に分散させることで、蛍光体の識別と波長分散対象物の位置の同定を精度よく行うことができる。
伸長反応を利用したDNAシーケンサ,DNAマイクロアレイリーダーなどに利用できる。
5,104b ミラー
6,32,104a,103 ダイクロイックミラー
7 プリズム
8,60 基板
8a 反応領域
8ij DNAが固定される領域
9 フローチャンバ
10 廃液チューブ
11 廃液容器
12 試薬導入口
13 蛍光
14 集光レンズ(対物レンズ)
15 フィルタユニット
16 透過光観察用鏡筒
17a,17b 波長分散プリズム
18a,18b 結像レンズ
19a,19b 2次元センサカメラ
20a,20b 2次元センサカメラコントローラ
21 制御PC
22,24 モニタ
23 TVカメラ
25 分注ユニット
26 分注ノズル
27 試薬保管ユニット
27a 試料液容器
27b,27c,27d,27e dNTP誘導体溶液容器
27f 洗浄液容器
28 チップボックス
29 自動ピントあわせ装置
30,31,61,62,63 位置きめマーカ
32 ステージ
33 スリット
34 ダイクロイックミラー
60a 反応領域
60b マスク
60ij DNAが固定される領域
100,101a,101b,101c,101d レーザ装置
102a,102b,102c,102d λ/4波長板
200 測定基板
201 PDMS樹脂
202 窪み
203 ホルダ
204 フローチャンバ
205 基板保持具
206 貫通孔
207 開口部
208 流路
209 XYステージ
210 プリズムホルダ
dx,dy 領域8ijの間隔の寸法
6,32,104a,103 ダイクロイックミラー
7 プリズム
8,60 基板
8a 反応領域
8ij DNAが固定される領域
9 フローチャンバ
10 廃液チューブ
11 廃液容器
12 試薬導入口
13 蛍光
14 集光レンズ(対物レンズ)
15 フィルタユニット
16 透過光観察用鏡筒
17a,17b 波長分散プリズム
18a,18b 結像レンズ
19a,19b 2次元センサカメラ
20a,20b 2次元センサカメラコントローラ
21 制御PC
22,24 モニタ
23 TVカメラ
25 分注ユニット
26 分注ノズル
27 試薬保管ユニット
27a 試料液容器
27b,27c,27d,27e dNTP誘導体溶液容器
27f 洗浄液容器
28 チップボックス
29 自動ピントあわせ装置
30,31,61,62,63 位置きめマーカ
32 ステージ
33 スリット
34 ダイクロイックミラー
60a 反応領域
60b マスク
60ij DNAが固定される領域
100,101a,101b,101c,101d レーザ装置
102a,102b,102c,102d λ/4波長板
200 測定基板
201 PDMS樹脂
202 窪み
203 ホルダ
204 フローチャンバ
205 基板保持具
206 貫通孔
207 開口部
208 流路
209 XYステージ
210 プリズムホルダ
dx,dy 領域8ijの間隔の寸法
Claims (23)
- オリゴヌクレオチド等の生体関連分子が固定される基板に蛍光測定用の光を照射し、生じる蛍光を集光し、集光された光を分光し、2次元センサに光を結像させ、2次元センサにて蛍光検出する方法であって、実質的に透明な基板と、該基板に分子が固定されうる領域は複数設けられ、それらが基板上に配置され、波長分散を行い、該波長分散とは異なる波長分散条件で波長分散を行い、分光された波長ごとの強度と分光対象物の位置を算定することを特徴とする蛍光分析方法。
- 請求項1記載の蛍光分析方法において、集光された光を分光するための光学素子を1つ以上用いることを特徴とする蛍光分析方法。
- 請求項2記載の蛍光分析方法において、分散プリズム、回折格子のいずれかの光学素子を用いることを特徴とする蛍光分析方法。
- 請求項3に記載の蛍光分析方法において、2方向以上に波長分散させる分散プリズムを用いることを特徴とする蛍光分析方法。
- 請求項3に記載の蛍光分析方法において、2方向以上に波長分散させる分散プリズムの分散角度が異なることを特徴とする蛍光分析方法。
- 請求項3に記載の蛍光分析方法において、分光しない部分を含む分散プリズムを用いることを特徴とする蛍光分析方法。
- 請求項6に記載の蛍光分析方法において、分光しない部分のデータから、分光対象物の位置を算定することを特徴とする蛍光分析方法。
- 請求項1記載の蛍光分析方法において、該波長分散とは異なる位置に波長分散を行う方法として、波長分散方向と波長分散距離を変えることを特徴とする蛍光分析方法。
- 請求項1記載の蛍光分析方法において、波長分散条件ごとに蛍光強度を調整することを特徴とする蛍光分析方法。
- 請求項9記載の蛍光分析方法において、分散プリズムの頂点位置を蛍光の平行光束中心からずれた位置に配置することを特徴とする蛍光分析方法。
- 請求項1記載の蛍光分析方法において、該基板に分子が固定されうる領域が格子状に配置されている蛍光分析方法。
- 請求項11記載の蛍光分析方法において、該格子構造の格子点位置に金属の微小な構造物を設けたことを特徴とする蛍光分析方法。
- 請求項12記載の蛍光分析方法において、金属の微小な構造物は、金,クロム,銀,アルミなどの金属の微粒子、一部に微細な突起を有する構造体などの、励起光の波長以下の大きさをなす金属構造体であることを特徴とする蛍光分析方法。
- 請求項11記載の蛍光分析方法において、該格子構造の格子点位置に微小開口を有し、光学的に不透明な材質の薄膜で構成された基板を使用することを特徴とする蛍光分析方法。
- 請求項1記載の蛍光分析方法において、格子点間隔よりも分散距離の方が長いことを特徴とする蛍光分析方法。
- 請求項1記載の蛍光分析方法において、2次元センサの3×3画素に1個の割合で格子点を配置して、波長分散により、分光された波長毎の強度と分光対象物の位置を特定することを特徴とする蛍光分析方法。
- 請求項1記載の蛍光分析方法において、2次元センサの2×2画素に1個の割合で格子点を配置して、波長分散により、分光された波長毎の強度と分光対象物の位置を特定することを特徴とする蛍光分析方法。
- 請求項1記載の蛍光分析方法において、2次元センサの1×1画素に1個の割合で格子点を配置して、波長分散により、分光された波長毎の強度と分光対象物の位置を特定することを特徴とする蛍光分析方法。
- 請求項1記載の蛍光分析方法において、波長分散を行い、該波長分散とは異なる波長分散条件で波長分散を行う工程を、同時に行うことを特徴とする蛍光分析方法。
- 請求項1記載の蛍光分析方法において、波長分散位置を変えながら、2次元センサを露光し続けて蛍光検出することを特徴とする蛍光分析方法。
- 請求項1記載の蛍光分析方法において、伸長反応の位相差をそれまでに取得した情報を用いて補正することを特徴とする蛍光分析方法。
- 請求項1記載の蛍光分析方法において、1方向の波長分散における分光された波長ごとの強度を用いて、それとは異なる波長分散条件における波長ごとの強度を規格化することを特徴とする蛍光分析方法。
- 請求項1記載の蛍光分析方法において、異なる波長分散における強度を用いて、分光対象物の波長ごとの強度を同定することを特徴とする蛍光分析方法。
Priority Applications (1)
| Application Number | Priority Date | Filing Date | Title |
|---|---|---|---|
| US13/378,058 US20120126142A1 (en) | 2009-06-15 | 2010-04-14 | Fluorescent analysis method |
Applications Claiming Priority (2)
| Application Number | Priority Date | Filing Date | Title |
|---|---|---|---|
| JP2009-141786 | 2009-06-15 | ||
| JP2009141786A JP5277082B2 (ja) | 2009-06-15 | 2009-06-15 | 蛍光分析方法 |
Publications (1)
| Publication Number | Publication Date |
|---|---|
| WO2010146758A1 true WO2010146758A1 (ja) | 2010-12-23 |
Family
ID=43356095
Family Applications (1)
| Application Number | Title | Priority Date | Filing Date |
|---|---|---|---|
| PCT/JP2010/002678 Ceased WO2010146758A1 (ja) | 2009-06-15 | 2010-04-14 | 蛍光分析方法 |
Country Status (3)
| Country | Link |
|---|---|
| US (1) | US20120126142A1 (ja) |
| JP (1) | JP5277082B2 (ja) |
| WO (1) | WO2010146758A1 (ja) |
Cited By (3)
| Publication number | Priority date | Publication date | Assignee | Title |
|---|---|---|---|---|
| JP2015158380A (ja) * | 2014-02-21 | 2015-09-03 | 株式会社ニコン | 検出装置、検出方法、バイオアッセイ装置、スクリーニング装置及びスクリーニング方法 |
| WO2017206143A1 (en) * | 2016-06-02 | 2017-12-07 | Henkel (China) Investment Co., Ltd. | Portable ultraviolet excited fluorescence intensity detector |
| CN112005101A (zh) * | 2018-08-28 | 2020-11-27 | 松下知识产权经营株式会社 | 传感器基板及其制造方法 |
Families Citing this family (52)
| Publication number | Priority date | Publication date | Assignee | Title |
|---|---|---|---|---|
| JP5618556B2 (ja) * | 2010-01-28 | 2014-11-05 | 株式会社日立ハイテクノロジーズ | 核酸分析装置,核酸分析反応デバイス、および核酸分析用反応デバイス用基板 |
| DE102011009075B4 (de) * | 2011-01-21 | 2021-07-22 | Kostal Automobil Elektrik Gmbh & Co. Kg | Kameraanordnung für ein Kraftfahrzeug |
| JP5687514B2 (ja) * | 2011-02-17 | 2015-03-18 | 株式会社日立ハイテクノロジーズ | 核酸配列解析装置 |
| EP3604555B1 (en) | 2011-10-14 | 2024-12-25 | President and Fellows of Harvard College | Sequencing by structure assembly |
| JP5892589B2 (ja) * | 2011-11-24 | 2016-03-23 | マイクロ化学技研株式会社 | マイクロデバイス及びバイオアッセイシステム |
| ES2991004T3 (es) | 2011-12-22 | 2024-12-02 | Harvard College | Métodos para la detección de analitos |
| EP4249605B1 (en) | 2011-12-22 | 2024-08-28 | President And Fellows Of Harvard College | Methods for analyte detection |
| US9914967B2 (en) | 2012-06-05 | 2018-03-13 | President And Fellows Of Harvard College | Spatial sequencing of nucleic acids using DNA origami probes |
| US8836936B2 (en) * | 2013-02-05 | 2014-09-16 | Shenzhen China Star Optoelectronics Technology Co., Ltd | Inspecting device for detecting appearance of debris on a surface of a glass substrate, inspecting apparatus and method for conducting inspection |
| EP2971184B1 (en) | 2013-03-12 | 2019-04-17 | President and Fellows of Harvard College | Method of generating a three-dimensional nucleic acid containing matrix |
| CN105378458B (zh) * | 2013-06-07 | 2021-05-25 | 马尔文仪器有限公司 | 基于检测器阵列的样本表征 |
| JP2015010910A (ja) * | 2013-06-28 | 2015-01-19 | 株式会社ニコン | 検出方法、検出装置、バイオチップのスクリーニング方法、スクリーニング装置及びバイオチップ |
| JP2015017940A (ja) * | 2013-07-12 | 2015-01-29 | 株式会社ニコン | 検出方法、検出装置、バイオチップのスクリーニング方法、スクリーニング装置及びバイオチップ |
| CN104749158B (zh) * | 2013-12-27 | 2020-12-11 | 同方威视技术股份有限公司 | 珠宝玉石鉴定方法及装置 |
| US10451553B2 (en) * | 2014-04-03 | 2019-10-22 | Hitachi High-Technologies Corporation | Fluorescence spectrometer |
| EP2950519B1 (de) * | 2014-05-26 | 2016-05-25 | Sick Ag | Kamera und Verfahren zur Aufnahme von Bilddaten |
| EP3153845B1 (en) * | 2014-05-29 | 2020-05-27 | Konica Minolta, Inc. | Surface-plasmon enhanced fluorescence measurement method and surface-plasmon enhanced fluorescence measurement device |
| WO2016007839A1 (en) | 2014-07-11 | 2016-01-14 | President And Fellows Of Harvard College | Methods for high-throughput labelling and detection of biological features in situ using microscopy |
| CA2996476A1 (en) * | 2015-09-01 | 2017-03-09 | Qiagen Instruments Ag | Systems and methods for color detection in high-throughput nucleic acid sequencing systems |
| AU2016349288A1 (en) | 2015-11-03 | 2018-05-31 | President And Fellows Of Harvard College | Method and apparatus for volumetric imaging of a three-dimensional nucleic acid containing matrix |
| EP4613756A3 (en) | 2016-04-25 | 2025-11-12 | President And Fellows Of Harvard College | Hybridization chain reaction methods for in situ molecular detection |
| US10809198B2 (en) * | 2016-07-19 | 2020-10-20 | Konica Minolta, Inc. | Detection method and detection device |
| CN118853848A (zh) | 2016-08-31 | 2024-10-29 | 哈佛学院董事及会员团体 | 将生物分子的检测组合到使用荧光原位测序的单个试验的方法 |
| US10883820B2 (en) | 2017-11-13 | 2021-01-05 | Taiwan Semiconductor Manufacturing Co., Ltd. | Apparatus and method for metrology |
| US11499962B2 (en) | 2017-11-17 | 2022-11-15 | Ultima Genomics, Inc. | Methods and systems for analyte detection and analysis |
| US10344328B2 (en) | 2017-11-17 | 2019-07-09 | Ultima Genomics, Inc. | Methods for biological sample processing and analysis |
| EP3729055B1 (en) * | 2017-12-22 | 2025-11-05 | Radiometer Medical ApS | Method and sensor for detecting presence or absence of a contaminant |
| WO2020076976A1 (en) | 2018-10-10 | 2020-04-16 | Readcoor, Inc. | Three-dimensional spatial molecular indexing |
| CN111272715B (zh) * | 2018-12-04 | 2023-03-14 | 长春长光华大智造测序设备有限公司 | 一种基因测序仪的荧光成像系统 |
| US12239980B2 (en) | 2018-12-07 | 2025-03-04 | Ultima Genomics, Inc. | Implementing barriers for controlled environments during sample processing and detection |
| US10512911B1 (en) | 2018-12-07 | 2019-12-24 | Ultima Genomics, Inc. | Implementing barriers for controlled environments during sample processing and detection |
| CN111323399A (zh) * | 2018-12-15 | 2020-06-23 | 中国科学院深圳先进技术研究院 | 多色荧光同步检测的液滴微流控芯片 |
| EP3705875B1 (en) * | 2019-03-05 | 2022-11-30 | IMEC vzw | An apparatus and method for detecting photoluminescent light emitted from a sample |
| US10900078B2 (en) | 2019-03-14 | 2021-01-26 | Ultima Genomics, Inc. | Methods, devices, and systems for analyte detection and analysis |
| US10830703B1 (en) | 2019-03-14 | 2020-11-10 | Ultima Genomics, Inc. | Methods, devices, and systems for analyte detection and analysis |
| US10852518B1 (en) * | 2019-03-14 | 2020-12-01 | Ultima Genomics, Inc. | Methods, devices, and systems for analyte detection and analysis |
| US11118223B2 (en) | 2019-03-14 | 2021-09-14 | Ultima Genomics, Inc. | Methods, devices, and systems for analyte detection and analysis |
| JP7164927B2 (ja) * | 2019-03-19 | 2022-11-02 | 株式会社日立製作所 | デジタルpcr計測装置 |
| US12031897B2 (en) * | 2019-03-28 | 2024-07-09 | Memorial Sloan Kettering Cancer Center | Target-locking single-molecule nanoscopy |
| WO2020235142A1 (ja) * | 2019-05-20 | 2020-11-26 | 日本電気株式会社 | 分光分析装置、分光分析方法及びコンピュータ可読媒体 |
| US10841504B1 (en) | 2019-06-20 | 2020-11-17 | Ethicon Llc | Fluorescence imaging with minimal area monolithic image sensor |
| US11633089B2 (en) | 2019-06-20 | 2023-04-25 | Cilag Gmbh International | Fluorescence imaging with minimal area monolithic image sensor |
| US11432706B2 (en) | 2019-06-20 | 2022-09-06 | Cilag Gmbh International | Hyperspectral imaging with minimal area monolithic image sensor |
| US10952619B2 (en) | 2019-06-20 | 2021-03-23 | Ethicon Llc | Hyperspectral and fluorescence imaging and topology laser mapping with minimal area monolithic image sensor |
| US10979646B2 (en) | 2019-06-20 | 2021-04-13 | Ethicon Llc | Fluorescence imaging with minimal area monolithic image sensor |
| EP4097251A1 (en) | 2020-01-29 | 2022-12-07 | 10X Genomics, Inc. | Compositions and methods for analyte detection |
| US12480953B2 (en) | 2020-02-12 | 2025-11-25 | Arizona Board Of Regents On Behalf Of Arizona State University | Single molecule imaging |
| US12566323B2 (en) * | 2020-07-07 | 2026-03-03 | Secretary, Department Of Biotechnology | AI enabled selective raman spectrometry using microscopy for diagnosis and analysis of biological samples |
| US20220049303A1 (en) | 2020-08-17 | 2022-02-17 | Readcoor, Llc | Methods and systems for spatial mapping of genetic variants |
| JP7630969B2 (ja) * | 2020-11-20 | 2025-02-18 | キヤノン株式会社 | 識別装置 |
| JP7754931B2 (ja) * | 2020-12-21 | 2025-10-15 | シンギュラー・ゲノミクス・システムズ・インコーポレイテッド | 多色撮像のためのシステム及び方法 |
| WO2025258479A1 (ja) * | 2024-06-14 | 2025-12-18 | 株式会社日立製作所 | 試料温度調節装置及びこれを用いた遺伝子増幅装置 |
Citations (6)
| Publication number | Priority date | Publication date | Assignee | Title |
|---|---|---|---|---|
| JPH02269936A (ja) * | 1989-04-12 | 1990-11-05 | Hitachi Ltd | 蛍光検出型電気泳動装置 |
| JPH1068694A (ja) * | 1997-06-30 | 1998-03-10 | Hitachi Ltd | 核酸の塩基配列決定方法 |
| JP2003520954A (ja) * | 2000-01-24 | 2003-07-08 | アムニス、コーポレーション | 細胞などの小移動物体の撮像・分析パラメータ |
| JP2005084029A (ja) * | 2003-09-11 | 2005-03-31 | Olympus Corp | 分光光学装置 |
| JP2006292368A (ja) * | 2005-04-05 | 2006-10-26 | Hitachi High-Technologies Corp | 電気泳動装置、及び電気泳動方法 |
| JP2010117344A (ja) * | 2008-10-16 | 2010-05-27 | Sony Corp | 光学的測定装置 |
-
2009
- 2009-06-15 JP JP2009141786A patent/JP5277082B2/ja not_active Expired - Fee Related
-
2010
- 2010-04-14 US US13/378,058 patent/US20120126142A1/en not_active Abandoned
- 2010-04-14 WO PCT/JP2010/002678 patent/WO2010146758A1/ja not_active Ceased
Patent Citations (6)
| Publication number | Priority date | Publication date | Assignee | Title |
|---|---|---|---|---|
| JPH02269936A (ja) * | 1989-04-12 | 1990-11-05 | Hitachi Ltd | 蛍光検出型電気泳動装置 |
| JPH1068694A (ja) * | 1997-06-30 | 1998-03-10 | Hitachi Ltd | 核酸の塩基配列決定方法 |
| JP2003520954A (ja) * | 2000-01-24 | 2003-07-08 | アムニス、コーポレーション | 細胞などの小移動物体の撮像・分析パラメータ |
| JP2005084029A (ja) * | 2003-09-11 | 2005-03-31 | Olympus Corp | 分光光学装置 |
| JP2006292368A (ja) * | 2005-04-05 | 2006-10-26 | Hitachi High-Technologies Corp | 電気泳動装置、及び電気泳動方法 |
| JP2010117344A (ja) * | 2008-10-16 | 2010-05-27 | Sony Corp | 光学的測定装置 |
Non-Patent Citations (1)
| Title |
|---|
| BRASLAVSKY I ET AL.: "Sequence information can be obtained from single DNA molecules", PROC. NATL. ACAD. SCI. USA, vol. 100, no. 7, 1 April 2003 (2003-04-01), pages 3960 - 3964, XP002388726, DOI: doi:10.1073/pnas.0230489100 * |
Cited By (4)
| Publication number | Priority date | Publication date | Assignee | Title |
|---|---|---|---|---|
| JP2015158380A (ja) * | 2014-02-21 | 2015-09-03 | 株式会社ニコン | 検出装置、検出方法、バイオアッセイ装置、スクリーニング装置及びスクリーニング方法 |
| WO2017206143A1 (en) * | 2016-06-02 | 2017-12-07 | Henkel (China) Investment Co., Ltd. | Portable ultraviolet excited fluorescence intensity detector |
| US10718714B2 (en) | 2016-06-02 | 2020-07-21 | Henkel (China) Investment Co. Ltd. | Portable ultraviolet excited fluorescence intensity detector |
| CN112005101A (zh) * | 2018-08-28 | 2020-11-27 | 松下知识产权经营株式会社 | 传感器基板及其制造方法 |
Also Published As
| Publication number | Publication date |
|---|---|
| JP2010286421A (ja) | 2010-12-24 |
| US20120126142A1 (en) | 2012-05-24 |
| JP5277082B2 (ja) | 2013-08-28 |
Similar Documents
| Publication | Publication Date | Title |
|---|---|---|
| JP5277082B2 (ja) | 蛍光分析方法 | |
| US8680484B2 (en) | Fluorescence analyzing apparatus and fluorescence detecting apparatus | |
| JP4170947B2 (ja) | 生体試料成分検出法及びその装置 | |
| US7064813B2 (en) | Apparatus and method for measuring micro area in specimen | |
| US8680483B2 (en) | Fluorescence detector | |
| US20060170918A1 (en) | Detection Apparatus and Detection Method for Plasmon Resonance and Fluorescence | |
| US8175809B2 (en) | Fluorescence analyzing method, fluorescence analyzing apparatus and image detecting method | |
| CN112326557A (zh) | 对样品成像用于生物或化学分析的方法、载体组件和系统 | |
| JP6581707B2 (ja) | 核酸分析装置、および核酸分析方法 | |
| WO2002037209A9 (en) | System, method, and computer software product for linked window interfaces | |
| JP6416530B2 (ja) | 蛍光観察装置、および蛍光観察方法 | |
| JP5066110B2 (ja) | 蛍光分析装置、及び蛍光分析方法 | |
| JP5372876B2 (ja) | 核酸分析デバイス,核酸分析装置、及び核酸分析方法 | |
| JP4982523B2 (ja) | 蛍光分析方法,蛍光分析装置及び画像検出方法 | |
| CN118451509A (zh) | 用于核苷酸测序的动态图形状态概要 | |
| JP2009270931A (ja) | 単一核酸分子観察装置 | |
| JP5581228B2 (ja) | 蛍光検出装置 | |
| JP2012023988A (ja) | 核酸解析方法、その方法を実施する装置、及び核酸解析用試薬セット | |
| KR100818351B1 (ko) | 다채널 바이오 칩 스캐너 | |
| JP5171668B2 (ja) | 基板の位置ずれを補正する方法 | |
| JP4967261B2 (ja) | プローブ担体 |
Legal Events
| Date | Code | Title | Description |
|---|---|---|---|
| 121 | Ep: the epo has been informed by wipo that ep was designated in this application |
Ref document number: 10789143 Country of ref document: EP Kind code of ref document: A1 |
|
| WWE | Wipo information: entry into national phase |
Ref document number: 13378058 Country of ref document: US |
|
| NENP | Non-entry into the national phase |
Ref country code: DE |
|
| 122 | Ep: pct application non-entry in european phase |
Ref document number: 10789143 Country of ref document: EP Kind code of ref document: A1 |