【発明の名称】FTIR法による多成分ガス分析方法
【特許請求の範囲】
【請求項1】FTIR法で得られた吸収スペクトルに基づいて試料中の複数成分を定量分析するFTIR法による多成分ガス分析方法において、定量アルゴリズムによって混合ガススペクトルから多成分濃度を算出した後、一部の成分についてはさらに共存ガス成分によるスペクトルの変化分の補正計算を行うようにしたことを特徴とするFTIR法による多成分ガス分析方法。
【発明の詳細な説明】
【0001】
【発明の属する技術分野】
この発明は、FTIR(フーリエ変換赤外分光)法で得られた吸収スペクトルに基づいて試料中の複数成分を定量分析するFTIR法による多成分ガス分析方法に関する。
【0002】
【従来の技術】
図1は、上記FTIR法に則ったフーリエ変換赤外分光光度計を用いたガス分析装置(以下、FTIRガス分析装置という)の構成を概略的に示すもので、この図において、1は分析部、2はこの分析部1の出力であるインターフェログラムを処理するデータ処理部である。
【0003】
前記分析部1は、平行な赤外光を発するように構成された赤外光源3と、ビームスプリッタ4、固定ミラー5、図外の駆動機構によって例えばX−Y方向に平行移動する可動ミラー6からなる干渉機構7と、測定試料や比較(参照)試料等を収容し、干渉機構7を介して赤外光源3からの赤外光が照射されるセル8と、半導体検出器9等から構成されている。
【0004】
そして、前記データ処理部2は、例えばコンピュータよりなり、インターフェログラムを加算平均し、その加算平均出力を高速でフーリエ変換し、さらに、このフーリエ変換出力に基づいて測定対象成分に関するスペクトル演算を行うように構成されている。
【0005】
上述のように構成されたFTIRガス分析装置においては、次のようにして複数の成分を定量分析することができる。すなわち、セル8に比較試料または測定試料をそれぞれ収容して赤外光源3からの赤外光をセル8に照射し、比較試料または測定試料のインターフェログラムを測定する。これらのインターフェログラムをデータ処理部2において、それぞれフーリエ変換してパワースペクトルを得た後、比較試料のパワースペクトルに対する測定試料のパワースペクトルの比を求め、これを吸光度スケールに変換することにより吸収スペクトルを得た後、この吸収スペクトル中の複数の波数ポイントにおける吸光度に基づいて測定試料中に含まれる複数の成分を定量分析するのである。
【0006】
上記複数の成分を定量分析する方法として、例えば、本願の出願人に係る特許第2649667号、特許第2741376号、特許第2926277号、特許第2926278号の明細書に記載されたものがあり、例えば特許第2649667号の多成分分析方法は、吸収スペクトル中の複数の波数ポイントにおける局所的ピーク値と局所的バレー値との差である相対吸光度の和を求め、この和に基づいて複数の成分の濃度を各別に得るというものである。
【0007】
さらに、多成分の定量分析に際しては、上記方法のほか、PLS(Partial Least Square、部分最小二乗)法、PCR(Principal Component Regression、主成分分析)法等といった多変量解析の定量アルゴリズムを用いることもできる。これらの方法はいずれも、濃度既知の参照スペクトルに基づいて予め濃度演算用のデータ(校正行列)を作成しておき、濃度未知の試料のスペクトルデータとの演算行列により、複数の成分の濃度を各別に算出するものである。
【0008】
【発明が解決しようとする課題】
ところで、上記FTIR法によるエンジン排ガス測定では、前記PLS法、PCR法等、一般に用いられる定量アルゴリズムを適用するだけでは、実サンプルガス測定時において、CO、CO2 、NOなどの指示がサンプルガス中に共存する高濃度のH2 Oの影響を受けて実際の濃度より高くなることがわかっている。これは、前記定量アルゴリズムでスペクトルの重なりが分離しきれないことによる干渉とは異なり、同一成分・同一濃度であってもベースガス組成により、例えば、図6に示すように、スペクトル強度に差が生ずるためである。より具体的には、たとえば(N2 +H2 O)ガスベースの実サンプル中のCOのスペクトルの方が、N2 ガスベースのスパンガス中のCOのスペクトルより吸収が大きいためである。なお、図6において、符号10,11,12は、N2 をベースガスとしたときのCO、CO+H2 O、H2 Oのそれぞれ吸収スペクトルを示している。なお、これと同様の現象は、赤外線の吸収のないO2 、H2 などの共存によっても起こりうる。
【0009】
上述のような現象が生ずる正確な機構は不明であるが、一つには、ガス分子同士の相互作用によるクエンチング等が関係している考えられる。図7は、クエンチングによる赤外吸収量変化モデルを示すもので、このモデルは、ガス成分Xとベースガスの衝突確率および相互作用の大小によって、赤外吸収量に変化が生ずることを示している。すなわち、同図(A)は、ガス成分Xに対してベースガスAの衝突確率および相互作用が共に小さい場合を示し、この場合、ガス成分Xの基底状態・励起状態の平衡に影響を余り与えないため、ベースガスAの存在はガス成分Xの吸収量に殆ど影響しない。また、同図(B)は、ガス成分Xに対してベースガスBの衝突確率および相互作用が共に大きい場合を示し、この場合、ガス成分Xの平衡が基底状態側にずれるため、新たな光吸収が起こりやすくなる。つまり、ベースガスBの存在により、ガス成分Xの吸収強度が大きくなり、ベースガスが成分Aであった場合よりも強い吸収を示す。図6に示した例では、N2が成分A、H2 Oが成分B、COが成分Xに相当する。
【0010】
また、他の機構としては、他成分の共存によって吸収スペクトルの線幅が広がる「衝突広がり」というメカニズムも考えられる。
【0011】
この発明は、上述の事柄に留意してなされたもので、その目的は、ベースガス組成によるスペクトル自体の強度変化に起因する共存ガスの影響を補正し、精度の高い測定を行うことができるFTIR法による多成分ガス分析方法を提供することである。
【0012】
【課題を解決するための手段】
上記目的を達成するため、この発明では、FTIR法で得られた吸収スペクトルに基づいて試料中の複数成分を定量分析するFTIR法による多成分ガス分析方法において、定量アルゴリズムによって混合ガススペクトルから多成分濃度を算出した後、一部の成分についてはさらに共存ガス成分によるスペクトルの変化分の補正計算を行うようにしている。
【0013】
前記補正計算を行う際、共存ガス成分がFTIR法で測定可能ならばその測定結果を用いることができ、そのようにした場合、測定値の時間遅れが無視できる。また、共存ガス成分がFTIR法で測定不可能ならば外部分析計より読み込んで使用すればよく、その場合、FTIRのデータ処理部において時間合わせを行えばよい。
【0014】
この発明のFTIR法による多成分ガス分析方法によれば、通常の定量アルゴリズムでは考慮できないスペクトル自体の強度変化に起因する誤差をも補正することができ、FTIR法ガス分析の精度の向上が図れる。特に、排ガスと校正ガスのベースガス組成、特に、H2 O濃度の差、および、測定中のサンプルガスにおけるH2 O濃度の変化による影響の補正に効果的である。
【0015】
【発明の実施の形態】
この発明の実施の形態を、図面を参照しながら説明する。上述のように、実サンプルガスを測定する場合、それに含まれるH2 Oの影響が非常に大きい。そこで、以下に、FTIR法で測定可能な成分であるH2 OによるCO等への共存影響を、多変量解析法による濃度演算後に補正する式の検討を行った例を説明する。なお、H2 O以外の成分による影響は、事実上無視できることを前提にしている。
【0016】
1.補正式の検討
(1)影響値の傾向確認
図2は、CO10%レンジに対するH2 Oの共存影響の例(リニアライズ前の値にて計算(Raw))を示し、同図(A)はCO濃度固定の場合を、同図(B)はH2 O濃度固定の場合をそれぞれ示している。この図2から、影響値の幅は、H2 O濃度固定時の変化は、ほぼ一次式(Y=aX)で近似できるが、成分によっては、二次式(Y=aX2 +bX)の方がよりよく近似できる例もあることがわかる。
【0017】
(2)影響のモデルと補正式
図3は、COとH2 Oにおける影響値のモデルと補正式の例を示している。まず、このモデルは、H2 Oのピーク強度(リニアライズ前の濃度計算値)x(=W)と、COのピーク強度の変化分(リニアライズ前の濃度計算値の変化分)yとは、一次式(y=Sx)の関係にあり、この一次式の傾きSが、同図(A)に示すように、COのピーク強度に応じて変化すると仮定する。前記傾きS(=Y)と、H2 Oの影響がない状態でのCOのピーク強度X(=C)との関係を、同図(B)に示すように、二次式(Y=aX2 +bX)で近似する。ここで、従来のPCR法で得られるCO濃度値Rは、
で表される。この式をX(=C)について解くことにより、H2 Oの影響を補正したCOのピーク強度を求める関係式が導かれる。
【0018】
上記の方法において、補正係数a,bを求めるには、前記図3(B)に示されるデータ、つまり、H2 O濃度をほぼ固定してCO濃度のみを変化させたときの共存影響の実測値を用いる(H2 O濃度を変化させたときのデータは不要)。
【0019】
そして、補正後のCO濃度(リニアライズ前)Cは、次のように表される。 a=0(Y=bX)のとき
C=R/(1+bW)
a≠0(Y=aX2 +bX)のとき
C=〔√{(1+bW)2 +4aWR}−(1+bW)〕/2aW
ここで、R:補正前のCO濃度(リニアライズ前)
W:H2 O濃度(リニアライズ前)
【0020】
(3)補正結果の例
図4は、図2に示した式で補正を行った例(CO10%レンジ)を示すもので、同図(A)は補正前のデータを示し、同図(B)は補正後のデータを示している。この補正方法により、最大で約12%(フルスケール(FS)あたり)の影響値が±1%強の範囲に納まっていることがわかる。
【0021】
2.機差の確認
各装置ごとに係数決定のための実測データをどのように採取するかは、H2 O共存影響の絶対値・傾向のバラツキをもとに決定する必要がある。そこで、3台の装置A,B,Cを用いてこのバラツキと補正方法の簡略化の可能性について確認した。
【0022】
(1)影響値の傾向確認
図5は、CO10%レンジにおける影響値のバラツキを示すもので、同図(A)は生データ(CO10%)におけるCOのピーク強度と誤差との関係を示し、同図(B)は規格化(CO10%)におけるCOのピーク強度と誤差との関係を示している。この図5から、絶対値としてはかなりの開きがあるものの、傾向には共通性があることがわかる。バラツキの一因として、PCR法の演算に用いるポイントが1台ごとに異なっていることが考えられる。
【0023】
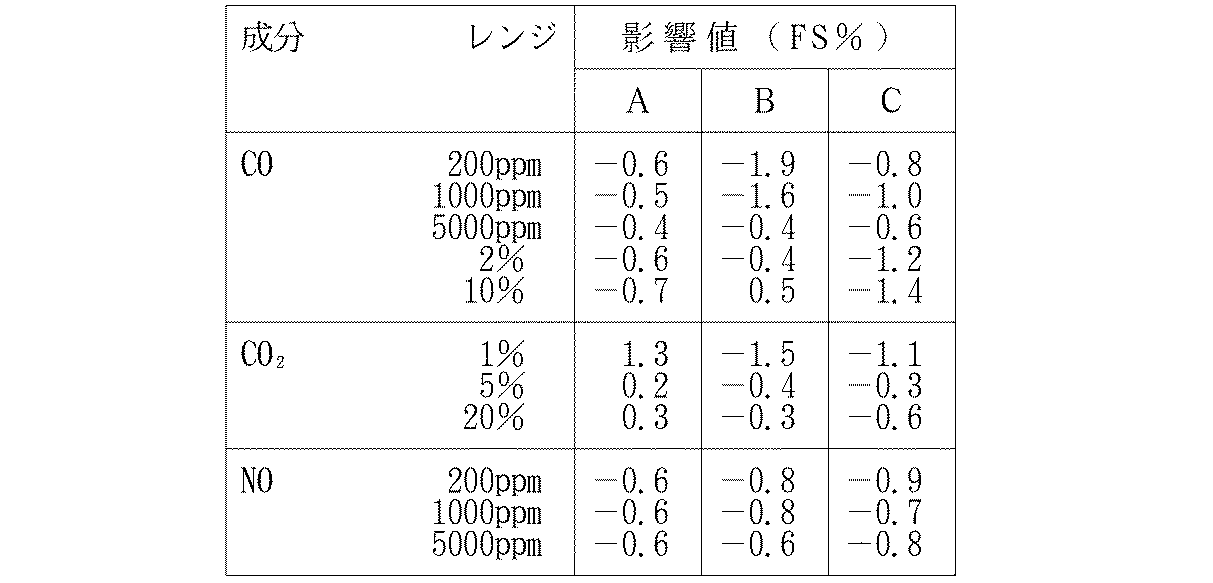
また、下記表1は他の成分をも含めた影響値のバラツキを示すもので、この表1から、影響が大きいのは、CO、CO2 、NO、N2 Oであること、また、これらについては、バラツキ幅が大きいため、1台ごとに補正係数を決める必要があることがわかる。
【0024】
【表1】
【0025】
(2)補正の簡略化
前記表1に示した3台の装置A〜Cの測定結果のうち、成分CO、CO2 、NOについて補正を行った結果を説明する。この場合、補正の方式としては次の3つがある。すなわち、
(a)補正係数として二次式(前記図3におけるa≠0)を用い、1台ごとに決定する方式
(b)補正係数として二次式(前記図3におけるa≠0)を用い、3台の装置I,II,III のうち、ある装置の補正係数を基に傾きを決定する方式
(c)補正係数として一次式(前記図3におけるa=0)を用い、1台ごとに決定する方式
【0026】
以下、補正方法と結果を記す。
【0027】
(a)1台ごとに補正係数(二次式)決定した場合
すなわち、各成分CO、CO2 、NOについて5点(1/5分割点〜5/5分割点)ずつのWet(N2 +H2 Oベース)スパンスペクトルを採取し、それに基づいて1台ごとに補正係数を決定した。結果は下記表2の通りである。
【0028】
【表2】
【0029】
(b)同じ係数(二次式)で傾きのみ1台ごとに調整した場合
すなわち、前記表2で使用した各機のデータのうち、1点(4/5分割点)を基に、A機用の補正係数(二次式)を修正して使用し、残りの4点の補正結果を評価した。結果は下記表3の通りである。なお、A機の結果は、前記表2における結果と同じである。
【0030】
【表3】
【0031】
(c)一次式で1台ごとに補正した場合
すなわち、前記表2で使用した各機のデータのうち、1点(4/5分割点)のみを用いて補正係数(一次式)を決定し、残りの4点の補正結果を評価した。結果は下記表4の通りである。
【0032】
【表4】
【0033】
上記表2〜表4から、一次式による(c)の場合でも、補正結果は±2%程度の幅に納まっており、各成分・レンジについて1点ずつの実測データ採取でも補正可能であることがわかる。
【0034】
【発明の効果】
以上説明したように、この発明においては、FTIR法で得られた吸収スペクトルに基づいて試料中の複数成分を定量分析するFTIR法による多成分ガス分析を行う場合、多変量解析法等によって混合ガススペクトルから多成分濃度を算出した後、一部の成分についてはさらに共存ガス成分によるスペクトルの変化分の補正計算を行うようにしているので、通常の多変量解析アルゴリズムでは考慮できないスペクトル自体の強度変化に起因する誤差をも補正することができ、FTIR法ガス分析の精度の向上が図れる。
【0035】
特に、H2 Oの例のように、FTIR法で得られた測定値で補正を行う際は、成分ごとの測定値が無視できるメリットがある。また、O2 、H2 など原理的にFTIR法で測定できない成分については、外部分析計から取り込んだ信号を、FTIRのCPUで時間合わせを行った上で補正に用いることにより、同様の効果を得ることができる。
【0036】
この発明の多成分ガス分析方法は、排ガスと校正ガスの水分濃度の差、および、測定中のサンプルガスにおけるH2 O濃度の変化による影響の補正に効果的であり、また、O2 、H2 などによる影響も補正できる。
【図面の簡単な説明】
【図1】この発明方法を実施するための装置の一例を概略的に示す図である。
【図2】CO10%レンジに対するH2 Oの共存影響の例を示す図で、(A)はCO濃度固定の場合、(B)はH2 O濃度固定の場合を示している。
【図3】(A)はCOとH2 Oにおける影響のモデルを表す図、(B)は補正式の一例を示す図である。
【図4】CO濃度(計算値)と誤差との関係を示す図で、(A)は補正前、(B)は補正後を示している。
【図5】CO10%レンジにおける影響値のバラツキを示し、(A)は生データを、(B)は規格化後をそれぞれ示している。
【図6】従来技術の問題点を説明するための図である。
【図7】クエンチングによる赤外吸収量変化モデルを示す図である。Method of multi-component gas analysis by FTIR method
1. A multicomponent gas analysis method by FTIR method for quantitatively analyzing a plurality of components in a sample based on an absorption spectrum obtained by FTIR method, after calculating multicomponent concentrations from a mixed gas spectrum by a quantitative algorithm, A multicomponent gas analysis method according to the FTIR method, wherein correction calculation of a change in spectrum due to coexisting gas components is further performed for some components.
Detailed Description of the Invention
[0001]
Field of the Invention
The present invention relates to a multicomponent gas analysis method by the FTIR method for quantitatively analyzing a plurality of components in a sample based on an absorption spectrum obtained by the FTIR (Fourier transform infrared spectroscopy) method.
[0002]
[Prior Art]
FIG. 1 schematically shows the configuration of a gas analyzer (hereinafter referred to as an FTIR gas analyzer) using a Fourier transform infrared spectrophotometer according to the above-mentioned FTIR method. Reference numeral 2 denotes a data processing unit that processes an interferogram output from the analysis unit 1.
[0003]
The analysis unit 1 includes an infrared light source 3 configured to emit parallel infrared light, a beam splitter 4, a fixed mirror 5, and a movable mirror 6 which is moved in parallel in, for example, the XY direction by a drive mechanism (not shown). Consisting of an interference mechanism 7 consisting of a cell 8, a measurement sample, a comparison (reference) sample, etc., and a cell 8 irradiated with infrared light from the infrared light source 3 through the interference mechanism 7, and a semiconductor detector 9 etc. It is done.
[0004]
Then, the data processing unit 2 is composed of, for example, a computer, adds up and averages the interferograms, Fourier-transforms the added-average output at high speed, and performs spectrum calculation on the component to be measured based on the Fourier-transformed output. Is configured as.
[0005]
In the FTIR gas analyzer configured as described above, a plurality of components can be quantitatively analyzed as follows. That is, the comparison sample or the measurement sample is accommodated in the cell 8, and the infrared light from the infrared light source 3 is irradiated to the cell 8, and the interferogram of the comparison sample or the measurement sample is measured. These interferograms are each Fourier-transformed in the data processing unit 2 to obtain a power spectrum, then the ratio of the power spectrum of the measurement sample to the power spectrum of the comparison sample is determined, and this is converted into absorbance scale After the spectrum is obtained, the plurality of components contained in the measurement sample are quantitatively analyzed based on the absorbance at a plurality of wave number points in the absorption spectrum.
[0006]
Examples of methods for quantitatively analyzing the above-mentioned plurality of components include those described in the specifications of Japanese Patent No. 2649667, Japanese Patent No. 2741376, Japanese Patent No. 2926277, and Japanese Patent No. 2926278, to the applicant of the present application, The multicomponent analysis method of Japanese Patent No. 2649667 calculates the sum of relative absorbance which is the difference between the local peak value and the local valley value at a plurality of wave number points in the absorption spectrum, and based on this sum The concentration is obtained separately.
[0007]
In addition to the above method, it is also possible to use a multivariate analysis quantitative algorithm such as PLS (Partial Least Square), PCR (Principal Component Regression), etc. it can. In any of these methods, data for concentration calculation (a calibration matrix) is prepared in advance based on a reference spectrum of known concentration, and the concentration of a plurality of components is calculated using an operation matrix with spectral data of a sample of unknown concentration. It is calculated separately.
[0008]
[Problems to be solved by the invention]
By the way, in engine exhaust gas measurement by the above-mentioned FTIR method, the instruction of CO, CO 2 , NO, etc. is in the sample gas at the time of actual sample gas measurement only by applying generally used quantitative algorithm such as PLS method and PCR method. It is known that the concentration is higher than the actual concentration under the influence of the high concentration of H 2 O coexisting. This is different from interference due to the inability to separate spectrum overlap in the quantitative algorithm, and even if the same component and the same concentration, there is a difference in spectral intensity depending on the base gas composition, for example, as shown in FIG. It is because it occurs. More specifically, for example, the spectrum of CO in a real sample based on (N 2 + H 2 O) gas has a larger absorption than the spectrum of CO in a span gas based on N 2 gas. In FIG. 6, reference numerals 10, 11 and 12 indicate absorption spectra of CO, CO + H 2 O, and H 2 O when N 2 is used as a base gas. Note that the same phenomenon as this may also occur due to the coexistence of O 2 , H 2 and the like without infrared absorption.
[0009]
Although the exact mechanism which the above phenomena generate | occur | produces is unknown, it is thought that the quenching etc. by interaction of gas molecules are related in part. FIG. 7 shows an infrared absorption amount change model due to quenching, which shows that the infrared absorption amount changes depending on the collision probability of gas component X and base gas and the magnitude of the interaction. There is. That is, the same figure (A) shows the case where both the collision probability and the interaction of the base gas A with respect to the gas component X are small, and in this case, the balance of the ground state and the excited state of the gas component X is affected too much. Because it is not present, the presence of the base gas A hardly affects the amount of absorption of the gas component X. Further, (B) of the figure shows the case where both the collision probability and the interaction of the base gas B with respect to the gas component X are large, and in this case, the equilibrium of the gas component X shifts to the ground state side. Absorption is likely to occur. That is, due to the presence of the base gas B, the absorption intensity of the gas component X is increased, and the absorption is stronger than when the base gas is the component A. In the example shown in FIG. 6, N 2 corresponds to the component A, H 2 O corresponds to the component B, and CO corresponds to the component X.
[0010]
As another mechanism, a mechanism called “collision spread” may be considered, in which the line width of the absorption spectrum is broadened by the coexistence of other components.
[0011]
The present invention was made in consideration of the above-mentioned matters, and its object is to correct the influence of the coexisting gas due to the intensity change of the spectrum itself due to the base gas composition, and to perform the highly accurate measurement. It is an object of the present invention to provide a multicomponent gas analysis method by the method.
[0012]
[Means for Solving the Problems]
In order to achieve the above object, in the present invention, in a multicomponent gas analysis method by the FTIR method for quantitatively analyzing a plurality of components in a sample based on an absorption spectrum obtained by the FTIR method, multicomponents from mixed gas spectra by a quantitative algorithm After the concentration is calculated, correction calculation of a change in spectrum due to the coexisting gas component is further performed for some components.
[0013]
When performing the correction calculation, if the coexisting gas component can be measured by the FTIR method, the measurement result can be used, and in such a case, the time delay of the measured value can be ignored. If the coexisting gas component can not be measured by the FTIR method, it may be read from the external analyzer and used. In that case, the time alignment may be performed in the data processor of the FTIR.
[0014]
According to the multicomponent gas analysis method by the FTIR method of the present invention, it is possible to correct an error due to the intensity change of the spectrum itself which can not be considered by the usual quantitative algorithm, and improve the accuracy of the FTIR gas analysis. In particular, the base gas composition of the exhaust gas and the calibration gas, in particular, the difference between the H 2 O concentration, and is effective for correction of the influence due to a change in H 2 O concentration in the sample gas being measured.
[0015]
BEST MODE FOR CARRYING OUT THE INVENTION
Embodiments of the present invention will be described with reference to the drawings. As described above, when measuring an actual sample gas, the influence of H 2 O contained therein is very large. Therefore, an example in which a formula for correcting the coexistence effect of H 2 O which is a component measurable by the FTIR method on CO etc. after concentration calculation by multivariate analysis will be described below. The effect due to components other than H 2 O is on the assumption that practically negligible.
[0016]
1. Examination of correction formula (1) Trend confirmation of influence value Fig. 2 shows an example of coexistence effect of H 2 O to CO 10% range (calculated with value before linearization (Raw)). The figure (B) shows the case of H 2 O concentration fixation, respectively, in the case of CO concentration fixation. From this FIG. 2, the width of the influence value can be approximated by a linear expression (Y = aX) when the H 2 O concentration is fixed, but depending on the component, the quadratic expression (Y = aX 2 + bX) It can be seen that there are also examples where can be approximated better.
[0017]
(2) Model of Influence and Correction Formula FIG. 3 shows a model of the influence value in CO and H 2 O and an example of the correction formula. First, in this model, the peak intensity of H 2 O (concentration calculation value before linearization) x (= W) and the change of peak intensity of CO (change amount of concentration calculation value before linearization) y It is assumed that the linear expression (y = Sx) has a relationship, and the slope S of the linear expression changes in accordance with the peak intensity of CO as shown in FIG. The relationship between the slope S (= Y) and the peak intensity X (= C) of CO in the absence of the influence of H 2 O is shown in FIG. It approximates by 2 + bX). Here, the CO concentration value R obtained by the conventional PCR method is
Is represented by By solving this equation for X (= C), a relational equation for finding the peak intensity of CO corrected for the influence of H 2 O is derived.
[0018]
In the above method, in order to obtain the correction coefficients a and b, the data shown in FIG. 3B, that is, the measurement of the coexistence effect when the H 2 O concentration is almost fixed and only the CO concentration is changed Use the value (data is not necessary when changing the H 2 O concentration).
[0019]
The corrected CO concentration (before linearization) C is expressed as follows. C = R / (1 + bW) when a = 0 (Y = bX)
When a 〔0 (Y = aX 2 + bX), C = [√ {(1 + bW) 2 + 4aWR} − (1 + bW)] / 2aW
Where R: CO concentration before correction (before linearization)
W: H 2 O concentration (before linearization)
[0020]
(3) Example of correction result FIG. 4 shows an example (CO 10% range) corrected by the equation shown in FIG. 2, and FIG. 4 (A) shows data before correction, FIG. ) Shows the data after correction. By this correction method, it can be seen that the influence value of about 12% ( per full scale (FS) ) is within ± 1% or more at maximum.
[0021]
2. Confirmation of machine difference It is necessary to determine how to collect actual measurement data for determining coefficients for each device based on the variation of absolute value and tendency of H 2 O coexistence effect. Therefore, using the three apparatuses A, B, and C, the possibility of simplification of the variation and the correction method was confirmed.
[0022]
(1) Trend confirmation of influence value Figure 5 shows the variation of the influence value in the 10% range of CO, and the figure (A) shows the relationship between the peak intensity of CO and error in the raw data (CO 10%), The same figure (B) has shown the relationship between the peak intensity of CO and error in normalization (10% of CO). It can be understood from FIG. 5 that although there is a considerable difference in absolute value, the tendency is common. As a cause of the variation, it is conceivable that the points used for the calculation of the PCR method are different for each unit.
[0023]
Further, Table 1 below shows the variation of the influence value including other components, and from this Table 1, it is from CO, CO 2 , NO, N 2 O that the influence is large, and It can be seen that since the variation range is large, it is necessary to determine the correction coefficient for each unit.
[0024]
[Table 1]
[0025]
(2) Simplification of correction Among the measurement results of the three devices A to C shown in Table 1, the results of correction of the components CO, CO 2 and NO will be described. In this case, there are the following three correction methods. That is,
(A) Method using a quadratic equation (a ≠ 0 in FIG. 3) as a correction coefficient and determining each unit (b) Using a quadratic equation (a ≠ 0 in FIG. 3 above) as a correction coefficient Method of determining the slope based on the correction coefficient of a certain device among the devices I, II, III (c) using linear equation (a = 0 in the above-mentioned FIG. 3) as the correction coefficient Method
The correction method and results are described below.
[0027]
(A) When the correction coefficient (secondary equation) is determined for each unit, that is, Wet (N 2 + H) for each of the components CO, CO 2 , and NO at 5 points (1/5 division point to 5/5 division point) 2 O base) Span spectra were taken, and based on it, the correction factor was determined for each unit. The results are as shown in Table 2 below.
[0028]
【Table 2】
[0029]
(B) In the case where only the inclination is adjusted for each unit with the same coefficient (secondary expression), that is, based on one point (4/5 division points) of the data of each unit used in Table 2 above, The correction factor (quadratic equation) for correction was used after correction, and the remaining four correction results were evaluated. The results are as shown in Table 3 below. The result of machine A is the same as the result in Table 2 above.
[0030]
[Table 3]
[0031]
(C) When the correction is made for each unit by the linear expression, that is, among the data of each machine used in Table 2, only one point (4/5 division points) is used to determine the correction coefficient (linear expression) The remaining four correction results were evaluated. The results are as shown in Table 4 below.
[0032]
[Table 4]
[0033]
From Tables 2 to 4 above, even in the case of (c) according to the linear expression, the correction result falls within a range of about ± 2%, and correction can be made even by taking measured data of each point for each component and range. I understand.
[0034]
【Effect of the invention】
As described above, in the present invention, when performing multicomponent gas analysis by the FTIR method for quantitatively analyzing a plurality of components in a sample based on the absorption spectrum obtained by the FTIR method, mixed gas by the multivariate analysis method etc. After the multicomponent concentration is calculated from the spectrum, the correction calculation of the change in the spectrum due to the coexisting gas component is further performed for some components, so the intensity change of the spectrum itself which can not be taken into consideration by the usual multivariate analysis algorithm It is also possible to correct errors due to the FTIR method, and improve the accuracy of FTIR gas analysis.
[0035]
In particular, when correction is performed using the measurement values obtained by the FTIR method as in the example of H 2 O, there is an advantage that the measurement values of each component can be ignored. In addition, for components that can not be measured by the FTIR method, such as O 2 and H 2 in principle, the same effect can be obtained by using the signals taken from the external analyzer for time alignment with the CPU of the FTIR and correcting them. You can get it.
[0036]
The multicomponent gas analysis method of the present invention is effective for correcting the difference between the water concentration of the exhaust gas and the calibration gas, and the influence of the change of the H 2 O concentration in the sample gas under measurement, and also O 2 , H The influence by 2 etc. can also be corrected.
Brief Description of the Drawings
FIG. 1 schematically shows an example of an apparatus for carrying out the method of the present invention.
FIG. 2 shows an example of the coexistence effect of H 2 O on the 10% range of CO, where (A) shows the case of fixed CO concentration and (B) shows the case of fixed H 2 O concentration.
FIG. 3A is a diagram showing a model of the influence of CO and H 2 O, and FIG. 3B is a diagram showing an example of a correction equation.
FIG. 4 is a diagram showing the relationship between CO concentration (calculated value) and error, in which (A) shows before correction and (B) shows after correction.
FIG. 5 shows the variation of the influence value in the 10% range of CO, where (A) shows raw data and (B) shows after normalization.
FIG. 6 is a diagram for explaining the problems of the prior art.
FIG. 7 is a diagram showing an infrared absorption amount change model by quenching.