JP4079404B2 - Multi-component gas analysis method by FTIR method - Google Patents
Multi-component gas analysis method by FTIR method Download PDFInfo
- Publication number
- JP4079404B2 JP4079404B2 JP15849399A JP15849399A JP4079404B2 JP 4079404 B2 JP4079404 B2 JP 4079404B2 JP 15849399 A JP15849399 A JP 15849399A JP 15849399 A JP15849399 A JP 15849399A JP 4079404 B2 JP4079404 B2 JP 4079404B2
- Authority
- JP
- Japan
- Prior art keywords
- concentration
- gas
- ftir
- component
- correction
- Prior art date
- Legal status (The legal status is an assumption and is not a legal conclusion. Google has not performed a legal analysis and makes no representation as to the accuracy of the status listed.)
- Expired - Lifetime
Links
- 238000000034 method Methods 0.000 title claims description 49
- 238000005033 Fourier transform infrared spectroscopy Methods 0.000 title claims description 29
- 238000004868 gas analysis Methods 0.000 title claims description 9
- 238000001228 spectrum Methods 0.000 claims description 18
- 238000005259 measurement Methods 0.000 claims description 14
- 238000000862 absorption spectrum Methods 0.000 claims description 10
- 238000004364 calculation method Methods 0.000 claims description 10
- 230000003595 spectral effect Effects 0.000 claims description 6
- 238000012937 correction Methods 0.000 description 34
- 238000010521 absorption reaction Methods 0.000 description 7
- 238000010586 diagram Methods 0.000 description 7
- 238000004458 analytical method Methods 0.000 description 6
- 238000012628 principal component regression Methods 0.000 description 5
- 230000000694 effects Effects 0.000 description 4
- 230000003993 interaction Effects 0.000 description 4
- 238000012545 processing Methods 0.000 description 4
- 238000002835 absorbance Methods 0.000 description 3
- 238000012790 confirmation Methods 0.000 description 3
- 238000000491 multivariate analysis Methods 0.000 description 3
- 238000010791 quenching Methods 0.000 description 3
- 230000000171 quenching effect Effects 0.000 description 3
- 230000005283 ground state Effects 0.000 description 2
- 239000011159 matrix material Substances 0.000 description 2
- 238000010606 normalization Methods 0.000 description 2
- 238000004445 quantitative analysis Methods 0.000 description 2
- 230000000052 comparative effect Effects 0.000 description 1
- 230000005281 excited state Effects 0.000 description 1
- 238000002474 experimental method Methods 0.000 description 1
- 230000031700 light absorption Effects 0.000 description 1
- 238000000513 principal component analysis Methods 0.000 description 1
- 239000004065 semiconductor Substances 0.000 description 1
Images


Classifications
-
- G—PHYSICS
- G01—MEASURING; TESTING
- G01N—INVESTIGATING OR ANALYSING MATERIALS BY DETERMINING THEIR CHEMICAL OR PHYSICAL PROPERTIES
- G01N21/00—Investigating or analysing materials by the use of optical means, i.e. using sub-millimetre waves, infrared, visible or ultraviolet light
- G01N21/17—Systems in which incident light is modified in accordance with the properties of the material investigated
- G01N21/25—Colour; Spectral properties, i.e. comparison of effect of material on the light at two or more different wavelengths or wavelength bands
- G01N21/31—Investigating relative effect of material at wavelengths characteristic of specific elements or molecules, e.g. atomic absorption spectrometry
- G01N21/35—Investigating relative effect of material at wavelengths characteristic of specific elements or molecules, e.g. atomic absorption spectrometry using infrared light
- G01N21/3504—Investigating relative effect of material at wavelengths characteristic of specific elements or molecules, e.g. atomic absorption spectrometry using infrared light for analysing gases, e.g. multi-gas analysis
- G01N2021/3545—Disposition for compensating effect of interfering gases
-
- G—PHYSICS
- G01—MEASURING; TESTING
- G01N—INVESTIGATING OR ANALYSING MATERIALS BY DETERMINING THEIR CHEMICAL OR PHYSICAL PROPERTIES
- G01N21/00—Investigating or analysing materials by the use of optical means, i.e. using sub-millimetre waves, infrared, visible or ultraviolet light
- G01N21/17—Systems in which incident light is modified in accordance with the properties of the material investigated
- G01N21/25—Colour; Spectral properties, i.e. comparison of effect of material on the light at two or more different wavelengths or wavelength bands
- G01N21/31—Investigating relative effect of material at wavelengths characteristic of specific elements or molecules, e.g. atomic absorption spectrometry
- G01N21/35—Investigating relative effect of material at wavelengths characteristic of specific elements or molecules, e.g. atomic absorption spectrometry using infrared light
- G01N2021/3595—Investigating relative effect of material at wavelengths characteristic of specific elements or molecules, e.g. atomic absorption spectrometry using infrared light using FTIR
Description
【0001】
【発明の属する技術分野】
この発明は、FTIR(フーリエ変換赤外分光)法で得られた吸収スペクトルに基づいて試料中の複数成分を定量分析するFTIR法による多成分ガス分析方法に関する。
【0002】
【従来の技術】
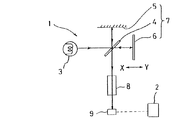
図1は、上記FTIR法に則ったフーリエ変換赤外分光光度計を用いたガス分析装置(以下、FTIRガス分析装置という)の構成を概略的に示すもので、この図において、1は分析部、2はこの分析部1の出力であるインターフェログラムを処理するデータ処理部である。
【0003】
前記分析部1は、平行な赤外光を発するように構成された赤外光源3と、ビームスプリッタ4、固定ミラー5、図外の駆動機構によって例えばX−Y方向に平行移動する可動ミラー6からなる干渉機構7と、測定試料や比較(参照)試料等を収容し、干渉機構7を介して赤外光源3からの赤外光が照射されるセル8と、半導体検出器9等から構成されている。
【0004】
そして、前記データ処理部2は、例えばコンピュータよりなり、インターフェログラムを加算平均し、その加算平均出力を高速でフーリエ変換し、さらに、このフーリエ変換出力に基づいて測定対象成分に関するスペクトル演算を行うように構成されている。
【0005】
上述のように構成されたFTIRガス分析装置においては、次のようにして複数の成分を定量分析することができる。すなわち、セル8に比較試料または測定試料をそれぞれ収容して赤外光源3からの赤外光をセル8に照射し、比較試料または測定試料のインターフェログラムを測定する。これらのインターフェログラムをデータ処理部2において、それぞれフーリエ変換してパワースペクトルを得た後、比較試料のパワースペクトルに対する測定試料のパワースペクトルの比を求め、これを吸光度スケールに変換することにより吸収スペクトルを得た後、この吸収スペクトル中の複数の波数ポイントにおける吸光度に基づいて測定試料中に含まれる複数の成分を定量分析するのである。
【0006】
上記複数の成分を定量分析する方法として、例えば、本願の出願人に係る特許第2649667号、特許第2741376号、特許第2926277号、特許第2926278号の明細書に記載されたものがあり、例えば特許第2649667号の多成分分析方法は、吸収スペクトル中の複数の波数ポイントにおける局所的ピーク値と局所的バレー値との差である相対吸光度の和を求め、この和に基づいて複数の成分の濃度を各別に得るというものである。
【0007】
さらに、多成分の定量分析に際しては、上記方法のほか、PLS(Partial Least Square、部分最小二乗)法、PCR(Principal Component Regression、主成分分析)法等といった多変量解析の定量アルゴリズムを用いることもできる。これらの方法はいずれも、濃度既知の参照スペクトルに基づいて予め濃度演算用のデータ(校正行列)を作成しておき、濃度未知の試料のスペクトルデータとの演算行列により、複数の成分の濃度を各別に算出するものである。
【0008】
【発明が解決しようとする課題】
ところで、上記FTIR法によるエンジン排ガス測定に際して、前記PLS法、PCR法等、一般に用いられる定量アルゴリズムを適用するだけでは、実サンプルガス測定時において、CO、CO2 、NOなどの指示がサンプルガス中に共存する高濃度のH2 Oの影響を受けて実際の濃度より高くなることがわかっている。これは、前記定量アルゴリズムでスペクトルの重なりが分離しきれないことによる干渉とは異なり、同一成分・同一濃度であってもベースガス組成により、例えば、表1及び図6に示すように、スペクトル強度に差が生ずるためであることが実験の結果、明らかとなった。より具体的には、たとえば(N2 +H2 O)ガスベースの実サンプル中のCOのスペクトルの方が、N2 ガスベースのスパンガス中のCOのスペクトルより吸収が大きいためである。なお、図6において、符号10,11,12は、N2 をベースガスとしたときのCO、CO+H2 O、H2 Oのそれぞれ吸収スペクトルを示している。なお、これと同様の現象は、赤外線の吸収のないO2 、H2 などの共存によっても起こりうる。
【0009】
上述のような現象が生ずる正確な機構は不明であるが、一つには、ガス分子同士の相互作用によるクエンチング等が関係していると考えられる。図7は、クエンチングによる赤外吸収量変化モデルを示すもので、このモデルは、ガス成分Xとベースガスの衝突確率および相互作用の大小によって、赤外吸収量に変化が生ずることを示している。すなわち、同図(A)は、ガス成分Xに対してベースガスAの衝突確率および相互作用が共に小さい場合を示し、この場合、ガス成分Xの基底状態・励起状態の平衡に影響を余り与えないため、ベースガスAの存在はガス成分Xの吸収量に殆ど影響しない。また、同図(B)は、ガス成分Xに対してベースガスBの衝突確率および相互作用が共に大きい場合を示し、この場合、ガス成分Xの平衡が基底状態側にずれるため、新たな光吸収が起こりやすくなる。つまり、ベースガスBの存在により、ガス成分Xの吸収強度が大きくなり、ベースガスが成分Aであった場合よりも強い吸収を示す。図6に示した例では、N2 が成分A、H2 Oが成分B、COが成分Xに相当する。
【0010】
また、他の機構としては、他成分の共存によって吸収スペクトルの線幅が広がる「衝突広がり」というメカニズムの吸収スペクトルの形状変化も考えられる。
【0011】
この発明は、上述の事柄に留意してなされたもので、その目的は、ベースガスに共存するH 2 Oの影響で生じるスペクトル自体の強度変化に起因する試料中の成分濃度値を補正して、精度の高い分析を行うことができるFTIR法による多成分ガス分析方法を提供することである。
【0012】
【課題を解決するための手段】
上記目的を達成するため、この発明では、FTIR法で得られた吸収スペクトルに基づいて定量アルゴリズムによって混合ガススペクトルから試料中の複数成分の濃度を各別に算出し定量分析するFTIR法による多成分ガス分析方法において、前記定量アルゴリズムにより濃度の算出された複数成分のうち、FTIR法により測定されるベースガス中のH 2 Oの影響を受けてスペクトル強度に変化を生ずる成分については、さらに前記FTIR法による濃度測定結果を用い、試料中の測定対象成分と前記H 2 Oとの間で予め求めている濃度の相関関係式に基づいて、該H 2 Oによるスペクトル強度の変化に起因する濃度値の誤差を補正する計算を行うことを特徴としている。
【0013】
前記補正を行う際、共存するH 2 OはFTIR法で測定可能でその測定結果を用いることができ、そのようにした場合、測定値の時間遅れが無視できる。なお、前記補正を行う際、共存ガス成分がFTIR法で測定不可能な場合は、外部分析計から読み込んだ信号を、FTIRのデータ処理部において時間合わせを行った上で補正する必要がある。
【0014】
この発明のFTIR法による多成分ガス分析方法によれば、通常の定量アルゴリズムでは考慮できない一部の成分のスペクトル自体に起きる現象、つまり、ベースガス中に共存するH 2 Oの影響でスペクトル自体に生じる強度変化に起因する成分濃度値の誤差を補正することができ、FTIR法ガス分析の精度の向上が図れる。特に、排ガスと校正ガスのベースガス組成、特に、H2 O濃度の差、および、測定中のサンプルガスにおけるH2 O濃度の変化による影響の補正に効果的である。
【0015】
【発明の実施の形態】
この発明の実施の形態を、図面を参照しながら説明する。上述のように、実サンプルガスを測定する場合、それに含まれるH2 Oの影響が非常に大きい。そこで、以下に、FTIR法で測定可能な成分であるH2 OによるCO等への共存影響を、多変量解析法による濃度演算後に補正する式の検討を行った例を説明する。なお、H2 O以外の成分による影響は、事実上無視できることを前提にしている。
【0016】
1.補正式の検討
(1)影響値の傾向確認
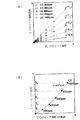
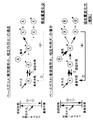
図2は、CO10%レンジに対するH2 Oの共存影響の例(リニアライズ前の値にて計算(Raw))を示し、同図(A)はCO濃度固定の場合を、同図(B)はH2 O濃度固定の場合をそれぞれ示している。この図2から、影響値の幅は、H2 O濃度固定時の変化は、ほぼ一次式(Y=aX)で近似できるが、成分によっては、二次式(Y=aX2 +bX)の方がよりよく近似できる例もあることがわかる。
【0017】
(2)影響のモデルと補正式
図3は、COとH2 Oにおける影響値のモデルと補正式の例を示している。まず、このモデルは、H2 Oのピーク強度(リニアライズ前の濃度計算値)x(=W)と、COのピーク強度の変化分(リニアライズ前の濃度計算値の変化分)yとは、一次式(y=Sx)の関係にあり、この一次式の傾きSが、同図(A)に示すように、COのピーク強度に応じて変化すると仮定する。前記傾きS(=Y)と、H2 Oの影響がない状態でのCOのピーク強度X(=C)との関係を、同図(B)に示すように、二次式(Y=aX2 +bX)で近似する。ここで、従来のPCR法で得られるCO濃度値Rは、
R=y+X
={(aX2 +bX)×x}+X
で表される。この式をX(=C)について解くことにより、H2 Oの影響を補正したCOのピーク強度を求める関係式が導かれる。
【0018】
上記の方法において、補正係数a,bを求めるには、前記図3(B)に示されるデータ、つまり、H2 O濃度をほぼ固定してCO濃度のみを変化させたときの共存影響の実測値を用いる(H2 O濃度を変化させたときのデータは不要)。
【0019】
そして、補正後のCO濃度(リニアライズ前)Cは、次のように表される。
a=0(Y=bX)のとき
C=R/(1+bW)
a≠0(Y=aX2 +bX)のとき
C=〔√{(1+bW)2+4aWR}−(1+bW)〕/2aW
ここで、R:補正前のCO濃度(リニアライズ前)
W:H2 O濃度(リニアライズ前)
【0020】
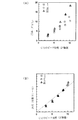
(3)補正結果の例
図4は、図2に示した式で補正を行った例(CO10%レンジ)を示すもので、同図(A)は補正前のデータを示し、同図(B)は補正後のデータを示している。この補正方法により、最大で約12%(フルスケール(FS)あたり)の影響値が±1%強の範囲に納まっていることがわかる。
【0021】
2.機差の確認
各装置ごとに係数決定のための実測データをどのように採取するかは、H2 O共存影響の絶対値・傾向のバラツキをもとに決定する必要がある。そこで、3台の装置A,B,Cを用いてこのバラツキと補正方法の簡略化の可能性について確認した。
【0022】
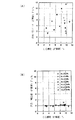
(1)影響値の傾向確認
図5は、CO10%レンジにおける影響値のバラツキを示すもので、同図(A)は生データ(CO10%)におけるCOのピーク強度と誤差との関係を示し、同図(B)は規格化(CO10%)におけるCOのピーク強度と誤差との関係を示している。この図5から、絶対値としてはかなりの開きがあるものの、傾向には共通性があることがわかる。バラツキの一因として、PCR法の演算に用いるポイントが1台ごとに異なっていることが考えられる。
【0023】
また、下記表1は他の成分をも含めた影響値のバラツキを示すもので、この表1から、影響が大きいのは、CO、CO2 、NO、N2 Oであること、また、これらについては、バラツキ幅が大きいため、1台ごとに補正係数を決める必要があることがわかる。
【0024】
【表1】

(2)補正の簡略化
前記表1に示した3台の装置A〜Cの測定結果のうち、成分CO、CO2 、NOについて補正を行った結果を説明する。この場合、補正の方式としては次の3つがある。すなわち、
(a)補正係数として二次式(前記図3におけるa≠0)を用い、1台ごとに決定する方式
(b)補正係数として二次式(前記図3におけるa≠0)を用い、3台の装置I,II,III のうち、ある装置の補正係数を基に傾きを決定する方式
(c)補正係数として一次式(前記図3におけるa=0)を用い、1台ごとに決定する方式
【0026】
以下、補正方法と結果を記す。
【0027】
(a)1台ごとに補正係数(二次式)決定した場合
すなわち、各成分CO、CO2 、NOについて5点(1/5分割点〜5/5分割点)ずつのWet(N2 +H2 Oベース)スパンスペクトルを採取し、それに基づいて1台ごとに補正係数を決定した。結果は下記表2の通りである。
【0028】
【表2】
(b)同じ係数(二次式)で傾きのみ1台ごとに調整した場合
すなわち、前記表2で使用した各機のデータのうち、1点(4/5分割点)を基に、A機用の補正係数(二次式)を修正して使用し、残りの4点の補正結果を評価した。結果は下記表3の通りである。なお、A機の結果は、前記表2における結果と同じである。
【0030】
【表3】
(c)一次式で1台ごとに補正した場合
すなわち、前記表2で使用した各機のデータのうち、1点(4/5分割点)のみを用いて補正係数(一次式)を決定し、残りの4点の補正結果を評価した。結果は下記表4の通りである。
【0032】
【表4】
上記表2〜表4から、一次式による(c)の場合でも、補正結果は±2%程度の幅に納まっており、各成分・レンジについて1点ずつの実測データ採取でも補正可能であることがわかる。
【0034】
【発明の効果】
以上説明したように、この発明においては、FTIR法で得られた吸収スペクトルに基づいて定量アルゴリズムよって混合ガススペクトルから試料中の複数成分の濃度を各別に算出し定量分析するFTIR法による多成分ガス分析を行う場合、前記定量アルゴリズムにより濃度の算出された複数成分のうち、ベースガス中に共存するH2 Oの影響を受けてスペクトル強度に差を生ずる成分については、さらに前記FTIR法による濃度測定結果を用い、試料中の測定対象成分と前記H 2 Oとの間で予め求めている濃度の相関関係式に基づいて、該H 2 Oによるスペクトル強度の変化に起因する濃度値の誤差を補正する計算を行うので、通常の多変量解析の定量アルゴリズムでは考慮できない現象、つまり、ベースガス中のH 2 Oの影響を受けて生じるスペクトル自体の強度変化に起因する成分濃度値の誤差をも補正することができ、FTIR法ガス分析の精度の向上が図れる。
【0035】
【0036】
この発明の多成分ガス分析方法は、排ガスと校正ガスの水分濃度の差、および、測定中のサンプルガスにおけるH2 O濃度の変化による影響の補正に効果的である。
【図面の簡単な説明】
【図1】 この発明方法を実施するための装置の一例を概略的に示す図である。
【図2】 CO10%レンジに対するH2 Oの共存影響の例を示す図で、(A)はCO濃度固定の場合、(B)はH2 O濃度固定の場合を示している。
【図3】 (A)はCOとH2 Oにおける影響のモデルを表す図、(B)は補正式の一例を示す図である。
【図4】 CO濃度(計算値)と誤差との関係を示す図で、(A)は補正前、(B)は補正後を示している。
【図5】 CO10%レンジにおける影響値のバラツキを示し、(A)は生データを、(B)は規格化後をそれぞれ示している。
【図6】 従来技術の問題点を説明するための図である。
【図7】 クエンチングによる赤外吸収量変化モデルを示す図である。[0001]
BACKGROUND OF THE INVENTION
The present invention relates to a multi-component gas analysis method based on the FTIR method that quantitatively analyzes a plurality of components in a sample based on an absorption spectrum obtained by an FTIR (Fourier transform infrared spectroscopy) method.
[0002]
[Prior art]
FIG. 1 schematically shows a configuration of a gas analyzer (hereinafter referred to as an FTIR gas analyzer) using a Fourier transform infrared spectrophotometer conforming to the FTIR method.
[0003]
The
[0004]
The
[0005]
In the FTIR gas analyzer configured as described above, a plurality of components can be quantitatively analyzed as follows. That is, a comparison sample or a measurement sample is accommodated in the
[0006]
As a method for quantitative analysis of the plurality of components, there are, for example, those described in the specifications of Japanese Patent No. 2469667, Japanese Patent No. 2741376, Japanese Patent No. 2926277, and Japanese Patent No. 2926278 related to the applicant of the present application. The multi-component analysis method of Japanese Patent No. 2649667 calculates the sum of relative absorbances, which are the differences between local peak values and local valley values at a plurality of wavenumber points in the absorption spectrum, and based on this sum, The concentration is obtained separately.
[0007]
Further, in the multicomponent quantitative analysis, in addition to the above method, a multivariate analysis quantitative algorithm such as PLS (Partial Least Square) method, PCR (Principal Component Regression, principal component analysis) method, etc. may be used. it can. In any of these methods, data for concentration calculation (calibration matrix) is created in advance based on a reference spectrum with a known concentration, and the concentrations of a plurality of components are calculated using a calculation matrix with spectrum data of a sample with an unknown concentration. It is calculated separately.
[0008]
[Problems to be solved by the invention]
By the way, when engine exhaust gas measurement by the FTIR method is performed, simply by applying a commonly used quantitative algorithm such as the PLS method, PCR method, or the like, instructions such as CO, CO 2 , NO, etc. are present in the sample gas during actual sample gas measurement. It has been found that the concentration is higher than the actual concentration due to the influence of the high concentration of H 2 O coexisting with the H 2 O. This is different from the interference caused by the fact that the spectrum overlap cannot be separated by the quantitative algorithm. Even if the same component and the same concentration are used, the spectrum intensity depends on the base gas composition, for example, as shown in Table 1 and FIG. As a result of experiments, it has become clear that this is because of the difference between the two. More specifically, for example, the absorption spectrum of CO in an actual sample based on (N 2 + H 2 O) gas is larger in absorption than the spectrum of CO in span gas based on N 2 gas. In FIG. 6,
[0009]
Although the exact mechanism by which the above phenomenon occurs is unknown, it is thought that one of them is related to quenching by the interaction between gas molecules. FIG. 7 shows an infrared absorption amount change model due to quenching. This model shows that the infrared absorption amount changes depending on the collision probability of gas component X and base gas and the magnitude of the interaction. Yes. That is, FIG. 5A shows a case where the collision probability and interaction of the base gas A are both small with respect to the gas component X. In this case, the balance between the ground state and the excited state of the gas component X is significantly affected. Therefore, the presence of the base gas A has little influence on the absorption amount of the gas component X. FIG. 5B shows a case where the collision probability and interaction of the base gas B are large with respect to the gas component X. In this case, the equilibrium of the gas component X shifts to the ground state side, so that a new light Absorption is likely to occur. That is, due to the presence of the base gas B, the absorption intensity of the gas component X increases, and the absorption is stronger than when the base gas is the component A. In the example shown in FIG. 6, N 2 corresponds to component A, H 2 O corresponds to component B, and CO corresponds to component X.
[0010]
As another mechanism, a change in the shape of the absorption spectrum due to a mechanism called “collision broadening” in which the line width of the absorption spectrum widens due to the coexistence of other components can be considered.
[0011]
The present invention has been made in consideration of the above-mentioned matters, and the object thereof is H 2 coexisting in the base gas. An object of the present invention is to provide a multi-component gas analysis method based on the FTIR method capable of correcting a component concentration value in a sample caused by an intensity change of a spectrum itself caused by the influence of O and performing a highly accurate analysis.
[0012]
[Means for Solving the Problems]
In order to achieve the above object, according to the present invention, a multi-component gas based on the FTIR method is used to calculate and analyze quantitatively the concentrations of a plurality of components in a sample from a mixed gas spectrum based on an absorption spectrum obtained by the FTIR method. Among the plurality of components whose concentrations are calculated by the quantitative algorithm in the analysis method, components that change in spectral intensity due to the influence of H 2 O in the base gas measured by the FTIR method are further described in the FTIR method. Using the concentration measurement result obtained by the above, the component to be measured in the sample and the H 2 Based on the correlation equation of the concentration obtained in advance with O, the H 2 It is characterized in that a calculation for correcting an error of a density value caused by a change in spectral intensity due to O is performed.
[0013]
When performing the correction, coexisting H 2 O can be measured by the FTIR method, and the measurement result can be used. In such a case, the time delay of the measurement value can be ignored. Incidentally, when performing the correction, if coexisting gas components is impossible measured by FTIR method, a read signal from an external analyzer, it is necessary to correct after performing time matching the data processing unit of the FTIR.
[0014]
According to the multi-component gas analysis method based on the FTIR method of the present invention, a phenomenon that occurs in the spectrum of some components that cannot be taken into consideration by a normal quantitative algorithm, that is, H 2 coexisting in the base gas. The error of the component concentration value due to the intensity change generated in the spectrum itself due to the influence of O can be corrected, and the accuracy of the FTIR gas analysis can be improved. In particular, the base gas composition of the exhaust gas and the calibration gas, in particular, the difference between the H 2 O concentration, and is effective for correction of the influence due to a change in H 2 O concentration in the sample gas being measured.
[0015]
DETAILED DESCRIPTION OF THE INVENTION
Embodiments of the present invention will be described with reference to the drawings. As described above, when the actual sample gas is measured, the influence of H 2 O contained therein is very large. Therefore, an example will be described below in which an equation for correcting the coexistence influence on CO or the like by H 2 O, which is a component measurable by the FTIR method, is corrected after the concentration calculation by the multivariate analysis method will be described. It is assumed that the influence of components other than H 2 O can be virtually ignored.
[0016]
1. Examination of correction formula (1) Confirmation of trend of influence value Figure 2 shows an example of coexistence influence of H 2 O on CO10% range (calculated with values before linearization (Raw)). In the case where the CO concentration is fixed, FIG. 5B shows the case where the H 2 O concentration is fixed. From FIG. 2, the range of the influence value can be approximated by a linear expression (Y = aX) when the H 2 O concentration is fixed, but depending on the component, the quadratic expression (Y = aX 2 + bX) It can be seen that there are examples that can be better approximated.
[0017]
(2) Influence Model and Correction Formula FIG. 3 shows an example of an influence value model and correction expression for CO and H 2 O. First, in this model, H 2 O peak intensity (concentration calculation value before linearization) x (= W) and CO peak intensity change (concentration calculation value change before linearization) y It is assumed that the linear expression (y = Sx) has a relationship, and the slope S of this linear expression changes according to the peak intensity of CO as shown in FIG. The relationship between the slope S (= Y) and the peak intensity X (= C) of CO in the absence of H 2 O is expressed by a quadratic expression (Y = aX) as shown in FIG. 2 + bX). Here, the CO concentration value R obtained by the conventional PCR method is
R = y + X
= {(AX 2 + bX) × x} + X
It is represented by By solving this equation with respect to X (= C), a relational expression for obtaining the peak intensity of CO corrected for the influence of H 2 O is derived.
[0018]
In the above method, in order to obtain the correction coefficients a and b, the data shown in FIG. 3B, that is, the coexistence effect when only the CO concentration is changed while the H 2 O concentration is substantially fixed. The value is used (data is not necessary when the H 2 O concentration is changed).
[0019]
The corrected CO concentration (before linearization) C is expressed as follows.
When a = 0 (Y = bX) C = R / (1 + bW)
When a ≠ 0 (Y = aX 2 + bX) C = [√ {(1 + bW) 2 + 4aWR} − (1 + bW)] / 2aW
Where R: CO concentration before correction (before linearization)
W: H 2 O concentration (before linearization)
[0020]
(3) Example of Correction Result FIG. 4 shows an example (
[0021]
2. Confirmation of machine difference It is necessary to determine how to collect the actual measurement data for determining the coefficient for each device based on the variation of the absolute value and tendency of the H 2 O coexistence effect. Therefore, using three devices A, B, and C, the possibility of simplifying the variation and the correction method was confirmed.
[0022]
(1) Confirmation of trend of influence value FIG. 5 shows the variation of the influence value in the
[0023]
Table 1 below shows the variation of influence values including other components. From Table 1, it is CO, CO 2 , NO, N 2 O that have the greatest influence. Since the variation width is large, it is understood that it is necessary to determine a correction coefficient for each unit.
[0024]
[Table 1]
(2) Simplification of correction Of the measurement results of the three apparatuses A to C shown in Table 1, the results of correcting the components CO, CO 2 and NO will be described. In this case, there are the following three correction methods. That is,
(A) A method in which a quadratic expression (a ≠ 0 in FIG. 3) is used as a correction coefficient and determined for each unit. (B) A quadratic expression (a ≠ 0 in FIG. 3) is used as a correction coefficient. A method of determining the inclination based on a correction coefficient of a certain device among the devices I, II, and III. (C) A linear equation (a = 0 in FIG. 3) is used as the correction coefficient and determined for each device. Method [0026]
The correction method and results are described below.
[0027]
(A) When a correction coefficient (secondary equation) is determined for each unit That is, each component CO, CO 2 , NO has 5 points (1/5 division point to 5/5 division point) Wet (N 2 + H) ( 2O base) Span spectrum was collected, and based on this, the correction coefficient was determined for each unit. The results are shown in Table 2 below.
[0028]
[Table 2]
(B) When only the inclination is adjusted for each unit with the same coefficient (secondary equation) That is, based on one point (4/5 dividing points) among the data of each device used in Table 2, the Aircraft A The correction coefficient (secondary equation) was corrected and used, and the correction results of the remaining four points were evaluated. The results are as shown in Table 3 below. In addition, the result of A machine is the same as the result in the said Table 2.
[0030]
[Table 3]
(C) When correction is made for each unit using a linear expression That is, the correction coefficient (primary expression) is determined by using only one point (4/5 dividing points) among the data of each machine used in Table 2 above. The remaining four correction results were evaluated. The results are shown in Table 4 below.
[0032]
[Table 4]
From Tables 2 to 4 above, even in the case of (c) according to the linear equation, the correction results are within a range of about ± 2%, and correction can be made even by collecting measured data for each component / range by one point. I understand.
[0034]
【The invention's effect】
As described above, in the present invention, the multi-component gas according to the FTIR method in which the concentration of a plurality of components in the sample is calculated separately from the mixed gas spectrum by the quantitative algorithm based on the absorption spectrum obtained by the FTIR method and quantitatively analyzed. When performing analysis, among the components whose concentrations are calculated by the quantitative algorithm, components that cause a difference in spectral intensity due to the influence of H 2 O coexisting in the base gas are further measured by the FTIR method. Using the result, the component to be measured in the sample and the H 2 Based on the correlation equation of the concentration obtained in advance with O, the H 2 Since the calculation to correct the error of the density values due to changes in the spectral intensity by O, phenomenon which can not be considered a quantitative algorithm conventional multivariate analysis, i.e., H 2 in the base gas An error in the component concentration value caused by the intensity change of the spectrum itself caused by the influence of O can be corrected, and the accuracy of the FTIR gas analysis can be improved.
[0035]
[0036]
The multi-component gas analysis method of the present invention is effective for correcting the influence of the difference in the moisture concentration between the exhaust gas and the calibration gas and the change in the H 2 O concentration in the sample gas being measured .
[Brief description of the drawings]
FIG. 1 is a diagram schematically showing an example of an apparatus for carrying out the method of the present invention.
FIGS. 2A and 2B are diagrams showing examples of coexistence effects of H 2 O on a
FIG. 3A is a diagram showing an influence model in CO and H 2 O, and FIG. 3B is a diagram showing an example of a correction equation.
FIGS. 4A and 4B are diagrams showing the relationship between CO concentration (calculated value) and error. FIG. 4A shows before correction, and FIG. 4B shows after correction.
FIGS. 5A and 5B show variations in influence values in a
FIG. 6 is a diagram for explaining a problem of the prior art.
FIG. 7 is a diagram showing an infrared absorption amount change model by quenching.
Claims (1)
Priority Applications (3)
| Application Number | Priority Date | Filing Date | Title |
|---|---|---|---|
| JP15849399A JP4079404B2 (en) | 1999-06-04 | 1999-06-04 | Multi-component gas analysis method by FTIR method |
| US09/578,998 US6894297B1 (en) | 1999-06-04 | 2000-05-25 | Multi-component gas analyzing method using FTIR |
| DE2000127074 DE10027074B4 (en) | 1999-06-04 | 2000-05-31 | Method of analyzing multi-component gas mixtures using FTIR spectroscopy |
Applications Claiming Priority (1)
| Application Number | Priority Date | Filing Date | Title |
|---|---|---|---|
| JP15849399A JP4079404B2 (en) | 1999-06-04 | 1999-06-04 | Multi-component gas analysis method by FTIR method |
Publications (3)
| Publication Number | Publication Date |
|---|---|
| JP2000346801A JP2000346801A (en) | 2000-12-15 |
| JP2000346801A5 JP2000346801A5 (en) | 2005-03-17 |
| JP4079404B2 true JP4079404B2 (en) | 2008-04-23 |
Family
ID=15672955
Family Applications (1)
| Application Number | Title | Priority Date | Filing Date |
|---|---|---|---|
| JP15849399A Expired - Lifetime JP4079404B2 (en) | 1999-06-04 | 1999-06-04 | Multi-component gas analysis method by FTIR method |
Country Status (3)
| Country | Link |
|---|---|
| US (1) | US6894297B1 (en) |
| JP (1) | JP4079404B2 (en) |
| DE (1) | DE10027074B4 (en) |
Families Citing this family (17)
| Publication number | Priority date | Publication date | Assignee | Title |
|---|---|---|---|---|
| DE10304455B4 (en) * | 2003-02-04 | 2005-04-14 | Siemens Ag | Method for analyzing a gas mixture |
| WO2009140492A2 (en) * | 2008-05-16 | 2009-11-19 | University Of Washington | Transmission quantification of open path ftir spectra with temperature compensation |
| JP5424636B2 (en) * | 2008-12-25 | 2014-02-26 | トヨタ自動車株式会社 | Gas analyzer using FTIR method and program used therefor |
| JP5316143B2 (en) * | 2009-03-23 | 2013-10-16 | トヨタ自動車株式会社 | Exhaust gas analyzer |
| JP2013113664A (en) * | 2011-11-28 | 2013-06-10 | Yokogawa Electric Corp | Laser gas analyzer |
| JP5809961B2 (en) * | 2011-12-22 | 2015-11-11 | 株式会社堀場製作所 | Sample gas analyzer and program for sample gas analyzer |
| CN102680425B (en) * | 2012-03-21 | 2014-08-06 | 西安交通大学 | Multiple analysis model information fusion method for multicomponent gas Fourier transform spectral analysis |
| JP6128150B2 (en) * | 2015-03-12 | 2017-05-17 | 横河電機株式会社 | Laser gas analyzer |
| JP6269576B2 (en) | 2015-05-25 | 2018-01-31 | 横河電機株式会社 | Multi-component gas analysis system and method |
| JP6951167B2 (en) * | 2016-11-29 | 2021-10-20 | 株式会社堀場製作所 | Gas analyzer and gas analysis method |
| WO2019012773A1 (en) | 2017-07-14 | 2019-01-17 | 株式会社堀場製作所 | Gas analysis device, program for gas analysis device, and gas analysis method |
| JP6983244B2 (en) * | 2017-08-07 | 2021-12-17 | 株式会社堀場製作所 | Analytical device, analysis method, program for analyzer and learning device for analysis |
| JP7335727B2 (en) | 2019-06-07 | 2023-08-30 | 株式会社堀場製作所 | Exhaust gas analyzer, exhaust gas analysis method, exhaust gas analysis program and machine learning device |
| WO2021005900A1 (en) | 2019-07-05 | 2021-01-14 | 株式会社堀場製作所 | Sample gas analysis device, sample gas analysis method, and program for sample gas analysis |
| CN111007033B (en) * | 2019-12-09 | 2022-08-30 | 温州大学 | Trace acetylene gas concentration detection method based on spectrum and power spectrum feature fusion |
| CN115639168B (en) * | 2022-12-21 | 2023-04-07 | 杭州泽天春来科技有限公司 | Gas detection method, system and medium for gas analyzer |
| CN116183541B (en) * | 2023-04-24 | 2023-06-23 | 南方电网科学研究院有限责任公司 | Gas measurement method and device based on FTIR technology |
Family Cites Families (12)
| Publication number | Priority date | Publication date | Assignee | Title |
|---|---|---|---|---|
| JP2649667B2 (en) * | 1990-06-28 | 1997-09-03 | 株式会社堀場製作所 | Multi-component analysis method in spectroscopic analysis |
| DE4203587C2 (en) * | 1991-02-15 | 1997-04-17 | Horiba Ltd | Quantitative spectral analysis method |
| JP2926277B2 (en) * | 1991-02-16 | 1999-07-28 | 株式会社堀場製作所 | Multi-component quantitative analysis method using FTIR |
| JP2926278B2 (en) * | 1991-02-21 | 1999-07-28 | 株式会社堀場製作所 | Multi-component analysis method in spectroscopic analysis |
| DE4203588C2 (en) | 1991-02-16 | 1996-11-14 | Horiba Ltd | Quantitative spectral analysis method |
| US5138163A (en) | 1991-09-09 | 1992-08-11 | Ford Motor Company | Direct sampling of engine emissions for instantaneous analysis |
| JP2741376B2 (en) * | 1992-04-18 | 1998-04-15 | 株式会社堀場製作所 | Multi-component analysis method in spectroscopic analysis |
| DE4317867A1 (en) | 1993-05-28 | 1994-12-01 | Pierburg Gmbh | Method and device for the measurement of internal combustion engine exhaust gas components |
| GB2320155B (en) * | 1996-12-03 | 2000-11-01 | Chelsea Instr Ltd | Method and apparatus for the imaging of gases |
| AUPO425896A0 (en) * | 1996-12-18 | 1997-01-23 | University Of Wollongong, The | Method and apparatus for measuring gas concentrations and isotope ratios in gases |
| JP3374077B2 (en) * | 1998-05-12 | 2003-02-04 | 株式会社堀場製作所 | Exhaust gas sampling device |
| US6422056B1 (en) * | 1999-02-05 | 2002-07-23 | Horiba, Ltd. | Method for correcting the effect of a effect of a coexistent gas in a gas analysis and a gas analyzing apparatus using same |
-
1999
- 1999-06-04 JP JP15849399A patent/JP4079404B2/en not_active Expired - Lifetime
-
2000
- 2000-05-25 US US09/578,998 patent/US6894297B1/en not_active Expired - Lifetime
- 2000-05-31 DE DE2000127074 patent/DE10027074B4/en not_active Expired - Lifetime
Also Published As
| Publication number | Publication date |
|---|---|
| DE10027074A1 (en) | 2001-04-05 |
| US6894297B1 (en) | 2005-05-17 |
| JP2000346801A (en) | 2000-12-15 |
| DE10027074B4 (en) | 2005-11-24 |
Similar Documents
| Publication | Publication Date | Title |
|---|---|---|
| JP4079404B2 (en) | Multi-component gas analysis method by FTIR method | |
| US7868296B2 (en) | Spectroscopy having correction for broadband distortion for analyzing multi-component samples | |
| JP2000346801A5 (en) | ||
| US5305076A (en) | Quantitative analytical method and apparatus for spectrometric analysis using wave number data points | |
| JP2926277B2 (en) | Multi-component quantitative analysis method using FTIR | |
| JP3004747B2 (en) | Quantitative analysis method using Fourier transform infrared spectrometer | |
| Hiukka | A multivariate approach to the analysis of pine needle samples using NIR | |
| US6422056B1 (en) | Method for correcting the effect of a effect of a coexistent gas in a gas analysis and a gas analyzing apparatus using same | |
| JPS6140928B2 (en) | ||
| JP4146697B2 (en) | Temperature measuring method and temperature measuring device | |
| WO2021005900A1 (en) | Sample gas analysis device, sample gas analysis method, and program for sample gas analysis | |
| JPH0414298B2 (en) | ||
| JP2649667B2 (en) | Multi-component analysis method in spectroscopic analysis | |
| JP4113302B2 (en) | Method and apparatus for removing influence of coexisting gas in gas analysis | |
| JP3004748B2 (en) | Quantitative analysis method using Fourier transform infrared spectrometer | |
| JPH04148830A (en) | Multiple-component determining method in spectrochemical analysis | |
| JP2772374B2 (en) | Fourier transform infrared spectrometer | |
| JP2913527B2 (en) | Quantitative analysis method using a spectrometer | |
| US11965823B2 (en) | Method of correcting for an amplitude change in a spectrometer | |
| JPH09101259A (en) | Method for determining components using spectrophotometer | |
| RU2805385C2 (en) | Method for correcting amplitude changes in spectrometer | |
| WO2022102685A1 (en) | Spectroscopic analysis system, calculating device, and calculating program | |
| JPH0727703A (en) | Quantitative analysis of multiple component substance | |
| JPH04265842A (en) | Method for quantitative analysis of many components using ftir | |
| JP2023520836A (en) | How to determine the optical path length through a cuvette |
Legal Events
| Date | Code | Title | Description |
|---|---|---|---|
| A621 | Written request for application examination |
Free format text: JAPANESE INTERMEDIATE CODE: A621 Effective date: 20040407 |
|
| A521 | Written amendment |
Free format text: JAPANESE INTERMEDIATE CODE: A523 Effective date: 20040409 |
|
| A977 | Report on retrieval |
Free format text: JAPANESE INTERMEDIATE CODE: A971007 Effective date: 20041126 |
|
| A131 | Notification of reasons for refusal |
Free format text: JAPANESE INTERMEDIATE CODE: A131 Effective date: 20041207 |
|
| A521 | Written amendment |
Free format text: JAPANESE INTERMEDIATE CODE: A523 Effective date: 20050126 |
|
| A02 | Decision of refusal |
Free format text: JAPANESE INTERMEDIATE CODE: A02 Effective date: 20050726 |
|
| A521 | Written amendment |
Free format text: JAPANESE INTERMEDIATE CODE: A523 Effective date: 20050926 |
|
| A911 | Transfer to examiner for re-examination before appeal (zenchi) |
Free format text: JAPANESE INTERMEDIATE CODE: A911 Effective date: 20051006 |
|
| A912 | Re-examination (zenchi) completed and case transferred to appeal board |
Free format text: JAPANESE INTERMEDIATE CODE: A912 Effective date: 20060407 |
|
| A521 | Written amendment |
Free format text: JAPANESE INTERMEDIATE CODE: A523 Effective date: 20071228 |
|
| A61 | First payment of annual fees (during grant procedure) |
Free format text: JAPANESE INTERMEDIATE CODE: A61 Effective date: 20080204 |
|
| FPAY | Renewal fee payment (event date is renewal date of database) |
Free format text: PAYMENT UNTIL: 20140215 Year of fee payment: 6 |
|
| R150 | Certificate of patent or registration of utility model |
Ref document number: 4079404 Country of ref document: JP Free format text: JAPANESE INTERMEDIATE CODE: R150 Free format text: JAPANESE INTERMEDIATE CODE: R150 |
|
| FPAY | Renewal fee payment (event date is renewal date of database) |
Free format text: PAYMENT UNTIL: 20140215 Year of fee payment: 6 |
|
| R250 | Receipt of annual fees |
Free format text: JAPANESE INTERMEDIATE CODE: R250 |
|
| R250 | Receipt of annual fees |
Free format text: JAPANESE INTERMEDIATE CODE: R250 |
|
| R250 | Receipt of annual fees |
Free format text: JAPANESE INTERMEDIATE CODE: R250 |
|
| R250 | Receipt of annual fees |
Free format text: JAPANESE INTERMEDIATE CODE: R250 |
|
| R250 | Receipt of annual fees |
Free format text: JAPANESE INTERMEDIATE CODE: R250 |
|
| R250 | Receipt of annual fees |
Free format text: JAPANESE INTERMEDIATE CODE: R250 |
|
| EXPY | Cancellation because of completion of term |