WO2023127262A1 - Machine learning device, exhaust gas analysis device, machine learning method, exhaust gas analysis method, machine learning program, and exhaust gas analysis program - Google Patents
Machine learning device, exhaust gas analysis device, machine learning method, exhaust gas analysis method, machine learning program, and exhaust gas analysis program Download PDFInfo
- Publication number
- WO2023127262A1 WO2023127262A1 PCT/JP2022/039964 JP2022039964W WO2023127262A1 WO 2023127262 A1 WO2023127262 A1 WO 2023127262A1 JP 2022039964 W JP2022039964 W JP 2022039964W WO 2023127262 A1 WO2023127262 A1 WO 2023127262A1
- Authority
- WO
- WIPO (PCT)
- Prior art keywords
- concentration
- exhaust gas
- machine learning
- specific component
- data
- Prior art date
Links
- 238000010801 machine learning Methods 0.000 title claims abstract description 134
- 238000004868 gas analysis Methods 0.000 title claims abstract description 10
- 238000000034 method Methods 0.000 title claims description 13
- 238000001228 spectrum Methods 0.000 claims abstract description 68
- 230000001678 irradiating effect Effects 0.000 claims abstract description 21
- 238000012549 training Methods 0.000 claims abstract description 19
- 238000001514 detection method Methods 0.000 claims abstract description 12
- 239000007789 gas Substances 0.000 claims description 167
- 238000002485 combustion reaction Methods 0.000 claims description 64
- 238000013500 data storage Methods 0.000 claims description 53
- 230000003595 spectral effect Effects 0.000 claims description 43
- 238000004364 calculation method Methods 0.000 claims description 26
- UGFAIRIUMAVXCW-UHFFFAOYSA-N Carbon monoxide Chemical compound [O+]#[C-] UGFAIRIUMAVXCW-UHFFFAOYSA-N 0.000 claims description 14
- 239000003546 flue gas Substances 0.000 claims description 14
- 238000005033 Fourier transform infrared spectroscopy Methods 0.000 claims description 13
- 230000006870 function Effects 0.000 claims description 11
- 238000012545 processing Methods 0.000 description 21
- 238000005259 measurement Methods 0.000 description 17
- 238000010586 diagram Methods 0.000 description 11
- 238000004458 analytical method Methods 0.000 description 10
- 239000000446 fuel Substances 0.000 description 8
- 229930195733 hydrocarbon Natural products 0.000 description 7
- 150000002430 hydrocarbons Chemical class 0.000 description 7
- 229910052760 oxygen Inorganic materials 0.000 description 7
- 238000000862 absorption spectrum Methods 0.000 description 6
- XLYOFNOQVPJJNP-UHFFFAOYSA-N water Chemical compound O XLYOFNOQVPJJNP-UHFFFAOYSA-N 0.000 description 6
- 239000004215 Carbon black (E152) Substances 0.000 description 5
- MCMNRKCIXSYSNV-UHFFFAOYSA-N Zirconium dioxide Chemical compound O=[Zr]=O MCMNRKCIXSYSNV-UHFFFAOYSA-N 0.000 description 4
- 239000000126 substance Substances 0.000 description 4
- 238000012360 testing method Methods 0.000 description 4
- 238000010521 absorption reaction Methods 0.000 description 3
- 238000004566 IR spectroscopy Methods 0.000 description 2
- 229910000661 Mercury cadmium telluride Inorganic materials 0.000 description 2
- 230000000694 effects Effects 0.000 description 2
- 238000005070 sampling Methods 0.000 description 2
- LFQSCWFLJHTTHZ-UHFFFAOYSA-N Ethanol Chemical compound CCO LFQSCWFLJHTTHZ-UHFFFAOYSA-N 0.000 description 1
- WSFSSNUMVMOOMR-UHFFFAOYSA-N Formaldehyde Chemical compound O=C WSFSSNUMVMOOMR-UHFFFAOYSA-N 0.000 description 1
- JCXJVPUVTGWSNB-UHFFFAOYSA-N Nitrogen dioxide Chemical compound O=[N]=O JCXJVPUVTGWSNB-UHFFFAOYSA-N 0.000 description 1
- QVGXLLKOCUKJST-UHFFFAOYSA-N atomic oxygen Chemical compound [O] QVGXLLKOCUKJST-UHFFFAOYSA-N 0.000 description 1
- 239000000919 ceramic Substances 0.000 description 1
- 239000000470 constituent Substances 0.000 description 1
- 235000019441 ethanol Nutrition 0.000 description 1
- 230000010365 information processing Effects 0.000 description 1
- 238000009434 installation Methods 0.000 description 1
- PNDPGZBMCMUPRI-UHFFFAOYSA-N iodine Chemical compound II PNDPGZBMCMUPRI-UHFFFAOYSA-N 0.000 description 1
- 229910052740 iodine Inorganic materials 0.000 description 1
- 239000011630 iodine Substances 0.000 description 1
- 238000012417 linear regression Methods 0.000 description 1
- VNWKTOKETHGBQD-UHFFFAOYSA-N methane Chemical compound C VNWKTOKETHGBQD-UHFFFAOYSA-N 0.000 description 1
- 238000012986 modification Methods 0.000 description 1
- 230000004048 modification Effects 0.000 description 1
- 238000001745 non-dispersive infrared spectroscopy Methods 0.000 description 1
- 239000001301 oxygen Substances 0.000 description 1
- 230000002093 peripheral effect Effects 0.000 description 1
- WFKWXMTUELFFGS-UHFFFAOYSA-N tungsten Chemical compound [W] WFKWXMTUELFFGS-UHFFFAOYSA-N 0.000 description 1
- 229910052721 tungsten Inorganic materials 0.000 description 1
- 239000010937 tungsten Substances 0.000 description 1
Images


Classifications
-
- G—PHYSICS
- G01—MEASURING; TESTING
- G01N—INVESTIGATING OR ANALYSING MATERIALS BY DETERMINING THEIR CHEMICAL OR PHYSICAL PROPERTIES
- G01N21/00—Investigating or analysing materials by the use of optical means, i.e. using sub-millimetre waves, infrared, visible or ultraviolet light
- G01N21/17—Systems in which incident light is modified in accordance with the properties of the material investigated
- G01N21/25—Colour; Spectral properties, i.e. comparison of effect of material on the light at two or more different wavelengths or wavelength bands
- G01N21/31—Investigating relative effect of material at wavelengths characteristic of specific elements or molecules, e.g. atomic absorption spectrometry
- G01N21/35—Investigating relative effect of material at wavelengths characteristic of specific elements or molecules, e.g. atomic absorption spectrometry using infrared light
- G01N21/3504—Investigating relative effect of material at wavelengths characteristic of specific elements or molecules, e.g. atomic absorption spectrometry using infrared light for analysing gases, e.g. multi-gas analysis
Definitions
- the present invention relates to a machine learning device, an exhaust gas analyzer, a machine learning method, an exhaust gas analysis method, a machine learning program, and an exhaust gas analysis program.
- an FTIR analyzer using Fourier transform infrared spectroscopy has been used to analyze components contained in exhaust gas, as shown in Patent Document 1.
- FTIR Fourier transform infrared spectroscopy
- the FTIR spectrometer can analyze components that absorb infrared rays, it cannot analyze components that do not absorb infrared rays. Therefore, when measuring the concentration of H 2 that does not absorb infrared rays, a dedicated H 2 analyzer such as a thermal conductivity gas analyzer (TCD) is required in addition to the FTIR analyzer. Moreover, when measuring the concentration of O 2 that does not absorb infrared rays, a dedicated O 2 analyzer such as a zirconia sensor is required in addition to the FTIR analyzer. As a result, installation space for both the FTIR analyzer and the H 2 analyzer or O 2 analyzer is required, resulting in an increase in the size of the exhaust gas analyzer. Such problems can occur not only in FTIR analyzers but also in other exhaust gas analyzers using light.
- TCD thermal conductivity gas analyzer
- the present invention has been made in view of the above-described problems, and provides an exhaust gas analyzer capable of measuring H 2 concentration or O 2 concentration, which had to be measured using another analyzer. is the main subject.
- the machine learning device is a machine learning device used in an exhaust gas analyzer that irradiates a combustion exhaust gas with light, detects the light transmitted through the combustion exhaust gas, and analyzes the combustion exhaust gas based on the detection signal.
- An apparatus comprising a training data reception unit that receives training data and a machine learning unit that performs machine learning using the training data, wherein the training data reception unit is obtained by an analyzer different from the exhaust gas analyzer.
- the machine learning unit Based on the reference value of the specific component concentration which is at least one of the H 2 concentration or O 2 concentration, the spectral data obtained by irradiating the combustion exhaust gas with light, and the element balance formula for obtaining the specific component concentration or at least one of the calculated values of the specific component concentration calculated using the individual component concentration in the element balance formula, and the machine learning unit generates specific component correlation data by machine-learning the relationship between the reference value of the specific component concentration and at least one of the spectral data, the individual component concentration, or the calculated value of the specific component concentration. It is characterized by
- the reference value of the specific component concentration that is at least one of the H 2 concentration or the O 2 concentration, the spectrum data obtained by irradiating the combustion exhaust gas with light, and the specific component concentration By machine learning the relationship between at least one of the individual component concentration selected based on the element balance formula or the calculated value of the specific component concentration calculated using the individual component concentration in the element balance formula, the machine Using a machine learning model generated by learning, spectrum data obtained by irradiating light on combustion exhaust gas, individual component concentration obtained by exhaust gas analyzer, or calculated from individual component concentration and element balance formula
- the specific component concentration can be calculated from at least one of the calculated values of the specific component concentration.
- the H 2 concentration or O 2 concentration which had to be measured using another analyzer in the exhaust gas analyzer, can be measured.
- the H 2 concentration or O 2 concentration that does not absorb infrared light can be measured.
- the teacher data receiving unit receives teacher data including the reference value of the specific component concentration and the spectrum data
- the machine learning unit receives the specific component concentration It is preferable that machine learning is performed on the relationship between the reference value of and the spectrum data to generate the specific component correlation data.
- the teacher data receiving unit further receives the individual component concentration as teacher data
- the machine learning unit receives the specific It is preferable that the specific component correlation data be generated by machine learning of the relationship between the component concentration reference value, the spectrum data, and the individual component concentration.
- the error between the reference value of the specific component concentration and the calculated value of the specific component concentration is calculated.
- calculating the minimized error minimum value and generating, as part of the specific component correlation data, first correlation data indicating the correlation between the minimum error value and a parameter used to calculate the minimum error value;
- a correlation data generation unit machine-learns the relationship between the spectral data and the minimum error value, and generates second correlation data indicating the correlation between the spectral data and the minimum error value as part of the specific component correlation data. It is desirable to have a second correlation data generator that generates the second correlation data generator.
- the teacher data receiving unit receives teacher data including the reference value of the concentration of the specific component and the concentration of the individual component, and the machine learning unit receives the specific component It is preferable that the specific component correlation data be generated by machine learning the relationship between the concentration reference value and the individual component concentration.
- the individual component concentration may be at least one of CO 2 concentration, CO concentration, H 2 O concentration, or THC concentration. Further, when machine learning is performed on O 2 correlation data as the specific component correlation data, the individual component concentration is at least one of CO 2 concentration, CO concentration, H 2 O concentration, THC concentration, or NO concentration. can be considered.
- the concentration of each hydrocarbon (HC) is obtained individually from the spectral data, and then weighted and added together. A two-stage calculation is performed, and an error that may occur in setting the weighting coefficient is superimposed on an error that may occur in the concentration measurement of each HC. Therefore, it is difficult to improve the measurement accuracy.
- the teacher data reception unit receives teacher data including the reference value of the THC concentration obtained by an analyzer different from the exhaust gas analyzer and the spectrum data. It is preferable that the machine learning unit machine-learns the relationship between the THC concentration reference value and the spectrum data to generate THC correlation data.
- the individual component concentration includes the THC concentration, and it is desirable that the THC concentration be obtained from the spectral data obtained by the exhaust gas analyzer and the THC correlation data.
- an exhaust gas analyzer for analyzing combustion exhaust gas, comprising: a light source for irradiating the combustion exhaust gas with light; a photodetector for detecting light transmitted through the combustion exhaust gas; Specific component concentration which is at least one of H 2 concentration or O 2 concentration in combustion exhaust gas, spectrum data obtained by irradiating the combustion exhaust gas with light, element balance formula for obtaining the specific component concentration Specific component correlation storing specific component correlation data obtained by learning a relationship between at least one of the individual component concentration selected by the method and the calculated value of the specific component concentration calculated using the individual component concentration in the element balance formula Specific component concentration for calculating the specific component concentration in the flue gas from a data storage unit, at least one of the spectrum data, the individual component concentration, or the calculated value of the specific component concentration, and the specific component correlation data. and a calculator.
- the specific component concentration which is at least one of the H 2 concentration or O 2 concentration in the combustion exhaust gas, the spectrum data obtained by irradiating the combustion exhaust gas with light, and the specific component concentration are obtained.
- Specific component correlation data machine learning Spectral data obtained by irradiating the combustion exhaust gas with light using a model
- individual component concentrations obtained by an exhaust gas analyzer or calculated values of specific component concentrations calculated from individual component concentrations and elemental balance equations From at least one of, the specific component concentration can be calculated.
- the H 2 concentration or O 2 concentration that would otherwise have to be measured using another analyzer can be measured in the analyzer.
- the H 2 concentration or O 2 concentration that does not absorb infrared light can be measured.
- the exhaust gas analyzer of the present invention further includes a THC correlation data storage unit for storing THC correlation data obtained by learning the relationship between the THC concentration reference value obtained by an analyzer different from the exhaust gas analyzer and the spectrum data, It is desirable to further include a THC concentration calculation section for calculating the THC concentration in the combustion exhaust gas from the spectral data obtained by irradiating the combustion exhaust gas with light and the THC correlation data. With this configuration, the THC concentration in the combustion exhaust gas can be measured with high accuracy.
- the individual component concentration includes the THC concentration, and the THC concentration is calculated by the THC concentration calculating section.
- the learned model storage unit stores the specific component concentration a first correlation data storage unit for storing first correlation data indicating the correlation between the minimum error value between the reference value of and the calculated value of the concentration of the specific component and the parameter used to calculate the minimum error value; a second correlation data storage unit that stores second correlation data indicating the correlation between the data and the minimum error value, and the specific component concentration calculation unit calculates the It is desirable to calculate the specific component concentration in the combustion exhaust gas from a minimum error value calculating section for calculating the minimum error value, and the minimum error value obtained by the minimum error value calculating section and the first correlation data.
- the combustion exhaust gas may be exhaust gas from an automobile.
- a so-called FTIR method is preferable.
- the machine learning method according to the present invention is a machine learning method used in an exhaust gas analyzer that irradiates light on combustion exhaust gas, detects light that has passed through the combustion exhaust gas, and analyzes the combustion exhaust gas based on the detection signal.
- a method comprising a teacher data receiving step of receiving teacher data and a machine learning step of performing machine learning using the teacher data, wherein the teacher data receiving step is obtained by an analyzer different from the exhaust gas analyzer.
- a reference value for the specific component concentration which is at least one of H 2 concentration or O 2 concentration, spectral data obtained by irradiating the combustion exhaust gas with light, or an element balance formula for obtaining the specific component concentration receiving teacher data containing at least one of the individual component concentrations selected based on the element balance formula or the calculated value of the specific component concentration calculated using the individual component concentrations in the element balance formula, and the machine learning step
- the specific component correlation data is generated by machine-learning a relationship between the reference value of the specific component concentration and at least one of the spectral data, the individual component concentration, or the calculated value of the specific component concentration.
- the machine learning program according to the present invention is a machine used in an exhaust gas analyzer that irradiates light on combustion exhaust gas, detects light that has passed through the combustion exhaust gas, and analyzes the combustion exhaust gas based on the detection signal.
- a learning program wherein a computer is provided with a function as a training data reception unit that receives training data and a function as a machine learning unit that performs machine learning using the training data, and the training data reception unit receives the exhaust gas
- a reference value for the specific component concentration which is at least one of H 2 concentration or O 2 concentration, obtained by an analyzer different from the analysis device, spectral data obtained by irradiating the combustion exhaust gas with light, or the specific
- a teacher containing at least one of individual component concentrations selected based on an element balance formula for obtaining component concentrations, or a calculated value of a specific component concentration calculated using the individual component concentrations in the element balance formula
- the machine learning unit machine-learns the relationship between the reference value of the concentration of the specific component and at least one
- the exhaust gas analysis method is a method for analyzing combustion exhaust gas using a light source for irradiating the combustion exhaust gas with light and a photodetector for detecting light transmitted through the combustion exhaust gas.
- a specific component concentration that is at least one of H 2 concentration or O 2 concentration in the flue gas, spectrum data obtained by irradiating the flue gas with light, or an element balance for obtaining the specific component concentration
- specific component correlation data obtained by learning a relationship between at least one of individual component concentrations selected based on the formula and calculated values of specific component concentrations calculated using the individual component concentrations in the element balance formula
- the specific component concentration in the flue gas is calculated from at least one of the spectrum data, the individual component concentration, or the calculated value of the specific component concentration, and the specific component correlation data.
- an exhaust gas analysis program is an exhaust gas analysis program used in an exhaust gas analyzer using a light source for irradiating light on combustion exhaust gas and a photodetector for detecting light transmitted through the combustion exhaust gas.
- a specific component concentration that is at least one of H 2 concentration or O 2 concentration in the flue gas, spectral data obtained by irradiating the flue gas with light, or obtaining the specific component concentration
- Specific component correlation data obtained by learning a relationship between at least one of individual component concentrations selected based on an element balance formula, or a calculated value of a specific component concentration calculated using the individual component concentrations in the element balance formula.
- the computer is provided with a function as a specific component concentration calculation unit that calculates the concentration.
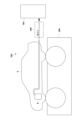
- FIG. 1 is an overall view of an exhaust gas measurement system including an exhaust gas analyzer according to one embodiment of the present invention
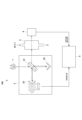
- FIG. It is a schematic diagram which shows the whole exhaust gas analyzer in the same embodiment.
- It is a basic functional block diagram of the arithmetic processing unit in the same embodiment.
- It is a functional block diagram of the machine learning device in the same embodiment.
- It is a functional block diagram of the arithmetic processing unit in the same embodiment.
- FIG. 11 is a functional block diagram of a machine learning device in a modified embodiment;
- FIG. 11 is a functional block diagram of a machine learning device in a modified embodiment;
- FIG. 11 is a functional block diagram of a machine learning device in a modified embodiment; It is a functional block diagram of an arithmetic processing unit in a modified embodiment. It is a functional block diagram of an arithmetic processing unit in a modified embodiment. FIG. 11 is a functional block diagram of a machine learning device in a modified embodiment;
- the exhaust gas analyzer 100 of this embodiment constitutes a part of the exhaust gas measurement system 200, for example.
- this exhaust gas measurement system 200 includes a chassis dynamo 300 and exhaust gas sampling for sampling combustion exhaust gas (hereinafter simply referred to as "exhaust gas") of a vehicle V, which is a test vehicle running on the chassis dynamo 300. It comprises an apparatus 400 and an analysis apparatus 100 that analyzes the measurement target component in the sampled exhaust gas.
- the exhaust gas analyzer 100 is equipped with an infrared light source 1, an interferometer (spectroscopic unit) 2, a measurement cell 3, a photodetector 4, an arithmetic processing unit 5, and the like. It is an infrared gas analyzer using infrared spectroscopy (FTIR).
- FTIR infrared spectroscopy
- the infrared light source 1 emits infrared light having a broad spectrum (continuous light including light of many wavenumbers), and uses, for example, a tungsten/iodine lamp or a high-brightness ceramic light source.
- the interferometer 2 uses a so-called Michelson interferometer, which includes a half mirror (beam splitter) 21, a fixed mirror 22 and a movable mirror 23, as shown in the figure.
- Light from the infrared light source 1 incident on the interferometer 2 is split by a half mirror 21 into reflected light and transmitted light.
- One light is reflected by the fixed mirror 22 , the other is reflected by the movable mirror 23 , returns to the half mirror 21 again, is synthesized, and exits from the interferometer 2 .
- the measurement cell 3 is a transparent cell into which the sampled exhaust gas is introduced.
- the photodetector 4 detects infrared light that has passed through the exhaust gas and outputs the detection signal (light intensity signal) to the arithmetic processing device 5 .
- the photodetector 4 of this embodiment is, for example, an MCT (HgCdTe) detector, but may be a photodetector having other infrared detection elements.
- the arithmetic processing unit 5 has, for example, an analog electric circuit having a buffer, an amplifier, etc., a digital electric circuit having a CPU, a memory, a DSP, etc., and an A/D converter interposed therebetween. be.
- the arithmetic processing unit 5 functions as a main analysis unit 51 as shown in FIG.
- the main analysis unit 51 calculates transmitted light spectrum data representing the spectrum of light transmitted through the exhaust gas from the detection signal (light intensity signal) of the photodetector 4, and calculates infrared absorption spectrum data from the transmitted light spectrum data. , to identify various components in the exhaust gas and to calculate the concentration of each component.
- the main analysis unit 51 includes a spectral data generation unit 511 and an individual component analysis unit 512.
- the movable mirror 23 When the movable mirror 23 is advanced and retreated and the intensity of the light transmitted through the exhaust gas is observed with the position of the movable mirror 23 as the horizontal axis, in the case of light with a single wave number, the light intensity draws a sine curve due to interference.
- the sine curve since the actual light that has passed through the exhaust gas is continuous light, the sine curve differs for each wavenumber, and the actual light intensity is a superposition of the sine curves drawn by each wavenumber, and the interference pattern (interferogram) is form a wave packet.
- the spectrum data generation unit 511 obtains the position of the movable mirror 23 by a rangefinder (not shown) such as a HeNe laser (not shown), and obtains the light intensity at each position of the movable mirror 23 by the photodetector 4.
- FFT Fast Fourier transform
- the individual component analysis unit 512 determines various components (eg, CO, CO 2 , NO, H 2 O, NO 2 , or hydrocarbon component (HC), etc.) is specified, the concentration of each component is calculated, and this is output as individual component concentration data.
- various components eg, CO, CO 2 , NO, H 2 O, NO 2 , or hydrocarbon component (HC), etc.
- the machine learning device 6 of the present embodiment performs machine learning by utilizing the fact that the H 2 concentration and the O 2 concentration can be estimated using the element balance formula obtained from the fuel combustion formula shown below. From the following elemental balance formula (conservation law of substance amount), the H2 concentration can be linearly regressed with the concentrations of the components ( CO2 , CO, H2O , THC), and the O2 concentration can be linearly regressed with the concentrations of the components ( CO2 , CO , H 2 O, THC, NO) can be linearly regressed. Moreover, since the H 2 concentration and the O 2 concentration can be estimated from the individual component concentrations, they can also be estimated from the spectral data for obtaining these individual component concentrations.
- At least one of CO 2 concentration, CO concentration, H 2 O concentration, or THC concentration can be used as the individual component concentration when calculating the H 2 concentration.
- At least one of CO 2 concentration, CO concentration, H 2 O concentration, THC concentration, or NO concentration can be used as the individual component concentration when calculating the O 2 concentration.
- the H2 concentration can be linearly regressed with the concentrations of the components ( CO2 , CO, H2O , THC).
- the O2 concentration can be linearly regressed with the concentrations of the components ( CO2 , CO, H2O , THC, NO).
- This machine learning device 6 is a computer having a CPU, a memory, an input/output interface, an AD converter, or input means such as a keyboard, etc., and the CPU and its peripheral devices cooperate according to the machine learning program stored in the memory. As a result, as shown in FIG. 4, the functions of a teacher data receiving unit 61 that receives teacher data and a machine learning unit 62 that performs machine learning using the teacher data are exhibited.
- the machine learning device 6 may be incorporated in the arithmetic processing device 5 of the exhaust gas analyzer 100 described above, or a part of the functions of the machine learning device 6 may be provided in the arithmetic processing device 5. Also good.
- the teaching data receiving unit 61 receives the H 2 concentration reference value obtained by an H 2 analyzer (not shown) different from the infrared gas analyzer (exhaust gas analyzer) and the infrared gas analyzer (exhaust gas analyzer).
- Different teacher data including a reference value of O 2 concentration obtained by an O 2 analyzer (not shown) and spectral data obtained by an infrared gas analyzer are accepted.
- the spectral data included in this teacher data is the absorption spectral data generated by the spectral data generating section 511 of the arithmetic processing unit 5, but may be transmitted light spectral data of the exhaust gas.
- the H 2 spectrometer may be, for example, a thermal conductivity gas spectrometer (TCD) or a mass spectrometer.
- TCD thermal conductivity gas spectrometer
- a mass spectrometer for the O 2 analyzer, for example, a zirconia sensor, a magnetic oxygen concentration meter, or the like may be used.
- the machine learning unit 62 machine-learns the relationship between the H 2 concentration reference value and the spectrum data, and performs H 2 correlation data (a machine learning model for calculating H 2 concentration) that indicates the correlation between the H 2 concentration and the spectrum data. and the O2 correlation data ( O2 concentration calculation and an O 2 correlation data generator 622 that generates a machine learning model for
- the H2 correlation data (machine learning model for calculating the H2 concentration) calculated by the H2 correlation data generation unit 621 is stored in the H2 correlation data storage unit 623, and is stored in the O2 correlation data generation unit 622.
- the calculated O 2 correlation data (machine learning model for calculating O 2 concentration) is stored in the O 2 correlation data storage unit 624 .
- the exhaust gas analyzer 100 can calculate the H 2 concentration using the H 2 correlation data (machine learning model for calculating the H 2 concentration ) generated by the machine learning device 6.
- O2 concentration can be calculated using O2 correlation data (machine learning model for calculating O2 concentration).
- the arithmetic processing unit 5 of the exhaust gas analyzer 100 includes an H 2 concentration calculation unit 52 that calculates the H 2 concentration using the H 2 correlation data, and an O 2 concentration calculation unit 52 that calculates the O 2 concentration using the O 2 correlation data . and a density calculator 53 .
- the H 2 correlation data is stored in the H 2 correlation data storage unit 54
- the O 2 correlation data is stored in the O 2 correlation data storage unit 55 .
- the H2 correlation data storage unit 54 may be configured from the H2 correlation data storage unit 623 of the machine learning device 6.
- the O 2 correlation data storage unit 55 may be configured from the O 2 correlation data storage unit 624 of the machine learning device 6 .
- the H 2 concentration calculator 52 calculates the H 2 concentration in the exhaust gas from the spectrum data generated by the spectrum data generator 511 and the H 2 correlation data.
- the H 2 concentration calculation unit 52 calculates the H 2 concentration using the absorption spectrum data generated by the spectrum data generation unit 511. . Further, when the H2 correlation data is generated using the transmitted light spectrum data, the H2 concentration calculator 52 calculates the H2 concentration using the transmitted light spectrum data generated by the spectrum data generator 511. do.
- the O 2 concentration calculator 53 calculates the O 2 concentration in the combustion exhaust gas from the spectrum data generated by the spectrum data generator 511 and the O 2 correlation data.
- the O 2 concentration calculation unit 53 calculates the O 2 concentration using the absorption spectrum data generated by the spectrum data generation unit 511. . Further, when the O 2 correlation data is generated using the transmitted light spectrum data, the O 2 concentration calculation unit 53 calculates the O 2 concentration using the transmitted light spectrum data generated by the spectrum data generation unit 511. do.
- the H 2 concentration or O 2 concentration in the exhaust gas and the photodetector 4 H 2 concentration or O 2 concentration is calculated from the spectral data obtained from the detection signal of the photodetector 4 using the correlation data (machine learning model) that learned the relationship with the spectral data obtained from the detection signal of become able to.
- the correlation data machine learning model
- the teacher data receiving unit 61 obtains from the spectral data, in addition to the H 2 concentration reference value, the O 2 concentration reference value, and the spectral data as the teacher data, It may accept individual component concentrations selected based on an elemental balance equation. Then, in the machine learning unit 62, the H 2 correlation data generation unit 621 machine-learns the relationship between the H 2 concentration reference value, the spectrum data, and the individual component concentration, and calculates the H 2 concentration, the spectrum data, and the individual component concentration.
- Generate H 2 correlation data (machine learning model for calculating H 2 concentration) showing the correlation of Further, the O 2 correlation data generation unit 622 machine-learns the relationship between the reference value of the O 2 concentration, the spectrum data, and the individual component concentration, and the O 2 concentration indicating the correlation between the O 2 concentration, the spectrum data, and the individual component concentration .
- Generate correlation data (machine learning model for O2 concentration calculation). In this way, by including the individual component concentrations selected based on the element balance formula in addition to the spectral data in the teacher data, the measurement accuracy of the O 2 concentration or H 2 concentration can be improved.
- the teacher data receiving unit 61 stores the H 2 concentration reference value obtained by an H 2 analyzer different from the infrared gas analyzer (exhaust gas analyzer) and the infrared gas analyzer
- the spectral data obtained by the infrared gas analyzer (exhaust gas analyzer) and the individual components obtained from the spectral data It accepts teacher data including concentrations and
- the spectral data included in this teacher data may be transmitted light spectral data of the exhaust gas generated by the spectral data generating section 511, or may be absorption spectral data.
- the individual component concentration is the individual component concentration such as CO, CO 2 , NO, H 2 O, NO 2 or hydrocarbon component (HC) analyzed by the individual component analysis unit 512 .
- the machine learning device 6 of this embodiment estimates the calculated value (estimated value) of the H 2 concentration and the calculated value (estimated value) of the O 2 concentration using the element balance formula. That is, from the above-mentioned elemental balance formula (conservation law of substance amount), the H 2 concentration can be linearly regressed with the concentration of the component (CO 2 , CO, H 2 O, THC), and the O 2 concentration can be linearly regressed from the component (CO 2 , CO, H 2 O, THC, and NO).
- the THC concentrations a' and b' are unknown quantities, and the measured values of the individual components have not a little error. occurs. Therefore, in this embodiment, the minimum error value is obtained by minimizing the concentration error between the calculated value of the concentration of the specific component and the reference value, and the correlation between the minimum error value and the spectrum is calculated.
- the machine learning unit 62 calculates the minimum H2 error value by minimizing the H2 concentration error between the reference value of the H2 concentration and the calculated value (estimated value) of the H2 concentration calculated from the element balance formula. and a first H2 correlation data generation unit 621a that generates first H2 correlation data indicating the correlation between the minimum H2 error value and the parameter used to calculate the minimum H2 error value ; and a 2H2 correlation data generation unit 621b that calculates the relationship with the minimum value and generates 2H2 correlation data.
- the parameters used for calculating the minimum H 2 error value that minimizes the H 2 concentration error are a′ and b′ representing the THC concentration in the elemental balance formula.
- the H2 error minimum value may be calculated by calculating the minimization problem by adding a, b and/or intake air moisture of the fuel to the parameters.
- the machine learning unit 62 calculates the minimum O2 error value by minimizing the O2 concentration error between the reference value of the O2 concentration and the calculated value (estimated value) of the O2 concentration calculated from the element balance formula.
- a first O2 correlation data generator 622a for generating first O2 correlation data indicating the correlation between the minimum O2 error value and the parameter used to calculate the minimum O2 error value ; and a second O2 correlation data generation unit 622b that machine-learns the relationship with the value to generate the second O2 correlation data.
- the parameters used for calculating the minimum O 2 error that minimizes the O 2 concentration error are the THC concentrations a' and b' in the elemental balance equation.
- the H2 error minimum value may be calculated by calculating the minimization problem by adding a, b and/or intake air moisture of the fuel to the parameters.
- the 1H2 correlation data generated by the 1H2 correlation data generation unit 621a is data indicating the correlation between the "minimum H2 error value" and the "parameter of the element balance formula used to calculate the minimum H2 error value".
- the 2H2 correlation data generated by the 2H2 correlation data generating section 621b is data indicating the correlation between the "spectrum data” and the "minimum H2 error value”.
- the 1H2 correlation data is stored in the 1H2 correlation data storage unit 623a
- the 2H2 correlation data is stored in the 2H2 correlation data storage unit 623b.
- the first O2 correlation data generated by the first O2 correlation data generation unit 622a is the correlation between the "minimum O2 error value" and the "parameter of the element balance formula used to calculate the minimum O2 error value”. data shown.
- the second O2 correlation data generated by the second O2 correlation data generating section 622b is data indicating the correlation between the "spectrum data” and the "minimum O2 error value”.
- the first O2 correlation data is stored in the first O2 correlation data storage unit 624a
- the second O2 correlation data is stored in the second O2 correlation data storage unit 624b.
- the exhaust gas analyzer 100 uses the 1st H2 correlation data and the 2nd H2 correlation data (machine learning model for calculating the H2 concentration) generated by the machine learning device 6 to calculate H2.
- the concentration can be calculated, and the O2 concentration can be calculated using the first O2 correlation data and the second O2 correlation data (machine learning model for calculating O2 concentration).
- the arithmetic processing unit 5 of the exhaust gas analyzer 100 includes an H2 error minimum value calculation unit 52a that calculates the H2 error minimum value from the spectrum data and the second H2 correlation data, and an H2 error minimum value calculation unit and an H2 concentration calculator 52b for calculating the H2 concentration in the exhaust gas from the H2 error minimum value obtained by 52a and the first H2 correlation data.
- the 1H2 correlation data is stored in the 1H2 correlation data storage section 52c
- the 2H2 correlation data is stored in the 2H2 correlation data storage section 52d.
- the arithmetic processing unit 5 includes an O 2 error minimum value calculation unit 53a that calculates the O 2 error minimum value from the spectrum data and the second O 2 correlation data, and an O 2 error value obtained by the O 2 error minimum value calculation unit 53a. and an O2 concentration calculator 53b for calculating the O2 concentration in the exhaust gas from the 2nd error minimum value and the first O2 correlation data.
- the first O2 correlation data is stored in the first O2 correlation data storage section 53c
- the second O2 correlation data is stored in the second O2 correlation data storage section 53d.
- the first H2 correlation data storage unit 52c or the second H2 correlation data storage unit 52d, respectively, of the machine learning device 6 may comprise the first H2 correlation data storage unit 623a or the second H2 correlation data storage unit 623b, respectively, or the first O2 correlation data storage unit 53c or the second O2 correlation data storage unit 53d, respectively. 1st O2 correlation data storage section 624a or 2nd O2 correlation data storage section 624b.
- the teacher data may include the first correlation data indicating the minimum error value obtained by minimizing the error between the reference value of the concentration of the specific component and the calculated value of the concentration of the specific component.
- an information processing device (not shown) that generates the first correlation data is provided separately from the processing device 5, and the processing device 5 machine-learns the relationship between the spectrum data and the minimum error value.
- a second correlation data generator for generating the second correlation data of the minimum error value for the spectrum.
- the teacher data receiving unit 61 obtains from the spectral data, in addition to the H 2 concentration reference value, the O 2 concentration reference value, and the spectral data as the teacher data, It may accept individual component concentrations selected based on an elemental balance equation. Then, in the machine learning unit 62, the H 2 correlation data generation unit 621 machine-learns the relationship between the H 2 concentration reference value, the spectrum data, and the individual component concentration, and calculates the H 2 concentration, the spectrum data, and the individual component concentration.
- Generate H 2 correlation data (machine learning model for calculating H 2 concentration) showing the correlation of Further, the O 2 correlation data generation unit 622 machine-learns the relationship between the reference value of the O 2 concentration, the spectrum data, and the individual component concentration, and the O 2 concentration indicating the correlation between the O 2 concentration, the spectrum data, and the individual component concentration .
- Generate correlation data (machine learning model for O2 concentration calculation). In this way, by including the individual component concentrations selected based on the element balance formula in addition to the spectral data in the teacher data, the measurement accuracy of the O 2 concentration or H 2 concentration can be improved.
- the teacher data receiving unit 61 stores the H 2 concentration reference value obtained by an H 2 analyzer different from the infrared gas analyzer (exhaust gas analyzer) and the infrared gas analyzer
- the teaching data including the reference value of the O 2 concentration obtained by the O 2 analyzer different from the (exhaust gas analyzer) and the individual component concentrations obtained by the infrared gas analyzer (exhaust gas analyzer) are accepted.
- the individual component concentrations included in this teacher data are individual component concentrations such as CO, CO 2 , NO, H 2 O, NO 2 or hydrocarbon components (HC) analyzed by the individual component analysis unit 512 .
- the machine learning unit 62 includes an H 2 correlation data generation unit 621 for generating H 2 correlation data by performing machine learning on the relationship between the reference value of the H 2 concentration and the calculated value (estimated value) of the H 2 concentration, and an O 2 It has an O 2 correlation data generation unit 622 for generating O 2 correlation data by performing machine learning on the relationship between the reference value of concentration and the calculated value (estimated value) of O 2 concentration.
- the calculated value (estimated value) of the H 2 concentration and the calculated value (estimated value) of the O 2 concentration can be estimated using the element balance formula obtained from the fuel combustion formula described above. That is, from the elemental balance formula (conservation law of substance amount), the H 2 concentration can be linearly regressed with the concentrations of the components (CO 2 , CO, H 2 O, THC), and the O 2 concentration can be linearly regressed from the components (CO 2 , CO , H 2 O, THC, NO) can be linearly regressed.
- the H 2 concentration linear regression equation by adding the NO concentration in addition to the concentrations of the components (CO 2 , CO, H 2 O, THC), the measurement accuracy of the H 2 concentration can be improved. .
- the H2 correlation data (machine learning model for calculating H2 concentration) generated by the H2 correlation data generation unit 621 is stored in the H2 correlation data storage unit 623, and the O2 correlation data generation unit 622 generates
- the O 2 correlation data (machine learning model for calculating O 2 concentration) is stored in the O 2 correlation data storage unit 624 .
- the exhaust gas analyzer 100 can calculate the H 2 concentration using the H 2 correlation data (machine learning model for calculating the H 2 concentration) generated by the machine learning device 6, O2 concentration can be calculated using O2 correlation data (machine learning model for calculating O2 concentration).
- the arithmetic processing unit 5 of the exhaust gas analyzer 100 includes an H 2 concentration calculation unit 52 that calculates the H 2 concentration in the combustion exhaust gas from the individual component concentration and the H 2 correlation data, and the individual component concentration and the O 2 correlation data. and an O 2 concentration calculator 53 for calculating the O 2 concentration in the combustion exhaust gas from the data.
- the H2 correlation data storage unit 54 may be configured from the H2 correlation data storage unit 623 of the machine learning device 6.
- the O 2 correlation data storage unit 55 may be configured from the O 2 correlation data storage unit 624 of the machine learning device 6 .
- the H 2 concentration calculation unit calculates a calculated value of the H 2 concentration from the individual component concentrations, and calculates the H 2 concentration in the flue gas from the calculated value and the H 2 correlation data. Further, the O 2 concentration calculation unit calculates a calculated value of O 2 concentration from the individual component concentrations, and calculates the O 2 concentration in the flue gas from the calculated value and the O 2 correlation data.
- the THC concentration used in the above elemental balance formula is considered to be the THC concentration obtained by a THC analyzer different from the infrared gas analyzer (exhaust gas analyzer).
- the exhaust gas analyzer 100 includes a THC correlation data storage unit 56 that stores THC correlation data obtained by learning the relationship between the THC concentration reference value and the spectrum data, and an infrared gas analyzer (spectrum).
- the configuration further includes a THC concentration calculation unit 57 that calculates the THC concentration in the combustion exhaust gas from the spectral data and the THC correlation data obtained by the data generation unit 511), and the THC concentration calculation unit 57 obtains THC concentration may also be used.
- the teacher data receiving unit 61 receives the reference value of the THC concentration obtained by a THC analyzer different from the infrared gas analyzer (exhaust gas analyzer) and the spectrum
- the machine learning unit 62 is configured to have a THC correlation data generation unit 625 that generates THC correlation data by machine learning the relationship between the THC concentration reference value and the spectrum data. Also good.
- the THC correlation data generated by this THC correlation data generation section 625 is stored in the THC correlation data storage section 626 .
- concentrations of individual components used in modified embodiments 1 and 2 above may be concentrations of all components CO 2 , CO, H 2 O, THC and NO, or CO 2 , CO, H 2 O and THC. , NO may be the concentration of some components.
- the 1H2 correlation data generation unit 621a or the 2H2 correlation data generation unit 621b generates individual component concentrations and/or O
- the correlation data may be calculated using the reference values of two densities.
- the first O2 correlation data generation unit 622a or the second O2 correlation data generation unit 622b uses the reference values of the individual component concentrations and/or H2 concentrations in addition to the calculated O2 concentration values obtained from the individual component concentrations. may be configured to calculate the correlation data. By increasing the parameters to be machine-learned in this way, it is possible to improve the measurement accuracy of the H 2 concentration or the O 2 concentration.
- the exhaust gas measurement system of the above embodiment uses the chassis dynamo 300 to test the complete vehicle V.
- an engine dynamometer may be used to test the performance of the engine.
- a dynamometer may be used to test powertrain performance.
- the exhaust gas analyzer 100 may irradiate a measurement sample with light and analyze from the spectrum.
- the exhaust gas analyzer 100 in addition to Fourier transform infrared spectroscopy, for example, NDIR, quantum cascade laser infrared spectroscopy, non-dispersive infrared absorption method, chemiluminescence method (chemiluminescence method), or these A combined method or the like may also be used.
- the present invention is not limited to the analysis of exhaust gases from automobiles, and can also analyze exhaust gases emitted from internal combustion engines such as ships, aircraft, agricultural machinery, and machine tools, power plants, or incinerators.
- the components of exhaust gas contained in the environment may also be analyzed.
- the exhaust gas analyzer may use light other than infrared light.
- the H 2 concentration or O 2 concentration which had to be measured using another analyzer, can be measured in the analyzer.
Abstract
A machine learning device 6 which is to be used in an exhaust gas analysis device which irradiates exhaust gas with light and detects the light which has passed through the exhaust gas, and analyzes the exhaust gas on the basis of the detection signal thereof, said machine learning device 6 being equipped with: a training data receiving unit 61 for receiving training data which includes a reference value of a specific component concentration, which is the H2 concentration and/or the O2 concentration obtained by an analyzer which is different than the exhaust gas analysis device, and also includes at least one of the spectrum data obtained by irradiating the exhaust gas with light, an individual component concentration which is selected on the basis of an elemental balance equation for obtaining the specific component concentration, and a calculated value of the specific component concentration which is calculated via the elemental balance equation by using the individual component concentration; and a machine learning unit 62 which, by using the training data, causes machine learning for the relationship between the reference value of the specific component concentration and the spectrum data, the individual component concentration or the calculated value of the specific component concentration.
Description
本発明は、機械学習装置、排ガス分析装置、機械学習方法、排ガス分析方法、機械学習プログラム、及び、排ガス分析プログラムに関するものである。
The present invention relates to a machine learning device, an exhaust gas analyzer, a machine learning method, an exhaust gas analysis method, a machine learning program, and an exhaust gas analysis program.
従来、排ガス中に含まれる成分を分析するものとしては、特許文献1に示すように、フーリエ変換型赤外分光法(FTIR)を用いたFTIR分析計が用いられている。このFTIR分析計により、排ガス中のCO、CO2、NO、H2O、NO2、C2H5OH、HCHO、又はCH4等の多成分を同時に分析することができる。
Conventionally, an FTIR analyzer using Fourier transform infrared spectroscopy (FTIR) has been used to analyze components contained in exhaust gas, as shown in Patent Document 1. With this FTIR analyzer, multiple components such as CO, CO2 , NO, H2O , NO2 , C2H5OH , HCHO or CH4 in exhaust gas can be analyzed simultaneously.
しかしながら、FTIR分析計では、赤外線を吸収する成分を分析することはできるものの、赤外線を吸収しない成分を分析することができない。そのため、赤外線を吸収しないH2の濃度を測定する場合には、FTIR分析計とは別に、例えば熱伝導式ガス分析計(TCD)等の専用のH2分析計が必要となる。また、赤外線を吸収しないO2の濃度を測定する場合には、FTIR分析計とは別に、例えばジルコニア式センサ等の専用のO2分析計が必要となってしまう。その結果、FTIR分析計とH2分析計又はO2分析計との両方の設置スペースが必要となってしまい、排ガス分析装置が大型化してしまう。このような問題は、FTIR分析計だけでなく、光を用いた他の排ガス分析装置にも同様に生じ得る。
However, although the FTIR spectrometer can analyze components that absorb infrared rays, it cannot analyze components that do not absorb infrared rays. Therefore, when measuring the concentration of H 2 that does not absorb infrared rays, a dedicated H 2 analyzer such as a thermal conductivity gas analyzer (TCD) is required in addition to the FTIR analyzer. Moreover, when measuring the concentration of O 2 that does not absorb infrared rays, a dedicated O 2 analyzer such as a zirconia sensor is required in addition to the FTIR analyzer. As a result, installation space for both the FTIR analyzer and the H 2 analyzer or O 2 analyzer is required, resulting in an increase in the size of the exhaust gas analyzer. Such problems can occur not only in FTIR analyzers but also in other exhaust gas analyzers using light.
そこで、本発明は上述したような問題に鑑みてなされたものであり、排ガス分析装置において他の分析計を用いて測定する必要があったH2濃度又はO2濃度を測定できるようにすることをその主たる課題とするものである。
Therefore, the present invention has been made in view of the above-described problems, and provides an exhaust gas analyzer capable of measuring H 2 concentration or O 2 concentration, which had to be measured using another analyzer. is the main subject.
すなわち、本発明に係る機械学習装置は、燃焼排ガスに光を照射して前記燃焼排ガスを透過した光を検出し、その検出信号に基づいて前記燃焼排ガスを分析する排ガス分析装置に用いられる機械学習装置であって、教師データを受け付ける教師データ受付部と、前記教師データを用いて機械学習する機械学習部とを備え、前記教師データ受付部は、前記排ガス分析装置とは異なる分析計により得られたH2濃度又はO2濃度の少なくとも1つである特定成分濃度の基準値と、前記燃焼排ガスに光を照射して得られたスペクトルデータ、前記特定成分濃度を求めるための元素バランス式に基づいて選択された個別成分濃度、又は、前記元素バランス式に前記個別成分濃度を用いて演算された特定成分濃度の演算値の少なくとも1つと、を含む教師データを受け付けるものであり、前記機械学習部は、前記特定成分濃度の基準値と、前記スペクトルデータ、前記個別成分濃度、又は、前記特定成分濃度の演算値の少なくとも1つとの関係を機械学習して特定成分相関データを生成するものであることを特徴とする。
That is, the machine learning device according to the present invention is a machine learning device used in an exhaust gas analyzer that irradiates a combustion exhaust gas with light, detects the light transmitted through the combustion exhaust gas, and analyzes the combustion exhaust gas based on the detection signal. An apparatus comprising a training data reception unit that receives training data and a machine learning unit that performs machine learning using the training data, wherein the training data reception unit is obtained by an analyzer different from the exhaust gas analyzer. Based on the reference value of the specific component concentration which is at least one of the H 2 concentration or O 2 concentration, the spectral data obtained by irradiating the combustion exhaust gas with light, and the element balance formula for obtaining the specific component concentration or at least one of the calculated values of the specific component concentration calculated using the individual component concentration in the element balance formula, and the machine learning unit generates specific component correlation data by machine-learning the relationship between the reference value of the specific component concentration and at least one of the spectral data, the individual component concentration, or the calculated value of the specific component concentration. It is characterized by
このような構成であれば、H2濃度又はO2濃度の少なくとも1つである特定成分濃度の基準値と、燃焼排ガスに光を照射して得られたスペクトルデータ、特定成分濃度を求めるための元素バランス式に基づいて選択された個別成分濃度、又は、元素バランス式に前記個別成分濃度を用いて演算された特定成分濃度の演算値の少なくとも1つとの関係を機械学習することにより、当該機械学習により生成された機械学習モデルを用いて、燃焼排ガスに光を照射して得られたスペクトルデータ、排ガス分析装置により得られた個別成分濃度、又は、個別成分濃度及び元素バランス式から演算された特定成分濃度の演算値の少なくとも1つから、特定成分濃度を算出できるようになる。その結果、排ガス分析装置において他の分析計を用いて測定する必要があったH2濃度又はO2濃度を測定できる。特に赤外光を用いた排ガス分析において、赤外光を吸収しないH2濃度又はO2濃度を測定することができる。
With such a configuration, the reference value of the specific component concentration that is at least one of the H 2 concentration or the O 2 concentration, the spectrum data obtained by irradiating the combustion exhaust gas with light, and the specific component concentration By machine learning the relationship between at least one of the individual component concentration selected based on the element balance formula or the calculated value of the specific component concentration calculated using the individual component concentration in the element balance formula, the machine Using a machine learning model generated by learning, spectrum data obtained by irradiating light on combustion exhaust gas, individual component concentration obtained by exhaust gas analyzer, or calculated from individual component concentration and element balance formula The specific component concentration can be calculated from at least one of the calculated values of the specific component concentration. As a result, the H 2 concentration or O 2 concentration, which had to be measured using another analyzer in the exhaust gas analyzer, can be measured. Particularly in exhaust gas analysis using infrared light, the H 2 concentration or O 2 concentration that does not absorb infrared light can be measured.
また、本発明の機械学習装置において、前記教師データ受付部は、前記特定成分濃度の基準値と、前記スペクトルデータとを含む教師データを受け付けるものであり、前記機械学習部は、前記特定成分濃度の基準値と、前記スペクトルデータとの関係を機械学習して前記特定成分相関データを生成するものであることが望ましい。
Further, in the machine learning device of the present invention, the teacher data receiving unit receives teacher data including the reference value of the specific component concentration and the spectrum data, and the machine learning unit receives the specific component concentration It is preferable that machine learning is performed on the relationship between the reference value of and the spectrum data to generate the specific component correlation data.
さらに、H2濃度又はO2濃度を精度良く測定できるようにするためには、前記教師データ受付部は、さらに前記個別成分濃度を教師データとして受けるものであり、前記機械学習部は、前記特定成分濃度の基準値と、前記スペクトルデータと、前記個別成分濃度との関係を機械学習して記特定成分相関データを生成するものであることが望ましい。
Furthermore, in order to accurately measure the H 2 concentration or the O 2 concentration, the teacher data receiving unit further receives the individual component concentration as teacher data, and the machine learning unit receives the specific It is preferable that the specific component correlation data be generated by machine learning of the relationship between the component concentration reference value, the spectrum data, and the individual component concentration.
特定成分濃度の基準値、特定成分濃度の演算値及びスペクトルデータを用いた機械学習の具体的な実施の態様としては、前記特定成分濃度の基準値と前記特定成分濃度の演算値との誤差を最小化した誤差最小値を算出して、前記誤差最小値と、前記誤差最小値の算出に用いたパラメータとの相関を示す第1相関データを前記特定成分相関データの一部として生成する第1相関データ生成部と、前記スペクトルデータと前記誤差最小値との関係を機械学習して、前記スペクトルデータと前記誤差最小値との相関を示す第2相関データを前記特定成分相関データの一部として生成する第2相関データ生成部とを有することが望ましい。
As a specific embodiment of machine learning using the reference value of the specific component concentration, the calculated value of the specific component concentration, and the spectrum data, the error between the reference value of the specific component concentration and the calculated value of the specific component concentration is calculated. calculating the minimized error minimum value and generating, as part of the specific component correlation data, first correlation data indicating the correlation between the minimum error value and a parameter used to calculate the minimum error value; A correlation data generation unit machine-learns the relationship between the spectral data and the minimum error value, and generates second correlation data indicating the correlation between the spectral data and the minimum error value as part of the specific component correlation data. It is desirable to have a second correlation data generator that generates the second correlation data generator.
また、本発明の機械学習装置において、前記教師データ受付部は、前記特定成分濃度の基準値と、前記個別成分濃度とを含む教師データを受け付けるものであり、前記機械学習部は、前記特定成分濃度の基準値と、前記個別成分濃度との関係を機械学習して前記特定成分相関データを生成するものであることが望ましい。
Further, in the machine learning device of the present invention, the teacher data receiving unit receives teacher data including the reference value of the concentration of the specific component and the concentration of the individual component, and the machine learning unit receives the specific component It is preferable that the specific component correlation data be generated by machine learning the relationship between the concentration reference value and the individual component concentration.
前記特定成分相関データとしてH2相関データを機械学習する場合には、前記個別成分濃度は、CO2濃度、CO濃度、H2O濃度、又はTHC濃度の少なくとも1つとすることが考えられる。また、前記特定成分相関データとしてO2相関データを機械学習する場合には、前記個別成分濃度は、CO2濃度、CO濃度、H2O濃度、THC濃度、又はNO濃度の少なくとも1つとすることが考えられる。
When machine-learning H 2 correlation data as the specific component correlation data, the individual component concentration may be at least one of CO 2 concentration, CO concentration, H 2 O concentration, or THC concentration. Further, when machine learning is performed on O 2 correlation data as the specific component correlation data, the individual component concentration is at least one of CO 2 concentration, CO concentration, H 2 O concentration, THC concentration, or NO concentration. can be considered.
また、従来の排ガス分析装置により全炭化水素(THC)を測定する場合には、スペクトルデータから各炭化水素(HC)の濃度をそれぞれ個別に求め、次にそれ等を重みづけして足し合わせるという2段階の演算を行っており、各HCの濃度測定で生じ得る誤差に、重みづけ係数の設定において生じ得る誤差が重畳されるので、測定精度を向上させることが難しい。
排ガス分析装置においてTHC濃度の測定精度を向上させるためには、前記教師データ受付部は、前記排ガス分析装置とは異なる分析計により得られたTHC濃度の基準値と、前記スペクトルデータと含む教師データを受け付けるものであり、前記機械学習部は、前記THC濃度の基準値と前記スペクトルデータとの関係を機械学習してTHC相関データを生成することが望ましい。 In addition, when measuring total hydrocarbons (THC) with a conventional exhaust gas analyzer, the concentration of each hydrocarbon (HC) is obtained individually from the spectral data, and then weighted and added together. A two-stage calculation is performed, and an error that may occur in setting the weighting coefficient is superimposed on an error that may occur in the concentration measurement of each HC. Therefore, it is difficult to improve the measurement accuracy.
In order to improve the measurement accuracy of the THC concentration in the exhaust gas analyzer, the teacher data reception unit receives teacher data including the reference value of the THC concentration obtained by an analyzer different from the exhaust gas analyzer and the spectrum data. It is preferable that the machine learning unit machine-learns the relationship between the THC concentration reference value and the spectrum data to generate THC correlation data.
ここで、前記個別成分濃度は、THC濃度を含むものであり、当該THC濃度は、前記排ガス分析装置により得られたスペクトルデータと前記THC相関データとから求められたものであることが望ましい。
Here, the individual component concentration includes the THC concentration, and it is desirable that the THC concentration be obtained from the spectral data obtained by the exhaust gas analyzer and the THC correlation data.
また、本発明に係る排ガス分析装置は、燃焼排ガスを分析する排ガス分析装置であって、前記燃焼排ガスに光を照射する光源と、前記燃焼排ガスを透過した光を検出する光検出器と、前記燃焼排ガス中のH2濃度又はO2濃度の少なくとも1つである特定成分濃度と、前記燃焼排ガスに光を照射して得られたスペクトルデータ、前記特定成分濃度を求めるための元素バランス式に基づいて選択される個別成分濃度、又は、前記元素バランス式に前記個別成分濃度を用いて演算された特定成分濃度の演算値の少なくとも1つとの関係を学習した特定成分相関データを格納する特定成分相関データ格納部と、前記スペクトルデータ、前記個別成分濃度、又は、前記特定成分濃度の演算値の少なくとも1つと、前記特定成分相関データとから、前記燃焼排ガス中の特定成分濃度を算出する特定成分濃度算出部とを備えることを特徴とする。
Further, an exhaust gas analyzer according to the present invention is an exhaust gas analyzer for analyzing combustion exhaust gas, comprising: a light source for irradiating the combustion exhaust gas with light; a photodetector for detecting light transmitted through the combustion exhaust gas; Specific component concentration which is at least one of H 2 concentration or O 2 concentration in combustion exhaust gas, spectrum data obtained by irradiating the combustion exhaust gas with light, element balance formula for obtaining the specific component concentration Specific component correlation storing specific component correlation data obtained by learning a relationship between at least one of the individual component concentration selected by the method and the calculated value of the specific component concentration calculated using the individual component concentration in the element balance formula Specific component concentration for calculating the specific component concentration in the flue gas from a data storage unit, at least one of the spectrum data, the individual component concentration, or the calculated value of the specific component concentration, and the specific component correlation data. and a calculator.
このような構成であれば、燃焼排ガス中のH2濃度又はO2濃度の少なくとも1つである特定成分濃度と、燃焼排ガスに光を照射して得られたスペクトルデータ、特定成分濃度を求めるための元素バランス式に基づいて選択された個別成分濃度、又は元素バランス式に個別成分濃度を用いて演算された特定成分濃度の演算値の少なくとも1つとの関係を学習した特定成分相関データ(機械学習モデル)を用いて、燃焼排ガスに光を照射して得られたスペクトルデータ、排ガス分析装置により得られた個別成分濃度、又は、個別成分濃度及び元素バランス式から演算された特定成分濃度の演算値の少なくとも1つから、特定成分濃度を算出できるようになる。その結果、分析装置において他の分析計を用いて測定する必要があったH2濃度又はO2濃度を測定できる。特に、赤外光を用いた排ガス分析において、赤外光を吸収しないH2濃度又はO2濃度を測定することができる。
With such a configuration, the specific component concentration, which is at least one of the H 2 concentration or O 2 concentration in the combustion exhaust gas, the spectrum data obtained by irradiating the combustion exhaust gas with light, and the specific component concentration are obtained. Specific component correlation data (machine learning Spectral data obtained by irradiating the combustion exhaust gas with light using a model), individual component concentrations obtained by an exhaust gas analyzer, or calculated values of specific component concentrations calculated from individual component concentrations and elemental balance equations From at least one of, the specific component concentration can be calculated. As a result, the H 2 concentration or O 2 concentration that would otherwise have to be measured using another analyzer can be measured in the analyzer. In particular, in exhaust gas analysis using infrared light, the H 2 concentration or O 2 concentration that does not absorb infrared light can be measured.
また、本発明の排ガス分析装置は、排ガス分析装置とは異なる分析計により得られたTHC濃度の基準値と前記スペクトルデータとの関係を学習したTHC相関データを格納するTHC相関データ格納部と、燃焼排ガスに光を照射して得られたスペクトルデータと前記THC相関データとから、前記燃焼排ガス中のTHC濃度を算出するTHC濃度算出部とをさらに備えることが望ましい。この構成であれば、燃焼排ガス中のTHC濃度を精度良く測定することができる。
The exhaust gas analyzer of the present invention further includes a THC correlation data storage unit for storing THC correlation data obtained by learning the relationship between the THC concentration reference value obtained by an analyzer different from the exhaust gas analyzer and the spectrum data, It is desirable to further include a THC concentration calculation section for calculating the THC concentration in the combustion exhaust gas from the spectral data obtained by irradiating the combustion exhaust gas with light and the THC correlation data. With this configuration, the THC concentration in the combustion exhaust gas can be measured with high accuracy.
また、前記個別成分濃度は、THC濃度を含むものであり、当該THC濃度は、前記THC濃度算出部により算出されたものであることが望ましい。この構成であれば、THC濃度を用いてH2濃度又はO2濃度を測定する場合に、H2濃度又はO2濃度を精度良く測定することができる。
Further, it is preferable that the individual component concentration includes the THC concentration, and the THC concentration is calculated by the THC concentration calculating section. With this configuration, when the H 2 concentration or the O 2 concentration is measured using the THC concentration, the H 2 concentration or the O 2 concentration can be measured with high accuracy.
特定成分濃度の基準値、特定成分濃度の演算値及びスペクトルデータを用いてH2濃度又はO2濃度を測定する具体的な実施の態様としては、前記学習済モデル格納部は、前記特定成分濃度の基準値と前記特定成分濃度の演算値との誤差最小値と、前記誤差最小値の算出に用いたパラメータとの相関を示す第1相関データを格納する第1相関データ格納部と、前記スペクトルデータと前記誤差最小値との相関を示す第2相関データを格納する第2相関データ格納部とを有し、前記特定成分濃度算出部は、前記スペクトルデータと前記第2相関データとから、前記誤差最小値を算出する誤差最小値算出部と、前記誤差最小値算出部により得られた前記誤差最小値と前記第1相関データとから、前記燃焼排ガス中の特定成分濃度を算出することが望ましい。
As a specific embodiment for measuring the H 2 concentration or the O 2 concentration using the reference value of the specific component concentration, the calculated value of the specific component concentration, and the spectrum data, the learned model storage unit stores the specific component concentration a first correlation data storage unit for storing first correlation data indicating the correlation between the minimum error value between the reference value of and the calculated value of the concentration of the specific component and the parameter used to calculate the minimum error value; a second correlation data storage unit that stores second correlation data indicating the correlation between the data and the minimum error value, and the specific component concentration calculation unit calculates the It is desirable to calculate the specific component concentration in the combustion exhaust gas from a minimum error value calculating section for calculating the minimum error value, and the minimum error value obtained by the minimum error value calculating section and the first correlation data. .
本発明の効果が顕著に奏される具体的態様としては、前記燃焼排ガスが自動車の排ガスであるものを挙げることができる、また、前記した排ガス分析装置は、フーリエ変換型赤外分光法を用いた、所謂FTIR方式のものであることが好ましい。
As a specific embodiment in which the effect of the present invention is remarkably exhibited, the combustion exhaust gas may be exhaust gas from an automobile. A so-called FTIR method is preferable.
さらに、本発明に係る機械学習方法は、燃焼排ガスに光を照射して前記燃焼排ガスを透過した光を検出し、その検出信号に基づいて前記燃焼排ガスを分析する排ガス分析装置に用いられる機械学習方法であって、教師データを受け付ける教師データ受付ステップと、前記教師データを用いて機械学習する機械学習ステップとを備え、前記教師データ受付ステップは、前記排ガス分析装置とは異なる分析計により得られたH2濃度又はO2濃度の少なくとも1つである特定成分濃度の基準値と、前記燃焼排ガスに光を照射して得られたスペクトルデータ、又は前記特定成分濃度を求めるための元素バランス式に基づいて選択された個別成分濃度、又は、前記元素バランス式に前記個別成分濃度を用いて演算された特定成分濃度の演算値の少なくとも1つと、を含む教師データを受け付け、前記機械学習ステップは、前記特定成分濃度の基準値と、前記スペクトルデータ、前記個別成分濃度、又は、前記特定成分濃度の演算値の少なくとも1つとの関係を機械学習して特定成分相関データを生成することを特徴とする。
Furthermore, the machine learning method according to the present invention is a machine learning method used in an exhaust gas analyzer that irradiates light on combustion exhaust gas, detects light that has passed through the combustion exhaust gas, and analyzes the combustion exhaust gas based on the detection signal. A method comprising a teacher data receiving step of receiving teacher data and a machine learning step of performing machine learning using the teacher data, wherein the teacher data receiving step is obtained by an analyzer different from the exhaust gas analyzer. A reference value for the specific component concentration, which is at least one of H 2 concentration or O 2 concentration, spectral data obtained by irradiating the combustion exhaust gas with light, or an element balance formula for obtaining the specific component concentration receiving teacher data containing at least one of the individual component concentrations selected based on the element balance formula or the calculated value of the specific component concentration calculated using the individual component concentrations in the element balance formula, and the machine learning step, The specific component correlation data is generated by machine-learning a relationship between the reference value of the specific component concentration and at least one of the spectral data, the individual component concentration, or the calculated value of the specific component concentration. .
その上、本発明に係る機械学習プログラムは、燃焼排ガスに光を照射して前記燃焼排ガスを透過した光を検出し、その検出信号に基づいて前記燃焼排ガスを分析する排ガス分析装置に用いられる機械学習プログラムであって、教師データを受け付ける教師データ受付部としての機能と、前記教師データを用いて機械学習する機械学習部としての機能とをコンピュータに備えさせ、前記教師データ受付部は、前記排ガス分析装置とは異なる分析計により得られたH2濃度又はO2濃度の少なくとも1つである特定成分濃度の基準値と、前記燃焼排ガスに光を照射して得られたスペクトルデータ、又は前記特定成分濃度を求めるための元素バランス式に基づいて選択された個別成分濃度、又は、前記元素バランス式に前記個別成分濃度を用いて演算された特定成分濃度の演算値の少なくとも1つと、を含む教師データを受け付けるものであり、前記機械学習部は、前記特定成分濃度の基準値と、前記スペクトルデータ、前記個別成分濃度、又は、前記特定成分濃度の演算値の少なくとも1つとの関係を機械学習して特定成分相関データを生成するものであることを特徴とする。
In addition, the machine learning program according to the present invention is a machine used in an exhaust gas analyzer that irradiates light on combustion exhaust gas, detects light that has passed through the combustion exhaust gas, and analyzes the combustion exhaust gas based on the detection signal. A learning program, wherein a computer is provided with a function as a training data reception unit that receives training data and a function as a machine learning unit that performs machine learning using the training data, and the training data reception unit receives the exhaust gas A reference value for the specific component concentration, which is at least one of H 2 concentration or O 2 concentration, obtained by an analyzer different from the analysis device, spectral data obtained by irradiating the combustion exhaust gas with light, or the specific A teacher containing at least one of individual component concentrations selected based on an element balance formula for obtaining component concentrations, or a calculated value of a specific component concentration calculated using the individual component concentrations in the element balance formula The machine learning unit machine-learns the relationship between the reference value of the concentration of the specific component and at least one of the spectral data, the concentration of the individual component, or the calculated value of the concentration of the specific component. It is characterized in that the specific component correlation data is generated by
その上、本発明に係る排ガス分析方法は、燃焼排ガスに光を照射する光源と、前記燃焼排ガスを透過した光を検出する光検出器とを用いて燃焼排ガスを分析する排ガス分析方法であって、前記燃焼排ガス中のH2濃度又はO2濃度の少なくとも1つである特定成分濃度と、前記燃焼排ガスに光を照射して得られたスペクトルデータ、又は前記特定成分濃度を求めるための元素バランス式に基づいて選択された個別成分濃度、又は、前記元素バランス式に前記個別成分濃度を用いて演算された特定成分濃度の演算値の少なくとも1つとの関係を学習した特定成分相関データを用いて、前記スペクトルデータ、前記個別成分濃度、又は前記特定成分濃度の演算値の少なくとも1つと、前記特定成分相関データとから、前記燃焼排ガス中の特定成分濃度を算出することを特徴とする。
Furthermore, the exhaust gas analysis method according to the present invention is a method for analyzing combustion exhaust gas using a light source for irradiating the combustion exhaust gas with light and a photodetector for detecting light transmitted through the combustion exhaust gas. , a specific component concentration that is at least one of H 2 concentration or O 2 concentration in the flue gas, spectrum data obtained by irradiating the flue gas with light, or an element balance for obtaining the specific component concentration Using specific component correlation data obtained by learning a relationship between at least one of individual component concentrations selected based on the formula and calculated values of specific component concentrations calculated using the individual component concentrations in the element balance formula , the specific component concentration in the flue gas is calculated from at least one of the spectrum data, the individual component concentration, or the calculated value of the specific component concentration, and the specific component correlation data.
さらに加えて、本発明に係る排ガス分析プログラムは、燃焼排ガスに光を照射する光源と、前記燃焼排ガスを透過した光を検出する光検出器とを用いた排ガス分析装置に用いられる排ガス分析プログラムであって、前記燃焼排ガス中のH2濃度又はO2濃度の少なくとも1つである特定成分濃度と、前記燃焼排ガスに光を照射して得られたスペクトルデータ、又は前記特定成分濃度を求めるための元素バランス式に基づいて選択された個別成分濃度、又は、前記元素バランス式に前記個別成分濃度を用いて演算された特定成分濃度の演算値の少なくとも1つとの関係を学習した特定成分相関データを格納する特定成分相関データ格納部としての機能と、前記スペクトルデータ、前記個別成分濃度、又は前記特定成分濃度の演算値の少なくとも1つと、前記特定成分相関データとから、前記燃焼排ガス中の特定成分濃度を算出する特定成分濃度算出部としての機能とをコンピュータに備えさせることを特徴とする。
In addition, an exhaust gas analysis program according to the present invention is an exhaust gas analysis program used in an exhaust gas analyzer using a light source for irradiating light on combustion exhaust gas and a photodetector for detecting light transmitted through the combustion exhaust gas. A specific component concentration that is at least one of H 2 concentration or O 2 concentration in the flue gas, spectral data obtained by irradiating the flue gas with light, or obtaining the specific component concentration Specific component correlation data obtained by learning a relationship between at least one of individual component concentrations selected based on an element balance formula, or a calculated value of a specific component concentration calculated using the individual component concentrations in the element balance formula. function as a specific component correlation data storage unit for storing, at least one of the spectrum data, the individual component concentration, or the calculated value of the specific component concentration, and the specific component correlation data, the specific component in the combustion exhaust gas The computer is provided with a function as a specific component concentration calculation unit that calculates the concentration.
以上に述べた本発明によれば、排ガス分析装置において他の分析計を用いて測定する必要があったH2濃度又はO2濃度を測定できるようになる。
According to the present invention described above, it becomes possible to measure the H 2 concentration or the O 2 concentration that had to be measured using another analyzer in the exhaust gas analyzer.
以下に本発明の一実施形態に係る排ガス分析装置について図面を参照して説明する。なお、以下に示すいずれの図についても、わかりやすくするために、適宜省略し又は誇張して模式的に描かれている。同一の構成要素については、同一の符号を付して説明を適宜省略する。
An exhaust gas analyzer according to one embodiment of the present invention will be described below with reference to the drawings. It should be noted that all of the drawings shown below are schematically drawn with appropriate omissions or exaggerations for the sake of clarity. The same constituent elements are denoted by the same reference numerals, and descriptions thereof are omitted as appropriate.
本実施形態の排ガス分析装置100は、例えば排ガス測定システム200の一部を構成するものである。この排ガス測定システム200は、図1に示すように、シャシダイナモ300と、シャシダイナモ300上を走行する供試体である自動車Vの燃焼排ガス(以下、単に「排ガス」という。)をサンプリングする排ガス採取装置400と、サンプリングされた排ガス中の測定対象成分を分析する分析装置100とを備えている。
The exhaust gas analyzer 100 of this embodiment constitutes a part of the exhaust gas measurement system 200, for example. As shown in FIG. 1, this exhaust gas measurement system 200 includes a chassis dynamo 300 and exhaust gas sampling for sampling combustion exhaust gas (hereinafter simply referred to as "exhaust gas") of a vehicle V, which is a test vehicle running on the chassis dynamo 300. It comprises an apparatus 400 and an analysis apparatus 100 that analyzes the measurement target component in the sampled exhaust gas.
<排ガス分析装置100の基本構成>
具体的に排ガス分析装置100は、図2に示すように、赤外光源1、干渉計(分光部)2、測定セル3、光検出器4及び演算処理装置5等を具備した、フーリエ変換型赤外分光法(FTIR)を用いた赤外ガス分析計である。 <Basic Configuration ofExhaust Gas Analyzer 100>
Specifically, as shown in FIG. 2, theexhaust gas analyzer 100 is equipped with an infrared light source 1, an interferometer (spectroscopic unit) 2, a measurement cell 3, a photodetector 4, an arithmetic processing unit 5, and the like. It is an infrared gas analyzer using infrared spectroscopy (FTIR).
具体的に排ガス分析装置100は、図2に示すように、赤外光源1、干渉計(分光部)2、測定セル3、光検出器4及び演算処理装置5等を具備した、フーリエ変換型赤外分光法(FTIR)を用いた赤外ガス分析計である。 <Basic Configuration of
Specifically, as shown in FIG. 2, the
赤外光源1は、ブロードなスペクトルを有する赤外光(多数の波数の光を含む連続光)を射出するものであり、例えばタングステン・ヨウ素ランプ、又は高輝度セラミック光源が用いられる。
The infrared light source 1 emits infrared light having a broad spectrum (continuous light including light of many wavenumbers), and uses, for example, a tungsten/iodine lamp or a high-brightness ceramic light source.
干渉計2は、同図に示すように、1枚のハーフミラー(ビームスプリッタ)21、固定鏡22及び移動鏡23を具備した、いわゆるマイケルソン干渉計を利用したものである。この干渉計2に入射した赤外光源1からの光は、ハーフミラー21によって反射光と透過光に分割される。一方の光は固定鏡22で反射され、もう一方は移動鏡23で反射されて、再びハーフミラー21に戻り、合成されて、この干渉計2から射出される。
The interferometer 2 uses a so-called Michelson interferometer, which includes a half mirror (beam splitter) 21, a fixed mirror 22 and a movable mirror 23, as shown in the figure. Light from the infrared light source 1 incident on the interferometer 2 is split by a half mirror 21 into reflected light and transmitted light. One light is reflected by the fixed mirror 22 , the other is reflected by the movable mirror 23 , returns to the half mirror 21 again, is synthesized, and exits from the interferometer 2 .
測定セル3は、サンプリングされた排ガスが導入される透明セルであり、干渉計2から出た光が、測定セル3内の排ガスを透過して光検出器4に導かれるようにしてある。
The measurement cell 3 is a transparent cell into which the sampled exhaust gas is introduced.
光検出器4は、排ガスを透過した赤外光を検出して、その検出信号(光強度信号)を演算処理装置5に出力するものである。本実施形態の光検出器4は、例えばMCT(HgCdTe)検出器であるが、その他の赤外線検出素子を有する光検出器であっても良い。
The photodetector 4 detects infrared light that has passed through the exhaust gas and outputs the detection signal (light intensity signal) to the arithmetic processing device 5 . The photodetector 4 of this embodiment is, for example, an MCT (HgCdTe) detector, but may be a photodetector having other infrared detection elements.
演算処理装置5は、例えばバッファ、増幅器などを有したアナログ電気回路と、CPU、メモリ、又はDSPなどを有したデジタル電気回路と、それらの間に介在するA/Dコンバータとを有したものである。
The arithmetic processing unit 5 has, for example, an analog electric circuit having a buffer, an amplifier, etc., a digital electric circuit having a CPU, a memory, a DSP, etc., and an A/D converter interposed therebetween. be.
演算処理装置5は、メモリに格納した所定プログラムにしたがってCPUやその周辺機器が協動することにより、図3に示すように、主分析部51としての機能を発揮する。
The arithmetic processing unit 5 functions as a main analysis unit 51 as shown in FIG.
主分析部51は、排ガスを透過した光のスペクトルを示す透過光スペクトルデータを光検出器4の検出信号(光強度信号)から算出し、透過光スペクトルデータから赤外吸光スペクトルデータを算出して、排ガス中の種々の成分を特定し、かつそれぞれの成分の濃度を算出するものである。
The main analysis unit 51 calculates transmitted light spectrum data representing the spectrum of light transmitted through the exhaust gas from the detection signal (light intensity signal) of the photodetector 4, and calculates infrared absorption spectrum data from the transmitted light spectrum data. , to identify various components in the exhaust gas and to calculate the concentration of each component.
この主分析部51は、スペクトルデータ生成部511と、個別成分分析部512とを具備している。
The main analysis unit 51 includes a spectral data generation unit 511 and an individual component analysis unit 512.
移動鏡23を進退させ、排ガスを透過した光強度を移動鏡23の位置を横軸にとって観測すると、単波数の光の場合、干渉によって光強度はサインカーブを描く。一方、排ガスを透過した実際の光は連続光であるから、前記サインカーブは波数毎に異なり、実際の光強度は、各波数の描くサインカーブの重ね合わせとなり、干渉パターン(インターフェログラム)は波束の形となる。
When the movable mirror 23 is advanced and retreated and the intensity of the light transmitted through the exhaust gas is observed with the position of the movable mirror 23 as the horizontal axis, in the case of light with a single wave number, the light intensity draws a sine curve due to interference. On the other hand, since the actual light that has passed through the exhaust gas is continuous light, the sine curve differs for each wavenumber, and the actual light intensity is a superposition of the sine curves drawn by each wavenumber, and the interference pattern (interferogram) is form a wave packet.
スペクトルデータ生成部511は、移動鏡23の位置を例えば図示しないHeNeレーザなどの測距計(図示しない)によって求めるとともに、移動鏡23の各位置における光強度を光検出器4によって求め、これらから得られる干渉パターンを高速フーリエ変換(FFT)することによって、各波数成分を横軸とした透過光スペクトルデータに変換する。そして、例えば測定セル3が空の状態で予め測定しておいた透過光スペクトルデータに基づいて、排ガスの透過光スペクトルデータを吸光スペクトルデータにさらに変換する。
The spectrum data generation unit 511 obtains the position of the movable mirror 23 by a rangefinder (not shown) such as a HeNe laser (not shown), and obtains the light intensity at each position of the movable mirror 23 by the photodetector 4. Fast Fourier transform (FFT) is applied to the obtained interference pattern to convert it into transmitted light spectrum data with each wave number component as the horizontal axis. Then, the transmitted light spectrum data of the exhaust gas is further converted into absorption spectrum data based on the transmitted light spectrum data previously measured with the measurement cell 3 empty, for example.
個別成分分析部512は、例えば吸光スペクトルデータの各ピーク位置(波数)及びその高さから排ガスに含まれる種々の成分(例えば、CO、CO2、NO、H2O、NO2、又は炭化水素成分(HC)等)を特定し、かつそれぞれの成分の濃度を算出し、これを個別成分濃度データとして出力する。
For example, the individual component analysis unit 512 determines various components (eg, CO, CO 2 , NO, H 2 O, NO 2 , or hydrocarbon component (HC), etc.) is specified, the concentration of each component is calculated, and this is output as individual component concentration data.
<機械学習装置6>
次に、上記の排ガス分析装置100を用いて排ガス中のH2濃度又はO2濃度を測定できるようにするための機械学習装置6について説明する。 <Machine learning device 6>
Next, themachine learning device 6 for measuring the H 2 concentration or the O 2 concentration in the exhaust gas using the exhaust gas analyzer 100 will be described.
次に、上記の排ガス分析装置100を用いて排ガス中のH2濃度又はO2濃度を測定できるようにするための機械学習装置6について説明する。 <
Next, the
本実施形態の機械学習装置6は、以下に示す燃料の燃焼式から求まる元素バランス式を用いてH2濃度及びO2濃度を推定できることを利用して機械学習するものである。以下の元素バランス式(物質量の保存則)から、H2濃度は、成分(CO2、CO、H2O、THC)の濃度で線形回帰でき、O2濃度は、成分(CO2、CO、H2O、THC、NO)の濃度で線形回帰できることを利用する。また、H2濃度及びO2濃度は、個別成分濃度から推定できることから、それら個別成分濃度を求めるためのスペクトルデータからも推定することができる。
The machine learning device 6 of the present embodiment performs machine learning by utilizing the fact that the H 2 concentration and the O 2 concentration can be estimated using the element balance formula obtained from the fuel combustion formula shown below. From the following elemental balance formula (conservation law of substance amount), the H2 concentration can be linearly regressed with the concentrations of the components ( CO2 , CO, H2O , THC), and the O2 concentration can be linearly regressed with the concentrations of the components ( CO2 , CO , H 2 O, THC, NO) can be linearly regressed. Moreover, since the H 2 concentration and the O 2 concentration can be estimated from the individual component concentrations, they can also be estimated from the spectral data for obtaining these individual component concentrations.
ここで、H2濃度を算出する場合の個別成分濃度は、CO2濃度、CO濃度、H2O濃度、又はTHC濃度の少なくとも1つを用いることができる。また、O2濃度を算出する場合の個別成分濃度は、CO2濃度、CO濃度、H2O濃度、THC濃度、又はNO濃度の少なくとも1つを用いることができる。
Here, at least one of CO 2 concentration, CO concentration, H 2 O concentration, or THC concentration can be used as the individual component concentration when calculating the H 2 concentration. At least one of CO 2 concentration, CO concentration, H 2 O concentration, THC concentration, or NO concentration can be used as the individual component concentration when calculating the O 2 concentration.
(燃料の燃焼式)
CaHbOc+dO2+eN2+fCO2+gH2O
→n1CO2+n2CO+n3H2O+n4H2+n5O2+n6NO+n7N2+n8Ca’Hb’+r
上記式において、全炭化水素(THC)はCa’Hb’で表すものとし、a’、b’は、各炭化水素のCの数、Hの数をそれぞれ平均化したものである。
rは、その他の成分であり、他の成分に比べて微量のため、H2濃度、O2濃度の算出では無視することができる。 (Fuel combustion type)
CaHbOc + dO2 + eN2 + fCO2 + gH2O
→ n1CO2 + n2CO + n3H2O + n4H2 + n5O2 + n6NO + n7N2 + n8Ca'Hb' + r
In the above formula, total hydrocarbons (THC) are represented by Ca'Hb ' , where a' and b' are the averaged numbers of C and H in each hydrocarbon, respectively.
r is another component, and since it is a very small amount compared to the other components, it can be ignored in calculating the H 2 concentration and the O 2 concentration.
(元素バランス式)
C:a+f=n1+n2+a’n8
H:b+2g=2n3+2n4+b’n8
O:c+2d+2f+g=2n1+n2+n3+2n5+n6
N:2e=n6+2n7
n0:燃焼排ガスの全物質量 n0=n1+n2+n3+n4+n5+n6+n7+n8
xk:成分kのモル分率(xk=nk/n0)(k=1~8)
k=1;CO2、 2;CO、 3;H2O、 4;H2、
5;O2、 6;NO、 7;N2、 8;THC(Ca’Hb’)
a’n8=n0xTHCとし、xTHC/ppmCの単位で扱う。
uk:燃料を除く吸気成分jのモル分率(uj=j/(d+e+f+g))
j=d;O2、 e;N2、 f;CO2、 g;H2O
nr:燃料を除く吸気と排気の総モル数比 nr=(d+e+f+g)/n0 (element balance formula)
C: a+f= n1 + n2 + a'n8
H: b+2g=2n 3 +2n 4 +b'n 8
O: c+2d+2f+g= 2n1 + n2 + n3 + 2n5 + n6
N: 2e=n 6 +2n 7
n 0 : total amount of substances in flue gas n 0 =n 1 +n 2 +n 3 +n 4 +n 5 +n 6 +n 7 +n 8
x k : molar fraction of component k (x k = n k /n 0 ) (k = 1 to 8)
CO2 , 2; CO, 3; H2O , 4; H2 ,
5; O 2 , 6; NO, 7; N 2 , 8; THC (C a′ H b′ )
Let a′n 8 =n 0 x THC and treat in units of x THC /ppmC.
u k : molar fraction of intake air component j excluding fuel (u j =j/(d+e+f+g))
j=d; O2 , e; N2 , f; CO2 , g; H2O
n r : Total molar ratio of intake and exhaust excluding fuel n r = (d + e + f + g) / n 0
そして、Cの元素バランス式から以下の関係式が得られる。
Then, the following relational expression is obtained from the elemental balance formula of C.
また、CとHとの元素バランス式から以下の関係式が得られる。
In addition, the following relational expression can be obtained from the elemental balance formula for C and H.

上記の式により、以下に示すH2濃度の式が得られる。なお、式が複雑になるため、以下の式では、吸気中のCO2は他の成分に比べて微量のため無視している(uCO2=0)。
The above formula gives the formula for H2 concentration shown below. Since the formula becomes complicated, CO 2 in the intake air is ignored in the following formula because it is a minute amount compared to other components (u CO2 =0).

このように、H2濃度は、成分(CO2、CO、H2O、THC)の濃度で線形回帰できる。
Thus, the H2 concentration can be linearly regressed with the concentrations of the components ( CO2 , CO, H2O , THC).
一方、OとNとの元素バランス式から以下の関係式が得られる。なお、式が複雑になるので、以下では燃料中にOが含まれない、かつ、吸気中のCO2、H2Oは他の成分に比べて微量のため無視している。
On the other hand, the following relational expression is obtained from the elemental balance formula of O and N. Since the formula becomes complicated, the fuel does not contain O, and CO 2 and H 2 O in the intake air are neglected because they are minute amounts compared to other components.

乾燥空気のOとNとの物質量の比は一定のため、上記は一定値(定数A)となる。これにより、以下の式が得られる。
Since the ratio of the amount of O and N in dry air is constant, the above is a constant value (constant A). This gives the following formula:

上述したH2濃度の式(H/C元素バランス)で、上記式のH2項を消去すると、以下に示すO2濃度の式が得られる。
Eliminating the H2 term in the above equation for H 2 concentration (H/C elemental balance) yields the following O 2 concentration equation.

このように、O2濃度は、成分(CO2、CO、H2O、THC、NO)の濃度で線形回帰できる。
Thus, the O2 concentration can be linearly regressed with the concentrations of the components ( CO2 , CO, H2O , THC, NO).
この機械学習装置6は、CPU、メモリ、入出力インターフェース、AD変換器、又はキーボード等の入力手段等を有するコンピュータであり、メモリに格納された機械学習プログラムにしたがってCPUやその周辺機器が協動することにより、図4に示すように、教師データを受け付ける教師データ受付部61、及び、教師データを用いて機械学習する機械学習部62等としての機能を発揮するものである。なお、この機械学習装置6は、上記の排ガス分析装置100の演算処理装置5に組み込まれたものであっても良いし、機械学習装置6の一部の機能を演算処理装置5に備えさせても良い。
This machine learning device 6 is a computer having a CPU, a memory, an input/output interface, an AD converter, or input means such as a keyboard, etc., and the CPU and its peripheral devices cooperate according to the machine learning program stored in the memory. As a result, as shown in FIG. 4, the functions of a teacher data receiving unit 61 that receives teacher data and a machine learning unit 62 that performs machine learning using the teacher data are exhibited. The machine learning device 6 may be incorporated in the arithmetic processing device 5 of the exhaust gas analyzer 100 described above, or a part of the functions of the machine learning device 6 may be provided in the arithmetic processing device 5. Also good.
教師データ受付部61は、赤外ガス分析計(排ガス分析装置)とは異なるH2分析計(不図示)により得られたH2濃度の基準値と、赤外ガス分析計(排ガス分析装置)とは異なる、O2分析計(不図示)により得られたO2濃度の基準値と、赤外ガス分析計により得られたスペクトルデータとを含む教師データを受け付ける。この教師データに含まれるスペクトルデータは、演算処理装置5のスペクトルデータ生成部511により生成された吸光スペクトルデータであるが、排ガスの透過光スペクトルデータであっても良い。H2分析計には、例えば熱伝導式ガス分析計(TCD)又は質量分析計等を用いてもよい。また、O2分析計には、例えばジルコニア式センサ又は磁気式酸素濃度計等を用いてもよい。
The teaching data receiving unit 61 receives the H 2 concentration reference value obtained by an H 2 analyzer (not shown) different from the infrared gas analyzer (exhaust gas analyzer) and the infrared gas analyzer (exhaust gas analyzer). Different teacher data including a reference value of O 2 concentration obtained by an O 2 analyzer (not shown) and spectral data obtained by an infrared gas analyzer are accepted. The spectral data included in this teacher data is the absorption spectral data generated by the spectral data generating section 511 of the arithmetic processing unit 5, but may be transmitted light spectral data of the exhaust gas. The H 2 spectrometer may be, for example, a thermal conductivity gas spectrometer (TCD) or a mass spectrometer. Also, for the O 2 analyzer, for example, a zirconia sensor, a magnetic oxygen concentration meter, or the like may be used.
機械学習部62は、H2濃度の基準値とスペクトルデータとの関係を機械学習して、H2濃度とスペクトルデータとの相関を示すH2相関データ(H2濃度算出用の機械学習モデル)を生成するH2相関データ生成部621と、O2濃度の基準値とスペクトルデータとの関係を機械学習して、O2濃度とスペクトルデータとの相関を示すO2相関データ(O2濃度算出用の機械学習モデル)を生成するO2相関データ生成部622とを有している。
The machine learning unit 62 machine-learns the relationship between the H 2 concentration reference value and the spectrum data, and performs H 2 correlation data (a machine learning model for calculating H 2 concentration) that indicates the correlation between the H 2 concentration and the spectrum data. and the O2 correlation data ( O2 concentration calculation and an O 2 correlation data generator 622 that generates a machine learning model for
ここで、H2相関データ生成部621により算出されたH2相関データ(H2濃度算出用の機械学習モデル)は、H2相関データ格納部623に格納され、O2相関データ生成部622により算出されたO2相関データ(O2濃度算出用の機械学習モデル)は、O2相関データ格納部624に格納される。
Here, the H2 correlation data (machine learning model for calculating the H2 concentration) calculated by the H2 correlation data generation unit 621 is stored in the H2 correlation data storage unit 623, and is stored in the O2 correlation data generation unit 622. The calculated O 2 correlation data (machine learning model for calculating O 2 concentration) is stored in the O 2 correlation data storage unit 624 .
<排ガス分析装置100の特徴構成(H2濃度又はO2濃度の測定)>
そして、排ガス分析装置100は、図5に示すように、機械学習装置6により生成されたH2相関データ(H2濃度算出用の機械学習モデル)を用いてH2濃度を算出可能であり、O2相関データ(O2濃度算出用の機械学習モデル)を用いてO2濃度を算出可能である。 <Characteristic Configuration of Exhaust Gas Analyzer 100 (Measurement of H 2 Concentration or O 2 Concentration)>
Then, as shown in FIG. 5, theexhaust gas analyzer 100 can calculate the H 2 concentration using the H 2 correlation data (machine learning model for calculating the H 2 concentration ) generated by the machine learning device 6. O2 concentration can be calculated using O2 correlation data (machine learning model for calculating O2 concentration).
そして、排ガス分析装置100は、図5に示すように、機械学習装置6により生成されたH2相関データ(H2濃度算出用の機械学習モデル)を用いてH2濃度を算出可能であり、O2相関データ(O2濃度算出用の機械学習モデル)を用いてO2濃度を算出可能である。 <Characteristic Configuration of Exhaust Gas Analyzer 100 (Measurement of H 2 Concentration or O 2 Concentration)>
Then, as shown in FIG. 5, the
具体的に排ガス分析装置100の演算処理装置5は、H2相関データを用いてH2濃度を算出するH2濃度算出部52と、O2相関データを用いてO2濃度を算出するO2濃度算出部53とを有している。なお、H2相関データは、H2相関データ格納部54に格納されており、O2相関データは、O2相関データ格納部55に格納されている。
Specifically, the arithmetic processing unit 5 of the exhaust gas analyzer 100 includes an H 2 concentration calculation unit 52 that calculates the H 2 concentration using the H 2 correlation data, and an O 2 concentration calculation unit 52 that calculates the O 2 concentration using the O 2 correlation data . and a density calculator 53 . The H 2 correlation data is stored in the H 2 correlation data storage unit 54 , and the O 2 correlation data is stored in the O 2 correlation data storage unit 55 .
なお、機械学習装置6の一部又は全部が演算処理装置5に組み込まれている場合には、H2相関データ格納部54を機械学習装置6のH2相関データ格納部623から構成しても良いし、O2相関データ格納部55を機械学習装置6のO2相関データ格納部624から構成しても良い。
Note that when part or all of the machine learning device 6 is incorporated in the arithmetic processing device 5, the H2 correlation data storage unit 54 may be configured from the H2 correlation data storage unit 623 of the machine learning device 6. Alternatively, the O 2 correlation data storage unit 55 may be configured from the O 2 correlation data storage unit 624 of the machine learning device 6 .
H2濃度算出部52は、スペクトルデータ生成部511により生成されたスペクトルデータと、H2相関データとから、排ガス中のH2濃度を算出するものである。
The H 2 concentration calculator 52 calculates the H 2 concentration in the exhaust gas from the spectrum data generated by the spectrum data generator 511 and the H 2 correlation data.
ここで、H2相関データが吸光スペクトルデータを用いて生成された場合には、H2濃度算出部52は、スペクトルデータ生成部511により生成された吸光スペクトルデータを用いてH2濃度を算出する。また、H2相関データが透過光スペクトルデータを用いて生成された場合には、H2濃度算出部52は、スペクトルデータ生成部511により生成された透過光スペクトルデータを用いてH2濃度を算出する。
Here, when the H 2 correlation data is generated using the absorption spectrum data, the H 2 concentration calculation unit 52 calculates the H 2 concentration using the absorption spectrum data generated by the spectrum data generation unit 511. . Further, when the H2 correlation data is generated using the transmitted light spectrum data, the H2 concentration calculator 52 calculates the H2 concentration using the transmitted light spectrum data generated by the spectrum data generator 511. do.
O2濃度算出部53は、スペクトルデータ生成部511により生成されたスペクトルデータと、O2相関データとから、燃焼排ガス中のO2濃度を算出するものである。
The O 2 concentration calculator 53 calculates the O 2 concentration in the combustion exhaust gas from the spectrum data generated by the spectrum data generator 511 and the O 2 correlation data.
ここで、O2相関データが吸光スペクトルデータを用いて生成された場合には、O2濃度算出部53は、スペクトルデータ生成部511により生成された吸光スペクトルデータを用いてO2濃度を算出する。また、O2相関データが透過光スペクトルデータを用いて生成された場合には、O2濃度算出部53は、スペクトルデータ生成部511により生成された透過光スペクトルデータを用いてO2濃度を算出する。
Here, when the O 2 correlation data is generated using the absorption spectrum data, the O 2 concentration calculation unit 53 calculates the O 2 concentration using the absorption spectrum data generated by the spectrum data generation unit 511. . Further, when the O 2 correlation data is generated using the transmitted light spectrum data, the O 2 concentration calculation unit 53 calculates the O 2 concentration using the transmitted light spectrum data generated by the spectrum data generation unit 511. do.
<本実施形態の効果>
このように構成した本実施形態の分析装置100によれば元素バランス式を用いてH2濃度及びO2濃度を推定できることを利用し、排ガス中のH2濃度又はO2濃度と光検出器4の検出信号から得られたスペクトルデータとの関係を学習した相関データ(機械学習モデル)を用いて、光検出器4の検出信号から得られたスペクトルデータから、H2濃度又はO2濃度を算出できるようになる。その結果、赤外光を用いた排ガス分析において、赤外光を吸収しないH2濃度又はO2濃度を測定することができる。 <Effects of this embodiment>
According to theanalyzer 100 of the present embodiment configured in this way, the H 2 concentration or O 2 concentration in the exhaust gas and the photodetector 4 H 2 concentration or O 2 concentration is calculated from the spectral data obtained from the detection signal of the photodetector 4 using the correlation data (machine learning model) that learned the relationship with the spectral data obtained from the detection signal of become able to. As a result, in exhaust gas analysis using infrared light, the H 2 concentration or O 2 concentration that does not absorb infrared light can be measured.
このように構成した本実施形態の分析装置100によれば元素バランス式を用いてH2濃度及びO2濃度を推定できることを利用し、排ガス中のH2濃度又はO2濃度と光検出器4の検出信号から得られたスペクトルデータとの関係を学習した相関データ(機械学習モデル)を用いて、光検出器4の検出信号から得られたスペクトルデータから、H2濃度又はO2濃度を算出できるようになる。その結果、赤外光を用いた排ガス分析において、赤外光を吸収しないH2濃度又はO2濃度を測定することができる。 <Effects of this embodiment>
According to the
<第1実施形態の変形例>
例えば、図6に示すように、教師データ受付部61は、教師データとして、H2濃度の基準値と、O2濃度の基準値と、及び、スペクトルデータに加えて、スペクトルデータから得られ、元素バランス式に基づいて選択された個別成分濃度を受け付けるものであっても良い。そして、機械学習部62において、H2相関データ生成部621は、H2濃度の基準値とスペクトルデータ及び個別成分濃度との関係を機械学習して、H2濃度とスペクトルデータ及び個別成分濃度との相関を示すH2相関データ(H2濃度算出用の機械学習モデル)を生成する。また、O2相関データ生成部622は、O2濃度の基準値とスペクトルデータ及び個別成分濃度との関係を機械学習して、O2濃度とスペクトルデータ及び個別成分濃度との相関を示すO2相関データ(O2濃度算出用の機械学習モデル)を生成する。このように教師データにスペクトルデータに加えて、元素バランス式に基づいて選択される個別成分濃度を含めることによって、O2濃度又はH2濃度の測定精度を向上させることができる。 <Modified Example of First Embodiment>
For example, as shown in FIG. 6, the teacherdata receiving unit 61 obtains from the spectral data, in addition to the H 2 concentration reference value, the O 2 concentration reference value, and the spectral data as the teacher data, It may accept individual component concentrations selected based on an elemental balance equation. Then, in the machine learning unit 62, the H 2 correlation data generation unit 621 machine-learns the relationship between the H 2 concentration reference value, the spectrum data, and the individual component concentration, and calculates the H 2 concentration, the spectrum data, and the individual component concentration. Generate H 2 correlation data (machine learning model for calculating H 2 concentration) showing the correlation of Further, the O 2 correlation data generation unit 622 machine-learns the relationship between the reference value of the O 2 concentration, the spectrum data, and the individual component concentration, and the O 2 concentration indicating the correlation between the O 2 concentration, the spectrum data, and the individual component concentration . Generate correlation data (machine learning model for O2 concentration calculation). In this way, by including the individual component concentrations selected based on the element balance formula in addition to the spectral data in the teacher data, the measurement accuracy of the O 2 concentration or H 2 concentration can be improved.
例えば、図6に示すように、教師データ受付部61は、教師データとして、H2濃度の基準値と、O2濃度の基準値と、及び、スペクトルデータに加えて、スペクトルデータから得られ、元素バランス式に基づいて選択された個別成分濃度を受け付けるものであっても良い。そして、機械学習部62において、H2相関データ生成部621は、H2濃度の基準値とスペクトルデータ及び個別成分濃度との関係を機械学習して、H2濃度とスペクトルデータ及び個別成分濃度との相関を示すH2相関データ(H2濃度算出用の機械学習モデル)を生成する。また、O2相関データ生成部622は、O2濃度の基準値とスペクトルデータ及び個別成分濃度との関係を機械学習して、O2濃度とスペクトルデータ及び個別成分濃度との相関を示すO2相関データ(O2濃度算出用の機械学習モデル)を生成する。このように教師データにスペクトルデータに加えて、元素バランス式に基づいて選択される個別成分濃度を含めることによって、O2濃度又はH2濃度の測定精度を向上させることができる。 <Modified Example of First Embodiment>
For example, as shown in FIG. 6, the teacher
<変形実施形態1>
例えば、図7に示すように、教師データ受付部61は、赤外ガス分析計(排ガス分析装置)とは異なるH2分析計により得られたH2濃度の基準値と、赤外ガス分析計(排ガス分析装置)とは異なるO2分析計により得られたO2濃度の基準値と、赤外ガス分析計(排ガス分析装置)により得られたスペクトルデータと、スペクトルデータから得られた個別成分濃度とを含む教師データを受け付ける。この教師データに含まれるスペクトルデータは、スペクトルデータ生成部511により生成された排ガスの透過光スペクトルデータであっても良いし、吸光スペクトルデータであっても良い。 <Modified Embodiment 1>
For example, as shown in FIG. 7, the teacherdata receiving unit 61 stores the H 2 concentration reference value obtained by an H 2 analyzer different from the infrared gas analyzer (exhaust gas analyzer) and the infrared gas analyzer The standard value of O2 concentration obtained by an O2 analyzer different from the (exhaust gas analyzer), the spectral data obtained by the infrared gas analyzer (exhaust gas analyzer), and the individual components obtained from the spectral data It accepts teacher data including concentrations and The spectral data included in this teacher data may be transmitted light spectral data of the exhaust gas generated by the spectral data generating section 511, or may be absorption spectral data.
例えば、図7に示すように、教師データ受付部61は、赤外ガス分析計(排ガス分析装置)とは異なるH2分析計により得られたH2濃度の基準値と、赤外ガス分析計(排ガス分析装置)とは異なるO2分析計により得られたO2濃度の基準値と、赤外ガス分析計(排ガス分析装置)により得られたスペクトルデータと、スペクトルデータから得られた個別成分濃度とを含む教師データを受け付ける。この教師データに含まれるスペクトルデータは、スペクトルデータ生成部511により生成された排ガスの透過光スペクトルデータであっても良いし、吸光スペクトルデータであっても良い。 <
For example, as shown in FIG. 7, the teacher
ここで、個別成分濃度は、個別成分分析部512により分析された例えばCO、CO2、NO、H2O、NO2又は炭化水素成分(HC)等の個別成分濃度である。
Here, the individual component concentration is the individual component concentration such as CO, CO 2 , NO, H 2 O, NO 2 or hydrocarbon component (HC) analyzed by the individual component analysis unit 512 .
そして、この実施形態の機械学習装置6は、元素バランス式を用いてH2濃度の演算値(推定値)及びO2濃度の演算値(推定値)を推定する。つまり、上述した元素バランス式(物質量の保存則)から、H2濃度は、成分(CO2、CO、H2O、THC)の濃度で線形回帰でき、O2濃度は、成分(CO2、CO、H2O、THC、NO)の濃度で線形回帰できることを利用する。
Then, the machine learning device 6 of this embodiment estimates the calculated value (estimated value) of the H 2 concentration and the calculated value (estimated value) of the O 2 concentration using the element balance formula. That is, from the above-mentioned elemental balance formula (conservation law of substance amount), the H 2 concentration can be linearly regressed with the concentration of the component (CO 2 , CO, H 2 O, THC), and the O 2 concentration can be linearly regressed from the component (CO 2 , CO, H 2 O, THC, and NO).
なお、上述した元素バランス式においてTHC濃度のa’、b’は未知数であり、かつ、個別成分の測定値には少なからず誤差があり、それらを単純代入した元素バランス式の算出値にも誤差が生じる。そこで、この実施形態では、特定成分濃度の演算値と基準値との濃度誤差を最小化問題により最小化した誤差最小値を求め、その誤差最小値とスペクトルとの相関を算出している。
In the elemental balance formula described above, the THC concentrations a' and b' are unknown quantities, and the measured values of the individual components have not a little error. occurs. Therefore, in this embodiment, the minimum error value is obtained by minimizing the concentration error between the calculated value of the concentration of the specific component and the reference value, and the correlation between the minimum error value and the spectrum is calculated.
具体的に機械学習部62は、H2濃度の基準値と元素バランス式から演算されたH2濃度の演算値(推定値)とのH2濃度誤差を最小化したH2誤差最小値を算出して、H2誤差最小値と、H2誤差最小値の算出に用いたパラメータとの相関を示す第1H2相関データを生成する第1H2相関データ生成部621aと、スペクトルデータとH2誤差最小値との関係を算出して、第2H2相関データを生成する第2H2相関データ生成部621bとを有している。ここで、H2濃度誤差を最小化したH2誤差最小値の算出に用いたパラメータは、元素バランス式におけるTHC濃度を示すa’、b’である。その他、燃料のa、b及び/又は吸気水分をパラメータに加えて最小化問題を計算してH2誤差最小値を算出しても良い。
Specifically, the machine learning unit 62 calculates the minimum H2 error value by minimizing the H2 concentration error between the reference value of the H2 concentration and the calculated value (estimated value) of the H2 concentration calculated from the element balance formula. and a first H2 correlation data generation unit 621a that generates first H2 correlation data indicating the correlation between the minimum H2 error value and the parameter used to calculate the minimum H2 error value ; and a 2H2 correlation data generation unit 621b that calculates the relationship with the minimum value and generates 2H2 correlation data. Here, the parameters used for calculating the minimum H 2 error value that minimizes the H 2 concentration error are a′ and b′ representing the THC concentration in the elemental balance formula. Alternatively, the H2 error minimum value may be calculated by calculating the minimization problem by adding a, b and/or intake air moisture of the fuel to the parameters.
また、機械学習部62は、O2濃度の基準値と元素バランス式から演算されたO2濃度の演算値(推定値)とのO2濃度誤差を最小化したO2誤差最小値を算出して、O2誤差最小値と、O2誤差最小値の算出に用いたパラメータとの相関を示す第1O2相関データを生成する第1O2相関データ生成部622aと、スペクトルデータとO2誤差最小値との関係を機械学習して、第2O2相関データを生成する第2O2相関データ生成部622bとを有している。ここで、O2濃度誤差を最小化したO2誤差最小値の算出に用いたパラメータは、元素バランス式におけるTHC濃度のa’、b’である。その他、燃料のa、b及び/又は吸気水分をパラメータに加えて最小化問題を計算してH2誤差最小値を算出しても良い。
In addition, the machine learning unit 62 calculates the minimum O2 error value by minimizing the O2 concentration error between the reference value of the O2 concentration and the calculated value (estimated value) of the O2 concentration calculated from the element balance formula. a first O2 correlation data generator 622a for generating first O2 correlation data indicating the correlation between the minimum O2 error value and the parameter used to calculate the minimum O2 error value ; and a second O2 correlation data generation unit 622b that machine-learns the relationship with the value to generate the second O2 correlation data. Here, the parameters used for calculating the minimum O 2 error that minimizes the O 2 concentration error are the THC concentrations a' and b' in the elemental balance equation. Alternatively, the H2 error minimum value may be calculated by calculating the minimization problem by adding a, b and/or intake air moisture of the fuel to the parameters.
第1H2相関データ生成部621aが生成する第1H2相関データは、「H2誤差最小値」と、「H2誤差最小値の算出に用いた元素バランス式のパラメータ」との相関を示すデータである。また、第2H2相関データ生成部621bが生成する第2H2相関データは、「スペクトルデータ」と、「H2誤差最小値」との相関を示すデータである。ここで、第1H2相関データは、第1H2相関データ格納部623aに格納され、第2H2相関データは、第2H2相関データ格納部623bに格納される。
The 1H2 correlation data generated by the 1H2 correlation data generation unit 621a is data indicating the correlation between the "minimum H2 error value" and the "parameter of the element balance formula used to calculate the minimum H2 error value". is. The 2H2 correlation data generated by the 2H2 correlation data generating section 621b is data indicating the correlation between the "spectrum data" and the "minimum H2 error value". Here, the 1H2 correlation data is stored in the 1H2 correlation data storage unit 623a, and the 2H2 correlation data is stored in the 2H2 correlation data storage unit 623b.
また、第1O2相関データ生成部622aが生成する第1O2相関データは、「O2誤差最小値」と、「O2誤差最小値の算出に用いた元素バランス式のパラメータ」との相関を示すデータである。また、第2O2相関データ生成部622bが生成する第2O2相関データは、「スペクトルデータ」と、「O2誤差最小値」との相関を示すデータである。ここで、第1O2相関データは、第1O2相関データ格納部624aに格納され、第2O2相関データは、第2O2相関データ格納部624bに格納される。
In addition, the first O2 correlation data generated by the first O2 correlation data generation unit 622a is the correlation between the "minimum O2 error value" and the "parameter of the element balance formula used to calculate the minimum O2 error value". data shown. The second O2 correlation data generated by the second O2 correlation data generating section 622b is data indicating the correlation between the "spectrum data" and the "minimum O2 error value". Here, the first O2 correlation data is stored in the first O2 correlation data storage unit 624a, and the second O2 correlation data is stored in the second O2 correlation data storage unit 624b.
そして、排ガス分析装置100は、図8に示すように、機械学習装置6により生成された第1H2相関データ及び第2H2相関データ(H2濃度算出用の機械学習モデル)を用いてH2濃度を算出可能であり、第1O2相関データ及び第2O2相関データ(O2濃度算出用の機械学習モデル)を用いてO2濃度を算出可能である。
Then, as shown in FIG. 8, the exhaust gas analyzer 100 uses the 1st H2 correlation data and the 2nd H2 correlation data (machine learning model for calculating the H2 concentration) generated by the machine learning device 6 to calculate H2. The concentration can be calculated, and the O2 concentration can be calculated using the first O2 correlation data and the second O2 correlation data (machine learning model for calculating O2 concentration).
具体的に排ガス分析装置100の演算処理装置5は、スペクトルデータと第2H2相関データとから、H2誤差最小値を算出するH2誤差最小値算出部52aと、H2誤差最小値算出部52aにより得られたH2誤差最小値と第1H2相関データとから、排ガス中のH2濃度を算出するH2濃度算出部52bとを有している。なお、第1H2相関データは、第1H2相関データ格納部52cに格納されており、第2H2相関データは、第2H2相関データ格納部52dに格納されている。
Specifically, the arithmetic processing unit 5 of the exhaust gas analyzer 100 includes an H2 error minimum value calculation unit 52a that calculates the H2 error minimum value from the spectrum data and the second H2 correlation data, and an H2 error minimum value calculation unit and an H2 concentration calculator 52b for calculating the H2 concentration in the exhaust gas from the H2 error minimum value obtained by 52a and the first H2 correlation data. The 1H2 correlation data is stored in the 1H2 correlation data storage section 52c, and the 2H2 correlation data is stored in the 2H2 correlation data storage section 52d.
また、演算処理装置5は、スペクトルデータと第2O2相関データとから、O2誤差最小値を算出するO2誤差最小値算出部53aと、O2誤差最小値算出部53aにより得られたO2誤差最小値と第1O2相関データとから、排ガス中のO2濃度を算出するO2濃度算出部53bとを有している。なお、第1O2相関データは、第1O2相関データ格納部53cに格納されており、第2O2相関データは、第2O2相関データ格納部53dに格納されている。
Further, the arithmetic processing unit 5 includes an O 2 error minimum value calculation unit 53a that calculates the O 2 error minimum value from the spectrum data and the second O 2 correlation data, and an O 2 error value obtained by the O 2 error minimum value calculation unit 53a. and an O2 concentration calculator 53b for calculating the O2 concentration in the exhaust gas from the 2nd error minimum value and the first O2 correlation data. The first O2 correlation data is stored in the first O2 correlation data storage section 53c, and the second O2 correlation data is stored in the second O2 correlation data storage section 53d.
なお、機械学習装置6の一部又は全部が演算処理装置5に組み込まれている場合には、第1H2相関データ格納部52c又は第2H2相関データ格納部52dそれぞれを、機械学習装置6の第1H2相関データ格納部623a又は第2H2相関データ格納部623bそれぞれから構成しても良いし、第1O2相関データ格納部53c又は第2O2相関データ格納部53dそれぞれを、機械学習装置6の第1O2相関データ格納部624a又は第2O2相関データ格納部624bそれぞれから構成しても良い。
Note that when part or all of the machine learning device 6 is incorporated in the arithmetic processing device 5, the first H2 correlation data storage unit 52c or the second H2 correlation data storage unit 52d, respectively, of the machine learning device 6 The machine learning device 6 may comprise the first H2 correlation data storage unit 623a or the second H2 correlation data storage unit 623b, respectively, or the first O2 correlation data storage unit 53c or the second O2 correlation data storage unit 53d, respectively. 1st O2 correlation data storage section 624a or 2nd O2 correlation data storage section 624b.
<変形実施形態1の変形例>
前記変形実施形態1において、教師データに含まれる個別成分濃度に代えて、個別成分濃度及び元素バランス式から演算された特定成分濃度の演算値を用いても良い。具体的には、特定成分濃度の基準値と特定成分濃度の演算値との誤差を最小化した誤差最小値を示す第1相関データを教師データに含めても良い。この場合、第1相関データを生成する情報処理装置(不図示)が演算処理装置5とは別に設けられており、演算処理装置5は、スペクトルデータと誤差最小値との関係を機械学習して、スペクトルに対する前記誤差最小値の第2相関データを生成する第2相関データ生成部を有する構成なる。 <Modified Example ofModified Embodiment 1>
In the modifiedembodiment 1, instead of the individual component concentrations contained in the teacher data, the calculated values of the specific component concentrations calculated from the individual component concentrations and the element balance formula may be used. Specifically, the teacher data may include the first correlation data indicating the minimum error value obtained by minimizing the error between the reference value of the concentration of the specific component and the calculated value of the concentration of the specific component. In this case, an information processing device (not shown) that generates the first correlation data is provided separately from the processing device 5, and the processing device 5 machine-learns the relationship between the spectrum data and the minimum error value. , a second correlation data generator for generating the second correlation data of the minimum error value for the spectrum.
前記変形実施形態1において、教師データに含まれる個別成分濃度に代えて、個別成分濃度及び元素バランス式から演算された特定成分濃度の演算値を用いても良い。具体的には、特定成分濃度の基準値と特定成分濃度の演算値との誤差を最小化した誤差最小値を示す第1相関データを教師データに含めても良い。この場合、第1相関データを生成する情報処理装置(不図示)が演算処理装置5とは別に設けられており、演算処理装置5は、スペクトルデータと誤差最小値との関係を機械学習して、スペクトルに対する前記誤差最小値の第2相関データを生成する第2相関データ生成部を有する構成なる。 <Modified Example of
In the modified
<第1実施形態の変形例>
例えば、図6に示すように、教師データ受付部61は、教師データとして、H2濃度の基準値と、O2濃度の基準値と、及び、スペクトルデータに加えて、スペクトルデータから得られ、元素バランス式に基づいて選択された個別成分濃度を受け付けるものであっても良い。そして、機械学習部62において、H2相関データ生成部621は、H2濃度の基準値とスペクトルデータ及び個別成分濃度との関係を機械学習して、H2濃度とスペクトルデータ及び個別成分濃度との相関を示すH2相関データ(H2濃度算出用の機械学習モデル)を生成する。また、O2相関データ生成部622は、O2濃度の基準値とスペクトルデータ及び個別成分濃度との関係を機械学習して、O2濃度とスペクトルデータ及び個別成分濃度との相関を示すO2相関データ(O2濃度算出用の機械学習モデル)を生成する。このように教師データにスペクトルデータに加えて、元素バランス式に基づいて選択される個別成分濃度を含めることによって、O2濃度又はH2濃度の測定精度を向上させることができる。 <Modified Example of First Embodiment>
For example, as shown in FIG. 6, the teacherdata receiving unit 61 obtains from the spectral data, in addition to the H 2 concentration reference value, the O 2 concentration reference value, and the spectral data as the teacher data, It may accept individual component concentrations selected based on an elemental balance equation. Then, in the machine learning unit 62, the H 2 correlation data generation unit 621 machine-learns the relationship between the H 2 concentration reference value, the spectrum data, and the individual component concentration, and calculates the H 2 concentration, the spectrum data, and the individual component concentration. Generate H 2 correlation data (machine learning model for calculating H 2 concentration) showing the correlation of Further, the O 2 correlation data generation unit 622 machine-learns the relationship between the reference value of the O 2 concentration, the spectrum data, and the individual component concentration, and the O 2 concentration indicating the correlation between the O 2 concentration, the spectrum data, and the individual component concentration . Generate correlation data (machine learning model for O2 concentration calculation). In this way, by including the individual component concentrations selected based on the element balance formula in addition to the spectral data in the teacher data, the measurement accuracy of the O 2 concentration or H 2 concentration can be improved.
例えば、図6に示すように、教師データ受付部61は、教師データとして、H2濃度の基準値と、O2濃度の基準値と、及び、スペクトルデータに加えて、スペクトルデータから得られ、元素バランス式に基づいて選択された個別成分濃度を受け付けるものであっても良い。そして、機械学習部62において、H2相関データ生成部621は、H2濃度の基準値とスペクトルデータ及び個別成分濃度との関係を機械学習して、H2濃度とスペクトルデータ及び個別成分濃度との相関を示すH2相関データ(H2濃度算出用の機械学習モデル)を生成する。また、O2相関データ生成部622は、O2濃度の基準値とスペクトルデータ及び個別成分濃度との関係を機械学習して、O2濃度とスペクトルデータ及び個別成分濃度との相関を示すO2相関データ(O2濃度算出用の機械学習モデル)を生成する。このように教師データにスペクトルデータに加えて、元素バランス式に基づいて選択される個別成分濃度を含めることによって、O2濃度又はH2濃度の測定精度を向上させることができる。 <Modified Example of First Embodiment>
For example, as shown in FIG. 6, the teacher
<変形実施形態2>
また、図9に示すように、教師データ受付部61は、赤外ガス分析計(排ガス分析装置)とは異なるH2分析計により得られたH2濃度の基準値と、赤外ガス分析計(排ガス分析装置)とは異なるO2分析計により得られたO2濃度の基準値と、赤外ガス分析計(排ガス分析装置)により得られた個別成分濃度とを含む教師データを受け付ける。この教師データに含まれる個別成分濃度は、個別成分分析部512により分析された例えばCO、CO2、NO、H2O、NO2又は炭化水素成分(HC)等の個別成分濃度である。 <Modified Embodiment 2>
Further, as shown in FIG. 9, the teacherdata receiving unit 61 stores the H 2 concentration reference value obtained by an H 2 analyzer different from the infrared gas analyzer (exhaust gas analyzer) and the infrared gas analyzer The teaching data including the reference value of the O 2 concentration obtained by the O 2 analyzer different from the (exhaust gas analyzer) and the individual component concentrations obtained by the infrared gas analyzer (exhaust gas analyzer) are accepted. The individual component concentrations included in this teacher data are individual component concentrations such as CO, CO 2 , NO, H 2 O, NO 2 or hydrocarbon components (HC) analyzed by the individual component analysis unit 512 .
また、図9に示すように、教師データ受付部61は、赤外ガス分析計(排ガス分析装置)とは異なるH2分析計により得られたH2濃度の基準値と、赤外ガス分析計(排ガス分析装置)とは異なるO2分析計により得られたO2濃度の基準値と、赤外ガス分析計(排ガス分析装置)により得られた個別成分濃度とを含む教師データを受け付ける。この教師データに含まれる個別成分濃度は、個別成分分析部512により分析された例えばCO、CO2、NO、H2O、NO2又は炭化水素成分(HC)等の個別成分濃度である。 <
Further, as shown in FIG. 9, the teacher
機械学習部62は、H2濃度の基準値とH2濃度の演算値(推定値)との関係を機械学習して、H2相関データを生成するH2相関データ生成部621と、O2濃度の基準値とO2濃度の演算値(推定値)との関係を機械学習して、O2相関データを生成するO2相関データ生成部622とを有している。
The machine learning unit 62 includes an H 2 correlation data generation unit 621 for generating H 2 correlation data by performing machine learning on the relationship between the reference value of the H 2 concentration and the calculated value (estimated value) of the H 2 concentration, and an O 2 It has an O 2 correlation data generation unit 622 for generating O 2 correlation data by performing machine learning on the relationship between the reference value of concentration and the calculated value (estimated value) of O 2 concentration.
ここで、H2濃度の演算値(推定値)及びO2濃度の演算値(推定値)は、上述した燃料の燃焼式から求まる元素バランス式を用いて推定することができる。つまり、元素バランス式(物質量の保存則)から、H2濃度は、成分(CO2、CO、H2O、THC)の濃度で線形回帰でき、O2濃度は、成分(CO2、CO、H2O、THC、NO)の濃度で線形回帰できることを利用する。ここで、H2濃度の線形回帰式において、成分(CO2、CO、H2O、THC)の濃度に加えて、NO濃度を加えることで、H2濃度の測定精度を向上させることができる。
Here, the calculated value (estimated value) of the H 2 concentration and the calculated value (estimated value) of the O 2 concentration can be estimated using the element balance formula obtained from the fuel combustion formula described above. That is, from the elemental balance formula (conservation law of substance amount), the H 2 concentration can be linearly regressed with the concentrations of the components (CO 2 , CO, H 2 O, THC), and the O 2 concentration can be linearly regressed from the components (CO 2 , CO , H 2 O, THC, NO) can be linearly regressed. Here, in the H 2 concentration linear regression equation, by adding the NO concentration in addition to the concentrations of the components (CO 2 , CO, H 2 O, THC), the measurement accuracy of the H 2 concentration can be improved. .
H2相関データ生成部621により生成されたH2相関データ(H2濃度算出用の機械学習モデル)は、H2相関データ格納部623に格納され、O2相関データ生成部622により生成されたO2相関データ(O2濃度算出用の機械学習モデル)は、O2相関データ格納部624に格納される。
The H2 correlation data (machine learning model for calculating H2 concentration) generated by the H2 correlation data generation unit 621 is stored in the H2 correlation data storage unit 623, and the O2 correlation data generation unit 622 generates The O 2 correlation data (machine learning model for calculating O 2 concentration) is stored in the O 2 correlation data storage unit 624 .
そして、排ガス分析装置100は、図10に示すように、機械学習装置6により生成されたH2相関データ(H2濃度算出用の機械学習モデル)を用いてH2濃度を算出可能であり、O2相関データ(O2濃度算出用の機械学習モデル)を用いてO2濃度を算出可能である。
Then, as shown in FIG . 10, the exhaust gas analyzer 100 can calculate the H 2 concentration using the H 2 correlation data (machine learning model for calculating the H 2 concentration) generated by the machine learning device 6, O2 concentration can be calculated using O2 correlation data (machine learning model for calculating O2 concentration).
具体的に排ガス分析装置100の演算処理装置5は、個別成分濃度とH2相関データとから、燃焼排ガス中のH2濃度を算出するH2濃度算出部52と、個別成分濃度とO2相関データとから、燃焼排ガス中のO2濃度を算出するO2濃度算出部53とを有している。
Specifically, the arithmetic processing unit 5 of the exhaust gas analyzer 100 includes an H 2 concentration calculation unit 52 that calculates the H 2 concentration in the combustion exhaust gas from the individual component concentration and the H 2 correlation data, and the individual component concentration and the O 2 correlation data. and an O 2 concentration calculator 53 for calculating the O 2 concentration in the combustion exhaust gas from the data.
なお、機械学習装置6の一部又は全部が演算処理装置5に組み込まれている場合には、H2相関データ格納部54を機械学習装置6のH2相関データ格納部623から構成しても良いし、O2相関データ格納部55を機械学習装置6のO2相関データ格納部624から構成しても良い。
Note that when part or all of the machine learning device 6 is incorporated in the arithmetic processing device 5, the H2 correlation data storage unit 54 may be configured from the H2 correlation data storage unit 623 of the machine learning device 6. Alternatively, the O 2 correlation data storage unit 55 may be configured from the O 2 correlation data storage unit 624 of the machine learning device 6 .
ここで、H2濃度算出部は、個別成分濃度からH2濃度の演算値を演算し、その演算値とH2相関データとから、燃焼排ガス中のH2濃度を算出する。また、O2濃度算出部は、個別成分濃度からO2濃度の演算値を演算し、その演算値とO2相関データとから、燃焼排ガス中のO2濃度を算出する。
Here, the H 2 concentration calculation unit calculates a calculated value of the H 2 concentration from the individual component concentrations, and calculates the H 2 concentration in the flue gas from the calculated value and the H 2 correlation data. Further, the O 2 concentration calculation unit calculates a calculated value of O 2 concentration from the individual component concentrations, and calculates the O 2 concentration in the flue gas from the calculated value and the O 2 correlation data.
上記の元素バランス式に用いるTHC濃度は、赤外ガス分析計(排ガス分析装置)とは異なるTHC分析装置により得られたTHC濃度を用いることが考えられる。
The THC concentration used in the above elemental balance formula is considered to be the THC concentration obtained by a THC analyzer different from the infrared gas analyzer (exhaust gas analyzer).
また、排ガス分析装置100が、図11に示すように、THC濃度の基準値とスペクトルデータとの関係を学習したTHC相関データを格納するTHC相関データ格納部56と、赤外ガス分析計(スペクトルデータ生成部511)により得られたスペクトルデータとTHC相関データとから、燃焼排ガス中のTHC濃度を算出するTHC濃度算出部57とをさらに備えた構成とし、当該THC濃度算出部57により得られたTHC濃度を用いても良い。
Further, as shown in FIG. 11, the exhaust gas analyzer 100 includes a THC correlation data storage unit 56 that stores THC correlation data obtained by learning the relationship between the THC concentration reference value and the spectrum data, and an infrared gas analyzer (spectrum The configuration further includes a THC concentration calculation unit 57 that calculates the THC concentration in the combustion exhaust gas from the spectral data and the THC correlation data obtained by the data generation unit 511), and the THC concentration calculation unit 57 obtains THC concentration may also be used.
さらに、図12に示すように、機械学習装置6において、教師データ受付部61は、赤外ガス分析計(排ガス分析装置)とは異なるTHC分析計により得られたTHC濃度の基準値と、スペクトルデータと含む教師データを受け付けるものであり、機械学習部62は、THC濃度の基準値とスペクトルデータとの関係を機械学習して、THC相関データを生成するTHC相関データ生成部625を有する構成としても良い。このTHC相関データ生成部625により生成されたTHC相関データは、THC相関データ格納部626に格納される。
Further, as shown in FIG. 12, in the machine learning device 6, the teacher data receiving unit 61 receives the reference value of the THC concentration obtained by a THC analyzer different from the infrared gas analyzer (exhaust gas analyzer) and the spectrum The machine learning unit 62 is configured to have a THC correlation data generation unit 625 that generates THC correlation data by machine learning the relationship between the THC concentration reference value and the spectrum data. Also good. The THC correlation data generated by this THC correlation data generation section 625 is stored in the THC correlation data storage section 626 .
上記の変形実施形態1、2において用いる個別成分濃度は、CO2、CO、H2O、THC、NOの全ての成分の濃度であっても良いし、CO2、CO、H2O、THC、NOの一部の成分の濃度であっても良い。
The concentrations of individual components used in modified embodiments 1 and 2 above may be concentrations of all components CO 2 , CO, H 2 O, THC and NO, or CO 2 , CO, H 2 O and THC. , NO may be the concentration of some components.
また、元素バランス式から演算された特定成分濃度の演算値を用いて機械学習する他に、特定成分濃度の演算値を求めることなく、個別成分濃度と特定成分濃度との関係を機械学習する構成としても良い。
In addition to performing machine learning using the calculated value of the concentration of the specific component calculated from the element balance formula, machine learning of the relationship between the concentration of the individual component and the concentration of the specific component is performed without obtaining the calculated value of the specific component concentration. It is good as
加えて、変形実施形態1において、第1H2相関データ生成部621a又は第2H2相関データ生成部621bは、個別成分濃度から求まるH2濃度の演算値に加えて、個別成分濃度及び/又はO2濃度の基準値を用いて相関データを算出するように構成しても良い。また、第1O2相関データ生成部622a又は第2O2相関データ生成部622bは、個別成分濃度から求まるO2濃度の演算値に加えて、個別成分濃度及び/又はH2濃度の基準値を用いて相関データを算出するように構成しても良い。このように機械学習するパラメータを増やすことによって、H2濃度又はO2濃度の測定精度を向上させることができる。
In addition, in Modified Embodiment 1, the 1H2 correlation data generation unit 621a or the 2H2 correlation data generation unit 621b generates individual component concentrations and/or O The correlation data may be calculated using the reference values of two densities. Further, the first O2 correlation data generation unit 622a or the second O2 correlation data generation unit 622b uses the reference values of the individual component concentrations and/or H2 concentrations in addition to the calculated O2 concentration values obtained from the individual component concentrations. may be configured to calculate the correlation data. By increasing the parameters to be machine-learned in this way, it is possible to improve the measurement accuracy of the H 2 concentration or the O 2 concentration.
さらに、前記実施形態の排ガス測定システムは、シャシダイナモ300を用いて完成車両Vを試験するものであったが、例えばエンジンダイナモメータを用いてエンジンの性能を試験するものであっても良いし、ダイナモメータを用いてパワートレインの性能を試験するものであっても良い。
Furthermore, the exhaust gas measurement system of the above embodiment uses the chassis dynamo 300 to test the complete vehicle V. However, for example, an engine dynamometer may be used to test the performance of the engine. A dynamometer may be used to test powertrain performance.
排ガス分析装置100としては、光を測定試料に照射してそのスペクトルから分析をするものであればよい。排ガス分析装置100としては、フーリエ変換型赤外分光法以外にも、例えば、NDIR、量子カスケードレーザ赤外分光法、非分散形赤外吸収方式、化学発光法(ケミルミネッセンス法)、又はこれらを組み合わせた手法等を用いてもよい。また、本発明は、自動車の排ガスの分析に限らず、船舶、航空機、農業用機械、工作機械等の内燃機関、発電所又は焼却炉から排出された排ガスを分析することも可能である。また、内燃機関のテールパイプ、又は発電所等の煙道だけなく、環境中に含まれる排ガスの成分を分析するものであってもよい。また、排ガス分析装置は、赤外光以外の光を用いたものであっても良い。
The exhaust gas analyzer 100 may irradiate a measurement sample with light and analyze from the spectrum. As the exhaust gas analyzer 100, in addition to Fourier transform infrared spectroscopy, for example, NDIR, quantum cascade laser infrared spectroscopy, non-dispersive infrared absorption method, chemiluminescence method (chemiluminescence method), or these A combined method or the like may also be used. Moreover, the present invention is not limited to the analysis of exhaust gases from automobiles, and can also analyze exhaust gases emitted from internal combustion engines such as ships, aircraft, agricultural machinery, and machine tools, power plants, or incinerators. In addition to analyzing the tail pipe of an internal combustion engine or the flue of a power plant, the components of exhaust gas contained in the environment may also be analyzed. Further, the exhaust gas analyzer may use light other than infrared light.
その他、本発明の趣旨に反しない限りにおいて様々な実施形態の変形や組み合わせを行っても構わない。
In addition, various modifications and combinations of the embodiments may be made as long as they do not contradict the spirit of the present invention.
上記した本発明よれば、分析装置において他の分析計を用いて測定する必要があったH2濃度又はO2濃度を測定できる。
According to the above-described present invention, the H 2 concentration or O 2 concentration, which had to be measured using another analyzer, can be measured in the analyzer.
100・・・排ガス分析装置
1・・・赤外光源
4・・・光検出器
5・・・演算処理装置
52・・・H2濃度算出部
52a・・・H2濃度誤差算出部
52b・・・H2濃度算出部
52c・・・第1H2相関データ格納部
52d・・・第2H2相関データ格納部
53・・・O2濃度算出部
53a・・・O2濃度誤差算出部
53b・・・O2濃度算出部
53c・・・第1O2相関データ格納部
53d・・・第2O2相関データ格納部
54・・・H2相関データ格納部
55・・・O2相関データ格納部
56・・・THC相関データ格納部
57・・・THC濃度算出部
6・・・機械学習装置
61・・・教師データ受付部
62・・・機械学習部
621・・・H2相関データ生成部
622・・・O2相関データ生成部
623・・・H2相関データ格納部
624・・・O2相関データ格納部
621a・・・第1H2相関データ生成部
621b・・・第2H2相関データ生成部
622a・・・第1O2相関データ生成部
622b・・・第2O2相関データ生成部
623a・・・第1H2相関データ格納部
623b・・・第2H2相関データ格納部
624a・・・第1O2相関データ格納部
624b・・・第2O2相関データ格納部
625・・・THC相関データ生成部
626・・・THC相関データ格納部
100Exhaust gas analyzer 1 Infrared light source 4 Photodetector 5 Arithmetic processor 52 H2 concentration calculator 52a H2 concentration error calculator 52b 1st H2 correlation data storage unit 52d 2nd H2 correlation data storage unit 53 02 concentration calculation unit 53a 02 concentration error calculation unit 53b First O2 correlation data storage unit 53d Second O2 correlation data storage unit 54 H2 correlation data storage unit 55 O2 correlation data storage unit 56 THC correlation data storage unit 57 THC concentration calculation unit 6 machine learning device 61 teacher data reception unit 62 machine learning unit 621 H2 correlation data generation unit 622 O2 correlation data generation unit 623 H2 correlation data storage unit 624 O2 correlation data storage unit 621a 1st H2 correlation data generation unit 621b 2nd H2 correlation data generation unit 622a 1st O2 correlation data generation unit 622b 2nd O2 correlation data generation unit 623a 1st H2 correlation data storage unit 623b 2nd H2 correlation data storage unit 624a 1st O2 Correlation data storage unit 624b... 2nd O2 correlation data storage unit 625... THC correlation data generation unit 626... THC correlation data storage unit
1・・・赤外光源
4・・・光検出器
5・・・演算処理装置
52・・・H2濃度算出部
52a・・・H2濃度誤差算出部
52b・・・H2濃度算出部
52c・・・第1H2相関データ格納部
52d・・・第2H2相関データ格納部
53・・・O2濃度算出部
53a・・・O2濃度誤差算出部
53b・・・O2濃度算出部
53c・・・第1O2相関データ格納部
53d・・・第2O2相関データ格納部
54・・・H2相関データ格納部
55・・・O2相関データ格納部
56・・・THC相関データ格納部
57・・・THC濃度算出部
6・・・機械学習装置
61・・・教師データ受付部
62・・・機械学習部
621・・・H2相関データ生成部
622・・・O2相関データ生成部
623・・・H2相関データ格納部
624・・・O2相関データ格納部
621a・・・第1H2相関データ生成部
621b・・・第2H2相関データ生成部
622a・・・第1O2相関データ生成部
622b・・・第2O2相関データ生成部
623a・・・第1H2相関データ格納部
623b・・・第2H2相関データ格納部
624a・・・第1O2相関データ格納部
624b・・・第2O2相関データ格納部
625・・・THC相関データ生成部
626・・・THC相関データ格納部
100
Claims (15)
- 燃焼排ガスに光を照射して前記燃焼排ガスを透過した光を検出し、その検出信号に基づいて前記燃焼排ガスを分析する排ガス分析装置に用いられる機械学習装置であって、
教師データを受け付ける教師データ受付部と、
前記教師データを用いて機械学習する機械学習部とを備え、
前記教師データ受付部は、
前記排ガス分析装置とは異なる分析計により得られたH2濃度又はO2濃度の少なくとも1つである特定成分濃度の基準値と、
前記燃焼排ガスに光を照射して得られたスペクトルデータ、又は前記特定成分濃度を求めるための元素バランス式に基づいて選択された個別成分濃度、又は、前記元素バランス式に前記個別成分濃度を用いて演算された特定成分濃度の演算値の少なくとも1つと、を含む教師データを受け付けるものであり、
前記機械学習部は、
前記特定成分濃度の基準値と、
前記スペクトルデータ、前記個別成分濃度、又は、前記特定成分濃度の演算値の少なくとも1つとの関係を機械学習して特定成分相関データを生成するものである、機械学習装置。 A machine learning device used in an exhaust gas analyzer for irradiating light on combustion exhaust gas, detecting light transmitted through the combustion exhaust gas, and analyzing the combustion exhaust gas based on the detection signal,
a training data reception unit that receives training data;
A machine learning unit that performs machine learning using the teacher data,
The training data reception unit
a reference value of specific component concentration, which is at least one of H 2 concentration or O 2 concentration, obtained by an analyzer different from the exhaust gas analyzer;
Spectral data obtained by irradiating the combustion exhaust gas with light, or individual component concentrations selected based on the element balance formula for determining the specific component concentration, or using the individual component concentrations in the element balance formula and at least one of the calculated values of the concentration of the specific component calculated by
The machine learning unit
a reference value for the specific component concentration;
A machine learning device for generating specific component correlation data by machine-learning a relationship with at least one of the spectrum data, the individual component concentration, or the specific component concentration calculated value. - 前記教師データ受付部は、前記特定成分濃度の基準値と、前記スペクトルデータとを含む教師データを受け付けるものであり、
前記機械学習部は、前記特定成分濃度の基準値と、前記スペクトルデータとの関係を機械学習して前記特定成分相関データを生成するものである、請求項1に記載の機械学習装置。 The teacher data receiving unit receives teacher data including the reference value of the concentration of the specific component and the spectrum data,
2. The machine learning device according to claim 1, wherein the machine learning unit machine-learns a relationship between the reference value of the concentration of the specific component and the spectral data to generate the specific component correlation data. - 前記教師データ受付部は、さらに前記個別成分濃度を教師データとして受けるものであり、
前記機械学習部は、前記特定成分濃度の基準値と、前記スペクトルデータと、前記個別成分濃度との関係を機械学習して記特定成分相関データを生成するものである、請求項2に記載の機械学習装置。 The training data reception unit further receives the concentration of the individual component as training data,
3. The machine learning unit according to claim 2, wherein the machine learning unit generates the specific component correlation data by machine-learning the relationship between the reference value of the specific component concentration, the spectrum data, and the individual component concentration. Machine learning device. - 前記機械学習部は、
前記特定成分濃度の基準値と前記特定成分濃度の演算値との誤差を最小化した誤差最小値を算出して、前記誤差最小値と、前記誤差最小値の算出に用いたパラメータとの相関を示す第1相関データを前記特定成分相関データの一部として生成する第1相関データ生成部と、
前記スペクトルデータと前記誤差最小値との関係を機械学習して、前記スペクトルデータと前記誤差最小値との相関を示す第2相関データを前記特定成分相関データの一部として生成する第2相関データ生成部とを有する、請求項1乃至3の何れか一項に記載の機械学習装置。 The machine learning unit
calculating the minimum error value by minimizing the error between the reference value of the concentration of the specific component and the calculated value of the concentration of the specific component, and calculating the correlation between the minimum error value and the parameter used to calculate the minimum error value; a first correlation data generation unit that generates the first correlation data shown as part of the specific component correlation data;
Second correlation data for generating, as part of the specific component correlation data, second correlation data indicating correlation between the spectral data and the minimum error value by performing machine learning on the relationship between the spectral data and the minimum error value 4. The machine learning device according to any one of claims 1 to 3, further comprising a generator. - 前記教師データ受付部は、前記特定成分濃度の基準値と、前記個別成分濃度とを含む教師データを受け付けるものであり、
前記機械学習部は、前記特定成分濃度の基準値と、前記個別成分濃度との関係を機械学習して前記特定成分相関データを生成するものである、請求項1に記載の機械学習装置。 The teacher data receiving unit receives teacher data including the reference value of the concentration of the specific component and the concentration of the individual component,
2. The machine learning device according to claim 1, wherein the machine learning unit generates the specific component correlation data by machine-learning a relationship between the reference value of the specific component concentration and the individual component concentration. - 前記特定成分相関データとしてH2相関データを機械学習する場合には、前記個別成分濃度は、CO2濃度、CO濃度、H2O濃度、又はTHC濃度の少なくとも1つであり、
前記特定成分相関データとしてO2相関データを機械学習する場合には、前記個別成分濃度は、CO2濃度、CO濃度、H2O濃度、THC濃度、又はNO濃度の少なくとも1つである、請求項1乃至5の何れか一項に記載の機械学習装置。 When machine learning is performed on H 2 correlation data as the specific component correlation data, the individual component concentration is at least one of CO 2 concentration, CO concentration, H 2 O concentration, or THC concentration,
In the case of machine learning O 2 correlation data as the specific component correlation data, the individual component concentration is at least one of CO 2 concentration, CO concentration, H 2 O concentration, THC concentration, or NO concentration. Item 6. The machine learning device according to any one of Items 1 to 5. - 前記教師データ受付部は、前記排ガス分析装置とは異なる分析計により得られたTHC濃度の基準値と、前記スペクトルデータと含む教師データを受け付けるものであり、
前記機械学習部は、前記THC濃度の基準値と前記スペクトルデータとの関係を機械学習してTHC相関データを生成する、請求項1乃至6の何れか一項に記載の機械学習装置。 The teacher data receiving unit receives teacher data including a reference value of THC concentration obtained by an analyzer different from the exhaust gas analyzer and the spectrum data,
The machine learning device according to any one of claims 1 to 6, wherein the machine learning unit machine-learns a relationship between the THC concentration reference value and the spectrum data to generate THC correlation data. - 前記個別成分濃度は、THC濃度を含むものであり、当該THC濃度は、前記スペクトルデータと前記THC相関データとから求められたものである、請求項7に記載の機械学習装置。 The machine learning device according to claim 7, wherein the individual component concentrations include THC concentrations, and the THC concentrations are obtained from the spectral data and the THC correlation data.
- 燃焼排ガスを分析する排ガス分析装置であって、
前記燃焼排ガスに光を照射する光源と、
前記燃焼排ガスを透過した光を検出する光検出器と、
請求項1乃至8の何れか一項に記載の機械学習装置により生成された特定成分相関データを格納する特定成分相関データ格納部と、
前記スペクトルデータ、前記個別成分濃度、又は、前記特定成分濃度の演算値の少なくとも1つと、前記特定成分相関データとから、前記燃焼排ガス中の特定成分濃度を算出する特定成分濃度算出部とを備える、排ガス分析装置。 An exhaust gas analyzer for analyzing combustion exhaust gas,
a light source that irradiates the combustion exhaust gas with light;
a photodetector that detects light transmitted through the combustion exhaust gas;
a specific component correlation data storage unit for storing specific component correlation data generated by the machine learning device according to any one of claims 1 to 8;
a specific component concentration calculation unit that calculates the specific component concentration in the combustion exhaust gas from at least one of the spectrum data, the individual component concentration, or the calculated value of the specific component concentration, and the specific component correlation data. , flue gas analyzer. - 前記燃焼排ガスが自動車の排ガスである、請求項9に記載の排ガス分析装置。 The exhaust gas analyzer according to claim 9, wherein the combustion exhaust gas is automobile exhaust gas.
- フーリエ変換型赤外分光法を用いたものである、請求項9又は10に記載の排ガス分析装置。 The exhaust gas analyzer according to claim 9 or 10, which uses Fourier transform infrared spectroscopy.
- 燃焼排ガスに光を照射して前記燃焼排ガスを透過した光を検出し、その検出信号に基づいて前記燃焼排ガスを分析する排ガス分析装置に用いられる機械学習方法であって、
教師データを受け付ける教師データ受付ステップと、
前記教師データを用いて機械学習する機械学習ステップとを備え、
前記教師データ受付ステップは、
前記排ガス分析装置とは異なる分析計により得られたH2濃度又はO2濃度の少なくとも1つである特定成分濃度の基準値と、
前記燃焼排ガスに光を照射して得られたスペクトルデータ、又は前記特定成分濃度を求めるための元素バランス式に基づいて選択された個別成分濃度、又は、前記元素バランス式に前記個別成分濃度を用いて演算された特定成分濃度の演算値の少なくとも1つと、を含む教師データを受け付け、
前記機械学習ステップは、
前記特定成分濃度の基準値と、
前記スペクトルデータ、前記個別成分濃度、又は、前記特定成分濃度の演算値の少なくとも1つとの関係を機械学習して特定成分相関データを生成する、機械学習方法。 A machine learning method used in an exhaust gas analyzer that irradiates light on a combustion exhaust gas, detects light transmitted through the combustion exhaust gas, and analyzes the combustion exhaust gas based on the detection signal,
a teaching data receiving step for receiving teaching data;
A machine learning step of performing machine learning using the teacher data,
The teacher data receiving step includes:
a reference value of specific component concentration, which is at least one of H 2 concentration or O 2 concentration, obtained by an analyzer different from the exhaust gas analyzer;
Spectral data obtained by irradiating the combustion exhaust gas with light, or individual component concentrations selected based on the element balance formula for determining the specific component concentration, or using the individual component concentrations in the element balance formula receiving teacher data containing at least one of the calculated values of the specific component concentration calculated by
The machine learning step includes:
a reference value for the specific component concentration;
A machine learning method for generating specific component correlation data by machine-learning a relationship with at least one of the spectrum data, the individual component concentration, or the specific component concentration calculated value. - 燃焼排ガスに光を照射して前記燃焼排ガスを透過した光を検出し、その検出信号に基づいて前記燃焼排ガスを分析する排ガス分析装置に用いられる機械学習プログラムであって、
教師データを受け付ける教師データ受付部としての機能と、
前記教師データを用いて機械学習する機械学習部としての機能とをコンピュータに備えさせ、
前記教師データ受付部は、
前記排ガス分析装置とは異なる分析計により得られたH2濃度又はO2濃度の少なくとも1つである特定成分濃度の基準値と、
前記燃焼排ガスに光を照射して得られたスペクトルデータ、又は前記特定成分濃度を求めるための元素バランス式に基づいて選択された個別成分濃度、又は、前記元素バランス式に前記個別成分濃度を用いて演算された特定成分濃度の演算値の少なくとも1つと、を含む教師データを受け付けるものであり、
前記機械学習部は、前記特定成分濃度の基準値と、前記スペクトルデータ、前記個別成分濃度、又は、前記特定成分濃度の演算値の少なくとも1つとの関係を機械学習して特定成分相関データを生成するものである、機械学習プログラム。 A machine learning program used in an exhaust gas analyzer that irradiates light on combustion exhaust gas, detects light transmitted through the combustion exhaust gas, and analyzes the combustion exhaust gas based on the detection signal,
a function as a training data reception unit that receives training data;
Equipping a computer with a function as a machine learning unit that performs machine learning using the teacher data,
The training data reception unit
a reference value of specific component concentration, which is at least one of H 2 concentration or O 2 concentration, obtained by an analyzer different from the exhaust gas analyzer;
Spectral data obtained by irradiating the combustion exhaust gas with light, or individual component concentrations selected based on the element balance formula for determining the specific component concentration, or using the individual component concentrations in the element balance formula and at least one of the calculated values of the concentration of the specific component calculated by
The machine learning unit generates specific component correlation data by machine-learning a relationship between the reference value of the specific component concentration and at least one of the spectral data, the individual component concentration, or the calculated value of the specific component concentration. A machine learning program that - 燃焼排ガスに光を照射する光源と、前記燃焼排ガスを透過した光を検出する光検出器とを用いて燃焼排ガスを分析する排ガス分析方法であって、
請求項1乃至8の何れか一項に記載の機械学習装置により生成された特定成分相関データを用い、前記スペクトルデータ、前記個別成分濃度、又は前記特定成分濃度の演算値の少なくとも1つと、前記特定成分相関データとから、前記燃焼排ガス中の特定成分濃度を算出する、排ガス分析方法。 A flue gas analysis method for analyzing flue gas using a light source for irradiating the flue gas with light and a photodetector for detecting light transmitted through the flue gas,
Using the specific component correlation data generated by the machine learning device according to any one of claims 1 to 8, at least one of the spectrum data, the individual component concentration, or the calculated value of the specific component concentration; A method for analyzing exhaust gas, wherein the specific component concentration in the combustion exhaust gas is calculated from the specific component correlation data. - 燃焼排ガスに光を照射する光源と、前記燃焼排ガスを透過した光を検出する光検出器とを用いた排ガス分析装置に用いられる排ガス分析プログラムであって、
請求項1乃至8の何れか一項に記載の機械学習装置により生成された特定成分相関データを格納する特定成分相関データ格納部としての機能と、
前記スペクトルデータ、前記個別成分濃度、又は前記特定成分濃度の演算値の少なくとも1つと、前記特定成分相関データとから、前記燃焼排ガス中の特定成分濃度を算出する特定成分濃度算出部としての機能とをコンピュータに備えさせる、排ガス分析プログラム。 An exhaust gas analysis program used in an exhaust gas analyzer using a light source for irradiating light on combustion exhaust gas and a photodetector for detecting light transmitted through the combustion exhaust gas,
A function as a specific component correlation data storage unit that stores specific component correlation data generated by the machine learning device according to any one of claims 1 to 8;
A function as a specific component concentration calculation unit that calculates the specific component concentration in the combustion exhaust gas from at least one of the spectrum data, the individual component concentration, or the calculated value of the specific component concentration, and the specific component correlation data; An exhaust gas analysis program that provides a computer with
Applications Claiming Priority (2)
| Application Number | Priority Date | Filing Date | Title |
|---|---|---|---|
| JP2021-213871 | 2021-12-28 | ||
| JP2021213871 | 2021-12-28 |
Publications (1)
| Publication Number | Publication Date |
|---|---|
| WO2023127262A1 true WO2023127262A1 (en) | 2023-07-06 |
Family
ID=86998617
Family Applications (1)
| Application Number | Title | Priority Date | Filing Date |
|---|---|---|---|
| PCT/JP2022/039964 WO2023127262A1 (en) | 2021-12-28 | 2022-10-26 | Machine learning device, exhaust gas analysis device, machine learning method, exhaust gas analysis method, machine learning program, and exhaust gas analysis program |
Country Status (1)
| Country | Link |
|---|---|
| WO (1) | WO2023127262A1 (en) |
Cited By (1)
| Publication number | Priority date | Publication date | Assignee | Title |
|---|---|---|---|---|
| CN117233120A (en) * | 2023-11-14 | 2023-12-15 | 山东大学 | Polluted gas detection method and system based on machine learning and hyperspectral image |
Citations (6)
| Publication number | Priority date | Publication date | Assignee | Title |
|---|---|---|---|---|
| WO2018136911A1 (en) * | 2017-01-23 | 2018-07-26 | Honeywell International Inc. | Equipment and method for three-dimensional radiance and gas species field estimation in an open combustion environment |
| WO2018165029A1 (en) * | 2017-03-06 | 2018-09-13 | Ion Engineering, Llc | Carbon dioxide capture system and spectroscopic evaluation thereof |
| WO2019031331A1 (en) * | 2017-08-07 | 2019-02-14 | 株式会社堀場製作所 | Analyzer, analysis method, analyzer program, and analysis learning device |
| JP2020094990A (en) * | 2018-12-14 | 2020-06-18 | 株式会社堀場製作所 | Optical analyzer, machine learning device used for optical analyzer, and method thereof |
| JP2020201097A (en) * | 2019-06-07 | 2020-12-17 | 株式会社堀場製作所 | Exhaust gas analysis device, exhaust gas analysis method, program for exhaust gas analysis, and machine learning device |
| JP2021004765A (en) * | 2019-06-25 | 2021-01-14 | 株式会社堀場製作所 | Analyzer, analysis method and program for analyzer |
-
2022
- 2022-10-26 WO PCT/JP2022/039964 patent/WO2023127262A1/en active Application Filing
Patent Citations (6)
| Publication number | Priority date | Publication date | Assignee | Title |
|---|---|---|---|---|
| WO2018136911A1 (en) * | 2017-01-23 | 2018-07-26 | Honeywell International Inc. | Equipment and method for three-dimensional radiance and gas species field estimation in an open combustion environment |
| WO2018165029A1 (en) * | 2017-03-06 | 2018-09-13 | Ion Engineering, Llc | Carbon dioxide capture system and spectroscopic evaluation thereof |
| WO2019031331A1 (en) * | 2017-08-07 | 2019-02-14 | 株式会社堀場製作所 | Analyzer, analysis method, analyzer program, and analysis learning device |
| JP2020094990A (en) * | 2018-12-14 | 2020-06-18 | 株式会社堀場製作所 | Optical analyzer, machine learning device used for optical analyzer, and method thereof |
| JP2020201097A (en) * | 2019-06-07 | 2020-12-17 | 株式会社堀場製作所 | Exhaust gas analysis device, exhaust gas analysis method, program for exhaust gas analysis, and machine learning device |
| JP2021004765A (en) * | 2019-06-25 | 2021-01-14 | 株式会社堀場製作所 | Analyzer, analysis method and program for analyzer |
Cited By (2)
| Publication number | Priority date | Publication date | Assignee | Title |
|---|---|---|---|---|
| CN117233120A (en) * | 2023-11-14 | 2023-12-15 | 山东大学 | Polluted gas detection method and system based on machine learning and hyperspectral image |
| CN117233120B (en) * | 2023-11-14 | 2024-02-09 | 山东大学 | Polluted gas detection method and system based on machine learning and hyperspectral image |
Similar Documents
| Publication | Publication Date | Title |
|---|---|---|
| JP6983244B2 (en) | Analytical device, analysis method, program for analyzer and learning device for analysis | |
| Suarez-Bertoa et al. | Intercomparison of real-time tailpipe ammonia measurements from vehicles tested over the new world-harmonized light-duty vehicle test cycle (WLTC) | |
| WO2023127262A1 (en) | Machine learning device, exhaust gas analysis device, machine learning method, exhaust gas analysis method, machine learning program, and exhaust gas analysis program | |
| JP6967387B2 (en) | Gas analyzers, programs for gas analyzers, and gas analysis methods | |
| JP2000346801A5 (en) | ||
| JP5809961B2 (en) | Sample gas analyzer and program for sample gas analyzer | |
| US11448589B2 (en) | Analyzer, analysis method, and a program recording medium recorded with a program for analyzer | |
| JP5424636B2 (en) | Gas analyzer using FTIR method and program used therefor | |
| Kawai et al. | Compressive dual-comb spectroscopy | |
| JP7461948B2 (en) | Sample gas analyzer, sample gas analysis method, and sample gas analysis program | |
| Herget et al. | Progress in the prototype development of a new multicomponent exhaust gas sampling and analyzing system | |
| Adachi et al. | Automotive emission analyses using FTIR spectrophotometer | |
| JP7335727B2 (en) | Exhaust gas analyzer, exhaust gas analysis method, exhaust gas analysis program and machine learning device | |
| CN111912804B (en) | Ultraviolet spectrum detection method and device for monitoring trace sulfur dioxide in blast furnace flue gas | |
| US20210318280A1 (en) | System and computer-implemented method for extrapolating calibration spectra | |
| JP2649667B2 (en) | Multi-component analysis method in spectroscopic analysis | |
| WO2022014126A1 (en) | Analysis device, analysis method, program for analysis device, learning device for analysis, learning method for analysis, and program for learning device for analysis | |
| Butler et al. | A system for on-line measurement of multicomponent emissions and engine operating parameters | |
| JPH04262237A (en) | Exhaust-gas analyzing apparatus for vehicle engine using ftir | |
| JPWO2019012773A1 (en) | Gas analyzer, gas analyzer program, and gas analysis method | |
| Eichmann | Precise Exhaust Gas Measurement Based on Laser Spectroscopy | |
| Jaeger | Robust on-line engine exhaust methane measurements using wavelength modulation spectroscopy | |
| CN116235034A (en) | Exhaust gas analysis device, exhaust gas analysis method, and program storage medium for exhaust gas analysis device | |
| JPH0815253A (en) | Exhaust gas weight measuring method using trace gas | |
| Smolarz et al. | Mathematical model of radiation interaction with gas |
Legal Events
| Date | Code | Title | Description |
|---|---|---|---|
| 121 | Ep: the epo has been informed by wipo that ep was designated in this application |
Ref document number: 22915496 Country of ref document: EP Kind code of ref document: A1 |
|
| WWE | Wipo information: entry into national phase |
Ref document number: 2023570679 Country of ref document: JP |