WO2023127262A1 - Dispositif d'apprentissage automatique, dispositif d'analyse de gaz d'échappement, procédé d'apprentissage automatique, procédé d'analyse de gaz d'échappement, programme d'apprentissage automatique et programme d'analyse de gaz d'échappement - Google Patents
Dispositif d'apprentissage automatique, dispositif d'analyse de gaz d'échappement, procédé d'apprentissage automatique, procédé d'analyse de gaz d'échappement, programme d'apprentissage automatique et programme d'analyse de gaz d'échappement Download PDFInfo
- Publication number
- WO2023127262A1 WO2023127262A1 PCT/JP2022/039964 JP2022039964W WO2023127262A1 WO 2023127262 A1 WO2023127262 A1 WO 2023127262A1 JP 2022039964 W JP2022039964 W JP 2022039964W WO 2023127262 A1 WO2023127262 A1 WO 2023127262A1
- Authority
- WO
- WIPO (PCT)
- Prior art keywords
- concentration
- exhaust gas
- machine learning
- specific component
- data
- Prior art date
Links
- 238000010801 machine learning Methods 0.000 title claims abstract description 134
- 238000004868 gas analysis Methods 0.000 title claims abstract description 10
- 238000000034 method Methods 0.000 title claims description 13
- 238000001228 spectrum Methods 0.000 claims abstract description 68
- 230000001678 irradiating effect Effects 0.000 claims abstract description 21
- 238000012549 training Methods 0.000 claims abstract description 19
- 238000001514 detection method Methods 0.000 claims abstract description 12
- 239000007789 gas Substances 0.000 claims description 167
- 238000002485 combustion reaction Methods 0.000 claims description 64
- 238000013500 data storage Methods 0.000 claims description 53
- 230000003595 spectral effect Effects 0.000 claims description 43
- 238000004364 calculation method Methods 0.000 claims description 26
- UGFAIRIUMAVXCW-UHFFFAOYSA-N Carbon monoxide Chemical compound [O+]#[C-] UGFAIRIUMAVXCW-UHFFFAOYSA-N 0.000 claims description 14
- 239000003546 flue gas Substances 0.000 claims description 14
- 238000005033 Fourier transform infrared spectroscopy Methods 0.000 claims description 13
- 230000006870 function Effects 0.000 claims description 11
- 238000012545 processing Methods 0.000 description 21
- 238000005259 measurement Methods 0.000 description 17
- 238000010586 diagram Methods 0.000 description 11
- 238000004458 analytical method Methods 0.000 description 10
- 239000000446 fuel Substances 0.000 description 8
- 229930195733 hydrocarbon Natural products 0.000 description 7
- 150000002430 hydrocarbons Chemical class 0.000 description 7
- 229910052760 oxygen Inorganic materials 0.000 description 7
- 238000000862 absorption spectrum Methods 0.000 description 6
- XLYOFNOQVPJJNP-UHFFFAOYSA-N water Chemical compound O XLYOFNOQVPJJNP-UHFFFAOYSA-N 0.000 description 6
- 239000004215 Carbon black (E152) Substances 0.000 description 5
- MCMNRKCIXSYSNV-UHFFFAOYSA-N Zirconium dioxide Chemical compound O=[Zr]=O MCMNRKCIXSYSNV-UHFFFAOYSA-N 0.000 description 4
- 239000000126 substance Substances 0.000 description 4
- 238000012360 testing method Methods 0.000 description 4
- 238000010521 absorption reaction Methods 0.000 description 3
- 238000004566 IR spectroscopy Methods 0.000 description 2
- 229910000661 Mercury cadmium telluride Inorganic materials 0.000 description 2
- 230000000694 effects Effects 0.000 description 2
- 238000005070 sampling Methods 0.000 description 2
- LFQSCWFLJHTTHZ-UHFFFAOYSA-N Ethanol Chemical compound CCO LFQSCWFLJHTTHZ-UHFFFAOYSA-N 0.000 description 1
- WSFSSNUMVMOOMR-UHFFFAOYSA-N Formaldehyde Chemical compound O=C WSFSSNUMVMOOMR-UHFFFAOYSA-N 0.000 description 1
- JCXJVPUVTGWSNB-UHFFFAOYSA-N Nitrogen dioxide Chemical compound O=[N]=O JCXJVPUVTGWSNB-UHFFFAOYSA-N 0.000 description 1
- QVGXLLKOCUKJST-UHFFFAOYSA-N atomic oxygen Chemical compound [O] QVGXLLKOCUKJST-UHFFFAOYSA-N 0.000 description 1
- 239000000919 ceramic Substances 0.000 description 1
- 239000000470 constituent Substances 0.000 description 1
- 235000019441 ethanol Nutrition 0.000 description 1
- 230000010365 information processing Effects 0.000 description 1
- 238000009434 installation Methods 0.000 description 1
- PNDPGZBMCMUPRI-UHFFFAOYSA-N iodine Chemical compound II PNDPGZBMCMUPRI-UHFFFAOYSA-N 0.000 description 1
- 229910052740 iodine Inorganic materials 0.000 description 1
- 239000011630 iodine Substances 0.000 description 1
- 238000012417 linear regression Methods 0.000 description 1
- VNWKTOKETHGBQD-UHFFFAOYSA-N methane Chemical compound C VNWKTOKETHGBQD-UHFFFAOYSA-N 0.000 description 1
- 238000012986 modification Methods 0.000 description 1
- 230000004048 modification Effects 0.000 description 1
- 238000001745 non-dispersive infrared spectroscopy Methods 0.000 description 1
- 239000001301 oxygen Substances 0.000 description 1
- 230000002093 peripheral effect Effects 0.000 description 1
- WFKWXMTUELFFGS-UHFFFAOYSA-N tungsten Chemical compound [W] WFKWXMTUELFFGS-UHFFFAOYSA-N 0.000 description 1
- 229910052721 tungsten Inorganic materials 0.000 description 1
- 239000010937 tungsten Substances 0.000 description 1
Images


Classifications
-
- G—PHYSICS
- G01—MEASURING; TESTING
- G01N—INVESTIGATING OR ANALYSING MATERIALS BY DETERMINING THEIR CHEMICAL OR PHYSICAL PROPERTIES
- G01N21/00—Investigating or analysing materials by the use of optical means, i.e. using sub-millimetre waves, infrared, visible or ultraviolet light
- G01N21/17—Systems in which incident light is modified in accordance with the properties of the material investigated
- G01N21/25—Colour; Spectral properties, i.e. comparison of effect of material on the light at two or more different wavelengths or wavelength bands
- G01N21/31—Investigating relative effect of material at wavelengths characteristic of specific elements or molecules, e.g. atomic absorption spectrometry
- G01N21/35—Investigating relative effect of material at wavelengths characteristic of specific elements or molecules, e.g. atomic absorption spectrometry using infrared light
- G01N21/3504—Investigating relative effect of material at wavelengths characteristic of specific elements or molecules, e.g. atomic absorption spectrometry using infrared light for analysing gases, e.g. multi-gas analysis
Definitions
- the present invention relates to a machine learning device, an exhaust gas analyzer, a machine learning method, an exhaust gas analysis method, a machine learning program, and an exhaust gas analysis program.
- an FTIR analyzer using Fourier transform infrared spectroscopy has been used to analyze components contained in exhaust gas, as shown in Patent Document 1.
- FTIR Fourier transform infrared spectroscopy
- the FTIR spectrometer can analyze components that absorb infrared rays, it cannot analyze components that do not absorb infrared rays. Therefore, when measuring the concentration of H 2 that does not absorb infrared rays, a dedicated H 2 analyzer such as a thermal conductivity gas analyzer (TCD) is required in addition to the FTIR analyzer. Moreover, when measuring the concentration of O 2 that does not absorb infrared rays, a dedicated O 2 analyzer such as a zirconia sensor is required in addition to the FTIR analyzer. As a result, installation space for both the FTIR analyzer and the H 2 analyzer or O 2 analyzer is required, resulting in an increase in the size of the exhaust gas analyzer. Such problems can occur not only in FTIR analyzers but also in other exhaust gas analyzers using light.
- TCD thermal conductivity gas analyzer
- the present invention has been made in view of the above-described problems, and provides an exhaust gas analyzer capable of measuring H 2 concentration or O 2 concentration, which had to be measured using another analyzer. is the main subject.
- the machine learning device is a machine learning device used in an exhaust gas analyzer that irradiates a combustion exhaust gas with light, detects the light transmitted through the combustion exhaust gas, and analyzes the combustion exhaust gas based on the detection signal.
- An apparatus comprising a training data reception unit that receives training data and a machine learning unit that performs machine learning using the training data, wherein the training data reception unit is obtained by an analyzer different from the exhaust gas analyzer.
- the machine learning unit Based on the reference value of the specific component concentration which is at least one of the H 2 concentration or O 2 concentration, the spectral data obtained by irradiating the combustion exhaust gas with light, and the element balance formula for obtaining the specific component concentration or at least one of the calculated values of the specific component concentration calculated using the individual component concentration in the element balance formula, and the machine learning unit generates specific component correlation data by machine-learning the relationship between the reference value of the specific component concentration and at least one of the spectral data, the individual component concentration, or the calculated value of the specific component concentration. It is characterized by
- the reference value of the specific component concentration that is at least one of the H 2 concentration or the O 2 concentration, the spectrum data obtained by irradiating the combustion exhaust gas with light, and the specific component concentration By machine learning the relationship between at least one of the individual component concentration selected based on the element balance formula or the calculated value of the specific component concentration calculated using the individual component concentration in the element balance formula, the machine Using a machine learning model generated by learning, spectrum data obtained by irradiating light on combustion exhaust gas, individual component concentration obtained by exhaust gas analyzer, or calculated from individual component concentration and element balance formula
- the specific component concentration can be calculated from at least one of the calculated values of the specific component concentration.
- the H 2 concentration or O 2 concentration which had to be measured using another analyzer in the exhaust gas analyzer, can be measured.
- the H 2 concentration or O 2 concentration that does not absorb infrared light can be measured.
- the teacher data receiving unit receives teacher data including the reference value of the specific component concentration and the spectrum data
- the machine learning unit receives the specific component concentration It is preferable that machine learning is performed on the relationship between the reference value of and the spectrum data to generate the specific component correlation data.
- the teacher data receiving unit further receives the individual component concentration as teacher data
- the machine learning unit receives the specific It is preferable that the specific component correlation data be generated by machine learning of the relationship between the component concentration reference value, the spectrum data, and the individual component concentration.
- the error between the reference value of the specific component concentration and the calculated value of the specific component concentration is calculated.
- calculating the minimized error minimum value and generating, as part of the specific component correlation data, first correlation data indicating the correlation between the minimum error value and a parameter used to calculate the minimum error value;
- a correlation data generation unit machine-learns the relationship between the spectral data and the minimum error value, and generates second correlation data indicating the correlation between the spectral data and the minimum error value as part of the specific component correlation data. It is desirable to have a second correlation data generator that generates the second correlation data generator.
- the teacher data receiving unit receives teacher data including the reference value of the concentration of the specific component and the concentration of the individual component, and the machine learning unit receives the specific component It is preferable that the specific component correlation data be generated by machine learning the relationship between the concentration reference value and the individual component concentration.
- the individual component concentration may be at least one of CO 2 concentration, CO concentration, H 2 O concentration, or THC concentration. Further, when machine learning is performed on O 2 correlation data as the specific component correlation data, the individual component concentration is at least one of CO 2 concentration, CO concentration, H 2 O concentration, THC concentration, or NO concentration. can be considered.
- the concentration of each hydrocarbon (HC) is obtained individually from the spectral data, and then weighted and added together. A two-stage calculation is performed, and an error that may occur in setting the weighting coefficient is superimposed on an error that may occur in the concentration measurement of each HC. Therefore, it is difficult to improve the measurement accuracy.
- the teacher data reception unit receives teacher data including the reference value of the THC concentration obtained by an analyzer different from the exhaust gas analyzer and the spectrum data. It is preferable that the machine learning unit machine-learns the relationship between the THC concentration reference value and the spectrum data to generate THC correlation data.
- the individual component concentration includes the THC concentration, and it is desirable that the THC concentration be obtained from the spectral data obtained by the exhaust gas analyzer and the THC correlation data.
- an exhaust gas analyzer for analyzing combustion exhaust gas, comprising: a light source for irradiating the combustion exhaust gas with light; a photodetector for detecting light transmitted through the combustion exhaust gas; Specific component concentration which is at least one of H 2 concentration or O 2 concentration in combustion exhaust gas, spectrum data obtained by irradiating the combustion exhaust gas with light, element balance formula for obtaining the specific component concentration Specific component correlation storing specific component correlation data obtained by learning a relationship between at least one of the individual component concentration selected by the method and the calculated value of the specific component concentration calculated using the individual component concentration in the element balance formula Specific component concentration for calculating the specific component concentration in the flue gas from a data storage unit, at least one of the spectrum data, the individual component concentration, or the calculated value of the specific component concentration, and the specific component correlation data. and a calculator.
- the specific component concentration which is at least one of the H 2 concentration or O 2 concentration in the combustion exhaust gas, the spectrum data obtained by irradiating the combustion exhaust gas with light, and the specific component concentration are obtained.
- Specific component correlation data machine learning Spectral data obtained by irradiating the combustion exhaust gas with light using a model
- individual component concentrations obtained by an exhaust gas analyzer or calculated values of specific component concentrations calculated from individual component concentrations and elemental balance equations From at least one of, the specific component concentration can be calculated.
- the H 2 concentration or O 2 concentration that would otherwise have to be measured using another analyzer can be measured in the analyzer.
- the H 2 concentration or O 2 concentration that does not absorb infrared light can be measured.
- the exhaust gas analyzer of the present invention further includes a THC correlation data storage unit for storing THC correlation data obtained by learning the relationship between the THC concentration reference value obtained by an analyzer different from the exhaust gas analyzer and the spectrum data, It is desirable to further include a THC concentration calculation section for calculating the THC concentration in the combustion exhaust gas from the spectral data obtained by irradiating the combustion exhaust gas with light and the THC correlation data. With this configuration, the THC concentration in the combustion exhaust gas can be measured with high accuracy.
- the individual component concentration includes the THC concentration, and the THC concentration is calculated by the THC concentration calculating section.
- the learned model storage unit stores the specific component concentration a first correlation data storage unit for storing first correlation data indicating the correlation between the minimum error value between the reference value of and the calculated value of the concentration of the specific component and the parameter used to calculate the minimum error value; a second correlation data storage unit that stores second correlation data indicating the correlation between the data and the minimum error value, and the specific component concentration calculation unit calculates the It is desirable to calculate the specific component concentration in the combustion exhaust gas from a minimum error value calculating section for calculating the minimum error value, and the minimum error value obtained by the minimum error value calculating section and the first correlation data.
- the combustion exhaust gas may be exhaust gas from an automobile.
- a so-called FTIR method is preferable.
- the machine learning method according to the present invention is a machine learning method used in an exhaust gas analyzer that irradiates light on combustion exhaust gas, detects light that has passed through the combustion exhaust gas, and analyzes the combustion exhaust gas based on the detection signal.
- a method comprising a teacher data receiving step of receiving teacher data and a machine learning step of performing machine learning using the teacher data, wherein the teacher data receiving step is obtained by an analyzer different from the exhaust gas analyzer.
- a reference value for the specific component concentration which is at least one of H 2 concentration or O 2 concentration, spectral data obtained by irradiating the combustion exhaust gas with light, or an element balance formula for obtaining the specific component concentration receiving teacher data containing at least one of the individual component concentrations selected based on the element balance formula or the calculated value of the specific component concentration calculated using the individual component concentrations in the element balance formula, and the machine learning step
- the specific component correlation data is generated by machine-learning a relationship between the reference value of the specific component concentration and at least one of the spectral data, the individual component concentration, or the calculated value of the specific component concentration.
- the machine learning program according to the present invention is a machine used in an exhaust gas analyzer that irradiates light on combustion exhaust gas, detects light that has passed through the combustion exhaust gas, and analyzes the combustion exhaust gas based on the detection signal.
- a learning program wherein a computer is provided with a function as a training data reception unit that receives training data and a function as a machine learning unit that performs machine learning using the training data, and the training data reception unit receives the exhaust gas
- a reference value for the specific component concentration which is at least one of H 2 concentration or O 2 concentration, obtained by an analyzer different from the analysis device, spectral data obtained by irradiating the combustion exhaust gas with light, or the specific
- a teacher containing at least one of individual component concentrations selected based on an element balance formula for obtaining component concentrations, or a calculated value of a specific component concentration calculated using the individual component concentrations in the element balance formula
- the machine learning unit machine-learns the relationship between the reference value of the concentration of the specific component and at least one
- the exhaust gas analysis method is a method for analyzing combustion exhaust gas using a light source for irradiating the combustion exhaust gas with light and a photodetector for detecting light transmitted through the combustion exhaust gas.
- a specific component concentration that is at least one of H 2 concentration or O 2 concentration in the flue gas, spectrum data obtained by irradiating the flue gas with light, or an element balance for obtaining the specific component concentration
- specific component correlation data obtained by learning a relationship between at least one of individual component concentrations selected based on the formula and calculated values of specific component concentrations calculated using the individual component concentrations in the element balance formula
- the specific component concentration in the flue gas is calculated from at least one of the spectrum data, the individual component concentration, or the calculated value of the specific component concentration, and the specific component correlation data.
- an exhaust gas analysis program is an exhaust gas analysis program used in an exhaust gas analyzer using a light source for irradiating light on combustion exhaust gas and a photodetector for detecting light transmitted through the combustion exhaust gas.
- a specific component concentration that is at least one of H 2 concentration or O 2 concentration in the flue gas, spectral data obtained by irradiating the flue gas with light, or obtaining the specific component concentration
- Specific component correlation data obtained by learning a relationship between at least one of individual component concentrations selected based on an element balance formula, or a calculated value of a specific component concentration calculated using the individual component concentrations in the element balance formula.
- the computer is provided with a function as a specific component concentration calculation unit that calculates the concentration.
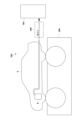
- FIG. 1 is an overall view of an exhaust gas measurement system including an exhaust gas analyzer according to one embodiment of the present invention
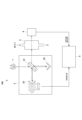
- FIG. It is a schematic diagram which shows the whole exhaust gas analyzer in the same embodiment.
- It is a basic functional block diagram of the arithmetic processing unit in the same embodiment.
- It is a functional block diagram of the machine learning device in the same embodiment.
- It is a functional block diagram of the arithmetic processing unit in the same embodiment.
- FIG. 11 is a functional block diagram of a machine learning device in a modified embodiment;
- FIG. 11 is a functional block diagram of a machine learning device in a modified embodiment;
- FIG. 11 is a functional block diagram of a machine learning device in a modified embodiment; It is a functional block diagram of an arithmetic processing unit in a modified embodiment. It is a functional block diagram of an arithmetic processing unit in a modified embodiment. FIG. 11 is a functional block diagram of a machine learning device in a modified embodiment;
- the exhaust gas analyzer 100 of this embodiment constitutes a part of the exhaust gas measurement system 200, for example.
- this exhaust gas measurement system 200 includes a chassis dynamo 300 and exhaust gas sampling for sampling combustion exhaust gas (hereinafter simply referred to as "exhaust gas") of a vehicle V, which is a test vehicle running on the chassis dynamo 300. It comprises an apparatus 400 and an analysis apparatus 100 that analyzes the measurement target component in the sampled exhaust gas.
- the exhaust gas analyzer 100 is equipped with an infrared light source 1, an interferometer (spectroscopic unit) 2, a measurement cell 3, a photodetector 4, an arithmetic processing unit 5, and the like. It is an infrared gas analyzer using infrared spectroscopy (FTIR).
- FTIR infrared spectroscopy
- the infrared light source 1 emits infrared light having a broad spectrum (continuous light including light of many wavenumbers), and uses, for example, a tungsten/iodine lamp or a high-brightness ceramic light source.
- the interferometer 2 uses a so-called Michelson interferometer, which includes a half mirror (beam splitter) 21, a fixed mirror 22 and a movable mirror 23, as shown in the figure.
- Light from the infrared light source 1 incident on the interferometer 2 is split by a half mirror 21 into reflected light and transmitted light.
- One light is reflected by the fixed mirror 22 , the other is reflected by the movable mirror 23 , returns to the half mirror 21 again, is synthesized, and exits from the interferometer 2 .
- the measurement cell 3 is a transparent cell into which the sampled exhaust gas is introduced.
- the photodetector 4 detects infrared light that has passed through the exhaust gas and outputs the detection signal (light intensity signal) to the arithmetic processing device 5 .
- the photodetector 4 of this embodiment is, for example, an MCT (HgCdTe) detector, but may be a photodetector having other infrared detection elements.
- the arithmetic processing unit 5 has, for example, an analog electric circuit having a buffer, an amplifier, etc., a digital electric circuit having a CPU, a memory, a DSP, etc., and an A/D converter interposed therebetween. be.
- the arithmetic processing unit 5 functions as a main analysis unit 51 as shown in FIG.
- the main analysis unit 51 calculates transmitted light spectrum data representing the spectrum of light transmitted through the exhaust gas from the detection signal (light intensity signal) of the photodetector 4, and calculates infrared absorption spectrum data from the transmitted light spectrum data. , to identify various components in the exhaust gas and to calculate the concentration of each component.
- the main analysis unit 51 includes a spectral data generation unit 511 and an individual component analysis unit 512.
- the movable mirror 23 When the movable mirror 23 is advanced and retreated and the intensity of the light transmitted through the exhaust gas is observed with the position of the movable mirror 23 as the horizontal axis, in the case of light with a single wave number, the light intensity draws a sine curve due to interference.
- the sine curve since the actual light that has passed through the exhaust gas is continuous light, the sine curve differs for each wavenumber, and the actual light intensity is a superposition of the sine curves drawn by each wavenumber, and the interference pattern (interferogram) is form a wave packet.
- the spectrum data generation unit 511 obtains the position of the movable mirror 23 by a rangefinder (not shown) such as a HeNe laser (not shown), and obtains the light intensity at each position of the movable mirror 23 by the photodetector 4.
- FFT Fast Fourier transform
- the individual component analysis unit 512 determines various components (eg, CO, CO 2 , NO, H 2 O, NO 2 , or hydrocarbon component (HC), etc.) is specified, the concentration of each component is calculated, and this is output as individual component concentration data.
- various components eg, CO, CO 2 , NO, H 2 O, NO 2 , or hydrocarbon component (HC), etc.
- the machine learning device 6 of the present embodiment performs machine learning by utilizing the fact that the H 2 concentration and the O 2 concentration can be estimated using the element balance formula obtained from the fuel combustion formula shown below. From the following elemental balance formula (conservation law of substance amount), the H2 concentration can be linearly regressed with the concentrations of the components ( CO2 , CO, H2O , THC), and the O2 concentration can be linearly regressed with the concentrations of the components ( CO2 , CO , H 2 O, THC, NO) can be linearly regressed. Moreover, since the H 2 concentration and the O 2 concentration can be estimated from the individual component concentrations, they can also be estimated from the spectral data for obtaining these individual component concentrations.
- At least one of CO 2 concentration, CO concentration, H 2 O concentration, or THC concentration can be used as the individual component concentration when calculating the H 2 concentration.
- At least one of CO 2 concentration, CO concentration, H 2 O concentration, THC concentration, or NO concentration can be used as the individual component concentration when calculating the O 2 concentration.
- the H2 concentration can be linearly regressed with the concentrations of the components ( CO2 , CO, H2O , THC).
- the O2 concentration can be linearly regressed with the concentrations of the components ( CO2 , CO, H2O , THC, NO).
- This machine learning device 6 is a computer having a CPU, a memory, an input/output interface, an AD converter, or input means such as a keyboard, etc., and the CPU and its peripheral devices cooperate according to the machine learning program stored in the memory. As a result, as shown in FIG. 4, the functions of a teacher data receiving unit 61 that receives teacher data and a machine learning unit 62 that performs machine learning using the teacher data are exhibited.
- the machine learning device 6 may be incorporated in the arithmetic processing device 5 of the exhaust gas analyzer 100 described above, or a part of the functions of the machine learning device 6 may be provided in the arithmetic processing device 5. Also good.
- the teaching data receiving unit 61 receives the H 2 concentration reference value obtained by an H 2 analyzer (not shown) different from the infrared gas analyzer (exhaust gas analyzer) and the infrared gas analyzer (exhaust gas analyzer).
- Different teacher data including a reference value of O 2 concentration obtained by an O 2 analyzer (not shown) and spectral data obtained by an infrared gas analyzer are accepted.
- the spectral data included in this teacher data is the absorption spectral data generated by the spectral data generating section 511 of the arithmetic processing unit 5, but may be transmitted light spectral data of the exhaust gas.
- the H 2 spectrometer may be, for example, a thermal conductivity gas spectrometer (TCD) or a mass spectrometer.
- TCD thermal conductivity gas spectrometer
- a mass spectrometer for the O 2 analyzer, for example, a zirconia sensor, a magnetic oxygen concentration meter, or the like may be used.
- the machine learning unit 62 machine-learns the relationship between the H 2 concentration reference value and the spectrum data, and performs H 2 correlation data (a machine learning model for calculating H 2 concentration) that indicates the correlation between the H 2 concentration and the spectrum data. and the O2 correlation data ( O2 concentration calculation and an O 2 correlation data generator 622 that generates a machine learning model for
- the H2 correlation data (machine learning model for calculating the H2 concentration) calculated by the H2 correlation data generation unit 621 is stored in the H2 correlation data storage unit 623, and is stored in the O2 correlation data generation unit 622.
- the calculated O 2 correlation data (machine learning model for calculating O 2 concentration) is stored in the O 2 correlation data storage unit 624 .
- the exhaust gas analyzer 100 can calculate the H 2 concentration using the H 2 correlation data (machine learning model for calculating the H 2 concentration ) generated by the machine learning device 6.
- O2 concentration can be calculated using O2 correlation data (machine learning model for calculating O2 concentration).
- the arithmetic processing unit 5 of the exhaust gas analyzer 100 includes an H 2 concentration calculation unit 52 that calculates the H 2 concentration using the H 2 correlation data, and an O 2 concentration calculation unit 52 that calculates the O 2 concentration using the O 2 correlation data . and a density calculator 53 .
- the H 2 correlation data is stored in the H 2 correlation data storage unit 54
- the O 2 correlation data is stored in the O 2 correlation data storage unit 55 .
- the H2 correlation data storage unit 54 may be configured from the H2 correlation data storage unit 623 of the machine learning device 6.
- the O 2 correlation data storage unit 55 may be configured from the O 2 correlation data storage unit 624 of the machine learning device 6 .
- the H 2 concentration calculator 52 calculates the H 2 concentration in the exhaust gas from the spectrum data generated by the spectrum data generator 511 and the H 2 correlation data.
- the H 2 concentration calculation unit 52 calculates the H 2 concentration using the absorption spectrum data generated by the spectrum data generation unit 511. . Further, when the H2 correlation data is generated using the transmitted light spectrum data, the H2 concentration calculator 52 calculates the H2 concentration using the transmitted light spectrum data generated by the spectrum data generator 511. do.
- the O 2 concentration calculator 53 calculates the O 2 concentration in the combustion exhaust gas from the spectrum data generated by the spectrum data generator 511 and the O 2 correlation data.
- the O 2 concentration calculation unit 53 calculates the O 2 concentration using the absorption spectrum data generated by the spectrum data generation unit 511. . Further, when the O 2 correlation data is generated using the transmitted light spectrum data, the O 2 concentration calculation unit 53 calculates the O 2 concentration using the transmitted light spectrum data generated by the spectrum data generation unit 511. do.
- the H 2 concentration or O 2 concentration in the exhaust gas and the photodetector 4 H 2 concentration or O 2 concentration is calculated from the spectral data obtained from the detection signal of the photodetector 4 using the correlation data (machine learning model) that learned the relationship with the spectral data obtained from the detection signal of become able to.
- the correlation data machine learning model
- the teacher data receiving unit 61 obtains from the spectral data, in addition to the H 2 concentration reference value, the O 2 concentration reference value, and the spectral data as the teacher data, It may accept individual component concentrations selected based on an elemental balance equation. Then, in the machine learning unit 62, the H 2 correlation data generation unit 621 machine-learns the relationship between the H 2 concentration reference value, the spectrum data, and the individual component concentration, and calculates the H 2 concentration, the spectrum data, and the individual component concentration.
- Generate H 2 correlation data (machine learning model for calculating H 2 concentration) showing the correlation of Further, the O 2 correlation data generation unit 622 machine-learns the relationship between the reference value of the O 2 concentration, the spectrum data, and the individual component concentration, and the O 2 concentration indicating the correlation between the O 2 concentration, the spectrum data, and the individual component concentration .
- Generate correlation data (machine learning model for O2 concentration calculation). In this way, by including the individual component concentrations selected based on the element balance formula in addition to the spectral data in the teacher data, the measurement accuracy of the O 2 concentration or H 2 concentration can be improved.
- the teacher data receiving unit 61 stores the H 2 concentration reference value obtained by an H 2 analyzer different from the infrared gas analyzer (exhaust gas analyzer) and the infrared gas analyzer
- the spectral data obtained by the infrared gas analyzer (exhaust gas analyzer) and the individual components obtained from the spectral data It accepts teacher data including concentrations and
- the spectral data included in this teacher data may be transmitted light spectral data of the exhaust gas generated by the spectral data generating section 511, or may be absorption spectral data.
- the individual component concentration is the individual component concentration such as CO, CO 2 , NO, H 2 O, NO 2 or hydrocarbon component (HC) analyzed by the individual component analysis unit 512 .
- the machine learning device 6 of this embodiment estimates the calculated value (estimated value) of the H 2 concentration and the calculated value (estimated value) of the O 2 concentration using the element balance formula. That is, from the above-mentioned elemental balance formula (conservation law of substance amount), the H 2 concentration can be linearly regressed with the concentration of the component (CO 2 , CO, H 2 O, THC), and the O 2 concentration can be linearly regressed from the component (CO 2 , CO, H 2 O, THC, and NO).
- the THC concentrations a' and b' are unknown quantities, and the measured values of the individual components have not a little error. occurs. Therefore, in this embodiment, the minimum error value is obtained by minimizing the concentration error between the calculated value of the concentration of the specific component and the reference value, and the correlation between the minimum error value and the spectrum is calculated.
- the machine learning unit 62 calculates the minimum H2 error value by minimizing the H2 concentration error between the reference value of the H2 concentration and the calculated value (estimated value) of the H2 concentration calculated from the element balance formula. and a first H2 correlation data generation unit 621a that generates first H2 correlation data indicating the correlation between the minimum H2 error value and the parameter used to calculate the minimum H2 error value ; and a 2H2 correlation data generation unit 621b that calculates the relationship with the minimum value and generates 2H2 correlation data.
- the parameters used for calculating the minimum H 2 error value that minimizes the H 2 concentration error are a′ and b′ representing the THC concentration in the elemental balance formula.
- the H2 error minimum value may be calculated by calculating the minimization problem by adding a, b and/or intake air moisture of the fuel to the parameters.
- the machine learning unit 62 calculates the minimum O2 error value by minimizing the O2 concentration error between the reference value of the O2 concentration and the calculated value (estimated value) of the O2 concentration calculated from the element balance formula.
- a first O2 correlation data generator 622a for generating first O2 correlation data indicating the correlation between the minimum O2 error value and the parameter used to calculate the minimum O2 error value ; and a second O2 correlation data generation unit 622b that machine-learns the relationship with the value to generate the second O2 correlation data.
- the parameters used for calculating the minimum O 2 error that minimizes the O 2 concentration error are the THC concentrations a' and b' in the elemental balance equation.
- the H2 error minimum value may be calculated by calculating the minimization problem by adding a, b and/or intake air moisture of the fuel to the parameters.
- the 1H2 correlation data generated by the 1H2 correlation data generation unit 621a is data indicating the correlation between the "minimum H2 error value" and the "parameter of the element balance formula used to calculate the minimum H2 error value".
- the 2H2 correlation data generated by the 2H2 correlation data generating section 621b is data indicating the correlation between the "spectrum data” and the "minimum H2 error value”.
- the 1H2 correlation data is stored in the 1H2 correlation data storage unit 623a
- the 2H2 correlation data is stored in the 2H2 correlation data storage unit 623b.
- the first O2 correlation data generated by the first O2 correlation data generation unit 622a is the correlation between the "minimum O2 error value" and the "parameter of the element balance formula used to calculate the minimum O2 error value”. data shown.
- the second O2 correlation data generated by the second O2 correlation data generating section 622b is data indicating the correlation between the "spectrum data” and the "minimum O2 error value”.
- the first O2 correlation data is stored in the first O2 correlation data storage unit 624a
- the second O2 correlation data is stored in the second O2 correlation data storage unit 624b.
- the exhaust gas analyzer 100 uses the 1st H2 correlation data and the 2nd H2 correlation data (machine learning model for calculating the H2 concentration) generated by the machine learning device 6 to calculate H2.
- the concentration can be calculated, and the O2 concentration can be calculated using the first O2 correlation data and the second O2 correlation data (machine learning model for calculating O2 concentration).
- the arithmetic processing unit 5 of the exhaust gas analyzer 100 includes an H2 error minimum value calculation unit 52a that calculates the H2 error minimum value from the spectrum data and the second H2 correlation data, and an H2 error minimum value calculation unit and an H2 concentration calculator 52b for calculating the H2 concentration in the exhaust gas from the H2 error minimum value obtained by 52a and the first H2 correlation data.
- the 1H2 correlation data is stored in the 1H2 correlation data storage section 52c
- the 2H2 correlation data is stored in the 2H2 correlation data storage section 52d.
- the arithmetic processing unit 5 includes an O 2 error minimum value calculation unit 53a that calculates the O 2 error minimum value from the spectrum data and the second O 2 correlation data, and an O 2 error value obtained by the O 2 error minimum value calculation unit 53a. and an O2 concentration calculator 53b for calculating the O2 concentration in the exhaust gas from the 2nd error minimum value and the first O2 correlation data.
- the first O2 correlation data is stored in the first O2 correlation data storage section 53c
- the second O2 correlation data is stored in the second O2 correlation data storage section 53d.
- the first H2 correlation data storage unit 52c or the second H2 correlation data storage unit 52d, respectively, of the machine learning device 6 may comprise the first H2 correlation data storage unit 623a or the second H2 correlation data storage unit 623b, respectively, or the first O2 correlation data storage unit 53c or the second O2 correlation data storage unit 53d, respectively. 1st O2 correlation data storage section 624a or 2nd O2 correlation data storage section 624b.
- the teacher data may include the first correlation data indicating the minimum error value obtained by minimizing the error between the reference value of the concentration of the specific component and the calculated value of the concentration of the specific component.
- an information processing device (not shown) that generates the first correlation data is provided separately from the processing device 5, and the processing device 5 machine-learns the relationship between the spectrum data and the minimum error value.
- a second correlation data generator for generating the second correlation data of the minimum error value for the spectrum.
- the teacher data receiving unit 61 obtains from the spectral data, in addition to the H 2 concentration reference value, the O 2 concentration reference value, and the spectral data as the teacher data, It may accept individual component concentrations selected based on an elemental balance equation. Then, in the machine learning unit 62, the H 2 correlation data generation unit 621 machine-learns the relationship between the H 2 concentration reference value, the spectrum data, and the individual component concentration, and calculates the H 2 concentration, the spectrum data, and the individual component concentration.
- Generate H 2 correlation data (machine learning model for calculating H 2 concentration) showing the correlation of Further, the O 2 correlation data generation unit 622 machine-learns the relationship between the reference value of the O 2 concentration, the spectrum data, and the individual component concentration, and the O 2 concentration indicating the correlation between the O 2 concentration, the spectrum data, and the individual component concentration .
- Generate correlation data (machine learning model for O2 concentration calculation). In this way, by including the individual component concentrations selected based on the element balance formula in addition to the spectral data in the teacher data, the measurement accuracy of the O 2 concentration or H 2 concentration can be improved.
- the teacher data receiving unit 61 stores the H 2 concentration reference value obtained by an H 2 analyzer different from the infrared gas analyzer (exhaust gas analyzer) and the infrared gas analyzer
- the teaching data including the reference value of the O 2 concentration obtained by the O 2 analyzer different from the (exhaust gas analyzer) and the individual component concentrations obtained by the infrared gas analyzer (exhaust gas analyzer) are accepted.
- the individual component concentrations included in this teacher data are individual component concentrations such as CO, CO 2 , NO, H 2 O, NO 2 or hydrocarbon components (HC) analyzed by the individual component analysis unit 512 .
- the machine learning unit 62 includes an H 2 correlation data generation unit 621 for generating H 2 correlation data by performing machine learning on the relationship between the reference value of the H 2 concentration and the calculated value (estimated value) of the H 2 concentration, and an O 2 It has an O 2 correlation data generation unit 622 for generating O 2 correlation data by performing machine learning on the relationship between the reference value of concentration and the calculated value (estimated value) of O 2 concentration.
- the calculated value (estimated value) of the H 2 concentration and the calculated value (estimated value) of the O 2 concentration can be estimated using the element balance formula obtained from the fuel combustion formula described above. That is, from the elemental balance formula (conservation law of substance amount), the H 2 concentration can be linearly regressed with the concentrations of the components (CO 2 , CO, H 2 O, THC), and the O 2 concentration can be linearly regressed from the components (CO 2 , CO , H 2 O, THC, NO) can be linearly regressed.
- the H 2 concentration linear regression equation by adding the NO concentration in addition to the concentrations of the components (CO 2 , CO, H 2 O, THC), the measurement accuracy of the H 2 concentration can be improved. .
- the H2 correlation data (machine learning model for calculating H2 concentration) generated by the H2 correlation data generation unit 621 is stored in the H2 correlation data storage unit 623, and the O2 correlation data generation unit 622 generates
- the O 2 correlation data (machine learning model for calculating O 2 concentration) is stored in the O 2 correlation data storage unit 624 .
- the exhaust gas analyzer 100 can calculate the H 2 concentration using the H 2 correlation data (machine learning model for calculating the H 2 concentration) generated by the machine learning device 6, O2 concentration can be calculated using O2 correlation data (machine learning model for calculating O2 concentration).
- the arithmetic processing unit 5 of the exhaust gas analyzer 100 includes an H 2 concentration calculation unit 52 that calculates the H 2 concentration in the combustion exhaust gas from the individual component concentration and the H 2 correlation data, and the individual component concentration and the O 2 correlation data. and an O 2 concentration calculator 53 for calculating the O 2 concentration in the combustion exhaust gas from the data.
- the H2 correlation data storage unit 54 may be configured from the H2 correlation data storage unit 623 of the machine learning device 6.
- the O 2 correlation data storage unit 55 may be configured from the O 2 correlation data storage unit 624 of the machine learning device 6 .
- the H 2 concentration calculation unit calculates a calculated value of the H 2 concentration from the individual component concentrations, and calculates the H 2 concentration in the flue gas from the calculated value and the H 2 correlation data. Further, the O 2 concentration calculation unit calculates a calculated value of O 2 concentration from the individual component concentrations, and calculates the O 2 concentration in the flue gas from the calculated value and the O 2 correlation data.
- the THC concentration used in the above elemental balance formula is considered to be the THC concentration obtained by a THC analyzer different from the infrared gas analyzer (exhaust gas analyzer).
- the exhaust gas analyzer 100 includes a THC correlation data storage unit 56 that stores THC correlation data obtained by learning the relationship between the THC concentration reference value and the spectrum data, and an infrared gas analyzer (spectrum).
- the configuration further includes a THC concentration calculation unit 57 that calculates the THC concentration in the combustion exhaust gas from the spectral data and the THC correlation data obtained by the data generation unit 511), and the THC concentration calculation unit 57 obtains THC concentration may also be used.
- the teacher data receiving unit 61 receives the reference value of the THC concentration obtained by a THC analyzer different from the infrared gas analyzer (exhaust gas analyzer) and the spectrum
- the machine learning unit 62 is configured to have a THC correlation data generation unit 625 that generates THC correlation data by machine learning the relationship between the THC concentration reference value and the spectrum data. Also good.
- the THC correlation data generated by this THC correlation data generation section 625 is stored in the THC correlation data storage section 626 .
- concentrations of individual components used in modified embodiments 1 and 2 above may be concentrations of all components CO 2 , CO, H 2 O, THC and NO, or CO 2 , CO, H 2 O and THC. , NO may be the concentration of some components.
- the 1H2 correlation data generation unit 621a or the 2H2 correlation data generation unit 621b generates individual component concentrations and/or O
- the correlation data may be calculated using the reference values of two densities.
- the first O2 correlation data generation unit 622a or the second O2 correlation data generation unit 622b uses the reference values of the individual component concentrations and/or H2 concentrations in addition to the calculated O2 concentration values obtained from the individual component concentrations. may be configured to calculate the correlation data. By increasing the parameters to be machine-learned in this way, it is possible to improve the measurement accuracy of the H 2 concentration or the O 2 concentration.
- the exhaust gas measurement system of the above embodiment uses the chassis dynamo 300 to test the complete vehicle V.
- an engine dynamometer may be used to test the performance of the engine.
- a dynamometer may be used to test powertrain performance.
- the exhaust gas analyzer 100 may irradiate a measurement sample with light and analyze from the spectrum.
- the exhaust gas analyzer 100 in addition to Fourier transform infrared spectroscopy, for example, NDIR, quantum cascade laser infrared spectroscopy, non-dispersive infrared absorption method, chemiluminescence method (chemiluminescence method), or these A combined method or the like may also be used.
- the present invention is not limited to the analysis of exhaust gases from automobiles, and can also analyze exhaust gases emitted from internal combustion engines such as ships, aircraft, agricultural machinery, and machine tools, power plants, or incinerators.
- the components of exhaust gas contained in the environment may also be analyzed.
- the exhaust gas analyzer may use light other than infrared light.
- the H 2 concentration or O 2 concentration which had to be measured using another analyzer, can be measured in the analyzer.
Abstract
Un dispositif d'apprentissage automatique 6 qui est destiné à être utilisé dans un dispositif d'analyse de gaz d'échappement qui irradie un gaz d'échappement avec une lumière et détecte la lumière qui a traversé le gaz d'échappement, et analyse le gaz d'échappement sur la base du signal de détection de celui-ci, ledit dispositif d'apprentissage automatique (6) comprenant : une unité de réception de données d'apprentissage 61 servant à recevoir des données d'apprentissage qui comprennent une valeur de référence d'une concentration de composant spécifique, qui est la concentration en H2 et/ou la concentration en O2 obtenues par un analyseur qui est différent du dispositif d'analyse de gaz d'échappement, et comprend également au moins un élément parmi les données de spectre obtenues par l'irradiation du gaz d'échappement avec une lumière, une concentration de composant individuel qui est sélectionnée sur la base d'une équation d'équilibre élémentaire pour obtenir la concentration de composant spécifique, et une valeur calculée de la concentration de composant spécifique qui est calculée par l'intermédiaire de l'équation d'équilibre élémentaire à l'aide de la concentration de composant individuelle ; et une unité d'apprentissage automatique 62 qui, à l'aide des données d'apprentissage, provoque un apprentissage automatique pour la relation entre la valeur de référence de la concentration de composant spécifique et les données de spectre, la concentration de composant individuel ou la valeur calculée de la concentration de composant spécifique.
Applications Claiming Priority (2)
| Application Number | Priority Date | Filing Date | Title |
|---|---|---|---|
| JP2021-213871 | 2021-12-28 | ||
| JP2021213871 | 2021-12-28 |
Publications (1)
| Publication Number | Publication Date |
|---|---|
| WO2023127262A1 true WO2023127262A1 (fr) | 2023-07-06 |
Family
ID=86998617
Family Applications (1)
| Application Number | Title | Priority Date | Filing Date |
|---|---|---|---|
| PCT/JP2022/039964 WO2023127262A1 (fr) | 2021-12-28 | 2022-10-26 | Dispositif d'apprentissage automatique, dispositif d'analyse de gaz d'échappement, procédé d'apprentissage automatique, procédé d'analyse de gaz d'échappement, programme d'apprentissage automatique et programme d'analyse de gaz d'échappement |
Country Status (1)
| Country | Link |
|---|---|
| WO (1) | WO2023127262A1 (fr) |
Cited By (1)
| Publication number | Priority date | Publication date | Assignee | Title |
|---|---|---|---|---|
| CN117233120A (zh) * | 2023-11-14 | 2023-12-15 | 山东大学 | 基于机器学习和高光谱图像的污染气体检测方法及系统 |
Citations (6)
| Publication number | Priority date | Publication date | Assignee | Title |
|---|---|---|---|---|
| WO2018136911A1 (fr) * | 2017-01-23 | 2018-07-26 | Honeywell International Inc. | Équipement et procédé d'estimation de luminance tridimensionnelle et d'estimation de champs d'espèces gazeuses dans un environnement de combustion ouvert |
| WO2018165029A1 (fr) * | 2017-03-06 | 2018-09-13 | Ion Engineering, Llc | Système de capture de dioxyde de carbone et évaluation spectroscopique de celui-ci |
| WO2019031331A1 (fr) * | 2017-08-07 | 2019-02-14 | 株式会社堀場製作所 | Dispositif d'analyse, procédé d'analyse, programme d'analyse et dispositif d'apprentissage d'analyse |
| JP2020094990A (ja) * | 2018-12-14 | 2020-06-18 | 株式会社堀場製作所 | 光学分析装置、並びに光学分析装置に用いられる機械学習装置及びその方法 |
| JP2020201097A (ja) * | 2019-06-07 | 2020-12-17 | 株式会社堀場製作所 | 排ガス分析装置、排ガス分析方法、排ガス分析用プログラム及び機械学習装置 |
| JP2021004765A (ja) * | 2019-06-25 | 2021-01-14 | 株式会社堀場製作所 | 分析装置、分析方法及び分析装置用プログラム |
-
2022
- 2022-10-26 WO PCT/JP2022/039964 patent/WO2023127262A1/fr active Application Filing
Patent Citations (6)
| Publication number | Priority date | Publication date | Assignee | Title |
|---|---|---|---|---|
| WO2018136911A1 (fr) * | 2017-01-23 | 2018-07-26 | Honeywell International Inc. | Équipement et procédé d'estimation de luminance tridimensionnelle et d'estimation de champs d'espèces gazeuses dans un environnement de combustion ouvert |
| WO2018165029A1 (fr) * | 2017-03-06 | 2018-09-13 | Ion Engineering, Llc | Système de capture de dioxyde de carbone et évaluation spectroscopique de celui-ci |
| WO2019031331A1 (fr) * | 2017-08-07 | 2019-02-14 | 株式会社堀場製作所 | Dispositif d'analyse, procédé d'analyse, programme d'analyse et dispositif d'apprentissage d'analyse |
| JP2020094990A (ja) * | 2018-12-14 | 2020-06-18 | 株式会社堀場製作所 | 光学分析装置、並びに光学分析装置に用いられる機械学習装置及びその方法 |
| JP2020201097A (ja) * | 2019-06-07 | 2020-12-17 | 株式会社堀場製作所 | 排ガス分析装置、排ガス分析方法、排ガス分析用プログラム及び機械学習装置 |
| JP2021004765A (ja) * | 2019-06-25 | 2021-01-14 | 株式会社堀場製作所 | 分析装置、分析方法及び分析装置用プログラム |
Cited By (2)
| Publication number | Priority date | Publication date | Assignee | Title |
|---|---|---|---|---|
| CN117233120A (zh) * | 2023-11-14 | 2023-12-15 | 山东大学 | 基于机器学习和高光谱图像的污染气体检测方法及系统 |
| CN117233120B (zh) * | 2023-11-14 | 2024-02-09 | 山东大学 | 基于机器学习和高光谱图像的污染气体检测方法及系统 |
Similar Documents
| Publication | Publication Date | Title |
|---|---|---|
| JP6983244B2 (ja) | 分析装置、分析方法、分析装置用プログラム及び分析用学習装置 | |
| Suarez-Bertoa et al. | Intercomparison of real-time tailpipe ammonia measurements from vehicles tested over the new world-harmonized light-duty vehicle test cycle (WLTC) | |
| WO2023127262A1 (fr) | Dispositif d'apprentissage automatique, dispositif d'analyse de gaz d'échappement, procédé d'apprentissage automatique, procédé d'analyse de gaz d'échappement, programme d'apprentissage automatique et programme d'analyse de gaz d'échappement | |
| JP6967387B2 (ja) | ガス分析装置、ガス分析装置用プログラム、及びガス分析方法 | |
| JP2000346801A5 (fr) | ||
| JP5809961B2 (ja) | 試料ガス分析装置及び試料ガス分析装置用プログラム | |
| US11448589B2 (en) | Analyzer, analysis method, and a program recording medium recorded with a program for analyzer | |
| JP2000346801A (ja) | Ftir法による多成分ガス分析方法 | |
| JP5424636B2 (ja) | Ftir法を用いたガス分析装置及びこれに用いるプログラム | |
| Kawai et al. | Compressive dual-comb spectroscopy | |
| JP7461948B2 (ja) | 試料ガス分析装置、試料ガス分析方法及び試料ガス分析用プログラム | |
| Herget et al. | Progress in the prototype development of a new multicomponent exhaust gas sampling and analyzing system | |
| Adachi et al. | Automotive emission analyses using FTIR spectrophotometer | |
| JP7335727B2 (ja) | 排ガス分析装置、排ガス分析方法、排ガス分析用プログラム及び機械学習装置 | |
| CN111912804B (zh) | 一种高炉烟气中微量二氧化硫监测的紫外光谱检测方法及装置 | |
| US20210318280A1 (en) | System and computer-implemented method for extrapolating calibration spectra | |
| JP2649667B2 (ja) | 分光分析における多成分分析方法 | |
| WO2022014126A1 (fr) | Dispositif d'analyse, procédé d'analyse, programme de dispositif d'analyse, dispositif d'apprentissage d'analyse, procédé d'apprentissage d'analyse, et programme de dispositif d'apprentissage d'analyse | |
| Butler et al. | A system for on-line measurement of multicomponent emissions and engine operating parameters | |
| JPH04262237A (ja) | フーリエ変換赤外分光計を用いたエンジン排ガス分析装置 | |
| JPWO2019012773A1 (ja) | ガス分析装置、ガス分析装置用プログラム、及びガス分析方法 | |
| WO2022071066A1 (fr) | Dispositif d'analyse de gaz d'échappement, procédé d'analyse de gaz d'échappement et support de stockage de programme pour dispositif d'analyse de gaz d'échappement | |
| Eichmann | Precise Exhaust Gas Measurement Based on Laser Spectroscopy | |
| Fang et al. | Line-by-line trace gas absorption model and its application for NDIR gas detection technology | |
| Jaeger | Robust on-line engine exhaust methane measurements using wavelength modulation spectroscopy |
Legal Events
| Date | Code | Title | Description |
|---|---|---|---|
| 121 | Ep: the epo has been informed by wipo that ep was designated in this application |
Ref document number: 22915496 Country of ref document: EP Kind code of ref document: A1 |
|
| WWE | Wipo information: entry into national phase |
Ref document number: 2023570679 Country of ref document: JP |