EP3937207A1 - System und verfahren zur automatisierten analyse der ausgabe in der induktiv gekoppelten einzelpartikelplasmamassenspektrometrie und ähnliche datensätzen - Google Patents
System und verfahren zur automatisierten analyse der ausgabe in der induktiv gekoppelten einzelpartikelplasmamassenspektrometrie und ähnliche datensätzen Download PDFInfo
- Publication number
- EP3937207A1 EP3937207A1 EP21194548.0A EP21194548A EP3937207A1 EP 3937207 A1 EP3937207 A1 EP 3937207A1 EP 21194548 A EP21194548 A EP 21194548A EP 3937207 A1 EP3937207 A1 EP 3937207A1
- Authority
- EP
- European Patent Office
- Prior art keywords
- sample
- pulse count
- peak
- particles
- count values
- Prior art date
- Legal status (The legal status is an assumption and is not a legal conclusion. Google has not performed a legal analysis and makes no representation as to the accuracy of the status listed.)
- Withdrawn
Links
- 239000002245 particle Substances 0.000 title claims abstract description 257
- 238000000034 method Methods 0.000 title claims abstract description 131
- 238000004458 analytical method Methods 0.000 title claims abstract description 35
- 238000001095 inductively coupled plasma mass spectrometry Methods 0.000 title description 43
- 238000009616 inductively coupled plasma Methods 0.000 claims abstract description 22
- 238000012545 processing Methods 0.000 claims abstract description 13
- 238000004611 spectroscopical analysis Methods 0.000 claims abstract description 12
- 239000012491 analyte Substances 0.000 claims description 75
- 239000002105 nanoparticle Substances 0.000 claims description 45
- 230000015654 memory Effects 0.000 claims description 42
- 150000002500 ions Chemical class 0.000 claims description 40
- 238000001514 detection method Methods 0.000 claims description 28
- 230000004907 flux Effects 0.000 claims description 21
- 238000009826 distribution Methods 0.000 claims description 17
- XKRFYHLGVUSROY-UHFFFAOYSA-N Argon Chemical compound [Ar] XKRFYHLGVUSROY-UHFFFAOYSA-N 0.000 claims description 14
- 229910052751 metal Inorganic materials 0.000 claims description 11
- 239000000203 mixture Substances 0.000 claims description 8
- 229910052786 argon Inorganic materials 0.000 claims description 7
- 239000011859 microparticle Substances 0.000 claims description 5
- 230000007935 neutral effect Effects 0.000 claims description 5
- 229910052709 silver Inorganic materials 0.000 claims description 5
- 229910052692 Dysprosium Inorganic materials 0.000 claims description 4
- 229910052691 Erbium Inorganic materials 0.000 claims description 4
- 229910052693 Europium Inorganic materials 0.000 claims description 4
- 229910052688 Gadolinium Inorganic materials 0.000 claims description 4
- 229910052689 Holmium Inorganic materials 0.000 claims description 4
- 229910052765 Lutetium Inorganic materials 0.000 claims description 4
- 229910052779 Neodymium Inorganic materials 0.000 claims description 4
- 229910052777 Praseodymium Inorganic materials 0.000 claims description 4
- 229910052774 Proactinium Inorganic materials 0.000 claims description 4
- 229910052772 Samarium Inorganic materials 0.000 claims description 4
- 229910052771 Terbium Inorganic materials 0.000 claims description 4
- 229910052776 Thorium Inorganic materials 0.000 claims description 4
- 229910052775 Thulium Inorganic materials 0.000 claims description 4
- 229910052770 Uranium Inorganic materials 0.000 claims description 4
- 229910052769 Ytterbium Inorganic materials 0.000 claims description 4
- 229910052782 aluminium Inorganic materials 0.000 claims description 4
- 229910052787 antimony Inorganic materials 0.000 claims description 4
- 229910052785 arsenic Inorganic materials 0.000 claims description 4
- 229910052788 barium Inorganic materials 0.000 claims description 4
- 229910052790 beryllium Inorganic materials 0.000 claims description 4
- 229910052796 boron Inorganic materials 0.000 claims description 4
- 229910052794 bromium Inorganic materials 0.000 claims description 4
- 229910052793 cadmium Inorganic materials 0.000 claims description 4
- 229910052791 calcium Inorganic materials 0.000 claims description 4
- 229910052801 chlorine Inorganic materials 0.000 claims description 4
- 229910052804 chromium Inorganic materials 0.000 claims description 4
- 229910052802 copper Inorganic materials 0.000 claims description 4
- 229910052733 gallium Inorganic materials 0.000 claims description 4
- 229910052732 germanium Inorganic materials 0.000 claims description 4
- 229910052737 gold Inorganic materials 0.000 claims description 4
- 229910052735 hafnium Inorganic materials 0.000 claims description 4
- 229910052738 indium Inorganic materials 0.000 claims description 4
- 229910052741 iridium Inorganic materials 0.000 claims description 4
- 229910052742 iron Inorganic materials 0.000 claims description 4
- 229910052743 krypton Inorganic materials 0.000 claims description 4
- 229910052746 lanthanum Inorganic materials 0.000 claims description 4
- 229910052745 lead Inorganic materials 0.000 claims description 4
- 229910052744 lithium Inorganic materials 0.000 claims description 4
- 229910052749 magnesium Inorganic materials 0.000 claims description 4
- 229910052748 manganese Inorganic materials 0.000 claims description 4
- 229910052753 mercury Inorganic materials 0.000 claims description 4
- 229910052750 molybdenum Inorganic materials 0.000 claims description 4
- 229910052759 nickel Inorganic materials 0.000 claims description 4
- 229910052758 niobium Inorganic materials 0.000 claims description 4
- 229910052762 osmium Inorganic materials 0.000 claims description 4
- 229910052763 palladium Inorganic materials 0.000 claims description 4
- 229910052698 phosphorus Inorganic materials 0.000 claims description 4
- 229910052697 platinum Inorganic materials 0.000 claims description 4
- 229910052702 rhenium Inorganic materials 0.000 claims description 4
- 229910052703 rhodium Inorganic materials 0.000 claims description 4
- 229910052701 rubidium Inorganic materials 0.000 claims description 4
- 229910052707 ruthenium Inorganic materials 0.000 claims description 4
- 229910052706 scandium Inorganic materials 0.000 claims description 4
- 229910052711 selenium Inorganic materials 0.000 claims description 4
- 229910052710 silicon Inorganic materials 0.000 claims description 4
- 229910052708 sodium Inorganic materials 0.000 claims description 4
- 229910052712 strontium Inorganic materials 0.000 claims description 4
- 229910052717 sulfur Inorganic materials 0.000 claims description 4
- 229910052715 tantalum Inorganic materials 0.000 claims description 4
- 229910052713 technetium Inorganic materials 0.000 claims description 4
- 229910052718 tin Inorganic materials 0.000 claims description 4
- 229910052719 titanium Inorganic materials 0.000 claims description 4
- 229910052721 tungsten Inorganic materials 0.000 claims description 4
- 229910052720 vanadium Inorganic materials 0.000 claims description 4
- 229910052727 yttrium Inorganic materials 0.000 claims description 4
- 229910052725 zinc Inorganic materials 0.000 claims description 4
- 229910052726 zirconium Inorganic materials 0.000 claims description 4
- 229910052716 thallium Inorganic materials 0.000 claims description 2
- 230000009467 reduction Effects 0.000 abstract description 4
- 238000009499 grossing Methods 0.000 abstract description 2
- 238000004891 communication Methods 0.000 description 17
- 238000003860 storage Methods 0.000 description 17
- 239000000243 solution Substances 0.000 description 14
- 239000007787 solid Substances 0.000 description 9
- 210000004027 cell Anatomy 0.000 description 8
- 230000008569 process Effects 0.000 description 7
- 239000006199 nebulizer Substances 0.000 description 6
- 238000004590 computer program Methods 0.000 description 5
- 238000010586 diagram Methods 0.000 description 5
- 230000006870 function Effects 0.000 description 5
- 239000000443 aerosol Substances 0.000 description 4
- 238000004364 calculation method Methods 0.000 description 4
- 238000010884 ion-beam technique Methods 0.000 description 4
- 239000002184 metal Substances 0.000 description 4
- 239000012898 sample dilution Substances 0.000 description 4
- 241000894007 species Species 0.000 description 4
- 239000007921 spray Substances 0.000 description 4
- NYQDCVLCJXRDSK-UHFFFAOYSA-N Bromofos Chemical compound COP(=S)(OC)OC1=CC(Cl)=C(Br)C=C1Cl NYQDCVLCJXRDSK-UHFFFAOYSA-N 0.000 description 3
- 238000004422 calculation algorithm Methods 0.000 description 3
- 230000001413 cellular effect Effects 0.000 description 3
- 238000007405 data analysis Methods 0.000 description 3
- 230000004069 differentiation Effects 0.000 description 3
- 230000003287 optical effect Effects 0.000 description 3
- 239000011701 zinc Substances 0.000 description 3
- XLOMVQKBTHCTTD-UHFFFAOYSA-N Zinc monoxide Chemical compound [Zn]=O XLOMVQKBTHCTTD-UHFFFAOYSA-N 0.000 description 2
- 230000009471 action Effects 0.000 description 2
- 230000006978 adaptation Effects 0.000 description 2
- 230000008901 benefit Effects 0.000 description 2
- 239000012895 dilution Substances 0.000 description 2
- 238000010790 dilution Methods 0.000 description 2
- 230000005183 environmental health Effects 0.000 description 2
- 238000002347 injection Methods 0.000 description 2
- 239000007924 injection Substances 0.000 description 2
- 230000003993 interaction Effects 0.000 description 2
- 238000004811 liquid chromatography Methods 0.000 description 2
- 239000004973 liquid crystal related substance Substances 0.000 description 2
- 238000009877 rendering Methods 0.000 description 2
- 238000011160 research Methods 0.000 description 2
- 238000004513 sizing Methods 0.000 description 2
- 229910021654 trace metal Inorganic materials 0.000 description 2
- 241000282412 Homo Species 0.000 description 1
- 241000700159 Rattus Species 0.000 description 1
- BQCADISMDOOEFD-UHFFFAOYSA-N Silver Chemical compound [Ag] BQCADISMDOOEFD-UHFFFAOYSA-N 0.000 description 1
- 238000005054 agglomeration Methods 0.000 description 1
- 230000002776 aggregation Effects 0.000 description 1
- 230000000975 bioactive effect Effects 0.000 description 1
- 210000004958 brain cell Anatomy 0.000 description 1
- 238000011088 calibration curve Methods 0.000 description 1
- 238000012512 characterization method Methods 0.000 description 1
- 238000004883 computer application Methods 0.000 description 1
- 238000010276 construction Methods 0.000 description 1
- 230000002939 deleterious effect Effects 0.000 description 1
- 238000013461 design Methods 0.000 description 1
- 238000005516 engineering process Methods 0.000 description 1
- 230000007613 environmental effect Effects 0.000 description 1
- 238000001825 field-flow fractionation Methods 0.000 description 1
- 238000001914 filtration Methods 0.000 description 1
- 230000036541 health Effects 0.000 description 1
- 230000000155 isotopic effect Effects 0.000 description 1
- 238000009533 lab test Methods 0.000 description 1
- 210000005229 liver cell Anatomy 0.000 description 1
- 210000005265 lung cell Anatomy 0.000 description 1
- 238000010295 mobile communication Methods 0.000 description 1
- 230000004048 modification Effects 0.000 description 1
- 238000012986 modification Methods 0.000 description 1
- 239000002086 nanomaterial Substances 0.000 description 1
- 230000006855 networking Effects 0.000 description 1
- 210000000056 organ Anatomy 0.000 description 1
- 230000000737 periodic effect Effects 0.000 description 1
- 230000000644 propagated effect Effects 0.000 description 1
- 230000004044 response Effects 0.000 description 1
- 238000012764 semi-quantitative analysis Methods 0.000 description 1
- 230000001953 sensory effect Effects 0.000 description 1
- 238000000926 separation method Methods 0.000 description 1
- 239000004332 silver Substances 0.000 description 1
- 239000012086 standard solution Substances 0.000 description 1
- 239000013589 supplement Substances 0.000 description 1
- 238000012360 testing method Methods 0.000 description 1
- 231100000331 toxic Toxicity 0.000 description 1
- 230000002588 toxic effect Effects 0.000 description 1
- 230000002110 toxicologic effect Effects 0.000 description 1
- 231100000027 toxicology Toxicity 0.000 description 1
- 230000009466 transformation Effects 0.000 description 1
- 230000000007 visual effect Effects 0.000 description 1
- 239000011787 zinc oxide Substances 0.000 description 1
Images


Classifications
-
- H—ELECTRICITY
- H01—ELECTRIC ELEMENTS
- H01J—ELECTRIC DISCHARGE TUBES OR DISCHARGE LAMPS
- H01J49/00—Particle spectrometers or separator tubes
- H01J49/0027—Methods for using particle spectrometers
- H01J49/0036—Step by step routines describing the handling of the data generated during a measurement
-
- G—PHYSICS
- G01—MEASURING; TESTING
- G01N—INVESTIGATING OR ANALYSING MATERIALS BY DETERMINING THEIR CHEMICAL OR PHYSICAL PROPERTIES
- G01N15/00—Investigating characteristics of particles; Investigating permeability, pore-volume or surface-area of porous materials
- G01N15/10—Investigating individual particles
-
- H—ELECTRICITY
- H01—ELECTRIC ELEMENTS
- H01J—ELECTRIC DISCHARGE TUBES OR DISCHARGE LAMPS
- H01J49/00—Particle spectrometers or separator tubes
- H01J49/02—Details
- H01J49/10—Ion sources; Ion guns
- H01J49/105—Ion sources; Ion guns using high-frequency excitation, e.g. microwave excitation, Inductively Coupled Plasma [ICP]
-
- G—PHYSICS
- G01—MEASURING; TESTING
- G01N—INVESTIGATING OR ANALYSING MATERIALS BY DETERMINING THEIR CHEMICAL OR PHYSICAL PROPERTIES
- G01N15/00—Investigating characteristics of particles; Investigating permeability, pore-volume or surface-area of porous materials
- G01N2015/0038—Investigating nanoparticles
Definitions
- This invention relates generally to analysis of spectrometry data.
- the invention relates to automated peak detection and analysis in single-particle inductively coupled plasma mass spectrometry (SP-ICP-MS).
- ICP-MS Inductively coupled plasma mass spectrometry
- ICP-MS instrument detection limits are at or below the single part per billion (ppb) level for much of the periodic table, the analytical working range is nine orders of magnitude, productivity is superior to other techniques, and isotopic analysis can be readily achieved.
- Most analyses performed on ICP-MS instrumentation are quantitative; however, ICP-MS can perform semiquantitative analysis as well, identifying an unknown sample for any of 80 detectable, differentiable elements, for example.
- ICP-MS analysis samples are introduced into an argon plasma as aerosol droplets.
- the plasma dries the aerosol, dissociates the molecules, then removes an electron from the components, thereby forming singly-charged ions, which are directed into a mass filtering device known as a mass spectrometer.
- a mass spectrometer Most commercial ICP-MS systems employ a quadrupole mass spectrometer which rapidly scans the mass range. At any given time, only one mass-to-charge ratio will be allowed to pass through the mass spectrometer from the entrance to the exit. Upon exiting the mass spectrometer, ions strike the first dynode of an electron multiplier, which serves as a detector.
- the impact of the ions releases a cascade of electrons, which are amplified until they become a measurable pulse.
- the intensities of the measured pulses are compared to standards, which make up a calibration curve for a particular element, to determine the concentration of that element in the sample.
- ICP-MS instruments include the following components: a sample introduction system composed of a nebulizer and spray chamber; an ICP torch and RF coil for generating the argon plasma that serves as the ion source; an interface that links the atmospheric pressure ICP ion source to a high vacuum mass spectrometer; a vacuum system that provides high vacuum for ion optics, quadrupole, and detector; a collision/reaction cell that precedes the mass spectrometer and is used to remove interferences that can degrade achievable detection limits; ion optics that guide the desired ions into the quadrupole while assuring that neutral species and photons are discarded from the ion beam; a mass spectrometer that acts as a mass filter to sort ions by their mass-to-charge ratio (m/z); a detector that counts individual ions exiting the quadrupole; and a data handling and system controller that controls aspects of instrument control and data handling for use in obtaining final concentration results.
- a sample introduction system composed of a
- Single-particle (SP) ICP-MS is a recently developed technique useful for detecting and sizing metal-containing nanoparticles at very low levels with great precision and accuracy.
- the detection of such nanoparticles is important in a variety of fields, particularly environmental health. For example, while there is great interest in the use of engineered nanomaterials in a wide variety of industrial and commercial applications, such nanoparticles may be harmful to humans.
- a 2009 study in the Journal of Nanoparticle Research showed that zinc oxide nanoparticles were toxic to human lung cells in lab tests even at low concentrations ( Weisheng et al., Journal of Nanoparticle Research, 2009, Vol. 11, No. 1, pp. 25-39 ).
- SP-ICP-MS single particle mode analysis
- the speed of data acquisition and the response time of the ICP-MS quadrupole and detector must be fast enough to capture the pulses/peaks corresponding to the nanoparticles. Sequences of pulses/peaks can be identified and quantified by an instrument running with a short enough dwell time (e.g., a few milliseconds or shorter) to resolve the individual nanoparticle pulses/peaks in the time domain.
- the NexION ® 300 ICP-MS manufactured by PerkinElmer of Shelton, CT, can be operated in Single Particle mode with a high-speed mass analyzer at a scan rate that exceeds 100,000 data points per second, a read speed that exceeds 3000 points per second, and a detector capable of integrating ionic signals at a dwell time of 10 microseconds without any settling time in between.
- the NexION ® 300 ICP-MS has a unique ion path design, e.g., the Triple Cone Interface (TCI) and Quadrupole Ion Deflector (QID), that allows this high level performance for nanoparticle detection.
- TCI Triple Cone Interface
- QID Quadrupole Ion Deflector
- Pulse height or area under a peak is compared against calibration standards to determine the concentration of the particles in the sample and the mass and size distribution of the particles in the sample. Coupled with a size-separation technique, e.g., field flow fractionation (FFF) and liquid chromatography (LC), SP-ICP-MS is capable of addressing size, size distribution, surface charge, and surface functionality of nanoparticles in samples.
- FFF field flow fractionation
- LC liquid chromatography
- Newer SP-ICP-MS techniques such as those performed with high performance instrumentation such as the NexION ® 300 ICP-MS, acquire data at extremely fast rates and are capable of acquiring multiple data points per nanoparticle, thereby producing a multi-point peak per nanoparticle, rather than a single-point pulse.
- These techniques offer significantly improved precision and accuracy, and obviate or reduce the need for multiple sample dilutions prior to running a sample.
- these newer techniques produce extremely large data sets (e.g., several million to tens of millions or more pulse counts per sample run) and complicate data analysis. Even with today's fast computational speeds, such large data sets require significant processing time.
- spectrometry data corresponding to particles of a sample, such as large data sets obtained during single particle mode analysis of an inductively coupled plasma mass spectrometer (SP-ICP-MS).
- SP-ICP-MS inductively coupled plasma mass spectrometer
- Techniques are presented herein that provide appropriate smoothing for rapid data processing without an accompanying reduction (or with an acceptably negligible reduction) in accuracy and/or precision.
- Single-particle (SP) ICP-MS is a recently developed technique useful for detecting and sizing metallic nanoparticles at very low levels (e.g., ⁇ 1 part-per-billion, or as low as 1 part-per-trillion) with great precision and accuracy.
- the detection of such nanoparticles is important in a variety of fields, particularly environmental health, where even low concentrations of nanoparticles may cause deleterious effects on human health.
- Single particle mode analysis (SP-ICP-MS) techniques are powerful because they permit differentiation between signals produced by analyte in a sample that is in a dissolved form, and analyte that is in the form of solid nanoparticles.
- a dilute solution of a dissolved analyte e.g., a metal element
- signals from solid nanoparticles composed of the same analyte, said nanoparticles being suspended in the solution are detected as either single-point pulses or multi-point peaks whose intensity exceeds the background signal from the dissolved analyte.
- Certain slower SP-ICP-MS systems that can only obtain single-point pulses often require sample dilution by a factor of 10,000 or more to provide a testing sample with differentiable nanoparticle signals. Such high dilution factors often introduce unacceptable error and/or artifacts which diminish the accuracy and precision of the results.
- Advanced SP-ICP-MS systems provide fast acquisition of pulse count values with a very short dwell time and settling time, thereby permitting multiple data points (multiple pulse count values) to be obtained for any given nanoparticle. This increases the accuracy and precision of the data analysis and promotes the ability to differentiate between a signal obtained from analyte in dissolved form and analyte in solid nanoparticle form without requiring such extensive sample dilutions.
- very efficient data processing is needed to avoid high processing time requirements.
- the techniques presented herein involve accessing an array of SP-ICP-MS pulse count values that include multiple data points for each detected particle, and determining a threshold for identifying (and excluding from the array in subsequent iterations) pulse count values as corresponding to a peak signal (and not a background signal).
- the threshold is adjusted based on remaining pulse count values following each of a series of iterations, with a given subsequent iteration further excluding pulse count values identified as corresponding to a peak in the preceding iteration.
- a final background threshold is determined upon convergence of the threshold within acceptable tolerance.
- Embodiments described herein provide an efficient, accurate, precise, and automated way to determine particle mass and/or particle size corresponding to a given peak for a sample analyzed via SP-ICP-MS.
- the techniques also work for analysis of other data sets which -- as with SP-ICP-MS data sets -- contain multiple data points for any given peak representing a single detected particle and which contain a background signal that can interfere with the accuracy and/or precision of the analysis if not properly accounted for.
- the techniques described herein further allow automated determination of the mass distribution and/or size distribution of the particles in the sample, as well as determination of particle concentration, a mean particle size, a median particle size, most common particle size, and a dissolved analyte concentration for the sample.
- the techniques allow determination of the composition of the particles, they allow characterization of agglomeration of the particles, and they allow differentiation between the detected ionic and particulate signals.
- the invention is directed to a method for automated analysis of spectrometry data corresponding to particles of a sample, the method comprising: (a) accessing, by a processor of a computing device, a sequence of pulse count values (e.g., intensity values) acquired by a spectrometer (e.g.
- ICP-MS inductively coupled plasma mass spectrometer
- the spectrometer is an inductively coupled plasma mass spectrometer (ICP-MS).
- ICP-MS inductively coupled plasma mass spectrometer
- the particles in the sample are nanoparticles. In certain embodiments, the particles in the sample are microparticles or cells.
- the sequence of pulse count values contain an average of from 1 to 50, or from 1 to 25, or from 2 to 10, or no less than 1.1, or no less than 1.2, or no less than 1.5, or no less than 2, or no less than 3, or no less than 4, or no less than 5 pulse count values per peak in the sample.
- step (c) further comprises storing positions of the identified peaks in a peak position array and, optionally, repeating step (c) with one or more additional x-values and, optionally, converging on an acceptable x-value.
- x is a predetermined integer (e
- step (e) comprises constructing, by the processor, a mass flux calibration for the sample using: a transport efficiency value for the sample, a dissolved solution calibration for the analyte (e.g., a metallic element of which the particles of the sample are comprised), and a dwell time and a flow rate for the sample in the spectrometer (e.g., ICP-MS).
- a transport efficiency value for the sample e.g., a dissolved solution calibration for the analyte (e.g., a metallic element of which the particles of the sample are comprised)
- a dwell time and a flow rate for the sample in the spectrometer e.g., ICP-MS
- step (e) further comprises computing the particle mass histogram for the sample using: (i) the histogram of peak area intensities for the sample, (ii) the mass flux calibration for the sample, (iii) a mass fraction of the particle that is the analyte, (iv) an ionization efficiency, (v) a determined or known shape of the particles, and (vi) a determined or known density of the particles.
- step (e) comprises determining, by the processor, an intensity versus mass calibration for the sample using: (i) a most-common intensity determined from an intensity histogram produced from an ICP-MS run of a standard particle having a known size and the same composition as the sample (e.g., same analyte), (ii) a determined or known shape of the particles of the sample, and (iii) a determined or known density of the particles of the sample.
- step (e) further comprises computing the particle mass histogram for the sample using: (i) the intensity versus mass calibration for the sample, (ii) a mass fraction of the particle that is the analyte, and (iii) an ionization efficiency.
- dwell time for each pulse count is no greater than 10 milliseconds, no greater than 1 millisecond, no greater than 500 microseconds, no greater than 200 microseconds, no greater than 100 microseconds, no greater than 50 microseconds, or no greater than 10 microseconds. In certain embodiments, dwell time for each pulse count is a value from 10 microseconds to 500 microseconds, or from 10 microseconds to 200 microseconds.
- settling time for the sample is no greater than 200 microseconds, no greater than 100 microseconds, no greater than 50 microseconds, no greater than 10 microseconds, no greater than 5 microseconds, no greater than 3 microseconds, no greater than 2 microseconds, no greater than 1 microsecond, no greater than 0.5 microsecond, no greater than 0.1 microsecond, or zero.
- particles of the sample comprise at least one metallic element (analyte). In certain embodiments, particles of the sample comprise at least one member (analyte) selected from the group consisting of Li, Be, B, Na, Mg, Al, Si, P, S.
- particles of the sample all have substantially the same composition.
- the method further comprises the step of acquiring the sequence of pulse count values using the spectrometer (e.g., an inductively coupled plasma mass spectrometer, ICP-MS).
- the spectrometer e.g., an inductively coupled plasma mass spectrometer, ICP-MS.
- the method further comprises the step of displaying the graphical and/or alphanumeric representation of one or more of (i) to (xi) rendered in step (f).
- the pulse count values acquired by the spectrometer are filtered and/or normalized by the processor before being entered into (or considered as) the first array of the pulse count values and proceeding with step (b).
- the invention is directed to a system for automated analysis of spectrometry data corresponding to particles of a sample, the system comprising: a processor; and a memory, wherein the memory comprises instructions that, when executed by the processor, cause the processor to: (a) access a sequence of pulse count values (e.g., intensity values) acquired by a spectrometer at a rate fast enough (e.g., at a short enough dwell time and/or settling time) to produce, for at least one given peak corresponding to an individual particle comprising an analyte in the sample, a plurality of pulse count values each of which is greater than a threshold background intensity value; (b) determine, from a first array of the pulse count values, a threshold for identifying (and excluding from the array in subsequent iterations) pulse count values as corresponding to a peak signal (and not a background signal), and adjust the threshold based on remaining pulse count values following each of a series of iterations, with a given subsequent iteration further excluding pulse count values
- the system further comprises the spectrometer for acquiring the sequence of pulse count values for the sample, wherein the spectrometer is an inductively coupled plasma mass spectrometer (ICP-MS).
- the ICP-MS comprises: a sample introduction system (e.g., (i) a nebulizer and a spray chamber, (ii) a microdroplet generator system, and/or (iii) a direct injection high efficiency nebulizer); an ICP torch and RF coil for generating an argon plasma that serves as an atmospheric pressure ion source; an interface that links the atmospheric pressure ICP ion source to a high vacuum mass spectrometer; a vacuum system that provides high vacuum for ion optics, a quadrupole, and a detector; a collision/reaction cell that precedes the mass spectrometer and is configured to remove interferences that can degrade achievable detection limits; the ion optics that guide the desired ions into the quadrupole while assuring that
- a sample introduction system
- the invention is directed to a non-transitory computer readable medium having instructions stored thereon, wherein the instructions, when executed by a processor, cause the processor to: (a) access a sequence of pulse count values (e.g., intensity values) acquired by a spectrometer at a rate fast enough (e.g., at a short enough dwell time and/or settling time) to produce, for at least one given peak corresponding to an individual particle comprising an analyte in the sample, a plurality of pulse count values each of which is greater than a threshold background intensity value; (b) determine, from a first array of the pulse count values, a threshold for identifying (and excluding from the array in subsequent iterations) pulse count values as corresponding to a peak signal (and not a background signal), and adjust the threshold based on remaining pulse count values following each of a series of iterations, with a given subsequent iteration further excluding pulse count values identified as corresponding to a peak in the preceding iteration, wherein a
- features described with respect to one aspect of the invention may also apply to another aspect of the invention (e.g., a system or a non-transitory computer readable medium).
- FIG. 1 is a flow chart of an illustrative method for automated detection and analysis of data peaks in raw data acquired by an ICP-MS system, where at least some of the peaks have multiple points and each peak corresponds to a nanoparticle of a sample, according to an illustrative embodiment.
- Method 100 of FIG. 1 begins with accessing raw data comprising a sequence of pulse count values (e.g., intensity values) acquired by an ICP-MS system (102).
- the raw data is analyzed to determine a background level, wherein the background level corresponds to the level at which the raw data does not exceed a meaningful threshold value (104).
- the background level is determined using a multi-pass algorithm, wherein the algorithm is iteratively executed until the background threshold converges to be within acceptable tolerance.
- the data is then analyzed to determine peaks in excess of the background level (106).
- the data points corresponding to the peaks are then used to determine the peak area intensities, corresponding to the area under the peaks which exceed the background level (108).
- An intensity histogram is constructed from the peak area intensities (110).
- a size histogram is constructed from the intensity histogram (112). The size histogram is analyzed to determine statistical data for the particle sample (114).
- FIG. 2 is an illustrative embodiment of a flow chart depicting steps in the Background Determination block of the method of FIG. 1 .
- the threshold approximation is calculated by the same threshold function T (206), but uses a reduced data set consisting only of those data points which were less than or equal to the threshold approximation of the previous iteration (214, 216, 218, 220, 226, 228, 230).
- the most recent iteration of the threshold approximation is compared to the threshold approximation of the previous iteration to determine if they are approximately equal (i.e., the threshold level has converged). Based on a positive determination, the final threshold level is calculated by the threshold function of the final iteration of the data set, and the final background level is calculated by the average of the final iteration of the data set. Based on a negative determination, the data set is further processed (208) to reduce the data set to those data points which are less than or equal to the most recent iteration of threshold approximation, according to steps 214, 216, 218, 220, 226, 228, 230.
- FIG. 3 is a flow chart depicting steps in the Peak Detection block of the method of FIG. 1 , according to the illustrative embodiment.
- Peak Detection Method 300 begins by loading raw data acquired by the ICP-MS system (304).
- a five point averaged data array is constructed from the raw data, wherein each consecutive set of five points is averaged (e.g., Average(points 1-5), Average(points 6-10), etc.) and these averages are used to construct a new array (304, 306, 308, 310, 312).
- the size of the new array will be approximately one fifth of the size of the raw data array (330).
- the five point averaged data array is then analyzed to detect those points which represent peaks, wherein a point is determined to be a peak if the value of the point is greater than both the preceding point and the following point in the array, and the value of the point exceeds the threshold level determined in the Background Determination Method 200 (316, 318, 322, 324, 326). These peak positions are stored in a new array representing the position of the peaks detected (318). The number of times a peak is detected is counted to determine the total number of peaks (320).
- FIG. 4 is a flow chart depicting steps in the Peak Area Determination block and the Constructing Intensity Histogram block of the method of FIG. 1 , according to the illustrative embodiment.
- Peak Area Determination Method 400 begins by loading the peak position array constructed in Peak Detection Method 300 (402). Each entry in the peak position array indicates that an actual peak occurs within a five point subarray of the raw data acquired by the ICP-MS system, wherein the five point subarray corresponds to the five consecutive points within the raw data which are centered on the indicated peak position (404). The peak data point contained in the five point subarray is then determined by finding the maximum value within the five point subarray (406).
- a summation of area corresponding to the peak is initiated by populating a summation variable with the value of the peak point, less the background level determined in Background Determination Method 200 (408).
- This background level corresponds to the contribution of the dissolved analyte and is subtracted from the value of any point that is added to the summation variable (416, 422).
- Each point to the right of the peak is iteratively added to the area summation until a point is determined to be less than or equal to the threshold level determined in Background Determination Method 200 (414), or the end of the raw data is reached (420).
- each point to the left of the peak is iteratively added to the area summation until a point is determined to be less than or equal to the threshold level (424), or the beginning of the raw data is reached (430).
- a value less than or equal to the threshold, or the end of the data comprise the limits to the area considered to correspond to a particular peak value.
- the horizontal component (e.g., time steps) of the area may be recorded in a separate array, but although such information may be useful, it is not necessary to record this information.
- the described summation of area is calculated for each of the peaks in the peak position array and the summations are added to a new peak summation array (434).
- the peak summation array is rounded to a whole number and used to construct an intensity histogram, wherein the intensity histogram corresponds to the frequency of any particular peak intensity (area).
- FIG. 5 is a flow chart depicting steps in the Constructing Size Histogram block and the Calculating Statistical Data block of the method of FIG. 1 , according to the illustrative embodiment.
- the intensity histogram constructed using the Peak Area Determination Method 400 is used to construct a two-dimensional array comprising the whole-number rounded intensities from one to the maximum detected peak intensity in the first dimension, and the corresponding frequency of each intensity in the second dimension (502). These whole-number rounded intensities are referred to as bins and all whole-number rounded intensities will correspond to a particular bin. The number of whole-number rounded intensities assigned to a bin is defined as the frequency for that particular bin.
- Dissolved solution calibration method 504 may be used if the transport efficiency value has been specified and a dissolved solution calibration for the analyte exists (504a).
- a mass flux calibration is constructed based on the dissolved solution calibration, transport efficiency value, dwell time, and flow rate of the analysis (504b).
- the mass flux calibration is thus obtained by plotting intensity versus W for different dissolved solution concentrations.
- the dissolved solution calibration specifies the relation between the observed intensity and analyte concentration.
- the mass flux calibration specifies the relation between the observed intensity and the mass of a nanoparticle.
- Mass-Bin [Intensity-Bin / Slope of Mass Flux calibration] ⁇ [1 / Mass Fraction] ⁇ [1 / Ionization efficiency] (504c).
- standard particle method 514 may be used if a standard particle for the analyte exists (514a).
- the standard nanoparticle with known size is run through analysis and a peak detection is performed, followed by construction of an intensity histogram (514b).
- the most common intensity in the histogram is found using a method of LogNormal/Gaussian/Max intensity fit.
- the specified density and size/shape are used to calculate the mass that the most common intensity refers to.
- the resulting intensity versus mass calibration, the mass fraction of the analyte in the nanoparticle sample, and the ionization efficiency are used to convert the peak area intensity of the histogram to mass (514d).
- the most frequent size is then obtained by finding the maximum in the sizehistogram array using a user input method of finding the maximum in the histogram, or alternatively finding the max in the fitted LogNormal or Gaussian fit.
- Other statistically useful parameters are also extracted, such as number of peaks detected, particle concentration, mean particle size, median particle size, and dissolved concentration (522).
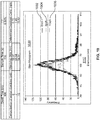
- FIG. 6A is a portion of a plot showing experimental results of background determination for SP-ICP-MS data per the method of FIG. 1 , according to the illustrative embodiment.
- Plot 600 is a plot of the data points acquired by the SP-ICP-MS system, wherein the horizontal access depicts time, and the vertical axis depicts the magnitude of the reading. Following a background determination method such as Background Determination Method 200, those points which are less than or equal to the threshold level are identified as representing background data, and are represented by the background data indicator 602. Those data points which are not determined to be background data correspond to data that lies on a peak, and consist of those points indicated by raw data indicator 604 which are not obscured by a background data indicator.
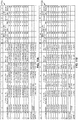
- FIG. 6B is a small portion of the data set showing iterations performed for background determination of SP-ICP-MS data per the method of FIG. 1 , and result obtained, according to an illustrative embodiment.
- the first column of Table 620 includes the raw data obtained by the SP-ICP-MS system.
- the first row of calculations in Table 640 corresponds to the raw data, and indicates the threshold approximation corresponding to the initial iteration of background determination.
- the data set is iteratively reduced according to the background determination method, wherein after each threshold approximation, those values which are less than or equal to the approximation are removed from the data set (e.g., the 1st iteration column of Table 620 comprises all data points of the raw data which are less than or equal to the threshold approximation calculated in the 0th iteration shown in Table 640, etc.).
- the data set continues to be iteratively reduced until the threshold approximation of the most recent iteration and the threshold approximation of the previous iteration are approximately equal, as indicated in the 6th iteration and 7th iteration of Table 640 (i.e., the threshold has converged).
- the threshold (calculated using the threshold formula of the most recent data set iteration) and the background level (calculated using the average of the most recent data set iteration) are finalized (650).
- FIG. 7A is a portion of a plot showing experimental results of peak detection from SP-ICP-MS data per the method of FIG. 1 , according to an illustrative embodiment.
- Plot 700 is a plot of the data points acquired by the SP-ICP-MS system, wherein the horizontal access depicts time, and the vertical axis depicts the magnitude of the reading.
- the data set is used with a peak detection method such as Peak Detection Method 300 to identify the location of those points which correspond to a peak in the data.
- the points which correspond to a particular peak are indicated by the max peak detected indicator 704. All other points, as well as the remaining points along the already identified peaks are indicated with the raw data indicator 702.
- FIG. 7B is a small portion of data set showing steps performed for peak detection of SP-ICP-MS experimental data per the method of FIG. 1 , according to an illustrative embodiment.
- the first column of data in Table 720 shows the raw data 722 acquired by the SP-ICP-MS system.
- a peak detection method such as Peak Detection Method 300
- a five point averaged data set 724 is constructed from the raw data 722, wherein each consecutive set of five points is averaged and used to construct the data set 724.
- a point in the five point averaged data set 724 is greater than both the previous and following point in the data set, the presence of a peak is indicated within that five point range by peak position data 726.
- the maximum point from the raw data within the five point range identified by peak position data 726 is used to construct the maximum peaks data 728 (i.e., the maximum value identified from the five points of raw data comprising the value from the position directly indicated by the peak position data, the previous two data points, and the following two data points is used as the maximum value of the peak).
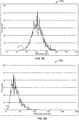
- FIG. 8A is an intensity histogram computed for experimental SP-ICP-MS data per the method of FIG. 1 , according to an illustrative embodiment.
- Plot 800 is an intensity histogram, wherein the horizontal axis depicts the whole-number rounded intensity data constructed using a peak area determination method such as Peak Area Determination Method 400, and the vertical axis depicts the frequency at which each intensity was detected in the analysis.
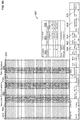
- FIG. 8B is a small portion of data used to prepare the intensity histogram of FIG. 8A , according to an illustrative embodiment.
- the first column of Table 820 comprises the peak intensity data 822 corresponding to each peak within the data set.
- the peak intensity data 822 is rounded to whole-number rounded intensity data 824.
- Table 830 shows intensity bins 832 which correspond to all whole-number values from one to the highest detected intensity, and the frequency of detection of a particular whole-number rounded intensity is defined as frequency data 834.
- FIG. 9A is a particle size histogram computed for experimental SP-ICP-MS data per the method of FIG. 1 , according to an illustrative embodiment.
- Plot 900 is a particle size histogram, wherein the horizontal axis depicts the size of particles calculated from intensity bins 826 (i.e., the size calculated from the unique entries in whole-number rounded intensity data 824), and the vertical axis depicts the frequency at which each size was detected in the analysis.
- FIG. 9B , 9C , 9D , and 9E depict computations, a size histogram, an intensity histogram, and calibrations used in performing mass and size calculations and producing the size histogram for experimental SP-ICP-MS data per the method of FIG. 1 , according to an illustrative embodiment.
- Table 920 is an example of mass flux calibration (specifies relation between observed intensity and the mass of a nanoparticle) using the dissolved solution calibration method 504, based on dissolved solution calibration, transport efficiency value, dwell time, and flow rate as described in blocks 504, 506, 508, 510.
- Mass flux 924 is calculated by Concentration 922 ⁇ dwell time 928 ⁇ flow rate 930 ⁇ transport efficiency 932. Mass flux calibration is then calculated by linear fit of intensity 926 versus mass flux 924 to give slope 934 and intercept 946.
- Table 950 shows mass and size calculations between intensity data 952 and particle size 956.
- particle mass 954 is calculated by [intensity 952 / mass flux calibration slope 934] ⁇ [1 / mass fraction 942] ⁇ [1 / ionization efficiency 944].
- particle size 956 is calculated from density 946 and particle shape (spherical) by [[6 ⁇ particle mass 944 / Pi] ⁇ [1 / density 946]] ⁇ [1 / 3].
- Plot 970 shows a size histogram of frequency data versus particle size, indicating the frequency at which a particular size of particle occurred in the analysis.
- Plot 980 shows an intensity histogram of frequency data versus intensity, indicating the frequency at which a particular intensity occurred in the analysis.
- Plot 990 is a plot of mass flux calibration calculated by linear fit of intensity 996 versus mass flux 994 to give mass flux calibration 998.
- FIG. 10 shows a size histogram computed for SP-ICP-MS-run samples having known dissolved concentration to demonstrate detection of correct suspended nanoparticle size without interference from the dissolved analyte per the method of FIG. 1 , according to an illustrative embodiment.
- Plot 1000 shows detected size of particle contained in DIW 1020, 2 ppb 1022, and 10 ppb 1024 dissolved analyte concentration.
- the peak at 60 nm 1026 is clearly indicated by the size histogram constructed in accordance with the methods described herein, which corresponds to the actual measured size 1028 of the sample.
- FIGS. 11A, 11B , and 11C show computations of average particle size and standard deviation for known samples from SP-ICP-MS experimental data to demonstrate accuracy and precision of the method of FIG. 1 for determining average particle size and differentiating analyte in solid particle form from dissolved analyte, according to an illustrative embodiment.
- Plots 1110 and 1130 show detected sample with relatively high (13 ppb) and low (0.44) dissolved analyte concentration. In both examples, relatively low standard deviations 1112 and 1132 indicate high precision throughout the collected data. Tables 1150 and 1170 show further consistency between sample readings and dissolved standard solution.
- FIG. 12 is a schematic diagram of components of an ICP-MS system, according to an illustrative embodiment.
- the ICP-MS system 1200 is an instrument for performing trace metal analysis on a sample.
- Sample Introduction System 1202 is composed of a nebulizer and spray chamber which introduce the sample into an argon plasma as aerosol droplets.
- ICP Torch 1204 uses RF Coil 1206, ICP Torch 1204 generates the argon plasma that serves as the ion source, which dries the aerosol, dissociates the molecules, then removes an electron from the components, thereby forming singly-charged ions.
- Interface 1208 links the atmospheric pressure ICP ion source to high vacuum mass spectrometer 1216.
- Mass spectrometer 1216 acts as a mass filter to sort ions by their mass-to-charge ratio (m/z).
- Vacuum system 1210 creates the vacuum for ion optics 1214, which guides the desired ions into a quadrupole while assuring that neutral species and photons are discarded from the ion beam.
- Collision/reaction cell 1212 precedes the mass spectrometer and is used to remove interferences that can degrade achievable detection limits.
- Detector 1218 counts individual ions exiting the quadrupole.
- Processor 1220 is used to control aspects of instrument control and data handling for use in obtaining final concentration results.
- FIG. 13 shows an illustrative network environment 1300 for use in the methods and systems for analysis of spectrometry data corresponding to particles of a sample, as described herein.
- the cloud computing environment 1300 may include one or more resource providers 1302a, 1302b, 1302c (collectively, 1302).
- Each resource provider 1302 may include computing resources.
- computing resources may include any hardware and/or software used to process data.
- computing resources may include hardware and/or software capable of executing algorithms, computer programs, and/or computer applications.
- exemplary computing resources may include application servers and/or databases with storage and retrieval capabilities.
- Each resource provider 1302 may be connected to any other resource provider 1302 in the cloud computing environment 1300.
- the resource providers 1302 may be connected over a computer network 1308.
- Each resource provider 1302 may be connected to one or more computing device 1304a, 1304b, 1304c (collectively, 1304), over the computer network 1308.
- the cloud computing environment 1300 may include a resource manager 1306.
- the resource manager 1306 may be connected to the resource providers 1302 and the computing devices 1304 over the computer network 1308.
- the resource manager 1306 may facilitate the provision of computing resources by one or more resource providers 1302 to one or more computing devices 1304.
- the resource manager 1306 may receive a request for a computing resource from a particular computing device 1304.
- the resource manager 1306 may identify one or more resource providers 1302 capable of providing the computing resource requested by the computing device 1304.
- the resource manager 1306 may select a resource provider 1302 to provide the computing resource.
- the resource manager 1306 may facilitate a connection between the resource provider 1302 and a particular computing device 1304.
- the resource manager 1306 may establish a connection between a particular resource provider 1302 and a particular computing device 1304. In some implementations, the resource manager 1306 may redirect a particular computing device 1304 to a particular resource provider 1302 with the requested computing resource.
- FIG. 14 shows an example of a computing device 1400 and a mobile computing device 1450 that can be used in the methods and systems described in this disclosure.
- the computing device 1400 is intended to represent various forms of digital computers, such as laptops, desktops, workstations, personal digital assistants, servers, blade servers, mainframes, and other appropriate computers.
- the mobile computing device 1450 is intended to represent various forms of mobile devices, such as personal digital assistants, cellular telephones, smartphones, and other similar computing devices.
- the components shown here, their connections and relationships, and their functions, are meant to be examples only, and are not meant to be limiting.
- the computing device 1400 includes a processor 1402, a memory 1404, a storage device 1406, a high-speed interface 1408 connecting to the memory 1404 and multiple high-speed expansion ports 1410, and a low-speed interface 1412 connecting to a low-speed expansion port 1414 and the storage device 1406.
- Each of the processor 1402, the memory 1404, the storage device 1406, the high-speed interface 1408, the high-speed expansion ports 1410, and the low-speed interface 1412 are interconnected using various busses, and may be mounted on a common motherboard or in other manners as appropriate.
- the processor 1402 can process instructions for execution within the computing device 1400, including instructions stored in the memory 1404 or on the storage device 1406 to display graphical information for a GUI on an external input/output device, such as a display 1416 coupled to the high-speed interface 1408.
- an external input/output device such as a display 1416 coupled to the high-speed interface 1408.
- multiple processors and/or multiple buses may be used, as appropriate, along with multiple memories and types of memory.
- multiple computing devices may be connected, with each device providing portions of the necessary operations (e.g., as a server bank, a group of blade servers, or a multi-processor system).
- the memory 1404 stores information within the computing device 1400.
- the memory 1404 is a volatile memory unit or units.
- the memory 1404 is a non-volatile memory unit or units.
- the memory 1404 may also be another form of computer-readable medium, such as a magnetic or optical disk.
- the storage device 1406 is capable of providing mass storage for the computing device 1400.
- the storage device 1406 may be or contain a computer-readable medium, such as a floppy disk device, a hard disk device, an optical disk device, or a tape device, a flash memory or other similar solid state memory device, or an array of devices, including devices in a storage area network or other configurations.
- Instructions can be stored in an information carrier.
- the instructions when executed by one or more processing devices (for example, processor 1402), perform one or more methods, such as those described above.
- the instructions can also be stored by one or more storage devices such as computer- or machine-readable mediums (for example, the memory 1404, the storage device 1406, or memory on the processor 1402).
- the high-speed interface 1408 manages bandwidth-intensive operations for the computing device 1400, while the low-speed interface 1412 manages lower bandwidth-intensive operations. Such allocation of functions is an example only.
- the high-speed interface 1408 is coupled to the memory 1404, the display 1416 (e.g., through a graphics processor or accelerator), and to the high-speed expansion ports 1410, which may accept various expansion cards (not shown).
- the low-speed interface 1412 is coupled to the storage device 1406 and the low-speed expansion port 1414.
- the low-speed expansion port 1414 which may include various communication ports (e.g., USB, Bluetooth ® , Ethernet, wireless Ethernet) may be coupled to one or more input/output devices, such as a keyboard, a pointing device, a scanner, or a networking device such as a switch or router, e.g., through a network adapter.
- input/output devices such as a keyboard, a pointing device, a scanner, or a networking device such as a switch or router, e.g., through a network adapter.
- the computing device 1400 may be implemented in a number of different forms, as shown in the figure. For example, it may be implemented as a standard server 1420, or multiple times in a group of such servers. In addition, it may be implemented in a personal computer such as a laptop computer 1422. It may also be implemented as part of a rack server system 1424. Alternatively, components from the computing device 1400 may be combined with other components in a mobile device (not shown), such as a mobile computing device 1450. Each of such devices may contain one or more of the computing device 1400 and the mobile computing device 1450, and an entire system may be made up of multiple computing devices communicating with each other.
- the mobile computing device 1450 includes a processor 1452, a memory 1464, an input/output device such as a display 1454, a communication interface 1466, and a transceiver 1468, among other components.
- the mobile computing device 1450 may also be provided with a storage device, such as a micro-drive or other device, to provide additional storage.
- a storage device such as a micro-drive or other device, to provide additional storage.
- Each of the processor 1452, the memory 1464, the display 1454, the communication interface 1466, and the transceiver 1468, are interconnected using various buses, and several of the components may be mounted on a common motherboard or in other manners as appropriate.
- the processor 1452 can execute instructions within the mobile computing device 1450, including instructions stored in the memory 1464.
- the processor 1452 may be implemented as a chipset of chips that include separate and multiple analog and digital processors.
- the processor 1452 may provide, for example, for coordination of the other components of the mobile computing device 1450, such as control of user interfaces, applications run by the mobile computing device 1450, and wireless communication by the mobile computing device 1450.
- the processor 1452 may communicate with a user through a control interface 1458 and a display interface 1456 coupled to the display 1454.
- the display 1454 may be, for example, a TFT (Thin-Film-Transistor Liquid Crystal Display) display or an OLED (Organic Light Emitting Diode) display, or other appropriate display technology.
- the display interface 1456 may comprise appropriate circuitry for driving the display 1454 to present graphical and other information to a user.
- the control interface 1458 may receive commands from a user and convert them for submission to the processor 1452.
- an external interface 1462 may provide communication with the processor 1452, so as to enable near area communication of the mobile computing device 1450 with other devices.
- the external interface 1462 may provide, for example, for wired communication in some implementations, or for wireless communication in other implementations, and multiple interfaces may also be used.
- the memory 1464 stores information within the mobile computing device 1450.
- the memory 1464 can be implemented as one or more of a computer-readable medium or media, a volatile memory unit or units, or a non-volatile memory unit or units.
- An expansion memory 1474 may also be provided and connected to the mobile computing device 1450 through an expansion interface 1472, which may include, for example, a SIMM (Single In Line Memory Module) card interface.
- SIMM Single In Line Memory Module
- the expansion memory 1474 may provide extra storage space for the mobile computing device 1450, or may also store applications or other information for the mobile computing device 1450.
- the expansion memory 1474 may include instructions to carry out or supplement the processes described above, and may include secure information also.
- the expansion memory 1474 may be provided as a security module for the mobile computing device 1450, and may be programmed with instructions that permit secure use of the mobile computing device 1450.
- secure applications may be provided via the SIMM cards, along with additional information, such as placing identifying information on the SIMM card in a non-hackable manner.
- the memory may include, for example, flash memory and/or NVRAM memory (non-volatile random access memory), as discussed below.
- instructions are stored in an information carrier and, when executed by one or more processing devices (for example, processor 1452), perform one or more methods, such as those described above.
- the instructions can also be stored by one or more storage devices, such as one or more computer- or machine-readable mediums (for example, the memory 1464, the expansion memory 1474, or memory on the processor 1452).
- the instructions can be received in a propagated signal, for example, over the transceiver 1468 or the external interface 1462.
- the mobile computing device 1450 may communicate wirelessly through the communication interface 1466, which may include digital signal processing circuitry where necessary.
- the communication interface 1466 may provide for communications under various modes or protocols, such as GSM voice calls (Global System for Mobile communications), SMS (Short Message Service), EMS (Enhanced Messaging Service), or MMS messaging (Multimedia Messaging Service), CDMA (code division multiple access), TDMA (time division multiple access), PDC (Personal Digital Cellular), WCDMA (Wideband Code Division Multiple Access), CDMA2000, or GPRS (General Packet Radio Service), among others.
- GSM voice calls Global System for Mobile communications
- SMS Short Message Service
- EMS Enhanced Messaging Service
- MMS messaging Multimedia Messaging Service
- CDMA code division multiple access
- TDMA time division multiple access
- PDC Personal Digital Cellular
- WCDMA Wideband Code Division Multiple Access
- CDMA2000 Code Division Multiple Access
- GPRS General Packet Radio Service
- a GPS (Global Positioning System) receiver module 1470 may provide additional navigation- and location-related wireless data to the mobile computing device 1450, which may be used as appropriate by applications running on the mobile computing device 1450.
- the mobile computing device 1450 may also communicate audibly using an audio codec 1460, which may receive spoken information from a user and convert it to usable digital information.
- the audio codec 1460 may likewise generate audible sound for a user, such as through a speaker, e.g., in a handset of the mobile computing device 1450.
- Such sound may include sound from voice telephone calls, may include recorded sound (e.g., voice messages, music files, etc.) and may also include sound generated by applications operating on the mobile computing device 1450.
- the mobile computing device 1450 may be implemented in a number of different forms, as shown in the figure. For example, it may be implemented as a cellular telephone 1480. It may also be implemented as part of a smart-phone 1482, personal digital assistant, or other similar mobile device.
- implementations of the systems and techniques described here can be realized in digital electronic circuitry, integrated circuitry, specially designed ASICs (application specific integrated circuits), computer hardware, firmware, software, and/or combinations thereof.
- ASICs application specific integrated circuits
- These various implementations can include implementation in one or more computer programs that are executable and/or interpretable on a programmable system including at least one programmable processor, which may be special or general purpose, coupled to receive data and instructions from, and to transmit data and instructions to, a storage system, at least one input device, and at least one output device.
- machine-readable medium and computer-readable medium refer to any computer program product, apparatus and/or device (e.g., magnetic discs, optical disks, memory, Programmable Logic Devices (PLDs)) used to provide machine instructions and/or data to a programmable processor, including a machine-readable medium that receives machine instructions as a machine-readable signal.
- machine-readable signal refers to any signal used to provide machine instructions and/or data to a programmable processor.
- the systems and techniques described here can be implemented on a computer having a display device (e.g., a CRT (cathode ray tube) or LCD (liquid crystal display) monitor) for displaying information to the user and a keyboard and a pointing device (e.g., a mouse or a trackball) by which the user can provide input to the computer.
- a display device e.g., a CRT (cathode ray tube) or LCD (liquid crystal display) monitor
- a keyboard and a pointing device e.g., a mouse or a trackball
- Other kinds of devices can be used to provide for interaction with a user as well; for example, feedback provided to the user can be any form of sensory feedback (e.g., visual feedback, auditory feedback, or tactile feedback); and input from the user can be received in any form, including acoustic, speech, or tactile input.
- the systems and techniques described here can be implemented in a computing system that includes a back end component (e.g., as a data server), or that includes a middleware component (e.g., an application server), or that includes a front end component (e.g., a client computer having a graphical user interface or a Web browser through which a user can interact with an implementation of the systems and techniques described here), or any combination of such back end, middleware, or front end components.
- the components of the system can be interconnected by any form or medium of digital data communication (e.g., a communication network). Examples of communication networks include a local area network (LAN), a wide area network (WAN), and the Internet.
- LAN local area network
- WAN wide area network
- the Internet the global information network
- the computing system can include clients and servers.
- a client and server are generally remote from each other and typically interact through a communication network.
- the relationship of client and server arises by virtue of computer programs running on the respective computers and having a client-server relationship to each other.
Landscapes
- Chemical & Material Sciences (AREA)
- Analytical Chemistry (AREA)
- Physics & Mathematics (AREA)
- Biochemistry (AREA)
- Life Sciences & Earth Sciences (AREA)
- Health & Medical Sciences (AREA)
- Dispersion Chemistry (AREA)
- General Health & Medical Sciences (AREA)
- General Physics & Mathematics (AREA)
- Immunology (AREA)
- Pathology (AREA)
- Engineering & Computer Science (AREA)
- Plasma & Fusion (AREA)
- Other Investigation Or Analysis Of Materials By Electrical Means (AREA)
- Electron Tubes For Measurement (AREA)
Priority Applications (1)
| Application Number | Priority Date | Filing Date | Title |
|---|---|---|---|
| EP21194548.0A EP3937207A1 (de) | 2014-02-14 | 2014-02-14 | System und verfahren zur automatisierten analyse der ausgabe in der induktiv gekoppelten einzelpartikelplasmamassenspektrometrie und ähnliche datensätzen |
Applications Claiming Priority (3)
| Application Number | Priority Date | Filing Date | Title |
|---|---|---|---|
| EP21194548.0A EP3937207A1 (de) | 2014-02-14 | 2014-02-14 | System und verfahren zur automatisierten analyse der ausgabe in der induktiv gekoppelten einzelpartikelplasmamassenspektrometrie und ähnliche datensätzen |
| EP14711623.0A EP3105774B1 (de) | 2014-02-14 | 2014-02-14 | Systeme und verfahren zur automatischen analyse der ausgabe bei induktiv gekoppelter einzelpartikel-plasmasmassenspektrometrie |
| PCT/US2014/016588 WO2015122920A1 (en) | 2014-02-14 | 2014-02-14 | Systems and methods for automated analysis of output in single particle inductively coupled plasma mass spectrometry and similar data sets |
Related Parent Applications (1)
| Application Number | Title | Priority Date | Filing Date |
|---|---|---|---|
| EP14711623.0A Division EP3105774B1 (de) | 2014-02-14 | 2014-02-14 | Systeme und verfahren zur automatischen analyse der ausgabe bei induktiv gekoppelter einzelpartikel-plasmasmassenspektrometrie |
Publications (1)
| Publication Number | Publication Date |
|---|---|
| EP3937207A1 true EP3937207A1 (de) | 2022-01-12 |
Family
ID=50342463
Family Applications (2)
| Application Number | Title | Priority Date | Filing Date |
|---|---|---|---|
| EP14711623.0A Active EP3105774B1 (de) | 2014-02-14 | 2014-02-14 | Systeme und verfahren zur automatischen analyse der ausgabe bei induktiv gekoppelter einzelpartikel-plasmasmassenspektrometrie |
| EP21194548.0A Withdrawn EP3937207A1 (de) | 2014-02-14 | 2014-02-14 | System und verfahren zur automatisierten analyse der ausgabe in der induktiv gekoppelten einzelpartikelplasmamassenspektrometrie und ähnliche datensätzen |
Family Applications Before (1)
| Application Number | Title | Priority Date | Filing Date |
|---|---|---|---|
| EP14711623.0A Active EP3105774B1 (de) | 2014-02-14 | 2014-02-14 | Systeme und verfahren zur automatischen analyse der ausgabe bei induktiv gekoppelter einzelpartikel-plasmasmassenspektrometrie |
Country Status (6)
| Country | Link |
|---|---|
| EP (2) | EP3105774B1 (de) |
| JP (2) | JP6397041B2 (de) |
| CN (2) | CN106463328B (de) |
| AU (1) | AU2014382594B2 (de) |
| CA (1) | CA2938674C (de) |
| WO (1) | WO2015122920A1 (de) |
Families Citing this family (19)
| Publication number | Priority date | Publication date | Assignee | Title |
|---|---|---|---|---|
| US9754774B2 (en) | 2014-02-14 | 2017-09-05 | Perkinelmer Health Sciences, Inc. | Systems and methods for automated analysis of output in single particle inductively coupled plasma mass spectrometry and similar data sets |
| US10181394B2 (en) | 2014-02-14 | 2019-01-15 | Perkinelmer Health Sciences, Inc. | Systems and methods for automated optimization of a multi-mode inductively coupled plasma mass spectrometer |
| WO2017169832A1 (ja) | 2016-03-31 | 2017-10-05 | 富士フイルム株式会社 | 半導体製造用処理液、半導体製造用処理液が収容された収容容器、パターン形成方法及び電子デバイスの製造方法 |
| CN108885410A (zh) | 2016-03-31 | 2018-11-23 | 富士胶片株式会社 | 电子材料制造用药液的制造方法、图案形成方法、半导体装置的制造方法、电子材料制造用药液、容器及品质检查方法 |
| CN106872558A (zh) * | 2017-03-01 | 2017-06-20 | 中国科学院南京土壤研究所 | 一种测定植物体内纳米银和银离子的方法 |
| CN106908510B (zh) * | 2017-03-03 | 2019-06-18 | 中国科学院地质与地球物理研究所 | 一种测定锆石样品的铀铅年龄的方法 |
| US11075066B2 (en) * | 2018-10-26 | 2021-07-27 | Agilent Technologies, Inc. | Automated detection of nanoparticles using single-particle inductively coupled plasma mass spectrometry (SP-ICP-MS) |
| WO2020248757A1 (en) * | 2019-06-14 | 2020-12-17 | Shanghai Polaris Biology Co., Ltd. | Systems and methods for single particle analysis |
| GB201910538D0 (en) * | 2019-07-23 | 2019-09-04 | Micromass Ltd | Decoding multiplexed mass spectral data |
| CN112415079B (zh) * | 2019-08-22 | 2021-10-22 | 四川大学 | 一种单颗粒电感耦合等离子体质谱的双参数自验证均相免疫分析方法 |
| EP3739329B1 (de) * | 2019-08-29 | 2023-10-04 | IAS Inc. | Verfahren zur analyse von feinen metallpartikeln und massenspektrometrieverfahren mit induktiv gekoppeltem plasma |
| CN115280132B (zh) * | 2020-01-15 | 2023-06-06 | 上海宸安生物科技有限公司 | 粒子质谱 |
| CN111315106A (zh) * | 2020-03-20 | 2020-06-19 | 北京东方计量测试研究所 | 一种等离子体发生器校准系统 |
| CN111537595A (zh) * | 2020-04-28 | 2020-08-14 | 浙江方圆检测集团股份有限公司 | 一种抗菌制品中纳米银迁移表征方法 |
| US20240038518A1 (en) * | 2020-12-22 | 2024-02-01 | Dh Technologies Development Pte. Ltd. | Dynamic ejection delay time for acoustic ejection mass spectrometry |
| CN113237942B (zh) * | 2021-05-07 | 2023-09-26 | 上海科技大学 | 在微量细胞中检测多种微量元素的方法及应用 |
| US20230352286A1 (en) * | 2022-04-27 | 2023-11-02 | Elemental Scientific, Inc. | Multi data process switching for nanoparticle baseline and detection threshold determination |
| US12085497B1 (en) | 2023-04-12 | 2024-09-10 | Elemental Scientific, Inc. | Nanoparticle analysis for ultra-low level concentrations of nanoparticles in fluid samples |
| CN117760890B (zh) * | 2023-12-21 | 2024-07-02 | 广东广田包装机械有限公司 | 一种基于人机互动的颗粒物自动称重方法及系统 |
Family Cites Families (25)
| Publication number | Priority date | Publication date | Assignee | Title |
|---|---|---|---|---|
| US4833322A (en) * | 1986-05-02 | 1989-05-23 | Shell Oil Company | Method and apparatus for analysis of material |
| US5381008A (en) * | 1993-05-11 | 1995-01-10 | Mds Health Group Ltd. | Method of plasma mass analysis with reduced space charge effects |
| JP3670145B2 (ja) * | 1998-11-10 | 2005-07-13 | 松下電器産業株式会社 | 信号クランプ装置および記録媒体 |
| US6253162B1 (en) * | 1999-04-07 | 2001-06-26 | Battelle Memorial Institute | Method of identifying features in indexed data |
| US7479630B2 (en) * | 2004-03-25 | 2009-01-20 | Bandura Dmitry R | Method and apparatus for flow cytometry linked with elemental analysis |
| JP2004347473A (ja) * | 2003-05-22 | 2004-12-09 | Tdk Corp | La−icp−ms装置を用いた定量分析方法および有機物含有成形体の製造方法 |
| US20070242269A1 (en) * | 2004-03-06 | 2007-10-18 | Michael Trainer | Methods and apparatus for determining characteristics of particles |
| US6972408B1 (en) * | 2004-09-30 | 2005-12-06 | Ut-Battelle, Llc | Ultra high mass range mass spectrometer systems |
| US20060255258A1 (en) * | 2005-04-11 | 2006-11-16 | Yongdong Wang | Chromatographic and mass spectral date analysis |
| US7391015B2 (en) * | 2005-06-03 | 2008-06-24 | Mds Analytical Technologies | System and method for data collection in recursive mass analysis |
| JP5177949B2 (ja) * | 2005-11-11 | 2013-04-10 | アングルトライ株式会社 | スペクトル波形パターンのピーク位置補正方法およびプログラム |
| US7977626B2 (en) * | 2007-06-01 | 2011-07-12 | Agilent Technologies, Inc. | Time of flight mass spectrometry method and apparatus |
| CN101911139B (zh) * | 2007-11-16 | 2013-03-20 | 粒子监测系统有限公司 | 用于光学粒子计数器的校准验证的系统和方法 |
| US8384897B2 (en) * | 2008-04-25 | 2013-02-26 | Nippon Steel & Sumitomo Metal Corporation | Method of analyzing particle size distribution of particles in metal material |
| AU2011220352B2 (en) * | 2010-02-26 | 2015-10-22 | Perkinelmer U.S. Llc | Plasma mass spectrometry with ion suppression |
| CN102792147B (zh) * | 2010-03-10 | 2015-05-13 | 贝克曼考尔特公司 | 在颗粒分析器中产生脉冲参数 |
| DE102010032823B4 (de) * | 2010-07-30 | 2013-02-07 | Ion-Tof Technologies Gmbh | Verfahren sowie ein Massenspektrometer zum Nachweis von Ionen oder nachionisierten Neutralteilchen aus Proben |
| US8530829B2 (en) * | 2010-09-23 | 2013-09-10 | Agilent Technologies, Inc. | Inductively coupled plasma mass spectroscopy apparatus and measured data processing method in the inductively coupled plasma mass spectroscopy apparatus |
| WO2012061143A1 (en) * | 2010-10-25 | 2012-05-10 | University Of Washington Through Its Center For Commercialization | Method and system for simultaneously finding and measuring multiple analytes from complex samples |
| JP6122386B2 (ja) * | 2010-12-17 | 2017-04-26 | サーモ フィッシャー サイエンティフィック (ブレーメン) ゲーエムベーハー | データ収集システムおよび質量分析方法 |
| JP6141772B2 (ja) * | 2011-02-14 | 2017-06-07 | マサチューセッツ インスティテュート オブ テクノロジー | 質量分析の方法、装置、及びシステム |
| DE112012001185B4 (de) * | 2011-03-11 | 2014-08-28 | Leco Corporation | Systeme und Verfahren zur Datenverarbeitung in Chromatographiesystemen |
| JP2013040782A (ja) * | 2011-08-11 | 2013-02-28 | Sony Corp | 光学的測定装置及びチップ寿命判定方法 |
| NL2009015C2 (en) * | 2012-04-10 | 2013-10-15 | Biosparq B V | Method for classification of a sample on the basis of spectral data, method for creating a database and method for using this database, and corresponding computer program, data storage medium and system. |
| JP6020315B2 (ja) * | 2012-04-27 | 2016-11-02 | 株式会社島津製作所 | 質量分析データ処理方法及び質量分析データ処理装置 |
-
2014
- 2014-02-14 EP EP14711623.0A patent/EP3105774B1/de active Active
- 2014-02-14 EP EP21194548.0A patent/EP3937207A1/de not_active Withdrawn
- 2014-02-14 CN CN201480077936.2A patent/CN106463328B/zh active Active
- 2014-02-14 AU AU2014382594A patent/AU2014382594B2/en not_active Ceased
- 2014-02-14 CA CA2938674A patent/CA2938674C/en active Active
- 2014-02-14 CN CN201910248619.7A patent/CN109991151B/zh active Active
- 2014-02-14 JP JP2016551837A patent/JP6397041B2/ja active Active
- 2014-02-14 WO PCT/US2014/016588 patent/WO2015122920A1/en active Application Filing
-
2018
- 2018-06-08 JP JP2018110154A patent/JP6620189B2/ja not_active Expired - Fee Related
Non-Patent Citations (6)
| Title |
|---|
| AARON HINEMAN ET AL: "Effect of dwell time on single particle inductively coupled plasma mass spectrometry data acquisition quality", JOURNAL OF ANALYTICAL ATOMIC SPECTROMETRY, vol. 29, no. 7, 14 April 2014 (2014-04-14), pages 1252 - 1257, XP055144518, ISSN: 0267-9477, DOI: 10.1039/c4ja00097h * |
| BRAYDICH-STOLLE ET AL., TOXICOLOGICAL SCIENCES, vol. 88, 2005, pages 412 - 419 |
| CHADY STEPHAN ET AL: "Analysis of NIST(R) Gold Nanoparticles Reference Materials Using the NexION 300 ICP-MS in Single Particle Mode", 1 January 2012 (2012-01-01), pages 1 - 5, XP055754406, Retrieved from the Internet <URL:https://pepolska.pl/wp-content/uploads/2020/03/NOTA-ICP-MS-analiza-wzorca-nanocz%C4%85stek-z%C5%82ota-technik%C4%85-SP-ICP-MS.pdf> [retrieved on 20201126] * |
| FRANCISCO LABORDA ET AL: "Single Particle Inductively Coupled Plasma Mass Spectrometry: A Powerful Tool for Nanoanalysis", ANALYTICAL CHEMISTRY, vol. 86, no. 5, 18 December 2013 (2013-12-18), US, pages 2270 - 2278, XP055754378, ISSN: 0003-2700, DOI: 10.1021/ac402980q * |
| HEATHER E. PACE ET AL: "Determining Transport Efficiency for the Purpose of Counting and Sizing Nanoparticles via Single Particle Inductively Coupled Plasma Mass Spectrometry", ANALYTICAL CHEMISTRY, vol. 83, no. 24, 11 November 2011 (2011-11-11), pages 9361 - 9369, XP055144591, ISSN: 0003-2700, DOI: 10.1021/ac201952t * |
| WEISHENG ET AL., JOURNAL OF NANOPARTICLE RESEARCH, vol. 11, no. 1, 2009, pages 25 - 39 |
Also Published As
| Publication number | Publication date |
|---|---|
| CN106463328B (zh) | 2019-04-23 |
| CN109991151B (zh) | 2021-11-16 |
| EP3105774A1 (de) | 2016-12-21 |
| CA2938674C (en) | 2021-04-27 |
| JP6620189B2 (ja) | 2019-12-11 |
| JP6397041B2 (ja) | 2018-09-26 |
| AU2014382594A1 (en) | 2016-09-22 |
| CA2938674A1 (en) | 2015-08-20 |
| EP3105774B1 (de) | 2021-09-22 |
| CN109991151A (zh) | 2019-07-09 |
| CN106463328A (zh) | 2017-02-22 |
| AU2014382594B2 (en) | 2019-07-04 |
| JP2018141811A (ja) | 2018-09-13 |
| JP2017511882A (ja) | 2017-04-27 |
| WO2015122920A1 (en) | 2015-08-20 |
Similar Documents
| Publication | Publication Date | Title |
|---|---|---|
| US10431444B2 (en) | Systems and methods for automated analysis of output in single particle inductively coupled plasma mass spectrometry and similar data sets | |
| CA2938674C (en) | Systems and methods for automated analysis of output in single particle inductively coupled plasma mass spectrometry and similar data sets | |
| CN106463329B (zh) | 用于多模式电感耦合等离子体质谱仪的自动化优化的系统及方法 | |
| Bolea-Fernandez et al. | Detection of microplastics using inductively coupled plasma-mass spectrometry (ICP-MS) operated in single-event mode | |
| Strenge et al. | Capabilities of fast data acquisition with microsecond time resolution in inductively coupled plasma mass spectrometry and identification of signal artifacts from millisecond dwell times during detection of single gold nanoparticles | |
| Naasz et al. | Multi-element analysis of single nanoparticles by ICP-MS using quadrupole and time-of-flight technologies | |
| Hendriks et al. | Characterization of a new ICP-TOFMS instrument with continuous and discrete introduction of solutions | |
| JP2018141811A5 (de) | ||
| CN109285757A (zh) | 用于调节离子阱中的离子群体以用于MSn扫描的系统和方法 | |
| Gundlach-Graham et al. | Mass-dependent critical value expressions for particle finding in single-particle ICP-tofms | |
| Chun et al. | Dual-elemental analysis of single particles using quadrupole-based inductively coupled plasma-mass spectrometry | |
| Lockwood et al. | Strategies to enhance figures of merit in ICP-ToF-MS | |
| Ganeev et al. | Mass spectrometric methods for the direct elemental and isotopic analysis of solid materials | |
| Tuccitto | Automated data mining of secondary ion mass spectrometry spectra | |
| Kaynarova et al. | An approach to estimate the contribution of signal noise to the diameter uncertainty of individual silver nanoparticles and resolution of spICP-MS analysis | |
| Donard et al. | Direct online determination of laser-induced particle size distribution by ICPMS | |
| Xu et al. | Rapid Analysis of Soil Samples by Laser Ionization Mass Spectrometry | |
| Nagahata et al. | Interlaboratory comparison of average molecular mass and molecular mass distribution of a polystyrene reference material determined by MALDI-TOF mass spectrometry | |
| JP2020532827A (ja) | ガス混合物を使用してイオンを選択するシステムおよび方法 | |
| Georgieva | Applications in single-particle inductively coupled plasma-mass spectrometry | |
| Sanz-Medel et al. | A general overview of atomic spectrometric techniques |
Legal Events
| Date | Code | Title | Description |
|---|---|---|---|
| PUAI | Public reference made under article 153(3) epc to a published international application that has entered the european phase |
Free format text: ORIGINAL CODE: 0009012 |
|
| STAA | Information on the status of an ep patent application or granted ep patent |
Free format text: STATUS: THE APPLICATION HAS BEEN PUBLISHED |
|
| AC | Divisional application: reference to earlier application |
Ref document number: 3105774 Country of ref document: EP Kind code of ref document: P |
|
| AK | Designated contracting states |
Kind code of ref document: A1 Designated state(s): AL AT BE BG CH CY CZ DE DK EE ES FI FR GB GR HR HU IE IS IT LI LT LU LV MC MK MT NL NO PL PT RO RS SE SI SK SM TR |
|
| B565 | Issuance of search results under rule 164(2) epc |
Effective date: 20211117 |
|
| STAA | Information on the status of an ep patent application or granted ep patent |
Free format text: STATUS: REQUEST FOR EXAMINATION WAS MADE |
|
| 17P | Request for examination filed |
Effective date: 20220711 |
|
| RBV | Designated contracting states (corrected) |
Designated state(s): AL AT BE BG CH CY CZ DE DK EE ES FI FR GB GR HR HU IE IS IT LI LT LU LV MC MK MT NL NO PL PT RO RS SE SI SK SM TR |
|
| P01 | Opt-out of the competence of the unified patent court (upc) registered |
Effective date: 20230601 |
|
| STAA | Information on the status of an ep patent application or granted ep patent |
Free format text: STATUS: THE APPLICATION HAS BEEN WITHDRAWN |
|
| 18W | Application withdrawn |
Effective date: 20231023 |