EP3555615B9 - Mass spectrometry assay method for detection and quantitation of kidney function metabolites - Google Patents
Mass spectrometry assay method for detection and quantitation of kidney function metabolites Download PDFInfo
- Publication number
- EP3555615B9 EP3555615B9 EP17885159.8A EP17885159A EP3555615B9 EP 3555615 B9 EP3555615 B9 EP 3555615B9 EP 17885159 A EP17885159 A EP 17885159A EP 3555615 B9 EP3555615 B9 EP 3555615B9
- Authority
- EP
- European Patent Office
- Prior art keywords
- analytes
- tryptophan
- creatinine
- mobile phase
- ions
- Prior art date
- Legal status (The legal status is an assumption and is not a legal conclusion. Google has not performed a legal analysis and makes no representation as to the accuracy of the status listed.)
- Active
Links
Images


Classifications
-
- G—PHYSICS
- G01—MEASURING; TESTING
- G01N—INVESTIGATING OR ANALYSING MATERIALS BY DETERMINING THEIR CHEMICAL OR PHYSICAL PROPERTIES
- G01N33/00—Investigating or analysing materials by specific methods not covered by groups G01N1/00 - G01N31/00
- G01N33/48—Biological material, e.g. blood, urine; Haemocytometers
- G01N33/50—Chemical analysis of biological material, e.g. blood, urine; Testing involving biospecific ligand binding methods; Immunological testing
- G01N33/68—Chemical analysis of biological material, e.g. blood, urine; Testing involving biospecific ligand binding methods; Immunological testing involving proteins, peptides or amino acids
- G01N33/6803—General methods of protein analysis not limited to specific proteins or families of proteins
- G01N33/6848—Methods of protein analysis involving mass spectrometry
-
- G—PHYSICS
- G01—MEASURING; TESTING
- G01N—INVESTIGATING OR ANALYSING MATERIALS BY DETERMINING THEIR CHEMICAL OR PHYSICAL PROPERTIES
- G01N30/00—Investigating or analysing materials by separation into components using adsorption, absorption or similar phenomena or using ion-exchange, e.g. chromatography or field flow fractionation
- G01N30/02—Column chromatography
- G01N30/62—Detectors specially adapted therefor
- G01N30/72—Mass spectrometers
- G01N30/7233—Mass spectrometers interfaced to liquid or supercritical fluid chromatograph
-
- G—PHYSICS
- G01—MEASURING; TESTING
- G01N—INVESTIGATING OR ANALYSING MATERIALS BY DETERMINING THEIR CHEMICAL OR PHYSICAL PROPERTIES
- G01N33/00—Investigating or analysing materials by specific methods not covered by groups G01N1/00 - G01N31/00
- G01N33/48—Biological material, e.g. blood, urine; Haemocytometers
- G01N33/50—Chemical analysis of biological material, e.g. blood, urine; Testing involving biospecific ligand binding methods; Immunological testing
- G01N33/62—Chemical analysis of biological material, e.g. blood, urine; Testing involving biospecific ligand binding methods; Immunological testing involving urea
-
- G—PHYSICS
- G01—MEASURING; TESTING
- G01N—INVESTIGATING OR ANALYSING MATERIALS BY DETERMINING THEIR CHEMICAL OR PHYSICAL PROPERTIES
- G01N33/00—Investigating or analysing materials by specific methods not covered by groups G01N1/00 - G01N31/00
- G01N33/48—Biological material, e.g. blood, urine; Haemocytometers
- G01N33/50—Chemical analysis of biological material, e.g. blood, urine; Testing involving biospecific ligand binding methods; Immunological testing
- G01N33/66—Chemical analysis of biological material, e.g. blood, urine; Testing involving biospecific ligand binding methods; Immunological testing involving blood sugars, e.g. galactose
-
- G—PHYSICS
- G01—MEASURING; TESTING
- G01N—INVESTIGATING OR ANALYSING MATERIALS BY DETERMINING THEIR CHEMICAL OR PHYSICAL PROPERTIES
- G01N33/00—Investigating or analysing materials by specific methods not covered by groups G01N1/00 - G01N31/00
- G01N33/48—Biological material, e.g. blood, urine; Haemocytometers
- G01N33/50—Chemical analysis of biological material, e.g. blood, urine; Testing involving biospecific ligand binding methods; Immunological testing
- G01N33/68—Chemical analysis of biological material, e.g. blood, urine; Testing involving biospecific ligand binding methods; Immunological testing involving proteins, peptides or amino acids
- G01N33/6803—General methods of protein analysis not limited to specific proteins or families of proteins
- G01N33/6806—Determination of free amino acids
- G01N33/6812—Assays for specific amino acids
-
- G—PHYSICS
- G01—MEASURING; TESTING
- G01N—INVESTIGATING OR ANALYSING MATERIALS BY DETERMINING THEIR CHEMICAL OR PHYSICAL PROPERTIES
- G01N33/00—Investigating or analysing materials by specific methods not covered by groups G01N1/00 - G01N31/00
- G01N33/48—Biological material, e.g. blood, urine; Haemocytometers
- G01N33/50—Chemical analysis of biological material, e.g. blood, urine; Testing involving biospecific ligand binding methods; Immunological testing
- G01N33/70—Chemical analysis of biological material, e.g. blood, urine; Testing involving biospecific ligand binding methods; Immunological testing involving creatine or creatinine
-
- H—ELECTRICITY
- H01—ELECTRIC ELEMENTS
- H01J—ELECTRIC DISCHARGE TUBES OR DISCHARGE LAMPS
- H01J49/00—Particle spectrometers or separator tubes
- H01J49/0009—Calibration of the apparatus
-
- H—ELECTRICITY
- H01—ELECTRIC ELEMENTS
- H01J—ELECTRIC DISCHARGE TUBES OR DISCHARGE LAMPS
- H01J49/00—Particle spectrometers or separator tubes
- H01J49/0027—Methods for using particle spectrometers
- H01J49/0031—Step by step routines describing the use of the apparatus
-
- H—ELECTRICITY
- H01—ELECTRIC ELEMENTS
- H01J—ELECTRIC DISCHARGE TUBES OR DISCHARGE LAMPS
- H01J49/00—Particle spectrometers or separator tubes
- H01J49/004—Combinations of spectrometers, tandem spectrometers, e.g. MS/MS, MSn
- H01J49/0045—Combinations of spectrometers, tandem spectrometers, e.g. MS/MS, MSn characterised by the fragmentation or other specific reaction
- H01J49/005—Combinations of spectrometers, tandem spectrometers, e.g. MS/MS, MSn characterised by the fragmentation or other specific reaction by collision with gas, e.g. by introducing gas or by accelerating ions with an electric field
-
- H—ELECTRICITY
- H01—ELECTRIC ELEMENTS
- H01J—ELECTRIC DISCHARGE TUBES OR DISCHARGE LAMPS
- H01J49/00—Particle spectrometers or separator tubes
- H01J49/02—Details
- H01J49/10—Ion sources; Ion guns
- H01J49/14—Ion sources; Ion guns using particle bombardment, e.g. ionisation chambers
- H01J49/145—Ion sources; Ion guns using particle bombardment, e.g. ionisation chambers using chemical ionisation
-
- G—PHYSICS
- G01—MEASURING; TESTING
- G01N—INVESTIGATING OR ANALYSING MATERIALS BY DETERMINING THEIR CHEMICAL OR PHYSICAL PROPERTIES
- G01N2458/00—Labels used in chemical analysis of biological material
- G01N2458/15—Non-radioactive isotope labels, e.g. for detection by mass spectrometry
-
- G—PHYSICS
- G01—MEASURING; TESTING
- G01N—INVESTIGATING OR ANALYSING MATERIALS BY DETERMINING THEIR CHEMICAL OR PHYSICAL PROPERTIES
- G01N2570/00—Omics, e.g. proteomics, glycomics or lipidomics; Methods of analysis focusing on the entire complement of classes of biological molecules or subsets thereof, i.e. focusing on proteomes, glycomes or lipidomes
-
- G—PHYSICS
- G01—MEASURING; TESTING
- G01N—INVESTIGATING OR ANALYSING MATERIALS BY DETERMINING THEIR CHEMICAL OR PHYSICAL PROPERTIES
- G01N2800/00—Detection or diagnosis of diseases
- G01N2800/34—Genitourinary disorders
- G01N2800/347—Renal failures; Glomerular diseases; Tubulointerstitial diseases, e.g. nephritic syndrome, glomerulonephritis; Renovascular diseases, e.g. renal artery occlusion, nephropathy
-
- G—PHYSICS
- G01—MEASURING; TESTING
- G01N—INVESTIGATING OR ANALYSING MATERIALS BY DETERMINING THEIR CHEMICAL OR PHYSICAL PROPERTIES
- G01N2800/00—Detection or diagnosis of diseases
- G01N2800/70—Mechanisms involved in disease identification
- G01N2800/7057—(Intracellular) signaling and trafficking pathways
- G01N2800/7066—Metabolic pathways
-
- H—ELECTRICITY
- H01—ELECTRIC ELEMENTS
- H01J—ELECTRIC DISCHARGE TUBES OR DISCHARGE LAMPS
- H01J49/00—Particle spectrometers or separator tubes
Definitions
- WO 2014/186311 A1 describes biomarkers of kidney function and methods for using said biomarkers for assessing kidney function, monitoring kidney function, diagnosing acute kidney injury, and diagnosing chronic kidney disease. Also provided are suites of small molecule entities as biomarkers for chronic kidney disease.
- WO 2016/025429 A1 relates to the field of nephrology. More specifically, it describes methods and compositions useful for more precisely estimating glomerular filtration rate (GFR).
- GFR glomerular filtration rate
- GFR glomerular filtration rate
- kidney function e.g., BUN, urine albumin measurements; glomerular filtration rate estimates (eGFR) based on the levels of serum creatinine, cystatin C
- BUN urine albumin measurements
- eGFR glomerular filtration rate estimates
- kidney function based on the measured levels of combinations of one or more and up to seventeen metabolite biomarkers selected from the group consisting of pseudouridine, N-acetylthreonine, phenylacetylglutamine, tryptophan, N,N,N-Trimethyl-L-Alanyl-L-Proline (TMAP), creatinine, meso-erythritol, arabitol, myo-inositol, N-acetylserine, N-acetylalanine, 3-methylhistidine, trans-4-hydroxyproline, kynurenine, urea, C-glycosyltryptophan (also referred to as 2-mannopyranosyl-tryptophan, 2-( ⁇ -D-Mannopyranosyl)-L-tryptophan, Manno-L-tryptophan, or 2-MT), and 3-indoxylsulfate have been developed.
- pseudouridine N-acetylthreonine
- Combinations of these analytes are used in complex equations to derive an estimated GFR (eGFR) that is more precise than the eGFR estimates based on the levels of serum creatinine and/or cystatin C.
- eGFR estimated GFR
- the advantage of this approach is its ease of use in routine clinical practice for more precise assessment of kidney function.
- the improved precision in assessing kidney function allows appropriate treatment intervention and monitoring of kidney function, which enables better treatment outcomes.
- the seventeen analytes may include a panel comprised of one or more analytes selected from pseudouridine, N-acetylthreonine, phenylacetylglutamine, tryptophan, TMAP, creatinine, meso-erythritol, arabitol, myo-inositol, N-acetylserine, N-acetylalanine, 3-methylhistidine, trans-4-hydroxyproline, kynurenine, urea, C-glycosyltryptophan, and 3-indoxylsulfate.
- the metabolite assays require a small sample size, do not require derivatization and can be performed using mass spectrometry analysis methods.
- the method of the invention comprises detecting and determining the amount of a panel of analytes comprised of five analytes selected from the group consisting of pseudouridine, N-acetylthreonine, phenylacetylglutamine, tryptophan, and creatinine in a sample by mass spectrometry.
- the method comprises subjecting the sample to an ionization source under conditions suitable to fragment a parent ion to produce one or more daughter ions detectable by mass spectrometry from each of the one or more analytes.
- the analytes are not derivatized prior to ionization. Methods to extract the analytes from biological samples and to chromatographically separate the analytes prior to detection by mass spectrometry are also provided.
- the mass spectrometry is tandem mass spectrometry.
- the one or more ions from N-acetylthreonine may comprise one or more ions selected from the group consisting of ions with a mass to charge ratio (m/z) of about 162.0 ⁇ 0.5,74.1 ⁇ 0.5, 144.0 ⁇ 0.5, 126.1 ⁇ 0.5, 119.9 ⁇ 0.5, 116.1 ⁇ 0.5, 102.0 ⁇ 0.5, 97.9 ⁇ 0.5, 84.0 ⁇ 0.5, 70.0 ⁇ 0.5, 57.0 ⁇ 0.5, 56.0 ⁇ 0.5, 43.0 ⁇ 0.5, 28.1 ⁇ 0.5, 159.9 ⁇ 0.5, 73.9 ⁇ 0.5, 118.1 ⁇ 0.5, 115.8 ⁇ 0.5, 97.9 ⁇ 0.5, 71.9 ⁇ 0.5, 70.9 ⁇ 0.5, 70.1 ⁇ 0.5, 56.1 ⁇ 0.5, 54.0 ⁇ 0.5, 42.0 ⁇ 0.5, 40.9 ⁇ 0.5, 26.0 ⁇ 0.5, and 159.9 ⁇ 0.5.
- m/z mass to charge ratio
- the one or more ions from phenylacetylglutamine may comprise one or more ions selected from the group consisting of ions with a mass to charge ratio (m/z) of about 265.0 ⁇ 0.5, 91.0 ⁇ 0.5, 248.1 ⁇ 0.5, 219.1 ⁇ 0.5, 147.1 ⁇ 0.5, 136.0 ⁇ 0.5, 130.0 ⁇ 0.5, 129.1 ⁇ 0.5, 101.1 ⁇ 0.5, 84.0 ⁇ 0.5, 83.0 ⁇ 0.5, 65.0 ⁇ 0.5, 56.0 ⁇ 0.5, 50.9 ⁇ 0.5, 44.0 ⁇ 0.5, 40.9 ⁇ 0.5, 39.1 ⁇ 0.5, 28.0 ⁇ 0.5, 262.9 ⁇ 0.5, and 42.0 ⁇ 0.5.
- m/z mass to charge ratio
- the one or more ions from creatinine may comprise one or more ions selected from the group consisting of ions with a mass to charge ratio (m/z) of about 113.9 ⁇ 0.5, 43.0 ⁇ 0.5, 86.0 ⁇ 0.5, 72.0 ⁇ 0.5, 44.1 ⁇ 0.5, 42.0 ⁇ 0.5, 28.1 ⁇ 0.5, 111.9 ⁇ 0.5, and 67.9 ⁇ 0.5.
- the one or more ions from tryptophan may comprise one or more ions selected from the group consisting of ions with a mass to charge ratio (m/z) of about 205.0 ⁇ 0.5, 146.0 ⁇ 0.5, 191-193 ⁇ 0.5, 173-174 ⁇ 0.5, 163-164 ⁇ 0.5, 144.8-151.2 ⁇ 0.5, 117.1-122.1 ⁇ 0.5, 102.9-110.1 ⁇ 0.5, 89.9-96.0 ⁇ 0.5, 74.1-81.1 ⁇ 0.5, 60.9-68.9 ⁇ 0.5, 50.1-54.1 ⁇ 0.5, 38.0-43.1 ⁇ 0.5, 28.0-29.0 ⁇ 0.5, 202.9 ⁇ 0.5, 115.9 ⁇ 0.5, 185.9 ⁇ 0.5, 158.9 ⁇ 0.5, 141.9 ⁇ 0.5, 130.0 ⁇ 0.5, 74.1 ⁇ 0.5, 72.2 ⁇ 0.5, 59.0 ⁇ 0.5, 44.9 ⁇ 0.5.
- m/z mass to charge ratio
- the one or more ions from pseudouridine may comprise one or more ions selected from the group consisting of ions with a mass to charge ratio (m/z) of about 244.9 ⁇ 0.5, 191.0 ⁇ 0.5, 209.0 ⁇ 0.5, 179.0 ⁇ 0.5, 167.0 ⁇ 0.5, 163.0 ⁇ 0.5, 154.8 ⁇ 0.5, 151.0 ⁇ 0.5, 148.0 ⁇ 0.5, 139.0 ⁇ 0.5, 125.0 ⁇ 0.5, 120.0 ⁇ 0.5, 111.8 ⁇ 0.5, 109.8 ⁇ 0.5, 107.8 ⁇ 0.5, 96.0 ⁇ 0.5, 92.0 ⁇ 0.5, 84.0 ⁇ 0.5, 82.0 ⁇ 0.5, 80.0 ⁇ 0.5, 68.0 ⁇ 0.5, 65.2 ⁇ 0.5, 55.0 ⁇ 0.5, 54.0 ⁇ 0.5, 43.0 ⁇ 0.5, 41.0 ⁇ 0.5, 39.0 ⁇ 0.5, 242.9 ⁇ 0.5, 153.0 ⁇ 0.5, 182.8 ⁇ 0.5, 151.9 ⁇ 0.5, 139.9 ⁇ 0.5, 138.9 ⁇ 0.5, 124.0 ⁇ 0.5, 110.8 ⁇ 0.5, 109.9
- the one or more ions from meso-erythritol may comprise one or more ions selected from the group consisting of ions with a mass to charge ratio (m/z) of about 120.9 ⁇ 0.5, 88.9 ⁇ 0.5, 120.0 ⁇ 0.5, 119.0 ⁇ 0.5, 105.9 ⁇ 0.5, 103.0 ⁇ 0.5, 100.9 ⁇ 0.5, 93.9 ⁇ 0.5, 92.8 ⁇ 0.5, 79.9 ⁇ 0.5, 77.0 ⁇ 0.5, 70.9 ⁇ 0.5, 67.9 ⁇ 0.5, 65.8 ⁇ 0.5, 65.0 ⁇ 0.5, 58,9 ⁇ 0.5, 52.0 ⁇ 0.5, 43.2 ⁇ 0.5, and 40.0 ⁇ 0.5.
- m/z mass to charge ratio
- the one or more ions from arabitol may comprise one or more ions selected from the group consisting of ions with a mass to charge ratio (m/z) of about 150.9 ⁇ 0.5, 88.9 ⁇ 0.5, 149.1 ⁇ 0.5, 136.0 ⁇ 0.5, 133.0 ⁇ 0.5, 131.1 ⁇ 0.5, 119.0 ⁇ 0.5, 112.810.5, 108.2 ⁇ 0.5, 103.1 ⁇ 0.5, 100.9 ⁇ 0.5, 96.8 ⁇ 0.5, 91.8 ⁇ 0.5, 84.9 ⁇ 0.5, 83.0 ⁇ 0.5, 81.9 ⁇ 0.5, 78.8 ⁇ 0.5, 77.0 ⁇ 0.5, 73.0 ⁇ 0.5, 70.9 ⁇ 0.5, 68.9 ⁇ 0.5, 66.9 ⁇ 0.5, 59.0 ⁇ 0.5, 57.0 ⁇ 0.5, 55.0 ⁇ 0.5, 45.0 ⁇ 0.5, 42.9 ⁇ 0.5, and 41.2 ⁇ 0.5.
- m/z mass to charge ratio
- the one or more ions from myo-inositol may comprise one or more ions selected from the group consisting of ions with a mass to charge ratio (m/z) of about 178.9 ⁇ 0.5, 87.0 ⁇ 0.5, 177.2 ⁇ 0.5, 161.0 ⁇ 0.5, 159.0 ⁇ 0.5, 146.810.5, 141.0 ⁇ 0.5, 134.9 ⁇ 0.5, 128.8 ⁇ 0.5, 125.0 ⁇ 0.5, 122.7 ⁇ 0.5, 117.0 ⁇ 0.5, 112.8 ⁇ 0.5, 110.9 ⁇ 0.5, 100.9 ⁇ 0.5, 98.9 ⁇ 0.5, 97.0 ⁇ 0.5, 95.0 ⁇ 0.5, 90.8 ⁇ 0.5, 89.0 ⁇ 0.5, 85.0 ⁇ 0.5, 82.9 ⁇ 0.5, 81.0 ⁇ 0.5, 78.8 ⁇ 0.5, .74.8 ⁇ 0.5, 73.1 ⁇ 0.5, 70.9 ⁇ 0.5, 68.9 ⁇ 0.5, 59.0 ⁇ 0.5, 56.9 ⁇ 0.5, 55.0 ⁇ 0.5, 45.1 ⁇ 0.5, 43.0 ⁇ 0.5, and
- the one or more ions from N-acetylserine may comprise one or more ions selected from the group consisting of ions with a mass to charge ratio (m/z) of about 145.9 ⁇ 0.5, 74.0 ⁇ 0.5, 119.0 ⁇ 0.5, 116.0 ⁇ 0.5, 104.9 ⁇ 0.5, 103.9 ⁇ 0.5, 103.0 ⁇ 0.5, 97.9 ⁇ 0.5, 84.0 ⁇ 0.5, 81.0 ⁇ 0.5, 72.0 ⁇ 0.5, 70.0 ⁇ 0.5, 64.9 ⁇ 0.5, 60.8 ⁇ 0.5, 57.0 ⁇ 0.5, 42.0 ⁇ 0.5, and 40.9 ⁇ 0.5.
- m/z mass to charge ratio
- the one or more ions from N-acetylalanine may comprise one or more ions selected from the group consisting of ions with a mass to charge ratio (m/z) of about 131.9 ⁇ 0.5, 89.9 ⁇ 0.5, 114.1 ⁇ 0.5, 86.1 ⁇ 0.5, and 44.0 ⁇ 0.5.
- the one or more ions from 3-methylhistidine may comprise one or more ions selected from the group consisting of ions with a mass to charge ratio (m/z) of about 170.0 ⁇ 0.5, 94.9 ⁇ 0.5, 109.1 ⁇ 0.5, 97.0 ⁇ 0.5, 96.0 ⁇ 0.5, 92.9 ⁇ 0.5, 83.0 ⁇ 0.5, 81.0 ⁇ 0.5, 80.1 ⁇ 0.5, 70.2 ⁇ 0.5, 67.9 ⁇ 0.5, 67.0 ⁇ 0.5, 55.0 ⁇ 0.5, 54.0 ⁇ 0.5, 42.0 ⁇ 0.5, and 41.0 ⁇ 0.5.
- m/z mass to charge ratio
- the one or more ions from trans-4-hydroxyproline may comprise one or more ions selected from the group consisting of ions with a mass to charge ratio (m/z) of about 131.9 ⁇ 0.5, 68.0 ⁇ 0.5, 114.2 ⁇ 0.5, 86.0 ⁇ 0.5, 58.0 ⁇ 0.5, and 41.0 ⁇ 0.5.
- the one or more ions from kynurenine may comprise one or more ions selected from the group consisting of ions with a mass to charge ratio (m/z) of about 209.0 ⁇ 0.5, 94.0 ⁇ 0.5, 192.1 ⁇ 0.5, 191.2 ⁇ 0.5, 174.0 ⁇ 0.5, 164.1 ⁇ 0.5, 163.1 ⁇ 0.5, 150.010.5, 146.1 ⁇ 0.5, 136.0 ⁇ 0.5, 119.9 ⁇ 0.5, 118.1 ⁇ 0.5, 98.9 ⁇ 0.5, 88.0 ⁇ 0.5, and 73.9 ⁇ 0.5.
- m/z mass to charge ratio
- the one or more ions from urea may comprise one or more ions selected from the group consisting of ions with a mass to charge ratio (m/z) of about 60.9 ⁇ 0.5, 29.2 ⁇ 0.5, 44.0 ⁇ 0.5, 43.0 ⁇ 0.5, 42.1 ⁇ 0.5, 28.0 ⁇ 0.5, and 27.1 ⁇ 0.5.
- m/z mass to charge ratio
- the one or more ions from 3-indoxylsulfate may comprise one or more ions selected from the group consisting of ions with a mass to charge ratio (m/z) of about 211.8 ⁇ 0.5, 79.9 ⁇ 0.5, 132.0 ⁇ 0.5, 104.0 ⁇ 0.5, 80.9 ⁇ 0.5, and 77.0 ⁇ 0.5.
- the one or more ions from TMAP may comprise one or more ions selected from the group consisting of ions with a mass to charge ratio (m/z) of about 229.1 ⁇ 0.5, 170.1 ⁇ 0.5, 142.2 ⁇ 0.5, 126.0 ⁇ 0.5, 124.0 ⁇ 0.5, 116.0 ⁇ 0.5, 114.0 ⁇ 0.5, 98.0 ⁇ 0.5, 96.0 ⁇ 0.5, 70.0 ⁇ 0.5, 68.0 ⁇ 0.5, 60.0 ⁇ 0.5, 59.1 ⁇ 0.5, 58.1 ⁇ 0.5, 54.9 ⁇ 0.5, 227.0 ⁇ 0.5, 181.0 ⁇ 0.5, 159.0 ⁇ 0.5, 133.2 ⁇ 0.5, 114.8 ⁇ 0.5, 112.9 ⁇ 0.5, 105.8 ⁇ 0.5, 89.1 ⁇ 0.5, 71.0 ⁇ 0.5, 69.0 ⁇ 0.5, and 45.1 ⁇ 0.5.
- m/z mass to charge ratio
- the one or more ions from C-glycosyltryptophan may comprise one or more ions selected from the group consisting of ions with a mass to charge ratio (m/z) of about 365.2 ⁇ 0.5, 245.0 ⁇ 0.5, 130.0 ⁇ 0.5, 142.0 ⁇ 0.5, 156.0 ⁇ 0.5, and 116.0 ⁇ 0.5.
- the method includes determining the amount of a plurality of analytes, such as, for example, the amount of two or more analytes selected from the group consisting of tryptophan and 3-indoxylsulfate in a sample by mass spectrometry using a single injection.
- the method includes determining the amount of a plurality of analytes, such as, for example, the amount of two or more or three analytes selected from the group consisting of tryptophan, 3-indoxylsulfate, and C-glycosyltryptophan in a sample by mass spectrometry using a single injection.
- the method includes determining the amount of a plurality of analytes, such as, for example, the amount of two or more, three or more, four or more, or five analytes selected from the group consisting of pseudouridine, N-acetylthreonine, phenylacetylglutamine, tryptophan, and creatinine, in a sample by mass spectrometry using a single injection.
- the method includes determining the amount of N-acetylthreonine, pseudouridine, phenylacetylglutamine, and tryptophan.
- the levels of two or more analytes are determined wherein the two or more analytes comprise pseudouridine and N-acetylthreonine.
- the levels of two or more analytes are determined wherein the two or more analytes comprise pseudouridine and phenylacetylglutamine.
- the levels of two or more analytes are determined wherein the two or more analytes comprise pseudouridine and tryptophan.
- the levels of two or more analytes are determined wherein the two or more analytes comprise pseudouridine and creatinine.
- the levels of two or more analytes are determined wherein the two or more analytes comprise N-acetylthreonine and phenylacetylglutamine.
- the levels of two or more analytes are determined wherein the two or more analytes comprise N-acetylthreonine and tryptophan.
- the levels of two or more analytes are determined wherein the two or more analytes comprise N-acetylthreonine and creatinine.
- the levels of two or more analytes are determined wherein the two or more analytes comprise phenylacetylglutamine and tryptophan.
- the levels of two or more analytes are determined wherein the two or more analytes comprise phenylacetylglutamine and creatinine.
- the levels of two or more analytes are determined wherein the two or more analytes comprise tryptophan and creatinine.
- the levels of two or more analytes are determined wherein the two or more analytes comprise TMAP and pseudouridine.
- the levels of two or more analytes are determined wherein the two or more analytes comprise TMAP and N-acetylthreonine.
- the levels of two or more analytes are determined wherein the two or more analytes comprise TMAP and phenylacetylglutamine.
- the levels of two or more analytes are determined wherein the two or more analytes comprise TMAP and tryptophan.
- the levels of two or more analytes are determined wherein the two or more analytes comprise TMAP and creatinine.
- the levels of two or more analytes are determined wherein the two or more analytes comprise C-glycosyltryptophan and pseudouridine.
- the levels of two or more analytes are determined wherein the two or more analytes comprise C-glycosyltryptophan and N-acetylthreonine.
- the levels of two or more analytes are determined wherein the two or more analytes comprise C-glycosyltryptophan and phenylacetylglutamine.
- the levels of two or more analytes are determined wherein the two or more analytes comprise C-glycosyltryptophan and tryptophan.
- the levels of two or more analytes are determined wherein the two or more analytes comprise C-glycosyltryptophan and creatinine.
- the levels of two or more analytes are determined wherein the two or more analytes comprise C-glycosyltryptophan and TMAP.
- the method includes determining the amount of a plurality of analytes, such as, for example, the amount of two or more, three or more, four or more, or five analytes selected from the group consisting of N-acetylthreonine, arabitol, phenylacetylglutamine, creatinine, and pseudouridine, in a sample by mass spectrometry using a single injection.
- analytes such as, for example, the amount of two or more, three or more, four or more, or five analytes selected from the group consisting of N-acetylthreonine, arabitol, phenylacetylglutamine, creatinine, and pseudouridine
- the method includes determining the amount of a plurality of analytes, such as, for example, the amount of two or more, three or more, four or more, five or more, or six analytes selected from the group consisting of N-acetylthreonine, pseudouridine, meso-erythritol, arabitol, myo-inositol, and N-acetylserine, in a sample by mass spectrometry using a single injection.
- analytes such as, for example, the amount of two or more, three or more, four or more, five or more, or six analytes selected from the group consisting of N-acetylthreonine, pseudouridine, meso-erythritol, arabitol, myo-inositol, and N-acetylserine
- the method includes determining the amount of a plurality of analytes, such as, for example, the amount of two or more, three or more, four or more, five or more or six analytes selected from the group consisting of N-acetylthreonine, pseudouridine, phenylacetylglutamine, tryptophan, TMAP, and creatinine, in a sample by mass spectrometry using a single injection.
- analytes such as, for example, the amount of two or more, three or more, four or more, five or more or six analytes selected from the group consisting of N-acetylthreonine, pseudouridine, phenylacetylglutamine, tryptophan, TMAP, and creatinine
- the method includes determining the amount of a plurality of analytes, such as, for example, the amount of two or more, three or more, four or more, five or more, or six analytes selected from the group consisting of N-acetylthreonine, myo-inositol, tryptophan, phenylacetylglutamine, creatinine, and pseudouridine, in a sample by mass spectrometry using a single injection.
- analytes such as, for example, the amount of two or more, three or more, four or more, five or more, or six analytes selected from the group consisting of N-acetylthreonine, myo-inositol, tryptophan, phenylacetylglutamine, creatinine, and pseudouridine
- the method includes determining the amount of a plurality of analytes, such as, for example, the amount of two or more, three or more, four or more, five or more, six or more, seven or more, eight or more, or nine analytes selected from the group consisting of N-acetylthreonine, phenylacetylglutamine, tryptophan, creatinine, N-acetylalanine, 3-methylhistidine, trans-4-hydroxyproline, kynurenine, urea, and combinations thereof in a sample by mass spectrometry using a single injection. Exemplary combinations of analytes are shown in Table A, provided as Appendix A.
- the method includes determining the amount of a plurality of analytes, such as, for example, the amount of two or more, three or more, four or more, five or more, six or more, seven or more, eight or more, nine or more, or ten analytes selected from the group consisting of N-acetylthreonine, meso-erythritol, arabitol, myo-inositol, 3-indoxyl sulfate, tryptophan, phenylacetylglutamine, creatinine, pseudouridine, and N-acetylserine, and combinations thereof in a sample by mass spectrometry using a single injection.
- analytes such as, for example, the amount of two or more, three or more, four or more, five or more, six or more, seven or more, eight or more, nine or more, or ten analytes selected from the group consisting of N-acetylthreonine, meso-erythri
- the run time may be 7 minutes or less. In another embodiment, the run time may be less than 4 minutes.
- the sample may be a plasma sample or a serum sample.
- the sample volume may be 10 ⁇ l to 200 ⁇ l.
- the sample volume may be 10 ⁇ l, 15, 20, 25, 30, 40, 50 ⁇ l, 60, 70, 80, 90, 100, 120, 140, 160, 180 or 200 ⁇ l or any other volume between 10 and 200 ⁇ l.
- Methods are described for measuring the amount of five analytes selected from the group of metabolites consisting of: N-acetylthreonine, pseudouridine, phenylacetylglutamine, tryptophan, and creatinine in a sample.
- Mass spectrometric methods are described for quantifying multiple analytes in a sample using a single injection method. The methods use a liquid chromatography step such as UPLC to perform a separation (purification, enrichment) of selected analytes combined with methods of mass spectrometry, thereby providing a high-throughput assay system for quantifying a plurality of analytes in a sample that is amenable to automation.
- the methods presented herein provide advantages over current methods to measure these analytes.
- the ability to measure, in a single injection, a plurality of analytes in various combinations reduces the time required to obtain analysis results, uses fewer resources in terms of laboratory disposables (e.g., tubes, pipette tips, reagents), laboratory instruments and human resources. These improvements lead to savings by decreasing the costs of the assays and increasing the instrument and laboratory capacity for sample analysis.
- solid phase extraction refers to a sample preparation process where components of complex mixture (i.e., mobile phase) are separated according to their physical and chemical properties using solid particle chromatographic packing material (i.e. solid phase or stationary phase).
- solid particle packing material i.e. solid phase or stationary phase.
- the solid particle packing material may be contained in a cartridge type device (e.g. a column).
- separation refers to the process of separating a complex mixture into its component molecules or metabolites.
- Common, exemplary laboratory separation techniques include electrophoresis and chromatography.
- chromatography refers to a physical method of separation in which the components (i.e., chemical constituents) to be separated are distributed between two phases, one of which is stationary (stationary phase) while the other (the mobile phase) moves in a definite direction.
- the mobile phase may be gas ("gas chromatography", “GC”) or liquid (“liquid chromatography”, “LC”). Chromatographic output data may be used in embodiments of the method described herein.
- liquid chromatography refers to a process of selective inhibition of one or more components of a fluid solution as the fluid uniformly moves through a column of a finely divided substance or through capillary passageways. The inhibition results from the distribution of the components of the mixture between one or more stationary phases and the mobile phase(s) as the mobile phase(s) move relative to the stationary phase(s).
- liquid chromatography include "Reverse phase liquid chromatography” or “RPLC”, “high performance liquid chromatography” or “HPLC”, “ultra-high performance liquid chromatography” or “UPLC” or “UHPLC”.
- retention time refers to the elapsed time in a chromatography process since the introduction of the sample into the separation device.
- the retention time of a constituent of a sample refers to the elapsed time in a chromatography process between the time of injection of the sample into the separation device and the time that the constituent of the sample elutes (e.g., exits from) the portion of the separation device that contains the stationary phase.
- retention index of a sample component refers to a number, obtained by interpolation (usually logarithmic), relating the retention time or the retention factor of the sample component to the retention times of standards eluted before and after the peak of the sample component, a mechanism that uses the separation characteristics of known standards to remove systematic error.
- separation index refers to a metric associated with chemical constituents separated by a separation technique.
- the separation index may be retention time or retention index.
- the separation index may be physical distance traveled by the chemical constituent.
- separation information and “separation data” refer to data that indicates the presence or absence of chemical constituents with respect to the separation index.
- separation data may indicate the presence of a chemical constituent having a particular mass eluting at a particular time.
- the separation data may indicate that the amount of the chemical constituent eluting over time rises, peaks, and then falls.
- a graph of the presence of the chemical constituent plotted over the separation index (e.g., time) may display a graphical peak.
- peak information and “peak data” are synonymous with the terms “separation information” and "separation data”.
- MS Mass Spectrometry
- ionizing or ionizing and fragmenting a target molecule then analyzing the ions, based on their mass/charge ratios, to produce a mass spectrum that serves as a "molecular fingerprint". Determining the mass/charge ratio of an object may be done through means of determining the wavelengths at which electromagnetic energy is absorbed by that object. There are several commonly used methods to determine the mass to charge ratio of an ion, some measuring the interaction of the ion trajectory with electromagnetic waves, others measuring the time an ion takes to travel a given distance, or a combination of both. The data from these fragment mass measurements can be searched against databases to obtain identifications of target molecules.
- operating in negative mode or “operating in negative MRM mode” or “operating in negative ionization mode” refer to those mass spectrometry methods where negative ions are generated and detected.
- operating in positive mode or “operating in positive MRM mode” or “operating in positive ionization mode” refer to those mass spectrometry methods where positive ions are generated and detected.
- mass analyzer refers to a device in a mass spectrometer that separates a mixture of ions by their mass-to-charge (“m/z”) ratios.
- m/z refers to the dimensionless quantity formed by dividing the mass number of an ion by its charge number. It has long been called the "mass-to-charge” ratio.
- the term "source” refers to a device in a mass spectrometer that ionizes a sample to be analyzed.
- ion sources include electrospray ionization (ESI), atmospheric pressure chemical ionization (APCI), heated electrospray ionization (HESI), atmospheric pressure photoionization (APPI), flame ionization detector (FID), matrix-assisted laser desorption ionization (MALDI), etc.
- detector refers to a device in a mass spectrometer that detects ions.
- the term "ion” refers to any object containing a charge, which can be formed for example by adding electrons to or removing electrons from the object.
- mass spectrum refers to a plot of data produced by a mass spectrometer, typically containing m/z values on x-axis and intensity values on y-axis.
- scan refers to a mass spectrum that is associated with a particular separation index.
- systems that use a chromatographic separation technique may generate multiple scans, each scan at a different retention time.
- run time refers to the time from sample injection to generation of the instrument data.
- the total run time includes chromatography and mass spectrometry for the sample.
- tandem MS refers to an operation in which a first MS step, called the "primary MS", is performed, followed by performance of one or more of a subsequent MS step, generically referred to as "secondary MS".
- primary MS an ion, representing one (and possibly more than one) chemical constituent, is detected and recorded during the creation of the primary mass spectrum.
- secondary MS in which the substance of interest undergoes fragmentation in order to cause the substance to break into sub-components, which are detected and recorded as a secondary mass spectrum.
- secondary MS in which the substance of interest undergoes fragmentation in order to cause the substance to break into sub-components, which are detected and recorded as a secondary mass spectrum.
- the ion of interest in the primary MS corresponds to a "parent” or precursor ion, while the ions created during the secondary MS correspond to sub-components of the parent ion and are herein referred to as "daughter” or “product” ions.
- tandem MS allows the creation of data structures that represent the parent-daughter relationship of chemical constituents in a complex mixture. This relationship may be represented by a tree-like structure illustrating the relationship of - the parent and daughter ions to each other, where the daughter ions represent sub-components of the parent ion. Tandem MS may be repeated on daughter ions to determine "grand-daughter” ions, for example.
- tandem MS is not limited to two-levels of fragmentation, but is used generically to refer to multi-level MS, also referred to as "MS n ".
- MS/MS is a synonym for "MS 2 ".
- the term "daughter ion" hereinafter refers to any ion created by a secondary or higher-order (i.e., not the primary) MS.
- the "level" of one or more biomarkers means the absolute or relative amount or concentration of the biomarker measured in the sample.
- sample or “biological sample” means biological material isolated from a subject.
- the biological sample may contain any biological material suitable for detecting the desired biomarkers, and may comprise cellular and/or non-cellular material from the subject.
- the sample can be isolated from any suitable biological fluid or tissue such as, for example, blood, blood plasma (plasma), blood serum (serum), urine, cerebral spinal fluid (CSF), or tissue.
- Subject means any animal, but is preferably a mammal, such as, for example, a human, monkey, mouse, rabbit or rat.
- C-glycosyltryptophan is also referred to as 2-mannopyranosyl-tryptophan, 2-( ⁇ -D-Mannopyranosyl)-L-tryptophan, Manno-L-tryptophan, 2-MT. Accordingly, these terms are used interchangeably herein.
- Sample extracts containing analytes are prepared by isolating the analytes away from the macromolecules (e.g., proteins, nucleic acids, lipids) that may be present in the sample. Some or all analytes in a sample may be bound to proteins.
- Various methods may be used to disrupt the interaction between analyte(s) and protein prior to MS analysis.
- the analytes may be extracted from a sample to produce a liquid extract, while the proteins that may be present are precipitated and removed. Proteins may be precipitated using, for example, a solution of ethyl acetate or methanol.
- an ethyl acetate or methanol solution is added to the sample, then the mixture may be spun in a centrifuge to separate the liquid supernatant, which contains the extracted analytes, from the precipitated proteins
- analytes may be released from protein without precipitating the protein.
- a formic acid solution may be added to the sample to disrupt the interaction between protein and analyte.
- ammonium sulfate, a solution of formic acid in ethanol, or a solution of formic acid in methanol may be added to the sample to disrupt ionic interactions between protein and analyte without precipitating the protein.
- a solution of acetonitrile, methanol, water, and formic acid may be used to extract analytes from the sample.
- the extract may be subjected to various methods including liquid chromatography, electrophoresis, filtration, centrifugation, and affinity separation as described herein to purify or enrich the amount of the selected analyte relative to one or more other components in the sample.
- QC samples may be used.
- concentration of a given analyte(s) to be used in a QC sample may be determined based on lower limit of quantitation (LLOQ) or upper limit of quantitation (ULOQ) of the given analyte(s), as detected in a sample.
- LLOQ lower limit of quantitation
- ULOQ upper limit of quantitation
- the LLOQ may be represented by the concentration of a standard (e.g., Standard A)
- the ULOQ may be represented by the concentration of a second standard (e.g., Standard H).
- the Low QC value may be set at a concentration of about 3 X LLOQ
- the Mid QC value may be at a concentration of about 25-50% of High QC
- the High QC value may be at a concentration of about 80% of the ULOQ.
- the QC target concentration levels may be chosen based on a combination of the Analytical Measurement Range (AMR) and the frequency of sample results as measured in a set of representative samples.
- AMR Analytical Measurement Range
- the analyte extract Prior to mass spectrometry, the analyte extract is subjected to liquid chromatography and optionally one or more further separation methods such as electrophoresis, filtration, centrifugation, or affinity separation.
- the liquid chromatography (LC) may be ultra high performance LC (UHPLC).
- UHPLC may be conducted using a reversed phase column chromatographic system, hydrophilic interaction chromatography (HILIC), or a mixed phase column chromatographic system.
- HILIC hydrophilic interaction chromatography
- the column heater (or column manager) for LC may be set at a temperature of from about 25°C to about 80°C.
- the column heater may be set at about 30°C, 40°C, 50°C, 60°C, 70°C, etc.
- UHPLC may be conducted using HILIC system.
- UHPLC may be conducted using a reversed phase column chromatographic system.
- the system may comprise two or more mobile phases. Mobile phases may be referred to as, for example, mobile phase A, mobile phase B, mobile phase A', and mobile phase B'.
- mobile phase A may comprise ammonium formate, formic acid, and water
- mobile phase B may comprise acetonitrile.
- the concentration of ammonium formate in mobile phase A may range from 0.1mM to 100mM and the concentration of formic acid may range from 0.001% to 5%. Further, the concentration of acetonitrile may range from 0% to 100%.
- mobile phase A may comprise 20mM ammonium formate+1% formic acid in water and mobile phase B may comprise 100% acetonitrile.
- mobile phase A may comprise 50mM ammonium formate+1% formic acid in water and mobile phase B may comprise 100% acetonitrile.
- linear gradient elution may be used for chromatography.
- the starting conditions for linear gradient elution may include the concentration of a mobile phase (e.g., mobile phase A) and/or the flow rate of a mobile phase through the column (e.g., mobile phase A).
- the starting conditions may be optimized for the separation and/or retention of one or more analytes.
- the gradient conditions may also be optimized for the separation and/or retention of analytes and may vary depending on the flow rate selected. For example, with initial conditions of 12% mobile phase A and 550 ⁇ L/min flow rate, mobile phase A may be increased to 22% at 1.9 min, to 30% at 2.5 min, then to 42% at 2.7 min.
- Mobile phase B may revert to 12% at 3.4 min where it may be maintained for 0.3 min for equilibration for next sample injection.
- initial conditions may be 12% mobile phase A and a 500 ⁇ L/min flow rate.
- Mobile phase A may be increased to 22% at 1.9 min, to 30% at 2.5 min, to 35% at 3.1 min, to 38% at 3.7 min, and to 45% at 5.0 min where it may be maintained for 0.5 min.
- Mobile phase A may revert to 12% at 5.7 min where it may be maintained for 1.3 min for equilibration before the next sample injection.
- initial conditions may be 12% mobile phase A and 550 ⁇ L/min flow rate.
- Mobile phase A may be increased to 22% at 1.9 min, to 30% at 2.5 min, and 42% at 2.7 min. Then, mobile phase A may revert to 12% at 3.4 min where it may be maintained for 0.3 min for equilibration before the next sample injection.
- mobile phase A may comprise ammonium acetate, ammonium hydroxide, and water
- mobile phase B may comprise acetonitrile.
- the concentration of ammonium acetate may range from about 5mM to about 200mM.
- the concentration of ammonium acetate may be about 50mM or about 100mM.
- the concentration of ammonium hydroxide may range from about 0.001% to about 1%.
- the concentration of ammonium hydroxide may be about 0.1% or about 0.2%.
- mobile phase A may be 50 mM ammonium acetate + 0.1% ammonium hydroxide in water and mobile phase B may be 100% acetonitrile.
- Linear gradient elution may be used for chromatography and may be carried out with an initial condition of 7% mobile phase A and a flow rate of 450 ⁇ L/min.
- the proportion of mobile phase A may then be increased to 20% at 1.5 min.
- the proportion of mobile phase A may be increased to 30% at 4.7 min, to 35% at 5.0 min then back to 7% at 5.1 min where it may be maintained for 1.9 min for equilibration before the next sample injection.
- the total run time may be 7 minutes or less.
- mobile phase A may be 100 mM ammonium acetate + 0.2% ammonium hydroxide in water and mobile phase B may be 100% acetonitrile.
- Linear gradient elution may be used for chromatography and may be carried out with an initial condition of 7% mobile phase A and a flow rate of 500 ⁇ L/min.
- Mobile phase A may be increased to 20% at 1.5 min, to 30% at 4.7 min, and to 35% at 5.0 min. Then, mobile phase A may revert to 7% at 5.1 min where it may be maintained for 1.9 min for equilibration before the next sample injection.
- linear gradient elution may be carried out with an initial condition of 7% mobile phase A and a flow rate of 800 ⁇ L/min.
- Mobile phase A may be increased to 20% at 0.9 min, to 25% at 1.9 min, and to 30% at 2.1 min.
- mobile phase A may revert to 7% at 2.2 min where it may be maintained for 0.5 min for equilibration before the next sample injection.
- mobile phase A may be increased to 22% at 0.9 min, to 30% at 2.5 min, and to 35% at 2.7 min. Then, mobile phase A may revert to 7% at 2.8 min where it may be maintained for 0.4 min for equilibration before the next sample injection.
- mobile phase A may comprise formic acid and water
- mobile phase B may comprise formic acid and acetonitrile.
- mobile phase A may contain from about 0.001 to about 1.0% formic acid
- mobile phase B may contain formic acid and acetonitrile from 0-100%.
- the concentration of mobile phase A may be about 0.1% formic acid in water and the concentration of mobile phase B may be about 0.1% formic acid in acetonitrile.
- Linear gradient elution may be used for chromatography and may be carried out with initial conditions of 2% mobile phase B and a flow rate was 700 ⁇ L/min.
- Mobile phase B may be increased to 90% at 2.5 min, maintained at 90% for 0.3 min, and may then be decreased to 2% at 2.9 min where it may be maintained for 0.4 min for equilibration before the next sample injection.
- the total run time may be less than 4 minutes.
- One or more analytes may be ionized by any method known to the skilled artisan, including, for example, mass spectrometry.
- Mass spectrometry is performed using a mass spectrometer that includes an ion source for ionizing the fractionated sample and creating charged molecules for further analysis. Ionization of the sample may be performed by, for example, electrospray ionization (ESI).
- Other ion sources may include, for example, atmospheric pressure chemical ionization (APCI), heated electrospray ionization (HESI), atmospheric pressure photoionization (APPI), flame ionization detector (FID), or matrix-assisted laser desorption ionization (MALDI).
- APCI atmospheric pressure chemical ionization
- HESI heated electrospray ionization
- APPI atmospheric pressure photoionization
- FID flame ionization detector
- MALDI matrix-assisted laser desorption ionization
- the choice of ionization method may be determined
- the one or more analytes may be ionized in positive or negative mode to create one or more ions.
- the analytes N-acetylthreonine, pseudouridine, phenylacetylglutamine, tryptophan, TMAP, creatinine, N-acetylalanine, 3-methylhistidine, trans-4-hydroxyproline, kynurenine, and urea may be ionized in positive mode.
- the analytes N-acetylthreonine, TMAP, pseudouridine, meso-erythritol, arabitol, myo-inositol, N-acetylserine, tryptophan, C-glycosyltryptophan, and 3-indoxyl sulfate may be ionized in negative mode.
- the analytes N-acetylthreonine, meso-erythritol, arabitol, myo-inositol, 3-indoxyl sulfate, tryptophan, phenylacetylglutamine, creatinine, pseudouridine, and N-acetylserine may be ionized in negative mode.
- analytes may be ionized in positive mode and negative mode in a single injection.
- Mass spectrometer instrument settings may be optimized for the given method and/or for the particular mass spectrometer used.
- the instrument may use various gases, for example, nitrogen, helium, argon, or zero air.
- Mass spectrometry may be performed using AB Sciex QTrap 5500 mass spectrometers.
- the mass spectrometer may be operated in positive multiple reaction monitoring (MRM) mode.
- the ionspray voltage setting may range from about 0.5kV to about 5.0kV; in one embodiment the voltage may be set at 4.0 kV.
- the source temperature may range from about 350°C to about 600°C; in one embodiment the source temperature may be set at 550°C.
- the curtain gas may range from about 10 to about 55 psi; in one embodiment the curtain gas is set at 20 psi.
- the nebulizer and desolvation gas flow rates may range from about 0 to about 90 psi. In one embodiment the flow rates may be set at 75.
- the CAD gas setting may range from high to low; in one embodiment the collisionally activated dissociation (CAD) gas is set at medium. Declustering potential may range from less than 15V to more than 170V.
- the collision energy (CE) may range from less than 12 eV to more than 100 eV.
- the entrance potential (EP) setting may range from less than about 10V to more than 10V.
- the collision cell exit potential (CXP) setting may range from less than 8V to more than 14V.
- the instrument may be operated in negative MRM mode.
- Ionspray voltage settings may range from -0.5kV to -5.5kV; in one embodiment the voltage may be set at -4.0 kV. In one embodiment, the voltage may be set at -4.5 kV.
- the source temperature may range from about 350 °C to 600 °C; in one embodiment the source temperature may be set at 550 °C.
- the curtain gas may range from 10 to 30 or another appropriate value; in one embodiment the curtain gas may be set at 20.
- the nebulizer and desolvation gas flow rates may range from 40 to 80 or another appropriate value. In one embodiment the flow rates may be set at 70; in another embodiment, the flow rates may be set at 50.
- the nebulizer gas flow rate may be set at 60 and the desolvation gas flow rate may be set at 65.
- the CAD gas may range from low to high. In one example the CAD may be set, for example, at medium. In another example, the CAD may be set at high.
- the positively or negatively charged ions may be analyzed to determine a mass-to-charge ratio.
- exemplary suitable analyzers for determining mass-to-charge ratios include quadrupole analyzers, ion trap analyzers, and time of flight analyzers.
- the ions may be detected using, for example, a selective mode or a scanning mode.
- Exemplary scanning modes include MRM and selected reaction monitoring (SRM).
- tandem MS may be accurate-mass tandem MS.
- the accurate-mass tandem mass spectrometry may use a quadrupole time-of-flight (Q-TOF) analyzer.
- Tandem MS allows the creation of data structures that represent the parent-daughter relationship of chemical constituents in a complex mixture. This relationship may be represented by a tree-like structure illustrating the relationship of the parent and daughter ions to each other, where the daughter ions represent sub-components of the parent ion.
- a primary mass spectrum may contain five distinct ions, which may be represented as five graphical peaks.
- Each ion in the primary MS may be a parent ion.
- Each parent ion may be subjected to a secondary MS that produces a mass spectrum showing the daughter ions for that particular parent ion.
- the parent/daughter relationship may be extended to describe the relationship between separated components (e.g., components eluting from the chromatography state) and ions detected in the primary MS, and to the relationship between the sample to be analyzed and the separated components.
- the mass spectrometer typically provides the user with an ion scan (i.e., a relative abundance of each ion with a particular mass/charge over a given range).
- Mass spectrometry data may be related to the amount of the analyte in the original sample by a number of methods.
- a calibration standard is used to generate a standard curve (calibration curve) so that the relative abundance of a given ion may be converted into an absolute amount of the original analyte.
- the calibration standard may be an external standard and a standard curve may be generated based on ions generated from those standards to calculate the quantity of one more analytes.
- the external standard may be an unlabeled analyte.
- Internal standards may be added to calibration standards and/or test samples.
- An internal standard may be used to account for loss of analytes during sample processing in order to get a more accurate value of a measured analyte in the sample.
- the ratio of analyte peak area to internal standard peak area in the levels of the calibration standards may be used to generate a calibration curve and quantitate samples.
- One or more isotopically labeled analogs of analytes for example, N-acetyl-d 3 -DL-threonine-d 2 , phenylacetylglutamine-d 5 , creatinine-d 3 , L-tryptophan-d 5.
- the analysis data may be sent to a computer and processed using computer software.
- peak area ratios of analyte to internal standard are fitted against the concentrations of the calibration standards using a statistical regression method for quantitation.
- the statistical regression is weighted linear least squares regression. The slope and intercept calculated using the calibration curve may be used to calculate the unknown concentrations of analytes in experimental samples.
- the concentration values are entered into a multivariate algorithm to generate an estimated GFR (Glomerular Filtration Rate) score.
- GFR Global Filtration Rate
- concentrations of two analytes, three analytes, four analytes, five analytes, or six analytes selected from N-acetylthreonine, phenylacetylglutamine, tryptophan, TMAP, pseudouridine, and creatinine may be determined.
- clinical parameters e.g., BUN, SCr, urine albumin measurements
- markers of kidney function e.g., ⁇ -2 microglobulin, ⁇ -TRACE, 2-mannopyranosyl tryptophan (2-MPT)
- patient information e.g., age, family history of CKD, other risk factors
- kits may include packaging material and measured amounts of one or more analyte standards or internal standards in amounts sufficient for one or more assays.
- the internal standards may be isotopically labeled
- the kit may comprise pre-made mobile phase solutions
- the kit may comprise mobile phase reagents and instructions to prepare the mobile phase solutions.
- Kits may also comprise instructions recorded in tangible form (e.g. on paper such as, for example, an instruction booklet or an electronic medium) for using the reagents to measure the one or more analytes.
- Mass spectrometric grade (98%) formic acid and ammonium formate (>98%) were obtained from Sigma-Aldrich; HPLC grade methanol and acetonitrile were obtained from JT Baker; and Hydrochloric acid, 6N (Certified) was obtained from Fisher Scientific.
- a Multi-Tube Vortexer from VWR Scientific was used for mixing. Centrifugation of plates was carried out in a Sorvall ST 40R centrifuge from Thermo Scientific with a 3617 bucket rotor. Human plasma (lithium heparin) and serum were obtained from Bioreclamation. Bovine serum albumin (fatty acid free) was obtained from GenDepot.
- Sample preparation was carried out in a polypropylene 96-well plate. Study samples. QC samples, and calibration standards were thawed on ice and vortexed. To extract the analytes from the study samples and QC samples, 175 ⁇ L of a working internal standard (WIS) solution of acetonitrile/methanol/water/formic acid mixture (88/10/2/0.2) containing the appropriate internal standard(s) was added to each well.
- the WIS solution may be comprised of one or more internal standards and may comprise one or more internal standards for each of the seventeen analytes described herein.
- the sample blanks were extracted by adding 175 ⁇ L of acetonitrile/methanol/water/formic acid mixture (88/10/2/0.2) without internal standards.
- the WIS concentrations for sixteen analytes are shown in Table 1. All WIS solutions were prepared in a solution of acetonitrile/methanol/water/formic acid (88/10/2/0.2). The determination of WIS concentration may be based on, for example, the concentrations of the analyte in the calibration range. For example, the concentration of the WIS for TMAP may be about the concentration of TMAP calibration standards C and D. Table 1.
- the calibration range of each analyte was determined.
- the LLOQ represents the low end of the calibration range
- the high end of the calibration range is represented by the ULOQ.
- calibrators standards A-H
- the final analyte concentrations in each calibrator are listed in Table 2.
- Calibration spiking solutions were prepared at 20-fold of the corresponding calibration concentrations. Table 2.
- QC levels were determined based on LLOQ and ULOQ.
- Low, mid, and high level QC samples were prepared from combination of human plasma or serum pools of appropriate analyte concentrations with fortification of analytes as necessary.
- LLOQ samples were prepared in a fatty-acid free BSA solution (7.5% in PBS) at the same concentrations as standard A in Table 2 for all analytes.
- QC samples were stored at -80 °C.
- Chromatographic methods were developed using UHPLC to analyze one or more and up to ten analytes from a single injection. For each chromatographic method a single fixed aliquot of 1.0 ⁇ L of the final extraction solution was injected onto the UPLC column for each sample analyzed.
- Chromatography Methods 1, 3, 5, 6, 7 and 8 an Agilent 1290 Infinity UHPLC system equipped with a binary solvent pump unit, a refrigerated autosampler (set at 4 °C), and a column heater (set at 60 °C) was used for liquid chromatography with a HILIC column (Waters ACQUITY UPLC ® BEH Amide, 1.7 ⁇ m, 2.1x150 mm).
- a Waters Acquity UPLC system equipped with a binary solvent pump unit, a refrigerated autosampler (set at 4 °C), and a thermostatted column manager (set at 60 °C) was used for liquid chromatography with a HILIC column (Waters ACQUITY UPLC ® BEH Amide, 1.7 ⁇ m, 2.1 ⁇ 150 mm) for Chromatography Method 2 and with a reversed phase column (Waters ACQUITY UPLC ® BEH C18, 1.7 ⁇ m, 2.1x100 mm) for Chromatography Method 4.
- the details of each chromatography method i.e., mobile phase buffers, elution gradients, flow rates, run time) are exemplified below.
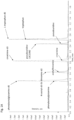
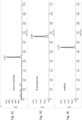
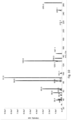
- a liquid chromatography method was developed for the purification and separation in the same injection of one or more, two or more, and up to all five analytes selected from the group consisting of N-acetylthreonine, phenylacetylglutamine, pseudouridine, tryptophan, creatinine and combinations thereof, wherein, if the one or more assayed analytes is only one analyte, the one analyte is not creatinine.
- Mobile phase A was 20 mM ammonium formate +1% formic acid in water and mobile phase B was 100% acetonitrile. Linear gradient elution, was carried out with an initial condition of 12% mobile phase A (88% mobile phase B) and 550 ⁇ L/min flow rate unless otherwise indicated. Mobile phase A was increased from the initial 12% to 22% (78% mobile phase B) at 1.9 min, from 22% to 30% (70% mobile phase B) at 2.5 min, and from 30% to 42% (58% mobile phase B) at 2.7 min. Then, mobile phase A reverted to 12% (88% mobile phase B) at 3.4 min where it was maintained for 0.3 min for equilibration before the next sample was injected. The total run time was 3.70 min.
- Chromatography Method 1 separated a plurality of up to five analytes with good peak shapes. Exemplary chromatograms of the resulting separated analytes are shown in Figures 1A-F . The approximate retention time for the peak of interest for each analyte is indicated. Approximate retention times (in minutes) were 1.11, 2.45, 2.61, 1.43, and 1.83 for phenylacetylglutamine, pseudouridine, tryptophan, N-acetylthreonine, and creatinine, respectively.
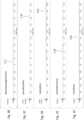
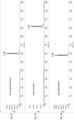
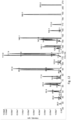
- a liquid chromatography method was developed for the purification and separation in the same injection of one or more, two or more, and up to all six analytes selected from the group consisting of pseudouridine, N-acetylthreonine, meso-erythritol, arabitol, myo-inositol, N-acetylserine and combinations thereof.
- Mobile phase A was 50 mM ammonium acetate + 0.1% ammonium hydroxide in water and mobile phase B was 100% acetonitrile.
- Linear gradient elution was carried out with an initial condition of 7% mobile phase A (93% mobile phase B) and 450 ⁇ L/min flow rate unless otherwise indicated.
- Mobile phase A was increased from the initial 7% to 20% (80% mobile phase B) at 1.5 min, from 20% to 30% (70% mobile phase B) at 4.7 min, and from 30% to 35% (65% mobile phase B) at 5.0 min. Then, mobile phase A reverted to 7% (93% mobile phase B) at 5.1 min where it was maintained for 1.9 min for equilibration before the next sample was injected.
- the total run time was 7.0 min.
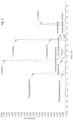
- Chromatography Method 2 separated a plurality of up to six analytes with good peak shapes. Exemplary chromatograms of the resulting separated analytes are shown in Figures 2A-H . Approximate retention times (in minutes) were 2.21, 3.30, 2.72, 2.99, 4.59, and 2.89 for meso-erythritol, N-acetylserine, arabitol, N-acetylthreonine, myo-inositol, and pseudouridine, respectively.
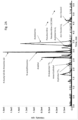
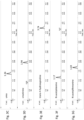
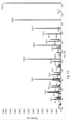
- a liquid chromatography method was developed for the purification and separation in the same injection of one or more, two or more, and up to all nine analytes selected from the group consisting of N-acetylthreonine, phenylacetylglutamine, tryptophan, creatinine, N-acetylalanine, 3-methylhistidine, trans-4-hydroxyproline, kynurenine, urea and combinations thereof, wherein, if the one or more assayed analytes is only one analyte, the one analyte is not creatinine.
- Mobile phase A was 20 mM ammonium formate +1% formic acid in water and mobile phase B was 100% acetonitrile. Linear gradient elution, was carried out with an initial condition of 12% mobile phase A (88% mobile phase B) and 500 ⁇ L/min flow rate unless otherwise indicated. Mobile phase A was increased from the initial 12% to 22% (78% mobile phase B) at 1.9 min, from 22% to 30% (70% mobile phase B) at 2.5 min, from 30% to 35% (65% mobile phase B) at 3.1 min, from 35% to 38% (62% mobile phase B) at 3.7 min, and from 38% to 45% (55% mobile phase B) at 5.0 min where it was maintained for 0.5 min. Then, mobile phase A reverted to 12% (88% mobile phase B) at 5.7 min where it was maintained for 1.3 min for equilibration before the next sample was injected. The total run time was 7.0 min.
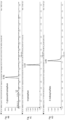
- Chromatography Method 3 separated a plurality of up to nine analytes with good peak shapes. Exemplary chromatograms of the resulting separated analytes are shown in Figures 3A-I . Approximate retention times (in minutes) were 1.36, 1.94, 3.74, 1.17, and 1.69 for urea, creatinine, trans-4-hydroxyproline, N-acetylalanine, N-acetylthreonine, 3-methylhistidine, tryptophan, kynurenine, and phenylacetylglutamine, respectively.
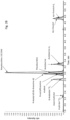
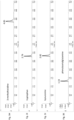
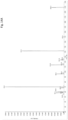
- a liquid chromatography method was developed for the purification and separation in the same injection of one or more, two or more, and up to all three analytes selected from the group consisting of tryptophan, 3-indoxyl sulfate, and C-glycosyltryptophan, and combinations thereof.
- Mobile phase A was 0.1% Formic Acid in water and mobile phase B was 0.1% Formic Acid in Acetonitrile.
- Linear gradient elution was carried out with an initial condition of 2% mobile phase B (98% mobile phase A) and a flow rate of 700 ⁇ L/min.
- Mobile phase B was increased from the initial 2% to 90% (10% mobile phase A) at 2.5 min and was maintained at 90% for 0.3 min. Then, mobile phase B reverted to 2% (98% mobile phase A) at 2.9 min where it was maintained for 0.4 min for equilibration before the next sample was injected.
- the total run time was 3.30 min.
- Chromatography Method 4 separated a plurality of up to three analytes with good peak shapes. Exemplary chromatograms of the resulting separated analytes are shown in Figures 4A-H . Approximate retention times (in minutes) were 0.91 and 0.95 for C-glycosyltryptophan, 1.32 and 1.33 for tryptophan and 1.45 for 3-indoxylsulfate in serum and plasma, respectively.
- a liquid chromatography method was developed for the purification and separation in the same injection of one or more, two or more, and up to all six analytes selected from the group consisting of N-acetylthreonine, phenylacetylglutamine, pseudouridine, tryptophan, TMAP, creatinine, and combinations thereof. If the one or more assayed analytes is only one analyte, the one analyte is not creatinine.
- Mobile phase A was 20 mM ammonium formate +1% formic acid in water and mobile phase B was 100% acetonitrile.
- Linear gradient elution was carried out with an initial condition of 12% mobile phase A (88% mobile phase B) and 550 ⁇ L/min flow rate.
- Mobile phase A was increased from the initial 12% to 22% (78% mobile phase B) at 1.9 min, from 22% to 30% (70% mobile phase B) at 2.5 min, and from 30% to 42% (58% mobile phase B) at 2.7 min. Then, mobile phase A reverted to 12% (88% mobile phase B) at 3.4 min where it was maintained for 0.3 min for equilibration before the next sample was injected.
- the total run time was 3.70 min.
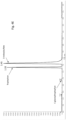
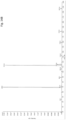
- Chromatography Method 5 separated a plurality of up to six analytes with good peak shapes. Exemplary chromatograms of the resulting separated analytes are shown in Figure 5 . Approximate retention times (in minutes) were 1.40, 1.86, 2.14, 2.61, 2.71, and 3.16 for phenylacetylglutamine, creatinine, N-acetylthreonine, tryptophan, pseudouridine, and TMAP, respectively.
- a liquid chromatography method was developed for the purification and separation in the same injection of one or more, two or more, and up to all ten analytes selected from the group consisting of N-acetylthreonine, meso-erythritol, arabitol, myo-inositol, 3-indoxyl sulfate, tryptophan, phenylacetylglutamine, creatinine, pseudouridine, and N-acetylserine, and combinations thereof, wherein, if the one or more assayed analytes is only one analyte, the one analyte is not creatinine.
- Mobile phase A was 100 mM ammonium acetate + 0.2% ammonium hydroxide in water and mobile phase B was 100% acetonitrile.
- Linear gradient elution was carried out with an initial condition of 7% mobile phase A (93% mobile phase B) and 500 ⁇ L/min flow rate.
- Mobile phase A was increased from the initial 7% to 20% (80% mobile phase B) at 1.5 min, from 20% to 30% (70% mobile phase B) at 4.7 min, and from 30% to 35% (65% mobile phase B) at 5.0 min. Then, mobile phase A reverted to 7% (93% mobile phase B) at 5.1 min where it was maintained for 1.9 min for equilibration before the next sample was injected.
- the total run time was 7.0 min.
- Chromatography Method 6 separated a plurality of up to ten analytes with good peak shapes.
- An exemplary chromatogram of the resulting separated analytes is shown in Figure 6 .
- Approximate retention times (in minutes) were 2.35, 2.87, 4.85, 0.78, 3.20, 2.82, 2.40, 3.00, 3.30, and 3.69 for meso-erythritol, arabitol, myo-inositol, 3-indoxyl sulfate, tryptophan, phenylacetylglutamine, creatinine, pseudouridine, N-acetylthreonine, and N-acetylserine, respectively.
- a liquid chromatography method was developed for the purification and separation in the same injection of one or more, two or more, and up to all five analytes selected from the group consisting of arabitol, phenylacetylglutamine, creatinine, pseudouridine, N-acetylthreonine, and combinations thereof, wherein, if the one or more assayed analytes is only one analyte, the one analyte is not creatinine.
- Mobile phase A was 100 mM ammonium acetate + 0.2% ammonium hydroxide in water and mobile phase B was 100% acetonitrile.
- Linear gradient elution was carried out with an initial condition of 7% mobile phase A (93% mobile phase B) and 800 ⁇ L/min flow rate.
- Mobile phase A was increased from the initial 7% to 20% (80% mobile phase B) at 0.9 min, from 20% to 25% (75% mobile phase B) at 1.9 min, and from 25% to 30% (70% mobile phase B) at 2.1 min. Then, mobile phase A reverted to 7% (93% mobile phase B) at 2.2 min where it was maintained for 0.5 min for equilibration before the next sample was injected. The total run time was 2.7 min.
- Chromatography Method 7 separated a plurality of up to five analytes with good peak shapes.
- An exemplary chromatogram of the resulting separated analytes is shown in Figure 7 .
- Approximate retention times (in minutes) were 1.74, 1.74, 1.48, 1.84, and 1.98 for arabitol, phenylacetylglutamine, creatinine, pseudouridine, and N-acetylthreonine, respectively.
- a liquid chromatography method was developed for the purification and separation in the same injection of one or more, two or more, and up to all six analytes selected from the group consisting of myo-inositol, tryptophan, phenylacetylglutamine, creatinine, pseudouridine, N-acetylthreonine, and combinations thereof, wherein, if the one or more assayed analytes is only one analyte, the one analyte is not creatinine.
- Mobile phase A was 100 mM ammonium acetate + 0.2% ammonium hydroxide in water and mobile phase B was 100% acetonitrile.
- Linear gradient elution was carried out with an initial condition of 7% mobile phase A (93% mobile phase B) and 800 ⁇ L/min flow rate.
- Mobile phase A was increased from the initial 7% to 22% (78% mobile phase B) at 0.9 min, from 22% to 30% (70% mobile phase B) at 2.5 min, and from 30% to 35% (65% mobile phase B) at 2.7 min. Then, mobile phase A reverted to 7% (93% mobile phase B) at 2.8 min where it was maintained for 0.4 min for equilibration before the next sample was injected.
- the total run time was 3.2 min.
- Chromatography Method 8 separated a plurality of up to six analytes with good peak shapes.
- An exemplary chromatogram of the resulting separated analytes is shown in Figure 8 .
- Approximate retention times (in minutes) were 2.64, 1.83, 1.64, 1.40, 1.74, and 1.85 for myo-inositol, tryptophan, phenylacetylglutamine, creatinine, pseudouridine, and N-acetylthreonine, respectively.
- Mass spectrometry was performed on the sample extracts as described in the methods below using an AB Sciex QTrap 5500 mass spectrometer with Turbo V source (ESI).
- Raw data were acquired from the instrument and processed using Analyst 1.6.2 software (AB Sciex).
- AB Sciex For quantitation, peak area ratios of analyte to internal standard were fitted against the concentrations of the calibration standards by weighted (1/x 2 ) linear least squares regression. The resulting slope and intercept of the calibration curve were used to calculate the unknown concentrations in experimental samples.
- a method was developed to detect in the same injection the levels of one or more, two or more, and up to all five analytes selected from the group consisting of pseudouridine, N-acetylthreonine, phenylacetylglutamine, tryptophan, creatinine and combinations thereof, wherein, if the one or more assayed analytes is only one analyte, the one analyte is not creatinine.
- the same MS/MS method was used to detect in the same injection the levels of one or more, two or more, and up to all six analytes selected from the group consisting of pseudouridine, N-acetylthreonine, phenylacetylglutamine, tryptophan, TMAP, creatinine, and combinations thereof.
- the eluent from the chromatography column described in Example 1, Chromatography Method 5 was directly and automatically introduced into the electrospray source of a mass spectrometer.
- Acetonitrile:Water (50:50) was used for needle wash.
- the instrument was operated in positive multiple reaction monitoring (MRM) mode.
- MRM positive multiple reaction monitoring
- Ionspray voltage was set at 4.0 kV, source temperature at 550 °C, curtain gas (e.g., nitrogen) at 20 psi, and nebulizer and desolvation gas (e.g., nitrogen) flow rates at 75 psi, collisionally activated dissociation (CAD) gas (e.g., nitrogen) at medium.
- curtain gas e.g., nitrogen
- nebulizer and desolvation gas e.g., nitrogen
- CAD collisionally activated dissociation
- the parent ions are listed under the column headed "Parent ion (m/z)", and the daughter ions used for quantitation in this example are listed in the column labeled "Daughter ion for quantitation (m/z)".
- the choice of daughter ion for quantitation in this example was optimized for sensitivity across the analytical measurement range; however, additional daughter ions may be selected to replace or augment the daughter ions used for quantitation in the examples. Table 3.
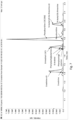
- Figures 9-14 show mass spectra resulting from fragmentation of the parent ions indicated in Table 3.
- MRM transitions that were generated for the quantitation of N-acetylthreonine in positive ionization mode include those produced by fragmenting a parent ion having a m/z of about 162.0 ⁇ 0.5 to produce daughter ions having m/z of about 74.1 ⁇ 0.5, 144.0 ⁇ 0.5, 126.1 ⁇ 0.5, 119.9 ⁇ 0.5, 116.1 ⁇ 0.5, 102.0 ⁇ 0.5, 97.9 ⁇ 0.5, 84.0 ⁇ 0.5, 70.0 ⁇ 0.5, 57.0 ⁇ 0.5, 56.0 ⁇ 0.5, 43.0 ⁇ 0.5, and 28.1 ⁇ 0.5.
- parent and daughter ion peaks generated from tandem mass spectrometric fragmentation of N-acetylthreonine are illustrated in Figure 9 . Any of the daughter ions may be selected for quantitation.
- the daughter ion used for quantitation of N-acetylthreonine has a m/z of about 74.1 ⁇ 0.5.
- the calibration range for N-acetylthreonine was determined to be 0.0200 to 2.00 ⁇ g/mL.
- MRM transitions that were generated for the quantitation of phenylacetylglutamine in positive ionization mode include those produced by fragmenting a parent ion having m/z of about 265.0 ⁇ 0.5 to produce daughter ions having m/z of about 91.0 ⁇ 0.5, 248.1 ⁇ 0.5, 219.1 ⁇ 0.5, 147.1 ⁇ 0.5, 136.0 ⁇ 0.5, 130.0 ⁇ 0.5, 129.1 ⁇ 0.5, 101.1 ⁇ 0.5, 84.0 ⁇ 0.5, 83.0 ⁇ 0.5, 65.0 ⁇ 0.5, 56.0 ⁇ 0.5, 50.9 ⁇ 0.5, 44.0 ⁇ 0.5, 40.9 ⁇ 0.5, 39.1 ⁇ 0.5, and 28.0 ⁇ 0.5.
- FIG. 10 These parent and daughter ion peaks generated from tandem mass spectrometric fragmentation of phenylacetylglutamine are illustrated in Figure 10 .
- Any of the daughter ions may be selected for quantitation.
- the daughter ion used for quantitation of phenylacetylglutamine has m/z of about 91.0 ⁇ 0.5.
- the calibration range for phenylacetylglutamine was determined to be 0.100 to 20.0 ⁇ g/mL.
- MRM transitions that were generated for the quantitation of creatinine in positive ionization mode include those produced by fragmenting a parent ion having m/z of about 113.9 ⁇ 0.5 to produce daughter ions having a m/z of about 43.0 ⁇ 0.5, 86.0 ⁇ 0.5, 72.0 ⁇ 0.5, 44.1 ⁇ 0.5, 42.0 ⁇ 0.5, and 28.1 ⁇ 0.5.
- parent and daughter ion peaks generated from tandem mass spectrometric fragmentation of creatinine are illustrated in Figure 11 .
- Any of the daughter ions may be selected for quantitation.
- the daughter ion used for quantitation of creatinine has a m/z of about 43.0 ⁇ 0.5.
- the calibration range for creatinine was determined to be 2.00 to 200 ⁇ g/mL.
- MRM transitions that were generated for the quantitation of tryptophan in positive ionization mode include those produced by fragmenting a parent ion having a m/z of about 205.0 ⁇ 0.5 to produce daughter ions having m/z of about 146.0 ⁇ 0.5, 191-193 ⁇ 0.5, 173-174 ⁇ 0.5, 163-164 ⁇ 0.5, 144.8-151.2 ⁇ 0.5, 117.1-122.1 ⁇ 0.5, 102.9-110.1 ⁇ 0.5, 89.9-96.0 ⁇ 0.5, 74.1-81.1 ⁇ 0.5, 60.9-68.9 ⁇ 0.5, 50.1-54.1 ⁇ 0.5, 38.0-43.1 ⁇ 0.5, and 28.0-29.0 ⁇ 0.5.
- parent and daughter ion peaks generated from tandem mass spectrometric fragmentation of tryptophan are illustrated in Figure 12 .
- the daughter ions may be selected for quantitation.
- the daughter ion used for quantitation of tryptophan has a m/z of about 146.0 ⁇ 0.5.
- the calibration range for tryptophan was determined to be 1.00 to 100 ⁇ g/mL.
- MRM transitions that were generated for the quantitation of pseudouridine in positive ionization mode include those produced by fragmenting a parent ion having a m/z of about 244.9 ⁇ 0.5 to produce daughter ions having m/z of about 191.0 ⁇ 0.5, 209.0 ⁇ 0.5, 179.0 ⁇ 0.5, 167.0 ⁇ 0.5, 163.0 ⁇ 0.5, 154.8 ⁇ 0.5, 151.0 ⁇ 0.5, 148.0 ⁇ 0.5, 139.0 ⁇ 0.5, 125.0 ⁇ 0.5, 120.0 ⁇ 0.5, 111.8 ⁇ 0.5, 109.8 ⁇ 0.5, 107.8 ⁇ 0.5, 96.0 ⁇ 0.5, 92.0 ⁇ 0.5, 84.0 ⁇ 0.5, 82.0 ⁇ 0.5, 80.0 ⁇ 0.5, 68.0 ⁇ 0.5, 65.2 ⁇ 0.5, 55.0 ⁇ 0.5, 54.0 ⁇ 0.5, 43.0 ⁇ 0.5, 41.0 ⁇ 0.5, and 39.0 ⁇ 0.5.
- any of the daughter ions may be selected for quantitation.
- the daughter ion used for quantitation of pseudouridine has a m/z of about 191.0 ⁇ 0.5.
- the calibration range for pseudouridine was determined to be 10.0 to 400 ⁇ g/mL.
- MRM transitions that were generated for the quantitation of TMAP in positive ionization mode include those produced by fragmenting a parent ion having a m/z of about 229.1 ⁇ 0.5 to produce daughter ions having m/z of about 170.1 ⁇ 0.5, 142.2 ⁇ 0.5, 126.0 ⁇ 0.5, 124.0 ⁇ 0.5, 116.0 ⁇ 0.5, 114.0 ⁇ 0.5, 98.0 ⁇ 0.5, 96.0 ⁇ 0.5, 70.0 ⁇ 0.5, 68.0 ⁇ 0.5, 60.0 ⁇ 0.5, 59.1 ⁇ 0.5, 58.1 ⁇ 0.5, 54.9 ⁇ 0.5, 227.0 ⁇ 0.5, 181.0 ⁇ 0.5, 159.0 ⁇ 0.5, 133.2 ⁇ 0.5, 114.8 ⁇ 0.5, 112.9 ⁇ 0.5, 105.8 ⁇ 0.5, 89.1 ⁇ 0.5, 71.0 ⁇ 0.5, 69.0 ⁇ 0.5, and 45.1 ⁇ 0.5.
- daughter ions may be selected for quantitation.
- daughter ions having a m/z of about 58.1 ⁇ 0.5, 70.0 ⁇ 0.5, 114.0 ⁇ 0.5, or 142.2 ⁇ 0.5 may be used for the quantitation of TMAP.
- a method was developed to detect in the same injection the levels of one or more, two or more, and up to all six analytes selected from the group consisting of pseudouridine, N-acetylthreonine, meso-erythritol, arabitol, myo-inositol, N-acetylserine and combinations thereof.
- the eluent from the chromatography column described in Example 1, Chromatography Method 2 was directly and automatically introduced into the electrospray source of a mass spectrometer. Wateracetonitrile (90:10) was used for the strong/seal wash; acetonitrile:water (90:10) was used for the weak wash.
- the instruments were operated in negative MRM mode. Ionspray voltage was set at -4.0 kV, source temperature at 550 °C, and curtain gas at 20 psi; nebulizer and desolvation gas flow rates were set at 70 psi, and CAD gas at medium.
- Exemplary ions that were generated for the quantitation of pseudouridine, N-acetylthreonine, meso-erythritol, arabitol, myo-inositol, and N-acetylserine are shown in Table 4.
- the parent ions are listed under the column headed "Parent ion (m/z)", and the daughter ions used for quantitation in this example are listed in the column labeled "Daughter ion for quantitation (m/z)”.
- the choice of daughter ion for quantitation in this example was optimized for sensitivity across the analytical measurement range; however, any of the daughter ions may be selected to replace or augment the daughter ions used for quantitation in the examples. Table 4.
- a method was developed to detect in the same injection the levels of one or more, two or more, and up to all nine analytes selected from the group consisting of N-acetylthreonine, phenylacetylglutamine, tryptophan, creatinine, N-acetylalanine, 3-methylhistidine, trans-4-hydroxyproline, kynurenine, urea and combinations thereof, wherein, if the one or more assayed analytes is only one analyte, the one analyte is not creatinine.
- the eluent from the chromatography column described in Example 3, Chromatography Method 3 was directly and automatically introduced into the electrospray source of a mass spectrometer.
- acetonitrile (90: 10) was used for the strong/seal wash; acetonitrile:water (90:10) was used for the weak wash.
- the instrument was operated in positive multiple reaction monitoring (MRM) mode. Ionspray voltage was set at 4.0 kV, source temperature at 550 °C, curtain gas (e.g., nitrogen) at 20 psi, and nebulizer and desolvation gas (e.g., nitrogen) flow rates at 75 psi, collisionally activated dissociation (CAD) gas (e.g., nitrogen) at medium.
- MRM positive multiple reaction monitoring
- Exemplary ions that were generated for the quantitation of N-acetylthreonine, phenylacetylglutamine, tryptophan, creatinine, N-acetylalanine, 3-methylhistidine, trans-4-hydroxyproline, kynurenine, and urea are shown in Table 5.
- the parent ions are listed under the column headed "Parent ion (m/z)", and the daughter ions used for quantitation in this example are listed in the column labeled "Daughter ion for quantitation (m/z)”.
- a method was developed to detect in the same injection the levels of one or more, two or more, and up to all three analytes selected from the group consisting of tryptophan, C-glycosyltryptophan, and 3-indoxyl sulfate.
- the eluent from the chromatography column described in Example 1, Chromatography Method 4 was directly and automatically introduced into the electrospray source of a mass spectrometer. Methanol was used for needle wash. The instrument was operated in negative MRM mode.
- Ionspray voltage was set at -4.5 kV, source temperature at 550 °C, and curtain gas at 20 psi; nebulizer and desolvation gas flow rates were set at 60 psi and 65 psi, respectively, and CAD gas at high.
- Exemplary ion pairs that may be used for the quantitation of tryptophan, C-glycosyltryptophan, and 3-indoxylsulfate are shown in Table 6.
- the parent ions are listed under the column headed "Parent ion (m/z)", and the daughter ions used for quantitation in this example are listed in the column labeled "Daughter ion for quantitation (m/z)".
- the choice of daughter ion for quantitation in this example was optimized for sensitivity across the analytical measurement range; however, any of the daughter ions may be selected to replace or augment the daughter ions used for quantitation in the examples. Table 6.
- the eluent from the chromatography column described in Example 1, Chromatography Method 7, was directly and automatically introduced into the electrospray source of a mass spectrometer.
- the method detected, in the same injection, the levels of one or more, two or more, and up to all five analytes selected from the group consisting of D-arabitol, phenylacetylglutamine, creatinine, pseudouridine, N-acetylthreonine, and combinations thereof, wherein, if the one or more assayed analytes is only one analyte, the one analyte is not creatinine.
- the eluent from the chromatography column described in Example 1, Chromatography Method 8 was directly and automatically introduced into the electrospray source of a mass spectrometer.
- the method detected, in the same injection, the levels of one or more, two or more, and up to all six analytes selected from the group consisting of inositol, L-tryptophan, phenylacetylglutamine, creatinine, pseudouridine, N-acetylthreonine, and combinations thereof, wherein, if the one or more assayed analytes is only one analyte, the one analyte is not creatinine.
- Acetonitrile:Water (50:50) was used for the needle wash.
- Exemplary ion pairs that may be used for the quantitation of meso-erythritol, D-arabitol, inositol, 3-indoxyl sulfate, L-tryptophan, phenylacetylglutamine, creatinine, pseudouridine, N-acetylthreonine, and N-acetylserine are shown in Table 7.
- the parent ions are listed under the column headed "Parent ion (m/z)", and the daughter ions used for quantitation in this example are listed in the column labeled "Daughter ion for quantitation (m/z)".
- the precision of the method for measuring a plurality of five analytes was evaluated at three QC levels (low, mid, and high) in plasma and serum. Three replicates per QC level per matrix were analyzed in two runs per day over 20 days for a total of 40 runs. A total of 120 replicates per QC level were included in the inter-day CV calculations for each analyte per matrix. The inter-day precision was less than 6.3% at each QC level in plasma and less than 7.1% at each QC level in serum. The results are presented in Table 8.
- the dilution QCs were prepared by diluting the high QC matrix 5-fold with fatty acid-free BSA solution. Three replicates of dilution QCs per matrix were analyzed in two runs per day over five days for a total of 10 runs. A total of 30 replicates were included in the inter-day accuracy and precision calculations.
- the inter-day accuracy (as compared to the measured high QC value) in serum was greater than 94.5% and the inter-day precision was less than 7.6%; the inter-day accuracy in plasma was greater than 94.7% and the inter-day precision was less than 4.4%.
- the precision at the LLOQ was evaluated.
- the signal-to-noise ratio for every analyte was greater than 5:1.
- Three replicates of the LLOQ samples were analyzed in two runs per day over 15 days for a total of 30 runs.
- a total of 90 replicates of the LLOQ were included in the inter-day %CV calculations for each analyte. All intra- and inter-day precision was less than 2.8% CV; the data are shown in Table 10. These results indicated that quantitation of the plurality of analytes at the lower limit was highly precise. Table 10. Intra- and Inter-Day Precision at the LLOQ.
- Interference was also evaluated for icterus, lipidemia, known isomers of the analytes, and pharmaceuticals including statins, NSAIDs, pain relievers, antihistamines, and anti-diabetics. Chromatography Method 1 and MS/MS Method 1 was determined to be free of interference from the tested interference conditions.
- the analytical performance of the combination of Chromatography Method 2 and MS/MS Method 2 resulted in the quantitation of a plurality of up to six analytes selected from the group consisting of pseudouridine, N-acetylthreonine, meso-erythritol, arabitol, myo-inositol, and N-acetylserine in a single injection with a run time of 7.0 minutes.
- the precision and accuracy at the LLOQ were evaluated.
- the signal-to-noise ratio for every analyte was greater than 5:1.
- Six replicates of the LLOQ samples were analyzed in three runs. A total of 18 replicates of the LLOQ were included in the inter-day %RSD and accuracy calculations for each analyte for each matrix. Inter-run precision was less than 18.0% for plasma and less than 13% for serum. Inter-run accuracy was between 98.7-104% for plasma and between 95.7-101.1% for serum. The data are shown in Table 13. Table 13. Inter-Run Precision and Accuracy at the LLOQ.
- the analytical performance of the combination of Chromatography Method 3 and MS/MS Method 3 resulted in the quantitation of a plurality of up to nine analytes selected from the group consisting of N-acetylthreonine, phenylacetylglutamine, tryptophan, creatinine, N-acetylalanine, 3-methylhistidine, trans-4-hydroxyproline, kynurenine, and urea in a single injection with a run time of 7.0 minutes.
- the precision and accuracy at the LLOQ were evaluated.
- the signal-to-noise ratio for every analyte was greater than 5:1.
- Six replicates of the LLOQ samples were analyzed in three runs. A total of 18 replicates of the LLOQ were included in the inter-day %RSD and accuracy calculations for each analyte for each matrix. Inter-run precision was less than 14.4% for plasma and less than 9.5% for serum. Inter-run accuracy was between 91.7-102% for plasma and between 92.6-101.9% for serum. The data are shown in Table 16. Table 16. Inter-Run Precision and Accuracy at the LLOQ.
- the analytical performance of the combination of Chromatography Method 4 and MS/MS Method 4 resulted in the quantitation of a plurality of up to three analytes selected from the group consisting of tryptophan, C-glycosyltryptophan, and 3-indoxyl sulfate in a single injection with a run time of 3.30 minutes.
- the precision and accuracy at the LLOQ were evaluated.
- the signal-to-noise ratio for every analyte was greater than 5:1.
- Six replicates of the LLOQ samples were analyzed in three runs. A total of 18 replicates of the LLOQ were included in the inter-day %RSD and accuracy calculations for each analyte for each matrix. Inter-run precision was less than 7.8% for plasma and less than 8.3% for serum. Inter-run accuracy was between 106-107% for plasma and between 93.5-94.2% for serum. The data are shown in Table 19. Table 19. Inter-Run Precision and Accuracy at the LLOQ.
- the analytical performance of the combination of Chromatography Method 6 and MS/MS Method 5 resulted in the quantitation of a plurality of up to ten analytes selected from the group consisting of meso-erythritol, D-arabitol, inositol, 3-indoxyl sulfate, L-tryptophan, phenylacetylglutamine, creatinine, pseudouridine, N-acetylthreonine, and N-acetylserine in a single injection with a run time of 7.0 minutes.
- the analytical performance of the combination of Chromatography Method 7 and MS/MS Method 5 resulted in the quantitation of a plurality of up to five analytes selected from the group consisting of arabitol, phenylacetylglutamine, creatinine, pseudouridine, N-acetylthreonine in a single injection with a run time of 2.7 minutes.
- QC samples in serum and plasma were fortified with known concentrations of analytes.
- Six replicates of the spiked QC samples were extracted and analyzed along with six regular QC replicate samples in plasma and serum.
- Recovery of the spiked amount was calculated after subtraction of the amount in the spiked QC samples.
- the recovery of the analytes phenylacetylglutamine, creatinine, and pseudouridine was determined to be greater than 90% in plasma and serum; the recovery of the analytes arabitol and N-acetylthreonine were determined to be greater than 85%.
- the analytical performance of the combination of Chromatography Method 8 and MS/MS Method 5 resulted in the quantitation of a plurality of up to six analytes selected from the group consisting of myo-inositol, tryptophan, phenylacetylglutamine, creatinine, pseudouridine, N-acetylthreonine in a single injection with a run time of 3.2 minutes.
- QC samples in serum and plasma were fortified with known concentrations of analytes.
- Six replicates of the spiked QC samples were extracted and analyzed along with six regular QC replicate samples in plasma and serum. Recovery of the spiked amount was calculated after subtraction of the amount in the spiked QC samples. The recovery of the six analytes was determined to be greater than 90% in plasma and serum.
Landscapes
- Life Sciences & Earth Sciences (AREA)
- Health & Medical Sciences (AREA)
- Engineering & Computer Science (AREA)
- Chemical & Material Sciences (AREA)
- Molecular Biology (AREA)
- Immunology (AREA)
- Hematology (AREA)
- Urology & Nephrology (AREA)
- Biomedical Technology (AREA)
- Physics & Mathematics (AREA)
- Analytical Chemistry (AREA)
- Pathology (AREA)
- General Physics & Mathematics (AREA)
- General Health & Medical Sciences (AREA)
- Biochemistry (AREA)
- Medicinal Chemistry (AREA)
- Biotechnology (AREA)
- Food Science & Technology (AREA)
- Microbiology (AREA)
- Cell Biology (AREA)
- Bioinformatics & Cheminformatics (AREA)
- Bioinformatics & Computational Biology (AREA)
- Biophysics (AREA)
- Proteomics, Peptides & Aminoacids (AREA)
- Spectroscopy & Molecular Physics (AREA)
- Plasma & Fusion (AREA)
- Chemical Kinetics & Catalysis (AREA)
- Diabetes (AREA)
- Investigating Or Analysing Biological Materials (AREA)
- Other Investigation Or Analysis Of Materials By Electrical Means (AREA)
Applications Claiming Priority (4)
| Application Number | Priority Date | Filing Date | Title |
|---|---|---|---|
| US201662435967P | 2016-12-19 | 2016-12-19 | |
| US201762526043P | 2017-06-28 | 2017-06-28 | |
| US201762558014P | 2017-09-13 | 2017-09-13 | |
| PCT/US2017/066364 WO2018118630A1 (en) | 2016-12-19 | 2017-12-14 | Mass spectrometry assay method for detection and quantitation of kidney function metabolites |
Publications (4)
| Publication Number | Publication Date |
|---|---|
| EP3555615A1 EP3555615A1 (en) | 2019-10-23 |
| EP3555615A4 EP3555615A4 (en) | 2020-11-04 |
| EP3555615B1 EP3555615B1 (en) | 2024-10-30 |
| EP3555615B9 true EP3555615B9 (en) | 2025-03-19 |
Family
ID=62627087
Family Applications (1)
| Application Number | Title | Priority Date | Filing Date |
|---|---|---|---|
| EP17885159.8A Active EP3555615B9 (en) | 2016-12-19 | 2017-12-14 | Mass spectrometry assay method for detection and quantitation of kidney function metabolites |
Country Status (8)
| Country | Link |
|---|---|
| US (1) | US11619636B2 (enExample) |
| EP (1) | EP3555615B9 (enExample) |
| JP (1) | JP7393206B2 (enExample) |
| CN (1) | CN110088615B (enExample) |
| AU (1) | AU2017382744B2 (enExample) |
| CA (1) | CA3045022C (enExample) |
| ES (1) | ES3004083T3 (enExample) |
| WO (1) | WO2018118630A1 (enExample) |
Families Citing this family (12)
| Publication number | Priority date | Publication date | Assignee | Title |
|---|---|---|---|---|
| EP3555615B9 (en) | 2016-12-19 | 2025-03-19 | Metabolon, Inc. | Mass spectrometry assay method for detection and quantitation of kidney function metabolites |
| CN112689755A (zh) * | 2018-09-11 | 2021-04-20 | 梅塔博隆股份有限公司 | 用于检测和定量微生物区系相关代谢物的质谱测定法 |
| CN113508293B (zh) * | 2019-04-24 | 2024-05-07 | 株式会社岛津制作所 | 成像质量分析装置 |
| WO2020242744A1 (en) * | 2019-05-31 | 2020-12-03 | Metabolon, Inc. | Mass spectrometry assay methods for detection of metabolites |
| CN112946150B (zh) * | 2019-11-26 | 2024-06-18 | 深圳华大临床检验中心 | 一种快速检测人体尿液中高香草酸、香草扁桃酸、5-羟基吲哚乙酸及肌酐的方法及试剂盒 |
| CN111007173A (zh) * | 2019-12-20 | 2020-04-14 | 辉源生物科技(上海)有限公司 | 吲哚胺2,3-二氧化酶抑制剂的筛选方法 |
| CN114026427B (zh) * | 2020-05-19 | 2023-11-17 | 深圳市中医院 | 诊断肾病的标志物以及诊断方法 |
| CN115917323A (zh) * | 2020-05-19 | 2023-04-04 | 赛诺菲 | 使用干血样验证药物水平的方法 |
| CN114518413B (zh) * | 2020-11-18 | 2024-12-31 | 江苏天士力帝益药业有限公司 | 一种卡托普利原料药中脯氨酸的含量测定方法 |
| CN114216984B (zh) * | 2021-12-16 | 2023-10-13 | 川北医学院附属医院 | 一种骨质疏松症负离子诊断标志物及其检测方法 |
| CN114414700A (zh) * | 2022-01-27 | 2022-04-29 | 重庆迪纳利医药科技有限责任公司 | 一种同时测定生物样品中多种内源性糖醇含量的方法和系统 |
| WO2025244008A1 (ja) * | 2024-05-23 | 2025-11-27 | 株式会社島津製作所 | 測定方法、プログラム、および高速液体クロマトグラフタンデム質量分析装置 |
Family Cites Families (16)
| Publication number | Priority date | Publication date | Assignee | Title |
|---|---|---|---|---|
| EP2248147A1 (en) | 2008-01-31 | 2010-11-10 | DH Technologies Development Pte. Ltd. | High-throughput screening of metabolic disorders using a laser desorption ion source coupled to a mass analyzer |
| JP5624709B2 (ja) * | 2008-03-13 | 2014-11-12 | 大日本住友製薬株式会社 | 内因性代謝物の分析方法 |
| WO2010126146A1 (ja) | 2009-04-30 | 2010-11-04 | Tanaka Noriaki | 腎疾患重篤度を判定する方法又は装置若しくはその作動方法 |
| CN107064330B (zh) | 2010-12-28 | 2022-02-25 | 探索诊断投资公司 | 通过质谱法定量胰岛素 |
| JP2015505965A (ja) * | 2011-12-09 | 2015-02-26 | メタボロン,インコーポレイテッド | 腎癌のバイオマーカーおよびそれを用いる方法 |
| CN102680599A (zh) | 2012-05-11 | 2012-09-19 | 上海特敏生物医药科技有限公司 | 尿肌氨酸及肌酐测定试剂盒 |
| ES2987582T3 (es) * | 2013-01-31 | 2024-11-15 | Metabolon Inc | Biomarcadores relacionados con la progresión de la resistencia a la Insulina y métodos que lo utilizan |
| JP6595984B2 (ja) | 2013-05-14 | 2019-10-23 | メタボロン,インコーポレイテッド | 腎機能に関連付けられるバイオマーカーおよびそれを使用する方法 |
| CN105143872B (zh) * | 2013-06-07 | 2019-03-01 | 皮尔斯生物科技有限公司 | 通过质谱分析用复用内标物对蛋白质和蛋白质修饰的绝对定量 |
| WO2015014903A2 (en) | 2013-07-31 | 2015-02-05 | Pharnext | Diagnostic tools for alzheimer's disease |
| WO2016025429A1 (en) * | 2014-08-15 | 2016-02-18 | The Johns Hopkins University | Precise estimation of glomerular filtration rate from multiple biomarkers |
| CN105738626B (zh) * | 2014-12-12 | 2017-07-14 | 中国科学院大连化学物理研究所 | 一种新的血清代谢物的组合及其作为肝癌诊断标志物的用途 |
| US20160282371A1 (en) * | 2015-03-28 | 2016-09-29 | Quantalytical Labs Inc. | Solid Phase Extraction, Derivatization with Crown Ethers, and Mass Spectrometry, Methods, Reagents and Kits |
| BR112017025097B1 (pt) * | 2015-05-27 | 2021-05-11 | Quest Diagnostics Investments Llc | método para quantificação espectrométrica de massa de analitos extraídos de um dispositivo de microamostragem |
| CN104897821A (zh) | 2015-06-03 | 2015-09-09 | 福建中烟工业有限责任公司 | 提取样品中肌醇的方法、试剂盒及其用途 |
| EP3555615B9 (en) | 2016-12-19 | 2025-03-19 | Metabolon, Inc. | Mass spectrometry assay method for detection and quantitation of kidney function metabolites |
-
2017
- 2017-12-14 EP EP17885159.8A patent/EP3555615B9/en active Active
- 2017-12-14 WO PCT/US2017/066364 patent/WO2018118630A1/en not_active Ceased
- 2017-12-14 US US16/466,451 patent/US11619636B2/en active Active
- 2017-12-14 CN CN201780078615.8A patent/CN110088615B/zh active Active
- 2017-12-14 AU AU2017382744A patent/AU2017382744B2/en active Active
- 2017-12-14 CA CA3045022A patent/CA3045022C/en active Active
- 2017-12-14 JP JP2019553158A patent/JP7393206B2/ja active Active
- 2017-12-14 ES ES17885159T patent/ES3004083T3/es active Active
Also Published As
| Publication number | Publication date |
|---|---|
| JP7393206B2 (ja) | 2023-12-06 |
| WO2018118630A1 (en) | 2018-06-28 |
| AU2017382744A1 (en) | 2019-06-13 |
| EP3555615A1 (en) | 2019-10-23 |
| JP2020502544A (ja) | 2020-01-23 |
| EP3555615A4 (en) | 2020-11-04 |
| CN110088615A (zh) | 2019-08-02 |
| CN110088615B (zh) | 2023-08-22 |
| ES3004083T3 (en) | 2025-03-11 |
| AU2017382744B2 (en) | 2023-02-09 |
| CA3045022A1 (en) | 2018-06-28 |
| US20190346455A1 (en) | 2019-11-14 |
| US11619636B2 (en) | 2023-04-04 |
| CA3045022C (en) | 2024-01-16 |
| EP3555615B1 (en) | 2024-10-30 |
Similar Documents
| Publication | Publication Date | Title |
|---|---|---|
| EP3555615B9 (en) | Mass spectrometry assay method for detection and quantitation of kidney function metabolites | |
| CN109564207B (zh) | 用于检测和定量代谢物的质谱方法 | |
| Junot et al. | High resolution mass spectrometry based techniques at the crossroads of metabolic pathways | |
| US20220349897A1 (en) | Amyloid beta detection by mass spectrometry | |
| EP3270407A1 (en) | Quantitation of insulin by mass spectrometry | |
| CN112136043B (zh) | 用于检测和定量肝功能代谢产物的质谱测定方法 | |
| EP4310505B1 (en) | Detection and quantitation of guanidinoacetate by mass spectrometry | |
| US20200116681A1 (en) | Methods for detecting lacosamide by mass spectrometry | |
| HK40014572A (en) | Mass spectrometry assay method for detection and quantitation of kidney function metabolites | |
| HK40014572B (en) | Mass spectrometry assay method for detection and quantitation of kidney function metabolites | |
| Merchant | Mass spectrometry in chronic kidney disease research | |
| AU2024318333A1 (en) | Methods for detecting catecholamines by mass spectrometry | |
| JP2026513260A (ja) | 質量分析によるアディポネクチンの定量の方法 |
Legal Events
| Date | Code | Title | Description |
|---|---|---|---|
| STAA | Information on the status of an ep patent application or granted ep patent |
Free format text: STATUS: THE INTERNATIONAL PUBLICATION HAS BEEN MADE |
|
| PUAI | Public reference made under article 153(3) epc to a published international application that has entered the european phase |
Free format text: ORIGINAL CODE: 0009012 |
|
| STAA | Information on the status of an ep patent application or granted ep patent |
Free format text: STATUS: REQUEST FOR EXAMINATION WAS MADE |
|
| 17P | Request for examination filed |
Effective date: 20190711 |
|
| AK | Designated contracting states |
Kind code of ref document: A1 Designated state(s): AL AT BE BG CH CY CZ DE DK EE ES FI FR GB GR HR HU IE IS IT LI LT LU LV MC MK MT NL NO PL PT RO RS SE SI SK SM TR |
|
| AX | Request for extension of the european patent |
Extension state: BA ME |
|
| DAV | Request for validation of the european patent (deleted) | ||
| DAX | Request for extension of the european patent (deleted) | ||
| RIC1 | Information provided on ipc code assigned before grant |
Ipc: G01N 33/68 20060101AFI20200629BHEP |
|
| REG | Reference to a national code |
Ref country code: HK Ref legal event code: DE Ref document number: 40014572 Country of ref document: HK |
|
| REG | Reference to a national code |
Ref country code: DE Ref legal event code: R079 Free format text: PREVIOUS MAIN CLASS: G01N0030720000 Ipc: G01N0033680000 Ref document number: 602017085844 Country of ref document: DE |
|
| A4 | Supplementary search report drawn up and despatched |
Effective date: 20201005 |
|
| RIC1 | Information provided on ipc code assigned before grant |
Ipc: G01N 33/68 20060101AFI20200929BHEP |
|
| R17P | Request for examination filed (corrected) |
Effective date: 20190711 |
|
| STAA | Information on the status of an ep patent application or granted ep patent |
Free format text: STATUS: EXAMINATION IS IN PROGRESS |
|
| 17Q | First examination report despatched |
Effective date: 20220728 |
|
| P01 | Opt-out of the competence of the unified patent court (upc) registered |
Effective date: 20230527 |
|
| GRAP | Despatch of communication of intention to grant a patent |
Free format text: ORIGINAL CODE: EPIDOSNIGR1 |
|
| STAA | Information on the status of an ep patent application or granted ep patent |
Free format text: STATUS: GRANT OF PATENT IS INTENDED |
|
| INTG | Intention to grant announced |
Effective date: 20240524 |
|
| GRAS | Grant fee paid |
Free format text: ORIGINAL CODE: EPIDOSNIGR3 |
|
| RAP3 | Party data changed (applicant data changed or rights of an application transferred) |
Owner name: METABOLON, INC. |
|
| GRAA | (expected) grant |
Free format text: ORIGINAL CODE: 0009210 |
|
| STAA | Information on the status of an ep patent application or granted ep patent |
Free format text: STATUS: THE PATENT HAS BEEN GRANTED |
|
| REG | Reference to a national code |
Ref country code: DE Ref legal event code: R081 Ref document number: 602017085844 Country of ref document: DE Owner name: METABOLON, INC., MORRISVILLE, US Free format text: FORMER OWNER: METABOLON, INC., MORRISVILLE, N.C., US |
|
| AK | Designated contracting states |
Kind code of ref document: B1 Designated state(s): AL AT BE BG CH CY CZ DE DK EE ES FI FR GB GR HR HU IE IS IT LI LT LU LV MC MK MT NL NO PL PT RO RS SE SI SK SM TR |
|
| REG | Reference to a national code |
Ref country code: GB Ref legal event code: FG4D |
|
| REG | Reference to a national code |
Ref country code: CH Ref legal event code: EP |
|
| REG | Reference to a national code |
Ref country code: IE Ref legal event code: FG4D |
|
| REG | Reference to a national code |
Ref country code: DE Ref legal event code: R096 Ref document number: 602017085844 Country of ref document: DE |
|
| REG | Reference to a national code |
Ref country code: LT Ref legal event code: MG9D |
|
| REG | Reference to a national code |
Ref country code: CH Ref legal event code: PK Free format text: BERICHTIGUNG B9 |
|
| REG | Reference to a national code |
Ref country code: NL Ref legal event code: MP Effective date: 20241030 |
|
| REG | Reference to a national code |
Ref country code: ES Ref legal event code: FG2A Ref document number: 3004083 Country of ref document: ES Kind code of ref document: T3 Effective date: 20250311 |
|
| PG25 | Lapsed in a contracting state [announced via postgrant information from national office to epo] |
Ref country code: IS Free format text: LAPSE BECAUSE OF FAILURE TO SUBMIT A TRANSLATION OF THE DESCRIPTION OR TO PAY THE FEE WITHIN THE PRESCRIBED TIME-LIMIT Effective date: 20250228 Ref country code: PT Free format text: LAPSE BECAUSE OF FAILURE TO SUBMIT A TRANSLATION OF THE DESCRIPTION OR TO PAY THE FEE WITHIN THE PRESCRIBED TIME-LIMIT Effective date: 20250228 Ref country code: HR Free format text: LAPSE BECAUSE OF FAILURE TO SUBMIT A TRANSLATION OF THE DESCRIPTION OR TO PAY THE FEE WITHIN THE PRESCRIBED TIME-LIMIT Effective date: 20241030 |
|
| PG25 | Lapsed in a contracting state [announced via postgrant information from national office to epo] |
Ref country code: FI Free format text: LAPSE BECAUSE OF FAILURE TO SUBMIT A TRANSLATION OF THE DESCRIPTION OR TO PAY THE FEE WITHIN THE PRESCRIBED TIME-LIMIT Effective date: 20241030 Ref country code: NL Free format text: LAPSE BECAUSE OF FAILURE TO SUBMIT A TRANSLATION OF THE DESCRIPTION OR TO PAY THE FEE WITHIN THE PRESCRIBED TIME-LIMIT Effective date: 20241030 |
|
| REG | Reference to a national code |
Ref country code: AT Ref legal event code: MK05 Ref document number: 1737357 Country of ref document: AT Kind code of ref document: T Effective date: 20241030 |
|
| PG25 | Lapsed in a contracting state [announced via postgrant information from national office to epo] |
Ref country code: BG Free format text: LAPSE BECAUSE OF FAILURE TO SUBMIT A TRANSLATION OF THE DESCRIPTION OR TO PAY THE FEE WITHIN THE PRESCRIBED TIME-LIMIT Effective date: 20241030 |
|
| PG25 | Lapsed in a contracting state [announced via postgrant information from national office to epo] |
Ref country code: NO Free format text: LAPSE BECAUSE OF FAILURE TO SUBMIT A TRANSLATION OF THE DESCRIPTION OR TO PAY THE FEE WITHIN THE PRESCRIBED TIME-LIMIT Effective date: 20250130 |
|
| PG25 | Lapsed in a contracting state [announced via postgrant information from national office to epo] |
Ref country code: LV Free format text: LAPSE BECAUSE OF FAILURE TO SUBMIT A TRANSLATION OF THE DESCRIPTION OR TO PAY THE FEE WITHIN THE PRESCRIBED TIME-LIMIT Effective date: 20241030 Ref country code: GR Free format text: LAPSE BECAUSE OF FAILURE TO SUBMIT A TRANSLATION OF THE DESCRIPTION OR TO PAY THE FEE WITHIN THE PRESCRIBED TIME-LIMIT Effective date: 20250131 Ref country code: AT Free format text: LAPSE BECAUSE OF FAILURE TO SUBMIT A TRANSLATION OF THE DESCRIPTION OR TO PAY THE FEE WITHIN THE PRESCRIBED TIME-LIMIT Effective date: 20241030 |
|
| PG25 | Lapsed in a contracting state [announced via postgrant information from national office to epo] |
Ref country code: PL Free format text: LAPSE BECAUSE OF FAILURE TO SUBMIT A TRANSLATION OF THE DESCRIPTION OR TO PAY THE FEE WITHIN THE PRESCRIBED TIME-LIMIT Effective date: 20241030 |
|
| PG25 | Lapsed in a contracting state [announced via postgrant information from national office to epo] |
Ref country code: RS Free format text: LAPSE BECAUSE OF FAILURE TO SUBMIT A TRANSLATION OF THE DESCRIPTION OR TO PAY THE FEE WITHIN THE PRESCRIBED TIME-LIMIT Effective date: 20250130 |
|
| PG25 | Lapsed in a contracting state [announced via postgrant information from national office to epo] |
Ref country code: SM Free format text: LAPSE BECAUSE OF FAILURE TO SUBMIT A TRANSLATION OF THE DESCRIPTION OR TO PAY THE FEE WITHIN THE PRESCRIBED TIME-LIMIT Effective date: 20241030 |
|
| PG25 | Lapsed in a contracting state [announced via postgrant information from national office to epo] |
Ref country code: MC Free format text: LAPSE BECAUSE OF FAILURE TO SUBMIT A TRANSLATION OF THE DESCRIPTION OR TO PAY THE FEE WITHIN THE PRESCRIBED TIME-LIMIT Effective date: 20241030 |
|
| PG25 | Lapsed in a contracting state [announced via postgrant information from national office to epo] |
Ref country code: DK Free format text: LAPSE BECAUSE OF FAILURE TO SUBMIT A TRANSLATION OF THE DESCRIPTION OR TO PAY THE FEE WITHIN THE PRESCRIBED TIME-LIMIT Effective date: 20241030 |
|
| PG25 | Lapsed in a contracting state [announced via postgrant information from national office to epo] |
Ref country code: RO Free format text: LAPSE BECAUSE OF FAILURE TO SUBMIT A TRANSLATION OF THE DESCRIPTION OR TO PAY THE FEE WITHIN THE PRESCRIBED TIME-LIMIT Effective date: 20241030 |
|
| PG25 | Lapsed in a contracting state [announced via postgrant information from national office to epo] |
Ref country code: SK Free format text: LAPSE BECAUSE OF FAILURE TO SUBMIT A TRANSLATION OF THE DESCRIPTION OR TO PAY THE FEE WITHIN THE PRESCRIBED TIME-LIMIT Effective date: 20241030 |
|
| PG25 | Lapsed in a contracting state [announced via postgrant information from national office to epo] |
Ref country code: CZ Free format text: LAPSE BECAUSE OF FAILURE TO SUBMIT A TRANSLATION OF THE DESCRIPTION OR TO PAY THE FEE WITHIN THE PRESCRIBED TIME-LIMIT Effective date: 20241030 |
|
| PG25 | Lapsed in a contracting state [announced via postgrant information from national office to epo] |
Ref country code: IT Free format text: LAPSE BECAUSE OF FAILURE TO SUBMIT A TRANSLATION OF THE DESCRIPTION OR TO PAY THE FEE WITHIN THE PRESCRIBED TIME-LIMIT Effective date: 20241030 |
|
| REG | Reference to a national code |
Ref country code: DE Ref legal event code: R097 Ref document number: 602017085844 Country of ref document: DE |
|
| PG25 | Lapsed in a contracting state [announced via postgrant information from national office to epo] |
Ref country code: LU Free format text: LAPSE BECAUSE OF NON-PAYMENT OF DUE FEES Effective date: 20241214 |
|
| PLBE | No opposition filed within time limit |
Free format text: ORIGINAL CODE: 0009261 |
|
| STAA | Information on the status of an ep patent application or granted ep patent |
Free format text: STATUS: NO OPPOSITION FILED WITHIN TIME LIMIT |
|
| PG25 | Lapsed in a contracting state [announced via postgrant information from national office to epo] |
Ref country code: SE Free format text: LAPSE BECAUSE OF FAILURE TO SUBMIT A TRANSLATION OF THE DESCRIPTION OR TO PAY THE FEE WITHIN THE PRESCRIBED TIME-LIMIT Effective date: 20241030 |
|
| 26N | No opposition filed |
Effective date: 20250731 |
|
| REG | Reference to a national code |
Ref country code: BE Ref legal event code: MM Effective date: 20241231 |
|
| PG25 | Lapsed in a contracting state [announced via postgrant information from national office to epo] |
Ref country code: BE Free format text: LAPSE BECAUSE OF NON-PAYMENT OF DUE FEES Effective date: 20241231 |
|
| PG25 | Lapsed in a contracting state [announced via postgrant information from national office to epo] |
Ref country code: IE Free format text: LAPSE BECAUSE OF NON-PAYMENT OF DUE FEES Effective date: 20241214 |
|
| REG | Reference to a national code |
Ref country code: CH Ref legal event code: U11 Free format text: ST27 STATUS EVENT CODE: U-0-0-U10-U11 (AS PROVIDED BY THE NATIONAL OFFICE) Effective date: 20260101 |
|
| PGFP | Annual fee paid to national office [announced via postgrant information from national office to epo] |
Ref country code: GB Payment date: 20251229 Year of fee payment: 9 |
|
| PGFP | Annual fee paid to national office [announced via postgrant information from national office to epo] |
Ref country code: FR Payment date: 20251226 Year of fee payment: 9 |
|
| PGFP | Annual fee paid to national office [announced via postgrant information from national office to epo] |
Ref country code: ES Payment date: 20260102 Year of fee payment: 9 |
|
| PGFP | Annual fee paid to national office [announced via postgrant information from national office to epo] |
Ref country code: DE Payment date: 20251229 Year of fee payment: 9 |
|
| PGFP | Annual fee paid to national office [announced via postgrant information from national office to epo] |
Ref country code: CH Payment date: 20260101 Year of fee payment: 9 |