EP2400457A1 - Image analysis method and image analysis apparatus - Google Patents
Image analysis method and image analysis apparatus Download PDFInfo
- Publication number
- EP2400457A1 EP2400457A1 EP11005007A EP11005007A EP2400457A1 EP 2400457 A1 EP2400457 A1 EP 2400457A1 EP 11005007 A EP11005007 A EP 11005007A EP 11005007 A EP11005007 A EP 11005007A EP 2400457 A1 EP2400457 A1 EP 2400457A1
- Authority
- EP
- European Patent Office
- Prior art keywords
- analysis
- correlation
- region
- data
- image
- Prior art date
- Legal status (The legal status is an assumption and is not a legal conclusion. Google has not performed a legal analysis and makes no representation as to the accuracy of the status listed.)
- Withdrawn
Links
Images



Classifications
-
- G—PHYSICS
- G02—OPTICS
- G02B—OPTICAL ELEMENTS, SYSTEMS OR APPARATUS
- G02B21/00—Microscopes
- G02B21/36—Microscopes arranged for photographic purposes or projection purposes or digital imaging or video purposes including associated control and data processing arrangements
- G02B21/365—Control or image processing arrangements for digital or video microscopes
- G02B21/367—Control or image processing arrangements for digital or video microscopes providing an output produced by processing a plurality of individual source images, e.g. image tiling, montage, composite images, depth sectioning, image comparison
-
- G—PHYSICS
- G06—COMPUTING OR CALCULATING; COUNTING
- G06T—IMAGE DATA PROCESSING OR GENERATION, IN GENERAL
- G06T7/00—Image analysis
- G06T7/97—Determining parameters from multiple pictures
-
- G—PHYSICS
- G06—COMPUTING OR CALCULATING; COUNTING
- G06V—IMAGE OR VIDEO RECOGNITION OR UNDERSTANDING
- G06V20/00—Scenes; Scene-specific elements
- G06V20/60—Type of objects
- G06V20/69—Microscopic objects, e.g. biological cells or cellular parts
-
- G—PHYSICS
- G06—COMPUTING OR CALCULATING; COUNTING
- G06T—IMAGE DATA PROCESSING OR GENERATION, IN GENERAL
- G06T2207/00—Indexing scheme for image analysis or image enhancement
- G06T2207/10—Image acquisition modality
- G06T2207/10056—Microscopic image
-
- G—PHYSICS
- G06—COMPUTING OR CALCULATING; COUNTING
- G06T—IMAGE DATA PROCESSING OR GENERATION, IN GENERAL
- G06T2207/00—Indexing scheme for image analysis or image enhancement
- G06T2207/10—Image acquisition modality
- G06T2207/10064—Fluorescence image
-
- G—PHYSICS
- G06—COMPUTING OR CALCULATING; COUNTING
- G06T—IMAGE DATA PROCESSING OR GENERATION, IN GENERAL
- G06T2207/00—Indexing scheme for image analysis or image enhancement
- G06T2207/30—Subject of image; Context of image processing
- G06T2207/30004—Biomedical image processing
- G06T2207/30024—Cell structures in vitro; Tissue sections in vitro
Definitions
- the present invention relates to image analysis.
- FCCS fluorescence cross-correlation spectroscopy
- FCCS is designed to perform correlation analysis by continuously irradiating one or more measurement points in a sample with excitation light for a certain period of time (e.g., 10 sec) and detecting fluctuations in the intensity of fluorescence emitted from the measurement points, thereby estimating the number of molecules and a diffusion constant.
- RICS raster image correlation spectroscopy
- a raster scanned image can be, for example, a fluorescence image.
- the data of each pixel of a fluorescence image represents the information of the intensity of fluorescence emitted from a corresponding point in a sample.
- the data of pixels differ in acquisition time and position.
- Correlation characteristics based on molecular fluctuations are obtained by performing spatial autocorrelation analysis using the data of these pixels.
- a diffusion constant and the number of molecules can be obtained from the correlation characteristics of molecules.
- a molecular diffusion time can be obtained from the diffusion constant.
- a molecular weight can be obtained from the molecular diffusion time.
- FCCS since measurement points in a sample are irradiated with excitation light for a relatively long period of time, the sample tends to be damaged.
- a target that can be analyzed is limited to a sample with a short diffusion time, and this analysis technique cannot be applied to a sample with a relatively long diffusion time.
- an image analysis method includes an analysis region image acquisition step of acquiring images of spatially different analysis regions. Each of the images of the analysis regions is constituted by pixels including a plurality of data acquired simultaneously or time-serially.
- the image analysis method further includes a correlation analysis step of obtaining a cross-correlation between two analysis regions by using data of pixels of images of the analysis regions.
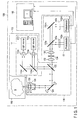
- FIG. 1 is a view schematically showing an image analysis apparatus according to the first embodiment of the invention.
- This image analysis apparatus is configured based on a scanning confocal optical microscope for fluorescent observation of a sample.
- an image analysis apparatus 100 includes a light irradiation unit 110 to apply light, e.g., excitation light, to a sample S, a photodetection unit 130 to detect light, e.g., fluorescence, from the sample S, a control unit 160 to perform necessary control for image analysis, and a sample stage 190 to support the sample S.
- a light irradiation unit 110 to apply light, e.g., excitation light
- a photodetection unit 130 to detect light, e.g., fluorescence
- control unit 160 to perform necessary control for image analysis
- a sample stage 190 to support the sample S.
- the sample S is contained in a sample container such as a microplate or a slide glass, and is placed on the sample stage 190.
- the sample stage 190 supports the sample S so as to allow it to be moved in the lateral direction (x and y directions) and height direction (z direction) relative to the light irradiation unit 110 and the photodetection unit 130.
- the sample stage 190 includes three stepping motors whose output shafts are perpendicular to each other, so that the sample S can be moved in the x, y, and z directions by these stepping motors.
- the image analysis apparatus 100 is, for example, of a multiple light irradiation/multiple light detection type.
- the light irradiation unit 110 includes an n-channel light source unit 111.
- the photodetection unit 130 includes an m-channel photodetection unit 131.
- the light source unit 111 has n channels and can emit excitation light beams having n different wavelengths.
- the photodetection unit 131 has m channels and can detect fluorescence beams having m different wavelengths.
- the light source unit 111 does not necessarily have a plurality of channels, and may have a single channel.
- the photodetection unit 131 does not necessarily have a plurality of channels, and may have a single channel.
- the n-channel light source unit 111 of the light irradiation unit 110 includes light sources 112a, ..., 112n, collimator lenses 114a, ..., 114n, and dichroic mirrors 116a, ..., 116n.
- the light sources 112a, ..., 112n emit excitation light beams for exciting fluorescent dyes contained in the sample S to cause the sample S to emit light beams (fluorescence beams).
- the wavelengths of the excitation light beams emitted from the light sources 112a, ..., 112n correspond to the types of fluorescent dyes contained in the sample S and differ from each other.
- the light sources 112a, ..., 112n are constituted by, for example, laser light sources with oscillation wavelengths corresponding to the fluorescent dyes in the sample S.
- the collimator lenses 114a, ..., 114n respectively collimate the excitation light beams emitted from the light sources 112a, ..., 112n.
- the dichroic mirrors 116a, ..., 116n respectively reflect the excitation light beams passing through the collimator lenses 114a, ..., 114n in the same direction.
- the dichroic mirrors 116a, ..., 116n respectively transmit excitation light beams striking them from the upper side in FIG. 1 , and reflect excitation light beams striking them from the right side in FIG. 1 .
- the excitation light beams with different wavelengths which are respectively emitted from the light sources 112a, ..., 112n, are combined into one beam after passing through the dichroic mirror 116a.
- the dichroic mirror 116n need not transmit any excitation light, and hence may be replaced with a simple mirror.
- the light irradiation unit 110 further includes a dichroic mirror 122, a galvano mirror 124, an objective lens 126, and an objective lens driving mechanism 128.
- the dichroic mirror 122 reflects excitation light from the light source unit 111 toward the galvano mirror 124, and transmits fluorescence emitted from the sample S.
- the galvano mirror 124 reflects excitation light toward the objective lens 126 and changes its reflecting direction.
- the objective lens 126 converges excitation light and irradiates a measurement point in the sample S with the light, and captures light from the measurement point in the sample S.
- a lens having a large NA (Numerical Aperture) is used to form a minute confocal region (measurement point).
- the confocal region obtained by this lens has a generally cylindrical shape with a diameter of about 0.6 ⁇ m (in an x-y plane) and a length of about 2 ⁇ m (in the z direction).
- the galvano mirror 124 constitutes an x-y scanning mechanism to scan a measurement point in the x and y directions.
- the x-y scanning mechanism may be constituted by using an acoustooptic modulator (AOM), a polygon mirror, a hologram scanner, and the like instead of being constituted by using a galvano mirror.
- the objective lens driving mechanism 128 moves the objective lens 126 along the optical axis. This moves a measurement point in the z direction. That is, the objective lens driving mechanism 128 constitutes a z scanning mechanism to scan a measurement point in the z direction.
- the photodetection unit 130 commonly includes the objective lens 126, the galvano mirror 124, and the dichroic mirror 122 with the light irradiation unit 110.
- the photodetection unit 130 further includes a convergence lens 132, a pinhole 134, and a collimator lens 136.
- the convergence lens 132 converges light transmitted through the dichroic mirror 122.
- the pinhole 134 is placed at the focus of the convergence lens 132. That is, the pinhole 134 is placed at a position conjugate to a measurement point in the sample S, and selectively transmits light from only the measurement point.
- the collimator lens 136 collimates light passing through the pinhole 134.
- the light passing through the collimator lens 136 strikes the m-channel photodetection unit 131.
- the m-channel photodetection unit 131 includes dichroic mirrors 138a, ..., 138m, fluorescence filters 140a, ..., 140m, and photodetectors 142a, ..., 142m.
- the dichroic mirrors 138a, ..., 138m selectively reflect light beams with wavelengths near the wavelength region of fluorescence to be detected, respectively.
- the dichroic mirror 138m need not transmit any light, and hence may be replaced with a simple mirror.
- the fluorescence filters 140a, ..., 140m respectively cut off unnecessary wavelength components of light from the light reflected by the dichroic mirrors 138a, ..., 138m, and selectively transmit only fluorescence beams generated by excitation light beams from the light sources 112a, ..., 112n.
- the fluorescence beams transmitted through the fluorescence filters 140a, ..., 140m respectively strike the photodetectors 142a, ..., 142m.
- the photodetectors 142a, ..., 142m output signals corresponding to the intensities of the incident light beams. That is, the photodetectors 142a, ..., 142m output fluorescence intensity signals from a measurement point in the sample S.
- the control unit 160 is constituted by, for example, a personal computer.
- the control unit 160 performs acquisition/storage/display of a fluorescence image of an observation region of the sample S, waits for the input of settings of an analysis region, and performs image analysis processing (e.g., calculation of a correlation value and estimation of the number of molecules and a diffusion time).
- the control unit 160 controls the galvano mirror 124 as an x-y scanning mechanism, the objective lens driving mechanism 128 as a z scanning mechanism, the sample stage 190, and the like.
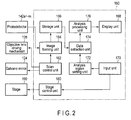
- FIG. 2 shows the functional blocks of the control unit shown in FIG. 1 .
- the control unit 160 includes a scan control unit 162, an image forming unit 164, a storage unit 166, a display unit 168, an input unit 170, an analysis region setting unit 172, a data extraction unit 174, an analysis processing unit 176, and a stage control unit 180.
- the scan control unit 162, the image forming unit 164, the storage unit 166, and the stage control unit 180 constitute an observation region image acquisition unit in cooperation with the light irradiation unit 110 and the photodetection unit 130, which have been described above.
- This observation region image acquisition unit further constitutes an analysis region image acquisition unit in cooperation with the analysis region setting unit 172 and the data extraction unit 174.
- the scan control unit 162 controls the galvano mirror 124 so as to raster-scan the irradiation position of excitation light on the sample S when acquiring a fluorescence image of the sample S. In addition, if necessary, the scan control unit 162 controls the objective lens driving mechanism 128 so as to z-scan the irradiation position of excitation light on the sample S.
- the image forming unit 164 forms a fluorescence image of the sample S from the information of the irradiation position of excitation light input from the scan control unit 162 and output signals from the photodetectors 142a, ..., 142m. With this operation, a fluorescence image is acquired.
- the storage unit 166 stores the fluorescence image formed by the image forming unit 164.
- the display unit 168 displays a fluorescence image of the sample S and an analysis processing result.
- the input unit 170 includes, for example, a mouse and a keyboard, and constitutes a GUI in cooperation with the display unit 168. This GUI is used to set, for example, an observation region and analysis regions.
- the stage control unit 180 controls the sample stage 190 to set, for example, an observation region in accordance with input information from the input unit 170.
- the analysis region setting unit 172 sets analysis regions in accordance with input information from the input unit 170.
- the data extraction unit 174 extracts the data of two analysis regions between which a correlation is obtained.
- the analysis processing unit 176 obtains a cross-correlation by using the data of pixels of images of two analysis regions. The processing performed by this analysis processing unit 176 will be described in detail later.
- the excitation light beams emitted from the light sources 112a, ..., 112n are applied to a measurement point in the sample S through the collimator lenses 114a, ..., 114n, the dichroic mirrors 116a, ..., 116n, the dichroic mirror 122, the galvano mirror 124, and the objective lens 126.
- the measurement point to which excitation light beams are applied is raster-scanned by the galvano mirror 124 in the x and y directions.
- the measurement point is z-scanned by the objective lens driving mechanism 128 every time one raster scan is complete. The measurement point is scanned over an observation region.
- the sample S emits fluorescence from the measurement point upon receiving excitation light.
- the light (including undesired reflected light in addition to fluorescence) from the sample S reaches the pinhole 134 through the objective lens 126, the galvano mirror 124, the dichroic mirror 122, and convergence lens 132. Since the pinhole 134 is placed at a position conjugate to the measurement point, only light from the measurement point in the sample S passes through the pinhole 134.
- the light passing through the pinhole 134 i.e., the light from the measurement point in the sample S, strikes the m-channel photodetection unit 131 through the collimator lens 136.
- the light that has struck the m-channel photodetection unit 131 is separated in accordance with the wavelengths (that is, spectroscoped) by the dichroic mirrors 138a, ..., 138m, and undesired components are removed by the fluorescence filters 140a, ..., 140m.
- the fluorescence beams passing through the fluorescence filters 140a, ..., 140m respectively strike the photodetectors 142a, ..., 142m.
- the photodetectors 142a, ..., 142m respectively output fluorescence intensity signals indicating the intensities of the incident light beams, i.e., the fluorescence beams emitted from the measurement point in the sample S.
- the fluorescence intensity signals are input to the image forming unit 164.
- the image forming unit 164 processes the input fluorescence intensity signals in synchronism with position information in the x and y directions (also in the z direction) to form a fluorescence image of the observation region in the sample S.
- the formed fluorescence image is stored in the storage unit 166.
- the fluorescence image stored in the storage unit 166 is directly displayed on the display unit 168 or processed by the analysis processing unit 176 to display the analysis processing result on the display unit 168.
- a fluorescence image of an observation region is constituted by pixels having a plurality of data acquired time-serially.
- a measurement point has a spatial spread in the x, y, and z directions.
- a pixel has a size corresponding to the spatial spread of this measurement point.
- the fluorescence image is a two-dimensional image in which pixels having sizes in the x and y directions are arrayed two-dimensionally.
- the fluorescence image is a three-dimensional image in which pixels having sizes in the x, y, and z directions are arrayed three-dimensionally. From a different viewpoint, a three-dimensional image is constituted by two-dimensional images at different z positions.
- FIG. 3 shows an example of a two-dimensional image.
- reference symbol ⁇ p denotes a pixel time, the acquisition time difference between a given pixel and the next pixel adjacent to the given pixel. That is, the pixel time ⁇ p is the time required to acquire the data of one pixel.
- Reference symbol ⁇ l denotes a line time, the acquisition time difference between the first pixel on a given line and the first pixel on the next line. That is, the line time ⁇ l indicates the time required to scan one line.
- Equation (1) represents a spatial cross-correction calculating formula used for RICS analysis used for a two-dimensional image.
- Equation (1) is an example of a cross-correlation calculating formula for an analysis region 1 and an analysis region 2.
- G s ⁇ ⁇ ⁇ ⁇ ⁇ I 1 x ⁇ y * I 2 ⁇ x + ⁇ , y + ⁇ / M 12 ⁇ ⁇ I 1 x ⁇ y / M 1 ⁇ ⁇ ⁇ I 2 x ⁇ y / M 2
- G s is a spatial cross-correlation value of RICS
- I 1 is the data of a pixel of an image of the analysis region 1, e.g., fluorescence intensity data
- I 2 is the data of a pixel of an image of the analysis region 2
- x and y are the spatial coordinates of the measurement point
- ⁇ and ⁇ are the changes of the spatial coordinates from the measurement point
- M 12 is the number of times of sum
- Equation (2) represents a fitting formula used for RICS analysis on a two-dimensional image.
- G ⁇ ⁇ ⁇ 1 N ⁇ 1 + 4 ⁇ D ⁇ ⁇ p ⁇ ⁇ + ⁇ l ⁇ ⁇ W 0 2 ⁇ 1 * 1 + 4 ⁇ D ⁇ ⁇ p ⁇ ⁇ + ⁇ l ⁇ ⁇ W Z 2 ⁇ 1 / 2
- G s is a spatial cross-correlation value of RICS
- S is the influence of a scan in RICS analysis
- G is the influence of a time delay in RICS analysis
- D is
- FIG. 4 shows an example of a three-dimensional image.
- reference symbol ⁇ p denotes the pixel time
- ⁇ l the line time
- ⁇ f a frame time, the acquisition time difference between the first pixel of a given frame and the first pixel of the next frame. That is, the frame time ⁇ f indicates the time required to scan one frame.
- Equation (3) represents a spatial cross-correlation calculating formula used for RICS analysis on a three-dimensional image.
- Equation (3) is an example of a cross-correlation calculating formula for the analysis region 1 and the analysis region 2.
- G s ⁇ ⁇ ⁇ ⁇ ⁇ ⁇ ⁇ ⁇ I 1 x ⁇ y ⁇ z * I 2 ⁇ x + ⁇ , y + ⁇ , z + ⁇ / M 12 ⁇ ⁇ I 1 x ⁇ y ⁇ z / M 1 ⁇ ⁇ ⁇ I 2 x ⁇ y ⁇ z / M 2
- G s is a spatial cross-correlation value of RICS
- I 1 is the data of a pixel of an image of the analysis region 1 e.g., fluorescence intensity data
- I 2 is the data of a pixel of an image of the analysis region 2
- x, y, and z are the spatial coordinates of the measurement point
- Equation (4) represents a fitting formula used for RICS analysis on a three-dimensional image.
- G ⁇ ⁇ ⁇ ⁇ ⁇ 1 N ⁇ 1 + 4 ⁇ D ⁇ ⁇ p ⁇ ⁇ + ⁇ l ⁇ ⁇ + ⁇ f ⁇ ⁇ W 0 2 - 1 * 1 + 4 ⁇ D ⁇ ⁇ p ⁇ ⁇ + ⁇ l ⁇ ⁇ + ⁇ f ⁇ ⁇ W Z 2 - 1
- ⁇ p is the pixel time
- ⁇ l is the line time
- ⁇ f is the frame time
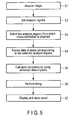
- a fluorescence image(s) of one or more frames of an observation region of the sample S is acquired.
- a fluorescence image is acquired through one channel of the light source unit 111 and one corresponding channel of the photodetection unit 131.
- An observation region is a two-dimensional or three-dimensional region. Accordingly, a fluorescence image is a two-dimensional or three-dimensional image.
- the fluorescence image shown in FIG. 3 corresponds to one frame.
- the fluorescence images shown in FIG. 4 correspond to one frame.
- the data of each pixel of a fluorescence image is, for example, the intensity of fluorescence emitted from the corresponding measurement point.
- analysis regions are set for a fluorescence image(s) of each frame of the observation region.
- the analysis regions are spatially different regions, which are generally spaced apart from each other and do not overlap.
- Each analysis region is a two-dimensional region for a two-dimensional observation region, and is generally a three-dimensional region but may be a two-dimensional region for a three-dimensional observation region. Note that FIG. 6 shows the interior of one cell, and an elliptic portion A of a central portion indicates the nucleus.
- two analysis regions (an analysis region 1 and an analysis region 2) between which a spatial cross-correlation is obtained are selected for the fluorescence image(s) of one frame of the observation region.
- a region X inside the nucleus is selected as the analysis region 1
- a region Y outside the nucleus is selected as the analysis region 2.
- the data of pixels corresponding to the two analysis regions are extracted.
- a correlation is calculated by using the extracted data of the pixels.
- the spatial cross-correlation calculating formula given by equation (1) is used for a two-dimensional image.
- the spatial cross-correlation calculating formula given by equation (3) is used for a three-dimensional image.
- the data of each pixel used for correlation calculation may be the data of the pixel of interest itself or the statistical value of the data of pixels including the pixel of interest.
- the pixels may include the pixel of interest and its adjacent pixels.
- a statistical value may be, for example, any one of an average value, a maximum value, a minimum value, a relative difference, an absolute difference, and a relative ratio of the data of the pixels. Depending on which kind of information to be obtained by RICS analysis will determine which kind of statistical value is to be used.
- data to be used for correlation calculation may be any one of a pixel time, a line time, a frame time, a pixel positional relationship, a pixel size, and its statistical value.
- Correlation calculation may be performed for the images obtained by reconstructing images based on the data of pixels. For example, the data of adjacent pixels are added to decrease the number of data of pixels to half. Alternatively, the data of one pixel is divided into parts. Although the number of data of pixels does not normally increase once an image is acquired, pixel data that cannot be normally obtained is compensated by assuming that the intensities of the acquired data of a pixel are distributed around the data of the pixel in a Gaussian distribution. Although the number of data of each pixel does not essentially increase, the appearance of the image is improved.
- Fitting is performed for the correlation calculation result obtained in step S5 to estimate at least one of the number of molecules and a diffusion time.
- the fitting equation given by equation (2) is used for a two-dimensional image, whereas the fitting equation given by equation (4) is used for a three-dimensional image.
- cross-correlation values G s corresponding to different delay times are obtained by using equation (1) or (3).
- a diffusion constant and the number of molecules are then obtained from the relationship between the cross-correlation values G s and the delay times by using equation (2) or (4).
- the number of molecules and a diffusion constant are obtained by a residue comparison (fitting) between the results of correlation calculation of the theoretical values of equations (2) and (4) and measured values.
- G s obtained as a theoretical value (to be referred to as the theoretical correlation value G s hereinafter) is calculated by using the predetermined diffusion constant D and the number N of molecules.
- the theoretical correlation value G s is then compared with the correlation value G obtained as a measured value (to be referred to as the measured correlation value G s hereinafter) to calculate the residue between them.
- the new theoretical correlation value G s is calculated by changing the diffusion constant D and the number N of molecules in the theoretical correlation value G s .
- the new theoretical correlation value G s is compared with the measured correlation value G s to calculate the residue between them.
- the residue obtained in (b) is compared with the residue obtained in (d) to determine whether the residue has increased or decreased.
- (b) to (e) are repeated while the diffusion constant D and the number N of molecules in the theoretical correlation value G s are changed, thereby finally obtaining the theoretical correlation value G s that minimizes the residue between the measured correlation value G and the theoretical correlation value G s .
- the diffusion constant D and the number N of molecules in the finally obtained theoretical correlation value G s are the diffusion constant D and the number N of molecules in the measured correlation value G s .
- fitting based on equation (2) or (4) is to estimate the optimal number of molecules or diffusion constant in a two-dimensional or three-dimensional observation region while changing the diffusion constant D and the number N of molecules in the theoretical correlation value G s .
- FIGS. 8, 9 , 10, and 11 each show an example of an analysis result.
- FIGS. 8 and 10 each show an example of displaying the calculation results of spatial cross-correlation values associated with molecules in the sample S as an image on a CRT.
- FIGS. 9 and 11 each show the fitting result of the calculation results of the spatial cross-correlation values in FIGS. 8 and 10 .
- FIGS. 8 and 10 each indicate the magnitudes of the spatial cross-correlation values by luminances on the CRT. Note that, referring to FIGS. 8 and 10 , contour lines explicitly indicate changes in luminance (spatial cross-correlation value). In addition, FIGS.
- the analysis results shown in FIGS. 8 and 9 indicate that the motions of molecules between the analysis region 1 (the region X in FIG. 6 ) and the analysis region 2 (the region Y in FIG. 6 ) are relatively fast.
- the analysis results shown in FIGS. 10 and 11 indicate that the motions of molecules between the analysis region 1 (the region X in FIG. 6 ) and the analysis region 2 (a region Z in FIG. 6 ) are relatively slow.
- steps S3 to S7 are repeated for another combination of two analysis regions.
- steps S3 to S7 are repeated for another fluorescence images of observation regions of another frame.
- obtaining spatial cross-correlations while sequentially changing a combination of analysis regions allows to two-dimensionally or three-dimensionally comprehend the motions of molecules between different regions in the sample S.
- obtaining spatial cross-correlations between combinations of one analysis region and surrounding analysis regions allows to two-dimensionally or three-dimensionally comprehend the motions of molecules between the one analysis region and the surrounding analysis regions.
- fluorescence images are obtained by the scanning confocal optical microscope.
- images are formed time-serially, the time when a fluorescence image of the analysis region 1 is obtained differs from the time when a fluorescence image.of the analysis region 2 is obtained.
- fluorescence images obtained time-serially allow to evaluate the motions of molecules whose moving speeds are relatively low.
- images are formed simultaneously (when captured by a two-dimensional image sensing device such as a CCD or a CMOS), the time when a fluorescence image of the analysis region 1 is obtained coincides with the time when a fluorescence image of the analysis region 2 is obtained. In this case, it is possible to evaluate the motions of molecules whose moving speeds are relatively high.
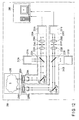
- FIG. 12 schematically shows an image analysis apparatus according to the second embodiment of the invention.
- This image analysis apparatus is configured based on a scanning confocal optical microscope for fluorescent observation of a sample.
- an image analysis apparatus 200 includes two light irradiation units 210A and 210B to respectively apply light, e.g., excitation light, to a sample S, two photodetection units 230A and 230B to respectively detect light, e.g., fluorescence, from the sample S, a control unit 260 to perform necessary control for image analysis, and a sample stage 290 to support the sample S.
- the light irradiation units 210A and 210B respectively apply light beams to different regions in the sample S.
- the photodetection units 230A and 230B respectively detect light beams from the regions to which the excitation light beams are applied by the light irradiation units 210A and 210B.
- the sample S is contained in a sample container such as a microplate or a slide glass, and is placed on the sample stage 290.
- the details of the sample stage 290 are the same as those of the sample stage 190 in the first embodiment.
- the light irradiation units 210A and 210B respectively include light source units 211A and 211B, dichroic mirrors 222A and 222B, galvano mirrors 224A and 224B, objective lenses 226A and 226B, and objective lens driving mechanisms 228A and 228B.
- the details of the light source units 211A and 211B, dichroic mirrors 222A and 222B, galvano mirrors 224A and 224B, objective lenses 226A and 226B, and objective lens driving mechanisms 228A and 228B are the same as those of the light source unit 111, dichroic mirror 122, galvano mirror 124, objective lens 126, and objective lens driving mechanism 128 in the first embodiment.
- the photodetection units 230A and 230B respectively commonly include the objective lenses 226A and 226B, the galvano mirrors 224A and 224B, and the dichroic mirrors 222A and 222B with the light irradiation units 210A and 210B.
- the photodetection units 230A and 230B also respectively include convergence lenses 232A and 232B, pinholes 234A and 234B, collimator lenses 236A and 236B, and photodetection units 231A and 231B.
- the convergence lenses 232A and 232B, the pinholes 234A and 234B, the collimator lenses 236A and 236B, and the photodetection units 231A and 231B are the same as the convergence lens 132, the pinhole 134, the collimator lens 136, and the photodetection unit 131 in the first embodiment.
- the control unit 260 is constituted by, for example, a personal computer.
- the control unit 260 controls acquisition/storage/display of fluorescence images, waiting for the input of settings of analysis regions, image analysis processing, the galvano mirrors 224A and 224B as an x-y scanning mechanism, the objective lens driving mechanisms 228A and 228B as a z scanning mechanism, the sample stage 290, and the like.
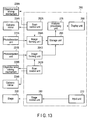
- FIG. 13 shows the functional blocks of the control unit shown in FIG. 12 .
- the control unit 260 includes scan control units 262A and 262B, image forming units 264A and 264B, a storage unit 266, a display unit 268, an input unit 270, an analysis processing unit 276, and a stage control unit 280.
- the scan control units 262A and 262B, the image forming units 264A and 264B, the storage unit 266, and the stage control unit 280 constitute an analysis region image acquisition unit in cooperation with the light irradiation units 210A and 210B and the photodetection units 230A and 230B.
- the scan control units 262A and 262B control the galvano mirrors 224A and 224B so as to raster-scan the irradiation positions of excitation light beams on observation regions in the sample S.
- the scan control units 262A and 262B control the objective lens driving mechanisms 228A and 228B so as to z-scan the irradiation positions of excitation light beams on the sample S.
- the image forming units 264A and 264B form fluorescence images of the sample S from the information of the irradiation positions of excitation light beams input from the scan control units 262A and 262B and output signals from the photodetection units 231A and 231B.
- the storage unit 266 stores the fluorescence images formed by the image forming units 264A and 264B.
- the display unit 268 displays the fluorescence images of the sample S and analysis processing results.
- the input unit 270 includes, for example, a mouse and a keyboard, and forms a GUI in cooperation with the display unit 268. This GUI is used to set, for example, an observation region.
- the stage control unit 280 controls the sample stage 290 to set, for example, an observation region in accordance with input information from the input unit 270.
- the analysis processing unit 276 obtains a cross-correlation by using the data of pixels of images of two observation regions acquired by the image forming units 264A and 264B.
- the light irradiation units 210A and 210B, the photodetection units 230A and 230B, the scan control units 262A and 262B, and the image forming units 264A and 264B acquire fluorescence images of the respective observation regions by the same technique as that for acquiring fluorescence images in the first embodiment. Fluorescence images of two observation regions may be acquired simultaneously or at different timings.
- the analysis processing unit 276 performs image analysis processing in the same manner as that for image analysis processing by the analysis processing unit 176 in the first embodiment except that the images of two analysis regions in the first embodiment are replaced by the images of two observation regions acquired by the image forming units 264A and 264B.
- This embodiment has the same advantages as those of the first embodiment.
- simultaneously acquiring fluorescence images of two observation regions can obtain a more accurate spatial cross-correlation.
- images to be analyzed are not limited to fluorescence images.
- images to be analyzed may include, for example, images formed by detecting phosphorescence, reflected light, visible light, chemiluminescence, bioluminescence, and scattered light.
- images to be processed are not limited to those acquired by raster scanning, and may be any images that are constituted by pixels whose data are acquired time-serially, or may be images acquired by other scanning methods.
Landscapes
- Engineering & Computer Science (AREA)
- Physics & Mathematics (AREA)
- Multimedia (AREA)
- General Physics & Mathematics (AREA)
- Computer Vision & Pattern Recognition (AREA)
- Theoretical Computer Science (AREA)
- Chemical & Material Sciences (AREA)
- Analytical Chemistry (AREA)
- Optics & Photonics (AREA)
- Molecular Biology (AREA)
- General Health & Medical Sciences (AREA)
- Biomedical Technology (AREA)
- Health & Medical Sciences (AREA)
- Life Sciences & Earth Sciences (AREA)
- Investigating, Analyzing Materials By Fluorescence Or Luminescence (AREA)
Applications Claiming Priority (1)
| Application Number | Priority Date | Filing Date | Title |
|---|---|---|---|
| JP2010145607A JP2012008055A (ja) | 2010-06-25 | 2010-06-25 | 画像解析方法および画像解析装置 |
Publications (1)
| Publication Number | Publication Date |
|---|---|
| EP2400457A1 true EP2400457A1 (en) | 2011-12-28 |
Family
ID=44544234
Family Applications (1)
| Application Number | Title | Priority Date | Filing Date |
|---|---|---|---|
| EP11005007A Withdrawn EP2400457A1 (en) | 2010-06-25 | 2011-06-20 | Image analysis method and image analysis apparatus |
Country Status (3)
| Country | Link |
|---|---|
| US (2) | US8908993B2 (enExample) |
| EP (1) | EP2400457A1 (enExample) |
| JP (1) | JP2012008055A (enExample) |
Families Citing this family (14)
| Publication number | Priority date | Publication date | Assignee | Title |
|---|---|---|---|---|
| JP2013195127A (ja) * | 2012-03-16 | 2013-09-30 | Olympus Corp | 生物試料の画像解析装置、画像解析方法、およびプログラム |
| WO2014110290A1 (en) * | 2013-01-09 | 2014-07-17 | The Regents Of The University Of California | Apparatus and methods for fluorescence imaging using radiofrequency-multiplexed excitation |
| DE102014002516A1 (de) | 2014-02-22 | 2015-08-27 | Ernstfried Prade | Rettungssystem für Personen im Wasser |
| WO2015143041A1 (en) | 2014-03-18 | 2015-09-24 | The Regents Of The University Of California | Parallel flow cytometer using radiofrequency mulitplexing |
| DE102015112628A1 (de) * | 2015-07-31 | 2017-02-02 | Carl Zeiss Microscopy Gmbh | Verfahren zur Erzeugung eines digitalen Fluoreszenzbildes |
| EP3362778B1 (en) | 2015-10-13 | 2022-08-03 | Omega Biosystems Incorporated | Multi-modal fluorescence imaging flow cytometry system |
| CA3018065A1 (en) | 2016-03-17 | 2017-09-21 | Bd Biosciences | Cell sorting using a high throughput fluorescence flow cytometer |
| JP7023244B2 (ja) | 2016-05-12 | 2022-02-21 | ビーディー バイオサイエンス | 画像解像度が改良された蛍光イメージングフローサイトメトリー |
| US10006852B2 (en) | 2016-09-13 | 2018-06-26 | Becton, Dickinson And Company | Flow cytometer with optical equalization |
| JP6841669B2 (ja) * | 2017-01-19 | 2021-03-10 | 浜松ホトニクス株式会社 | 観察装置及び観察方法 |
| DE102017101188B4 (de) * | 2017-01-23 | 2021-09-30 | Carl Zeiss Microscopy Gmbh | Mikroskop und Verfahren zum Mikroskopieren einer Probe |
| WO2021007075A1 (en) | 2019-07-10 | 2021-01-14 | Becton, Dickinson And Company | Reconfigurable integrated circuits for adjusting cell sorting classification |
| JP7867444B2 (ja) | 2020-05-19 | 2026-05-29 | ベクトン・ディキンソン・アンド・カンパニー | レーザービームの強度プロファイルを変調するための方法及びそのシステム |
| WO2021262285A1 (en) | 2020-06-26 | 2021-12-30 | Becton, Dickinson And Company | Dual excitation beams for irradiating a sample in a flow stream and methods for using same |
Citations (2)
| Publication number | Priority date | Publication date | Assignee | Title |
|---|---|---|---|---|
| US20060045505A1 (en) * | 2004-08-31 | 2006-03-02 | Zeineh Jack A | System and method for creating magnified images of a microscope slide |
| DE102007052551A1 (de) * | 2007-10-30 | 2009-05-07 | Carl Zeiss Microimaging Gmbh | Konfiguration eines Laser-Scanning -Mikroskops für eine Rasterbildkorrelationsspektroskopiemessung sowie Verfahren zur Durchführung und Auswertung einer solchen Messung |
Family Cites Families (22)
| Publication number | Priority date | Publication date | Assignee | Title |
|---|---|---|---|---|
| US5249238A (en) * | 1991-03-19 | 1993-09-28 | Komerath Narayanan M | Spatial cross-correlating velocimeter |
| US6052188A (en) * | 1998-07-08 | 2000-04-18 | Verity Instruments, Inc. | Spectroscopic ellipsometer |
| AU2003244122A1 (en) * | 2002-06-21 | 2004-01-06 | Olympus Corporation | Biomolecule analyzer |
| JP3854585B2 (ja) * | 2003-03-17 | 2006-12-06 | 独立行政法人科学技術振興機構 | 液晶パネルの表示欠陥検出方法及び表示欠陥検査装置 |
| JP3999701B2 (ja) * | 2003-05-30 | 2007-10-31 | オリンパス株式会社 | 分光分析装置 |
| JP4576187B2 (ja) * | 2004-09-27 | 2010-11-04 | 株式会社エム・アイ・エル | 物品欠陥情報検出装置 |
| JP4411395B2 (ja) * | 2005-02-22 | 2010-02-10 | 国立大学法人東京工業大学 | 光位相分布測定方法及び光位相分布測定システム |
| JP4740952B2 (ja) * | 2005-09-27 | 2011-08-03 | オリンパス株式会社 | 光信号解析装置および光信号解析方法 |
| JP4830087B2 (ja) | 2005-09-27 | 2011-12-07 | 国立大学法人北海道大学 | 光信号解析装置 |
| US7605918B2 (en) * | 2006-03-03 | 2009-10-20 | Thermo Electron Scientific Instruments Llc | Spectrometer signal quality improvement via exposure time optimization |
| JP5489469B2 (ja) * | 2007-01-16 | 2014-05-14 | オリンパス株式会社 | 蛍光信号解析装置および蛍光信号解析方法 |
| JP5354938B2 (ja) * | 2007-05-02 | 2013-11-27 | オリンパス株式会社 | 蛍光顕微鏡装置 |
| US7978403B2 (en) * | 2007-05-10 | 2011-07-12 | Stc.Unm | Imaging interferometric microscopy |
| US7884324B2 (en) * | 2007-06-03 | 2011-02-08 | Wisconsin Alumni Research Foundation | Nanopillar arrays for electron emission |
| US8611639B2 (en) * | 2007-07-30 | 2013-12-17 | Kla-Tencor Technologies Corp | Semiconductor device property extraction, generation, visualization, and monitoring methods |
| JP5208824B2 (ja) * | 2009-03-18 | 2013-06-12 | オリンパス株式会社 | 画像取得装置、画像取得方法及びプログラム |
| JP5468805B2 (ja) * | 2009-03-31 | 2014-04-09 | オリンパス株式会社 | 画像解析方法および画像解析装置 |
| JP5489541B2 (ja) * | 2009-06-05 | 2014-05-14 | オリンパス株式会社 | 画像解析方法および画像解析装置 |
| JP5566055B2 (ja) * | 2009-07-10 | 2014-08-06 | オリンパス株式会社 | 画像解析方法および画像解析装置 |
| JP5508808B2 (ja) * | 2009-10-15 | 2014-06-04 | オリンパス株式会社 | 画像解析方法および画像解析装置 |
| JP5508809B2 (ja) * | 2009-10-15 | 2014-06-04 | オリンパス株式会社 | 画像解析方法および画像解析装置 |
| MX2012006861A (es) * | 2009-12-18 | 2012-06-27 | Cajas Para Exportacion Retornables S A | Tarimas multi-diseño reutilizables y reciclabes. |
-
2010
- 2010-06-25 JP JP2010145607A patent/JP2012008055A/ja active Pending
-
2011
- 2011-06-20 EP EP11005007A patent/EP2400457A1/en not_active Withdrawn
- 2011-06-24 US US13/168,544 patent/US8908993B2/en not_active Expired - Fee Related
-
2014
- 2014-10-30 US US14/527,987 patent/US9383570B2/en not_active Expired - Fee Related
Patent Citations (2)
| Publication number | Priority date | Publication date | Assignee | Title |
|---|---|---|---|---|
| US20060045505A1 (en) * | 2004-08-31 | 2006-03-02 | Zeineh Jack A | System and method for creating magnified images of a microscope slide |
| DE102007052551A1 (de) * | 2007-10-30 | 2009-05-07 | Carl Zeiss Microimaging Gmbh | Konfiguration eines Laser-Scanning -Mikroskops für eine Rasterbildkorrelationsspektroskopiemessung sowie Verfahren zur Durchführung und Auswertung einer solchen Messung |
Non-Patent Citations (4)
| Title |
|---|
| DAVID L KOLIN ET AL: "Advances in Image Correlation Spectroscopy: Measuring Number Densities, Aggregation States, and Dynamics of Fluorescently labeled Macromolecules in Cells", CELL BIOCHEMISTRY AND BIOPHYSICS, TOTOWA, NJ, US, vol. 49, 1 January 2007 (2007-01-01), pages 141 - 164, XP007906841, ISSN: 1085-9195, [retrieved on 20071002], DOI: 10.1007/S12013-007-9000-5 * |
| MICHELLE A. DIGMAN ET AL: "Detecting Protein Complexes in Living Cells from Laser Scanning Confocal Image Sequences by the Cross Correlation Raster Image Spectroscopy Method", BIOPHYSICAL JOURNAL, vol. 96, no. 2, 21 January 2009 (2009-01-21), pages 707 - 716, XP055007216, ISSN: 0006-3495, DOI: 10.1016/j.bpj.2008.09.051 * |
| MICHELLE A. DIGMAN, CLAIRE M. BROWN, PARIJAT SENGUPTA, PAUL W. WISEMAN, ALAN R. HORWITZ, ENRICO GRATTON: "Measuring Fast Dynamics in Solutions and Cells with a Laser Scanning Microscope", BIOPHYSICAL JOURNAL, vol. 89, August 2005 (2005-08-01), pages 1317 - 1327 |
| MICHELLE A. DIGMAN, CLAIRE M. BROWN, PARIJAT SENGUPTA, PAUL W. WISEMAN, ALAN R. HORWITZ, ENRICO GRATTON: "Measuring Fast Dynamics in Solutions and Cells with a Laser Scanning Microscope", BIOPHYSICAL JOURNAL, vol. 89, August 2005 (2005-08-01), pages 1317 - 1327, XP002557976 * |
Also Published As
| Publication number | Publication date |
|---|---|
| US20110317910A1 (en) | 2011-12-29 |
| JP2012008055A (ja) | 2012-01-12 |
| US20150054938A1 (en) | 2015-02-26 |
| US9383570B2 (en) | 2016-07-05 |
| US8908993B2 (en) | 2014-12-09 |
Similar Documents
| Publication | Publication Date | Title |
|---|---|---|
| US8908993B2 (en) | Image analysis method and image analysis apparatus | |
| JP5489469B2 (ja) | 蛍光信号解析装置および蛍光信号解析方法 | |
| US8705865B2 (en) | Image analysis method and image analysis apparatus | |
| JP2012008055A5 (enExample) | ||
| US9739715B2 (en) | Laser scanning microscope system and method of setting laser-light intensity value | |
| CN110869747A (zh) | 试样观察装置和试样观察方法 | |
| JP5468805B2 (ja) | 画像解析方法および画像解析装置 | |
| CN103189737B (zh) | 图像分析方法以及图像分析装置 | |
| JP5208824B2 (ja) | 画像取得装置、画像取得方法及びプログラム | |
| JP5856814B2 (ja) | 画像解析方法および画像解析装置 | |
| JP5566055B2 (ja) | 画像解析方法および画像解析装置 | |
| CN103180718B (zh) | 图像分析方法以及图像分析装置 | |
| JP2022122181A (ja) | 補正パラメータ設定方法及びデータ補正方法 | |
| JP5508809B2 (ja) | 画像解析方法および画像解析装置 | |
| JP5489541B2 (ja) | 画像解析方法および画像解析装置 | |
| JP2008180637A (ja) | 光信号解析方法および光信号解析装置 |
Legal Events
| Date | Code | Title | Description |
|---|---|---|---|
| AK | Designated contracting states |
Kind code of ref document: A1 Designated state(s): AL AT BE BG CH CY CZ DE DK EE ES FI FR GB GR HR HU IE IS IT LI LT LU LV MC MK MT NL NO PL PT RO RS SE SI SK SM TR |
|
| AX | Request for extension of the european patent |
Extension state: BA ME |
|
| PUAI | Public reference made under article 153(3) epc to a published international application that has entered the european phase |
Free format text: ORIGINAL CODE: 0009012 |
|
| STAA | Information on the status of an ep patent application or granted ep patent |
Free format text: STATUS: THE APPLICATION IS DEEMED TO BE WITHDRAWN |
|
| 18D | Application deemed to be withdrawn |
Effective date: 20120629 |