EP1645862A2 - Verfahren zur quantitativen Analyse der Lenkungscharacteristik zur Ermittlung der Lenkungsstabilität von Fahrzeugen/Reifen - Google Patents
Verfahren zur quantitativen Analyse der Lenkungscharacteristik zur Ermittlung der Lenkungsstabilität von Fahrzeugen/Reifen Download PDFInfo
- Publication number
- EP1645862A2 EP1645862A2 EP04257789A EP04257789A EP1645862A2 EP 1645862 A2 EP1645862 A2 EP 1645862A2 EP 04257789 A EP04257789 A EP 04257789A EP 04257789 A EP04257789 A EP 04257789A EP 1645862 A2 EP1645862 A2 EP 1645862A2
- Authority
- EP
- European Patent Office
- Prior art keywords
- vehicle
- angle
- nose
- turning
- test
- Prior art date
- Legal status (The legal status is an assumption and is not a legal conclusion. Google has not performed a legal analysis and makes no representation as to the accuracy of the status listed.)
- Granted
Links
Images


Classifications
-
- G—PHYSICS
- G01—MEASURING; TESTING
- G01M—TESTING STATIC OR DYNAMIC BALANCE OF MACHINES OR STRUCTURES; TESTING OF STRUCTURES OR APPARATUS, NOT OTHERWISE PROVIDED FOR
- G01M17/00—Testing of vehicles
- G01M17/007—Wheeled or endless-tracked vehicles
- G01M17/06—Steering behaviour; Rolling behaviour
-
- B—PERFORMING OPERATIONS; TRANSPORTING
- B60—VEHICLES IN GENERAL
- B60T—VEHICLE BRAKE CONTROL SYSTEMS OR PARTS THEREOF; BRAKE CONTROL SYSTEMS OR PARTS THEREOF, IN GENERAL; ARRANGEMENT OF BRAKING ELEMENTS ON VEHICLES IN GENERAL; PORTABLE DEVICES FOR PREVENTING UNWANTED MOVEMENT OF VEHICLES; VEHICLE MODIFICATIONS TO FACILITATE COOLING OF BRAKES
- B60T8/00—Arrangements for adjusting wheel-braking force to meet varying vehicular or ground-surface conditions, e.g. limiting or varying distribution of braking force
- B60T8/17—Using electrical or electronic regulation means to control braking
- B60T8/172—Determining control parameters used in the regulation, e.g. by calculations involving measured or detected parameters
-
- B—PERFORMING OPERATIONS; TRANSPORTING
- B60—VEHICLES IN GENERAL
- B60T—VEHICLE BRAKE CONTROL SYSTEMS OR PARTS THEREOF; BRAKE CONTROL SYSTEMS OR PARTS THEREOF, IN GENERAL; ARRANGEMENT OF BRAKING ELEMENTS ON VEHICLES IN GENERAL; PORTABLE DEVICES FOR PREVENTING UNWANTED MOVEMENT OF VEHICLES; VEHICLE MODIFICATIONS TO FACILITATE COOLING OF BRAKES
- B60T2270/00—Further aspects of brake control systems not otherwise provided for
- B60T2270/86—Optimizing braking by using ESP vehicle or tyre model
Definitions
- the present invention relates to a method for quantitatively analyzing steer characteristics to acquire steering stability of vehicles/tires, and more particularly to a method for quantitatively analyzing steer characteristics, which divides the steer characteristics into understeer, oversteer, and power-off reaction characteristics, separately analyzes the understeer, oversteer, and power-off reaction characteristics, analyzes the understeer characteristic using a turning curvature and a turning velocity in association with a vehicle turning path, analyzes the oversteer characteristic using a slope of a nose angle and a nose-angle time rate in association with a vehicle attitude, analyzes the power-off reaction characteristic using a nose-angle slope, a nose-angle change rate, and a nose-angle change amount, and compares the above-mentioned characteristics with reference data obtained from a Quasi steady-state condition test during which a vehicle driving state is stable, such that it can quantitatively determine the steer characteristics upon receipt of the result of the comparison.
- a representative method for estimating performance of a tire using a steady-state turn test, a lift-off test, a transient state test, an emergency lane change test, and an emergency J-turn test is described in United States Patent No. 6,580,980 filed by Gauthier et al, entitled “SYSTEM AND METHOD FOR TESTING DEFLATED TIRE HANDLING", which is incorporated herein by reference.
- the method of United States Patent No. 6,580,980 provides a method for quantitatively analyzing steering stability performance of a tire using both a subjective estimation method associated with individual test methods and an objective estimation method associated with measurement data.
- the last performance estimation in a vehicle/tire design process is performed by subjective assessment of an expert driver.
- many parts contained in a steering stability estimation process depend on the subjective assessment method, such that the subjective assessment result is reflected in all analysis methods.
- the above-mentioned methods of United States Patents Nos. 4,969,212 and 6,580,980 indicate the subjective assessment result of an expert estimator using basic parameters associated with vehicle movement, for example, lateral acceleration, yaw rate, and vehicle velocity parameters.
- an expert estimator prefers to perform the subjective assessment using perceptual parameters corresponding to individual assessment parameters, instead of using the above-mentioned basic vehicle movement parameters. Therefore, the above-mentioned methods have difficulty in substantially reflecting the subjective assessment result of the expert estimator in the vehicle/tire design process.
- the present invention has been made in view of the above problems, and it is an object of the invention to provide a real vehicle measurement test method for mounting a variety of sensors to a vehicle such that it can directly acquire data indicative of the movement of a real vehicle and the other data indicative of vehicle's driver information.
- the above-mentioned quantitative analysis method simultaneously performs the subjective assessment and the real vehicle measurement in association with steer characteristic parameters, or separately performs the subjective assessment and the real vehicle measurement, such that it can analyze the vehicle movement generated in the case of real subjective assessment along with driver information.
- steer characteristics under steady-state conditions such as a normal-circle turning test
- the present invention attempts to indicate such steer characteristics under transient turning conditions generated in the case of a vehicle lane change and a circuit running state.
- the subjective assessment of the steer characteristics are mainly estimated under the transient state such as a vehicle lane change or circuit cornering test, instead of a steady-state condition. Therefore, the present invention is characterized in that it can be directly applied to the vehicle/tire design process, such that it can be easily implemented with a real instrument.
- the method for quantitatively analyzing steer characteristics to acquire steering stability of a vehicle and a tire mounts a real-vehicle measurement device to a vehicle, performs a real-vehicle test for analyzing vehicle steer characteristics (e.g., understeer, oversteer, and power-off reaction) to acquire measurement data, calculates a turning curvature, a turning velocity, a nose angle, and a nose-angle time rate on the basis of the acquired measurement data, compares the turning curvature, the turning velocity, the nose angle, and the nose-angle time rate with a predetermined turning curvature, a predetermined turning velocity, and reference nose-angle data, respectively, such that it can determine a steer characteristic degree on the basis of the result of the comparison.
- vehicle steer characteristics e.g., understeer, oversteer, and power-off reaction
- the present invention classifies steer characteristics into three characteristics, i.e., an understeer characteristic, an oversteer characteristic, and a power-off reaction characteristic.
- the understeer and oversteer characteristics indicate the number of vehicle understeer occurrences and the number of vehicle oversteer occurrences, respectively.
- the power-off reaction characteristic indicates understeer and oversteer variation characteristics during a power on/off test in a vehicle turning operation.
- the present invention defines the steer characteristics as follows.
- Understeer is indicative of a specific phenomenon that a vehicle deviates from a designated path to the outside during a vehicle turning operation, and is closely associated with a front-wheel grip characteristic of a tire.
- the understeer mainly occurs when the front-wheel grip is very small.
- the subjective assessment associated with the degree of understeer is determined by special references of individual estimators.
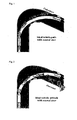
- Fig. 1 is a conceptual diagram illustrating an understeer phenomenon felt by a real driver.
- the vehicle In order to allow a vehicle to safely and rapidly pass a corner of Fig. 1, the vehicle must travel along an ideal path. In this case, if the vehicle has a high understeer characteristic, it is turned from the ideal path to the outside as shown in Fig. 1, resulting in an increased turning radius. In this case, a vehicle driver must enter a wider steering angle to induce the vehicle to turn along the ideal path. Therefore, heavy understeer impedes easier steering characteristics, such that the heavy understeer is not desirable. Indeed, a vehicle driver can estimate the degree of understeer by comparing a steering angle required during a vehicle turning operation and a vehicle turning behavior characteristic with reference data determined by the vehicle driver himself or herself.
- Fig. 2 is a conceptual diagram illustrating the oversteer phenomenon of a vehicle in the vehicle turning movement.
- the oversteer generates an unexpected large variation in a vehicle attitude indicative of an angle between a vehicle running direction and a real moving direction of a vehicle (i.e., a velocity vector direction).
- the higher the oversteer the larger the vehicle attitude angle.
- a general vehicle driver has difficulty in controlling heavy oversteer, such that the heavy oversteer is not desirable. Similar to understeer, the vehicle driver compares a vehicle attitude angle generated during the vehicle turning with a predetermined reference value, such that it can estimate the degree of oversteer.
- the power-off reaction is indicative of a variation in understeer/oversteer characteristics generated during the vehicle turning.
- the power-off reaction is estimated by a power on/off test during the vehicle turning as shown in Fig. 3.
- the mechanism for generating the variation in the above-mentioned understeer/oversteer characteristics is classified into first and second mechanisms.
- the first mechanism is generated by a tire grip variation caused by a full throttle ON operation generated when a vehicle is turned from a fixed steering state to a steady-state condition.
- the tire grip variation occurs at different locations according to vehicle drive methods.
- the second mechanism is generated by a tire grip variation caused by a throttle OFF operation suddenly generated in a constant steering state. If the sudden throttle OFF operation occurs during the vehicle turning movement, severe load transfer from a rear wheel to a front wheel occurs, such that an unexpected variation occurs in vertical load applied to a tire, resulting in a variation in tire grip. As the drive power disappears, a tire cornering force variation occurs, resulting in a variation in grip forces of a front-wheel tire and a rear-wheel tire. The vehicle driver recognizes the understeer and oversteer variations generated by the above-mentioned full throttle ON and sudden throttle OFF operations, and therefore estimates the power-off reaction characteristic.
- the vehicle driver estimates the degree of power-off reaction using a vehicle attitude associated with the oversteer phenomenon.
- the understeer phenomenon occurs in the full throttle ON condition, and the oversteer phenomenon occurs in the sudden throttle OFF condition.
- the less the variation from the understeer and the oversteer the easier the vehicle control operation, resulting in improved vehicle performance.
- an operation mode is switched from a power ON mode to a power OFF mode, a smaller variation in steer characteristics is more desirable.
- the present invention provides a real-vehicle test method for analyzing the above-mentioned steer characteristics.
- the present invention provides a variety of methods for analyzing the understeer and oversteer characteristics, for example, a lane-changing test method, a severe lane-changing method, and a circuit cornering test method, and a power on/off test method during the vehicle turning to analyze a power-off reaction.
- the lane-changing test according to the present invention is required for a specific situation that a vehicle changes from one lane to another to dodge an obstacle in the front.
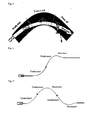
- the vehicle movement during the lane-changing includes two consecutive turns having opposite directions as shown in Fig. 4.
- the understeer tendency occurs in a lane-changing entry zone and a lane-changing mid-zone
- the oversteer tendency occurs in a lane-changing exit zone.
- the lane-changing test of the present invention is indicative of a first lane changing test.
- a lane-changing width is 2.5 ⁇ 4.5m
- a handle entry signal is a sinusoidal signal
- a handle entry angle is -180° ⁇ +180°
- vehicle speed is determined to be a constant speed in the range of 40 ⁇ 350 kph.
- the severe lane-changing test is used to dodge a front obstacle suddenly entered during the high-speed running of a vehicle as shown in Fig. 5, and returns to an original lane.
- the severe lane-changing test includes three consecutive turns as shown in Fig. 5.
- the understeer characteristic appears in a first turn and entry zones (i.e., initial zones) of second and third turns, and the oversteer characteristic appears in the exit zones of the second and third turns.
- a user enters a sinusoidal steering angle having an amplitude of 90° simultaneously with performing a throttle-off operation.
- the steering angle of the severe lane-changing test is larger than that of the lane-changing test, the vehicle movement becomes considerably severe or intense, and even worse, an unexpected problem occurs in rear-wheel stability.
- the above-mentioned severe lane-changing test is used to return to an original lane after changing a first lane of a vehicle to another lane.
- the severe lane-changing test turns off an acceleration paddle simultaneously with performing a handle entry operation while the vehicle travels straight on the assumption that a lane-changing width is 2.5 ⁇ 4.5m and vehicle speed is in the range of 60 ⁇ 200 kph.
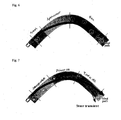
- Fig. 6 is a conceptual diagram illustrating a circuit cornering test method performed in a handling circuit.
- the circuit cornering test method is performed by a racing course running test, and can estimate understeer/oversteer tendencies in a corner entry zone and a corner exit zone.
- the understeer tendency occurs in the corner entry zone, and understeer and oversteer tendencies occur in the corner exit zone according to vehicle drive methods.
- the vehicle moves in a steady-state condition.
- Most racing vehicles are driven by a rear-wheel drive method. If a vehicle is accelerated in the corner exit zone, a cornering force applied to a rear wheel is decreased due to the occurrence of drive power at a rear tire, such that the steer characteristics is transitioned from the understeer to the oversteer.
- Fig. 7 is a conceptual diagram illustrating a method for estimating the steer characteristics using a power on/off test in a vehicle turning operation.
- the main purpose of the power on/off test in the vehicle turning operation is to guarantee vehicle stability caused by load transfer from a front wheel to a rear wheel when a sudden throttle change is applied to the vehicle turning operation.
- the degree of sensitivity of a vehicle behavior change in association with the above-mentioned load transfer from the front wheel to the rear wheel is subjectively evaluated by power-off reaction characteristics.
- the understeer tendency is increased.
- the understeer tendency is decreased, and even worse, the oversteer tendency occurs.
- the above-mentioned power on/off test in the vehicle turning operation is performed by suddenly pressing an acceleration paddle during the vehicle turning, maintaining the pressed acceleration paddle, and suddenly releasing the pressed acceleration paddle.
- an initial normal turning velocity is determined to be equal to or higher than lateral acceleration of 0.5g
- the pressed time (i.e., entry time) of the acceleration paddle is determined to be 1.0 ⁇ 5.0 seconds
- a maximum entry range i.e., a maximum entry displacement
- the acceleration paddle entry magnitude is determined in the range of 1/2 ⁇ 1.0 ratio associated with the value of A 0 .
- the degree of understeer can be represented using a turning radius, the value of R d is infinite when the vehicle travels straight, such that it is difficult to properly represent the degree of understeer.
- the degree of understeer is represented by comparing a vehicle turning curvature ⁇ d with a reference turning curvature ⁇ d(N) .
- the reference turning curvature is indicative of a turning curvature in the case where a vehicle indicates neutral steer performance.
- Equation 3 represents the degree of understeer using a moving path during the vehicle turning movement.
- the understeer analysis method indicates the reference turning curvature ⁇ d(N) and a turning curvature ⁇ d measured in the vicinity of either the driver's seat or the vehicle's center of gravity (i.e., a vehicle barycenter) during the real vehicle test on a Y-axis, uses a predetermined graph in which a time or a steering angle is determined to be an X-axis, calculates a difference in turning curvature using the turning curvature graph and the above equation 3, and analyzes the calculated difference in turning curvature.
- a turning velocity ⁇ d must be properly generated.
- a reference turning velocity generated when the vehicle smoothly passes the given path is ⁇ d(N)
- a vehicle driver may feel neutral steer. If the turning velocity ⁇ d generated during the vehicle turning movement is less than a reference value ⁇ d(N) , the vehicle deviates from a reference turning path to the outside, such that the vehicle driver feels understeer.
- the understeer analysis method indicates the reference turning reference velocity ⁇ d(N) and the turning velocity ⁇ d measured during the real vehicle test on a Y-axis, uses a predetermined graph in which a time or a steering angle is determined to be an X-axis, calculates a difference in turning velocity using the turning velocity graph and the above equation 4, and analyzes the calculated difference in turning velocity.
- w us1 ⁇ 0 and w us2 ⁇ 0 are indicative of understeer weighting factors.
- the above-mentioned understeer weighting factors are determined by an expert estimator or a test condition.
- the understeer coefficient (US) is determined by the above equation 5 using the turning curvature difference and the turning velocity difference.
- the turning curvature difference ⁇ k d and the turning velocity difference ⁇ d are quantitatively analyzed by selecting a maximum value or a mean value from the turning curvature graph and the turning velocity graph obtained by the real vehicle test.
- the subjective assessment of an expert driver in association with oversteer is mainly affected by a vehicle attitude as shown in Fig. 9.
- the oversteer is indicative of a specific phenomenon that more slip occurs at a rear wheel due to insufficient rear wheel grip generated during the vehicle turning movement.
- the oversteer phenomenon can be explained by a nose angle indicative of a predetermined angle between a vehicle turning direction and a real moving direction of a vehicle.
- Equation 8 ]
- the oversteer analysis method indicates a reference nose angle ⁇ d ( N ) and a nose angle ⁇ d measured during the real vehicle test on a Y-axis, uses a predetermined graph in which a time or a steering angle is determined to be an X-axis, calculates a difference in nose angle using the nose angle graph and the above equation 8, and analyzes the calculated difference in nose angle.
- the oversteer analysis method indicates a nose-angle time rate measured during the real vehicle test on a Y-axis, uses a predetermined graph in which a time or a steering angle is determined to be an X-axis, calculates a difference in nose angle using the nose-angle time rate graph and the above equation 9, and analyzes the calculated difference in nose-angle time rate.
- An Oversteer Coefficient (OS) indicative of the oversteer tendency can be represented by the following equation 10 using the values ⁇ ⁇ d , and ⁇ d of the above equations 8 and 9. [ Equation 10 ] OS ⁇ w os 1 ⁇ ⁇ d + w os 2 ⁇ ⁇ ⁇ d > 0
- the oversteer coefficient (OS) is determined by the above equation 10 using the nose angle difference ⁇ ⁇ d and the nose-angle time rate difference ⁇ d .
- the nose angle difference ⁇ d and the nose-angle time rate difference ⁇ d are quantitatively analyzed by selecting a maximum value or a mean value from the nose angle graph and the nose-angle time rate graph obtained by the real vehicle test.
- a vehicle performs a throttle ON operation while being transitioned to a steady-state condition as shown in Fig. 10, the understeer tendency generally occurs. Then, if the vehicle performs a throttle OFF operation, load transfer from the front wheel to the rear wheel occurs, such that tire grip applied to the rear-wheel tire is decreased, resulting in the occurrence of oversteer.
- a power-off reaction is indicative of steer characteristics change from understeer to oversteer when an external command is applied from a throttle or a brake to the vehicle during the vehicle turning movement.
- the power-off reaction characteristic felt by the expert driver may be closely associated with the value of ⁇ d as shown in Fig. 10.
- the present invention defines the power-off reaction coefficient (PR) as the following equation 11 using the value of ⁇ d : [ Equation 11 ] PR ⁇ w pr 1
- w pr1 ⁇ 0 , w pr2 ⁇ 0 and w pr3 ⁇ 0 are indicative of power-off reaction weighting factors.
- the above-mentioned power-off reaction weighting factors are determined by an expert estimator or a test condition.
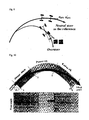
- is indicative of a slope of a nose angle as shown in Fig. 20.
- / ⁇ t is indicative of a nose-angle time rate, and is equal to a calculation value generated by dividing a difference between the value of ⁇ d in a steady-state condition and a maximum value ⁇ d generated in a power on/off test by the value of ⁇ t as shown, in Fig. 20.
- is indicative of a nose-angle change amount, and is equal to the magnitude of a maximum variation of the value of ⁇ d generated in the power on/off test.
- power-off reaction characteristics felt by a vehicle driver such that the power-off reaction characteristic is analyzed using the above-mentioned three factors.
- the power-off reaction analysis method based on the above equation 11 indicates the nose angle ⁇ d. on a Y-axis, quantitatively calculates a nose-angle slope
- the value of PR is indicative of the degree of a vehicle nose-angle change during the power on/off test in the vehicle turning operation.
- the degree of the nose-angle change is small and the nose-angle variation smoothly occurs, the movement of the vehicle is stable, resulting in improved vehicle performance.
- the present invention uses a variety of test methods for slowly entering a steering angle to prevent the occurrence of transient characteristics of the vehicle such that reference data is extracted, for example, a normal circle-turning test method, a weave steering test method, and a progressive steering test method:
- the normal circle-turning test uses a test method for changing a turning radius at a constant vehicle speed.
- the vehicle speed is determined in the range of 40 ⁇ 350 kph for use in a real vehicle estimation test, and a turning radius is determined in the range of 10 ⁇ 200m so that a handle entry range is determined to be -360° ⁇ +360°.
- the progressive steering test separately performs a left-side turning test and a right-side turning test at a predetermined vehicle speed, and uses the results as reference data. Otherwise, the progressive steering test performs the left-side and right-side turning tests, adds left data and right data, and uses the added result as reference data.
- the handle entry range is in the range from -360° to +360°, and includes reference data associated with an area having a large steering angle.
- a handle entry speed is determined to be a low value of 1 ⁇ 50 degrees/s.
- the vehicle speed is determined in the range of 40 ⁇ 350kph for use in a real vehicle estimation test.
- the reference turning curvature, the turning velocity, and the nose angle are fit to a curve (also called a curve-fitting process) using a steering angle function, such that they can be represented as shown in Fig. 11.
- test methods for analyzing the steer characteristics have been described as mentioned above. For example, a lane-changing test, a severe lane-changing test, a circuit cornering test, a power on/off reaction during the vehicle turning, and a plurality of analysis factors (e.g., US, OS, PR) have been described.
- analysis factors e.g., US, OS, PR
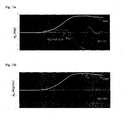
- Figs. 12a ⁇ 12b are graphs illustrating the understeer analysis method for use in a lane-changing test.
- a reference turning curvature ⁇ d(N) and a turning curvature ⁇ d measured during a lane-changing test are indicated on a Y-axis, and a specific graph in which time is determined to be an X-axis is shown in Fig. 12a.
- the values of ⁇ d and ⁇ d(N) of a first turning of the lane-changing entry zone are compared with those of a second turning of the lane-changing mid-zone.
- is less than the value of
- the value ⁇ d is calculated by substituting the values of ⁇ d and ⁇ d(N) into the above equation 3, and the value ⁇ d is calculated by substituting the values of ⁇ d and ⁇ d(N) into the above equation 4.
- the value of US associated with two zones can be calculated by substituting the values of ⁇ d and ⁇ d into equation 5.
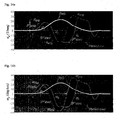
- Figs. 13a ⁇ 13b illustrate the oversteer analysis method for use in a lane-changing test.
- a reference nose angle ⁇ d(N) and a nose angle ⁇ d measured during a lane-changing test are indicated on a Y-axis, and a specific graph in which time is determined to be an X-axis is shown in Fig. 13a.
- is higher than the value of
- the value ⁇ d is calculated by substituting the values of ⁇ d and ⁇ d(N) into the above equation 8, and the value ⁇ d is calculated by substituting the value of ⁇ d into the above equation 9.
- the value of OS can be calculated by substituting the values of ⁇ d and ⁇ ⁇ d into equation 10.
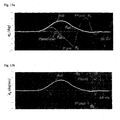
- Figs. 14a ⁇ 14b are graphs illustrating an understeer analysis method for use in a severe lane-changing test.
- a reference turning curvature ⁇ d(N) and a turning curvature ⁇ d measured during a severe lane-changing test are indicated on a Y-axis, and a specific graph in which time is determined to be an X-axis is shown in Fig. 14a.
- the values of ⁇ d and ⁇ d(N) in an entry zone of the first turning zone is compared with those in individual entry zones of the second and third turning zones.
- is less than the value of
- the value ⁇ d is calculated by substituting the values of ⁇ d and ⁇ d(N ) into the above equation 3, and the value ⁇ d is calculated by substituting the values of ⁇ d and ⁇ d(N) into the above equation 4.
- the value of US associated with three zones can be calculated by substituting the values of ⁇ d and ⁇ d into equation 5.
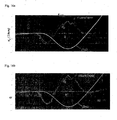
- Figs. 15a ⁇ 15b are graphs illustrating an oversteer analysis method for use in a severe lane-changing test.
- a reference nose angle ⁇ d ( N ) and a nose angle ⁇ d measured during a severe lane-changing test are indicated on a Y-axis, and a specific graph in which time is determined to be an X-axis is shown in Fig. 15a.
- is higher than the value of
- is greatly increased in the exit zones of the second and third turning zones during the severe lane-changing test.
- the value ⁇ d is calculated by substituting the values of ⁇ d and ⁇ d(N) into the above equation 8, and the value ⁇ d is calculated by substituting the value of ⁇ d into the above equation 9.
- the value of OS associated with two zones can be calculated by substituting the values of ⁇ d and ⁇ d into equation 10.
- is less than the value of
- the value ⁇ d is calculated by substituting the values of ⁇ d and ⁇ d(N) into the above equation 3, and the value ⁇ d is calculated by substituting the values of ⁇ d and ⁇ d(N) into the above equation 4.
- the value of US can be calculated by substituting the values of ⁇ d and ⁇ d into equation 5.
- Figs. 17a ⁇ 17b are graphs illustrating an oversteer analysis method for use in a circuit cornering test.
- a reference nose angle ⁇ d(N) and a nose angle ⁇ d measured during a circuit cornering test are indicated on a Y-axis, and a specific graph in which time is determined to be an X-axis is shown in Fig. 17a.
- is higher than the value of
- the value ⁇ d is calculated by substituting the values of ⁇ d and ⁇ d(N) into the above equation 8, and the value ⁇ d is calculated by substituting the value of ⁇ d into the above equation 8.
- the value of OS associated with two zones can be calculated by substituting the values of ⁇ d and ⁇ d into equation 10.
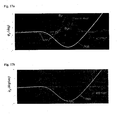
- Fig. 18 is a graph illustrating an understeer analysis method for use in a power on/off test in a vehicle turning operation.
- a reference turning curvature ⁇ d(N) and a turning curvature ⁇ d measured during the power on/off test in the vehicle turning operation are indicated on a Y-axis, and a specific graph in which time is determined to be an X-axis is shown in Fig. 18.
- is less than the value of
- is less than the value of
- the value ⁇ d is calculated by substituting the values of ⁇ d and ⁇ d(N) into the above equation 3, and the value ⁇ ⁇ d is calculated by substituting the values of ⁇ d and ⁇ d(N) into the above equation 4.
- the value of US associated with three zones can be calculated by substituting the values of ⁇ d and ⁇ ⁇ d into equation 5.
- Fig. 19 is a graph illustrating an oversteer analysis method for use in a power on/off test in the vehicle turning, operation.
- a reference nose angle ⁇ d(N) and a nose angle ⁇ d measured during the power on/off test in the vehicle turning operation are indicated on a Y-axis, and a specific graph in which time is determined to be an X-axis is shown in Fig. 19.
- is higher than the value of
- the value ⁇ d is calculated by substituting the values of ⁇ d and ⁇ d(N) into the above equation 8, and the value ⁇ d is calculated by substituting the value of ⁇ d into the above equation 9.
- the value of OS associated with two zones can be calculated by substituting the values of ⁇ ⁇ d and ⁇ ⁇ d into equation 10.
- Fig. 20 is a graph illustrating a power-off reaction analysis method for use in the power on/off test in the vehicle turning operation.
- a nose angle ⁇ d is indicated on a Y-axis, and a specific graph in which time is determined to be an X-axis is shown in Fig. 20.
- a nose-angle slope ⁇ d_slope, a nose-angle change rate ⁇ d_pp / ⁇ t, and a nose-angle change amount ⁇ d _ pp are calculated using the graph shown in Fig. 20, and the calculated values ⁇ d_slope , ⁇ d_pp / ⁇ t, and ⁇ d_pp are applied to the above equation 11, such that the value of PR can be calculated.
- the test of the group 3 is indicative of a test for changing design parameters of the tire to others in the rear-wheel drive vehicle.
- the test of the set 2 is performed.
- the set 2 performs a test associated with three drivers (i.e., a driver 1, a driver 2, and a driver 3).
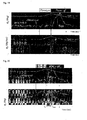
- the following table 2 shows an understeer analysis method proposed by the present invention.
- the understeer analysis results of the lane-changing test, the severe lane-changing test, the circuit cornering test, and the power on/off test in a vehicle turning operation using the above equations 3, 4, and 5, the subjective assessment result, and the correlation are shown in the following table 2.
- R 2 the higher the subjective assessment and correlation.
- the US coefficient denoted by the above equation 5 can select one of two factors (i.e., a turning curvature and a turning velocity associated with understeer). In this case, the selected factor has a higher correlation with the subjective assessment result as compared to the other factor.
- the following table 3 shows an oversteer analysis method proposed by the present invention.
- the oversteer analysis results of the lane-changing test, the severe lane-changing test, the circuit cornering test, and the power on/off test in a vehicle turning operation using the above equations 8, 9, and 10, the subjective assessment result, and the correlation are shown in the following table 3. It can be recognized that the value of OS has a high correlation degree of 0.9 and over in most tests.
- the OS coefficient denoted by the above equation 10 can select one of two factors (i.e., a nose angle and a nose-angle time rate associated with oversteer). In this case, the selected factor has a higher correlation with the subjective assessment result as compared to the other factor.
- the following table shows a power-off reaction analysis method of the present invention.
- the power-off reaction analysis result of the power on/off test in a vehicle turing operation using the above equation 11, the subjective assessment result, and the correlation are shown in the following table 4. It can be recognized that the value of PR has a high correlation degree of 0.9 and over in most tests.
- the power-off reaction coefficient of the above equation 11 includes nose-angle associated data corresponding to a nose angle change amount, for example, a nose-angle slope, a change rate, and a change amount, such that it can increase a correlation degree associated with the subjective assessment.
Landscapes
- Engineering & Computer Science (AREA)
- Physics & Mathematics (AREA)
- General Physics & Mathematics (AREA)
- Transportation (AREA)
- Mechanical Engineering (AREA)
- Steering Control In Accordance With Driving Conditions (AREA)
- Tires In General (AREA)
- Control Of Driving Devices And Active Controlling Of Vehicle (AREA)
Applications Claiming Priority (1)
| Application Number | Priority Date | Filing Date | Title |
|---|---|---|---|
| KR1020040079024A KR100599662B1 (ko) | 2004-10-05 | 2004-10-05 | 차량/타이어의 조종안정성을 위한 스티어 특성의 정량적인분석방법 |
Publications (3)
| Publication Number | Publication Date |
|---|---|
| EP1645862A2 true EP1645862A2 (de) | 2006-04-12 |
| EP1645862A3 EP1645862A3 (de) | 2006-12-20 |
| EP1645862B1 EP1645862B1 (de) | 2008-09-24 |
Family
ID=36126599
Family Applications (1)
| Application Number | Title | Priority Date | Filing Date |
|---|---|---|---|
| EP04257789A Expired - Lifetime EP1645862B1 (de) | 2004-10-05 | 2004-12-15 | Verfahren zur quantitativen Analyse der Lenkungscharacteristik zur Ermittlung der Lenkungsstabilität von Fahrzeugen/Reifen |
Country Status (6)
| Country | Link |
|---|---|
| US (1) | US7142961B2 (de) |
| EP (1) | EP1645862B1 (de) |
| JP (1) | JP4119887B2 (de) |
| KR (1) | KR100599662B1 (de) |
| CN (1) | CN100562735C (de) |
| DE (1) | DE602004016750D1 (de) |
Families Citing this family (30)
| Publication number | Priority date | Publication date | Assignee | Title |
|---|---|---|---|---|
| US7892078B2 (en) * | 2005-12-30 | 2011-02-22 | Microsoft Corporation | Racing line optimization |
| US20080004763A1 (en) * | 2006-06-30 | 2008-01-03 | Caterpillar Inc. | Method and system for preventing excessive tire wear on machines |
| FR2918749B1 (fr) * | 2007-07-12 | 2009-10-09 | Michelin Soc Tech | Procede d'evaluation de l'adherence transversale d'un pneu sur un sol enneige |
| CZ306973B6 (cs) * | 2009-05-26 | 2017-10-25 | České Vysoké Učení Technické V Praze, Fakulta Dopravní, Ústav Dopravní Techniky | Způsob kontroly stability vozidla, zejména užitkového, a systém k provádění tohoto způsobu |
| US9053394B2 (en) | 2011-08-30 | 2015-06-09 | 5D Robotics, Inc. | Vehicle management system |
| CN103287267B (zh) * | 2012-03-02 | 2016-05-18 | 北京四维图新科技股份有限公司 | 基于超高信息的辅助驾驶的方法及装置 |
| KR101389289B1 (ko) * | 2012-10-09 | 2014-04-25 | 한국타이어 주식회사 | 자동차의 타이어 그립과 균형감의 정량적 평가방법 |
| JP2015017876A (ja) * | 2013-07-10 | 2015-01-29 | 住友ゴム工業株式会社 | タイヤの操縦安定性能評価方法 |
| KR101701046B1 (ko) * | 2015-06-12 | 2017-02-13 | 주식회사 만도 | 전자 제어 장치 및 전자 제어 시스템 |
| JP2017161477A (ja) * | 2016-03-11 | 2017-09-14 | 株式会社ブリヂストン | タイヤ荷重推定方法及びタイヤ荷重推定装置 |
| CN106248392B (zh) * | 2016-07-28 | 2020-01-21 | 百度在线网络技术(北京)有限公司 | 一种无人车变道时间的测试方法及装置 |
| US10124807B2 (en) * | 2017-01-23 | 2018-11-13 | GM Global Technology Operations LLC | Systems and methods for classifying driver skill level and handling type |
| US10315565B2 (en) * | 2017-02-23 | 2019-06-11 | Modular Mining Systems, Inc. | Vehicle slide detection |
| US10977946B2 (en) * | 2017-10-19 | 2021-04-13 | Veoneer Us, Inc. | Vehicle lane change assist improvements |
| WO2019167264A1 (en) * | 2018-03-02 | 2019-09-06 | Volvo Truck Corporation | Device, method, and program for tire failure detection, and computer-readable recording medium recording tire failure detection program |
| CN109002040A (zh) * | 2018-08-07 | 2018-12-14 | 湖北汽车工业学院 | 车辆自动控制方法、装置及计算机可读存储介质 |
| CN110018000B (zh) * | 2019-04-17 | 2021-09-10 | 赛轮集团股份有限公司 | 一种乘用车子午线轮胎转向性能检测方法 |
| CN110375991B (zh) * | 2019-06-19 | 2021-10-08 | 山东省科学院自动化研究所 | 一种针对自动驾驶车辆换道能力的测试道路、系统及方法 |
| CN110411765A (zh) * | 2019-08-28 | 2019-11-05 | 南阳理工学院 | 汽车转向性能检测装置 |
| CN110606080B (zh) * | 2019-09-10 | 2021-11-23 | 北京汽车股份有限公司 | 车辆及其控制方法、装置 |
| CN110864916A (zh) * | 2019-12-10 | 2020-03-06 | 宝能汽车有限公司 | 车辆稳定性能的测试方法、测试系统 |
| KR102247009B1 (ko) * | 2020-02-10 | 2021-05-03 | 넥센타이어 주식회사 | 타이어의 거동 안정성 시험 방법 및 시험 장치 |
| US11325596B2 (en) * | 2020-06-10 | 2022-05-10 | Toyota Motor Engineering & Manufacturing North America, Inc. | Electronic stability management for oversteer engagement based on sensor data |
| CN113859240B (zh) | 2020-06-30 | 2024-03-08 | 现代摩比斯株式会社 | 车道变换辅助系统和使用该系统的车道变换方法 |
| CN112195695B (zh) * | 2020-09-27 | 2022-03-22 | 四川紫荆花开智能网联汽车科技有限公司 | 一种智能网联汽车动态封闭测试系统 |
| CN112308454B (zh) * | 2020-11-19 | 2024-06-21 | 安徽江淮汽车集团股份有限公司 | 汽车操纵稳定性评价方法、装置、设备及存储介质 |
| CN113432893A (zh) * | 2021-06-08 | 2021-09-24 | 上海大学 | 一种履带式车辆转向性能的测试方法 |
| FR3125265B1 (fr) * | 2021-07-15 | 2024-04-12 | Renault Sas | procédé et dispositif de contrôle de la trajectoire d’un véhicule automobile circulant sur une voie de circulation et véhicule associé |
| CN116183253B (zh) * | 2023-04-23 | 2023-06-30 | 江西行新汽车科技股份有限公司 | 一种方向盘的转向测试方法及转向测试系统 |
| CN116573042B (zh) * | 2023-05-23 | 2025-10-21 | 重庆长安汽车股份有限公司 | 车辆转向控制方法、装置及车辆 |
Family Cites Families (12)
| Publication number | Priority date | Publication date | Assignee | Title |
|---|---|---|---|---|
| US4969212A (en) * | 1989-02-01 | 1990-11-06 | The Goodyear Tire & Rubber Company | Quantitative measurement of handling characteristics of tires and/or vehicle/tire combinations |
| CN2139698Y (zh) * | 1992-10-07 | 1993-08-04 | 林武 | 汽车转向检测仪 |
| JP3340038B2 (ja) * | 1996-11-14 | 2002-10-28 | 本田技研工業株式会社 | 左右輪駆動力配分装置 |
| JP3348397B2 (ja) * | 1997-07-17 | 2002-11-20 | 本田技研工業株式会社 | 車両の旋回制御機構の検査方法 |
| JP2002214083A (ja) | 2001-01-17 | 2002-07-31 | Mazda Motor Corp | 車両の操安性評価装置、操安性評価プログラムを記録した記録媒体、及び操安性評価方法 |
| DE10128690A1 (de) * | 2001-06-13 | 2002-12-19 | Continental Teves Ag & Co Ohg | Verfahren zur Regelung der Fahrstabilität |
| JP2003132098A (ja) | 2001-10-29 | 2003-05-09 | Mazda Motor Corp | 操縦安定性の設計支援方法及び設計支援プログラム |
| US6466857B1 (en) * | 2001-12-05 | 2002-10-15 | Delphi Technologies, Inc. | Drive wheel traction control during vehicle stability enhancement events |
| US6580980B1 (en) * | 2002-03-05 | 2003-06-17 | Michelin Recherche Et Technique S.A. | System and method for testing deflated tire handling |
| JP2004037220A (ja) | 2002-07-03 | 2004-02-05 | Mazda Motor Corp | 車両の操縦安定性評価装置、車両の操縦安定性評価方法、及び、車両の操縦安定性評価用プログラム |
| KR20040040796A (ko) * | 2002-11-08 | 2004-05-13 | 기아자동차주식회사 | 퍼지 조향각 제어 알고리즘을 이용한 차량의 조종 안정성해석 방법 |
| JP2004219338A (ja) | 2003-01-17 | 2004-08-05 | Mazda Motor Corp | 車両の操縦安定性評価装置及び車両の操縦安定性評価方法 |
-
2004
- 2004-10-05 KR KR1020040079024A patent/KR100599662B1/ko not_active Expired - Fee Related
- 2004-12-15 EP EP04257789A patent/EP1645862B1/de not_active Expired - Lifetime
- 2004-12-15 DE DE602004016750T patent/DE602004016750D1/de not_active Expired - Lifetime
- 2004-12-16 JP JP2004382686A patent/JP4119887B2/ja not_active Expired - Fee Related
- 2004-12-17 CN CNB2004101012426A patent/CN100562735C/zh not_active Expired - Fee Related
- 2004-12-17 US US11/015,931 patent/US7142961B2/en not_active Expired - Fee Related
Also Published As
| Publication number | Publication date |
|---|---|
| DE602004016750D1 (de) | 2008-11-06 |
| CN100562735C (zh) | 2009-11-25 |
| EP1645862A3 (de) | 2006-12-20 |
| US20060074535A1 (en) | 2006-04-06 |
| KR20060030229A (ko) | 2006-04-10 |
| US7142961B2 (en) | 2006-11-28 |
| JP2006105954A (ja) | 2006-04-20 |
| JP4119887B2 (ja) | 2008-07-16 |
| CN1758046A (zh) | 2006-04-12 |
| EP1645862B1 (de) | 2008-09-24 |
| KR100599662B1 (ko) | 2006-07-12 |
Similar Documents
| Publication | Publication Date | Title |
|---|---|---|
| EP1645862A2 (de) | Verfahren zur quantitativen Analyse der Lenkungscharacteristik zur Ermittlung der Lenkungsstabilität von Fahrzeugen/Reifen | |
| KR100355918B1 (ko) | 차체 롤링 상태 평가 장치 | |
| US8370038B2 (en) | Vehicle subsystem control method and apparatus | |
| JP3150893B2 (ja) | タイヤ識別方法および装置 | |
| US6842683B2 (en) | Method of controlling traveling stability of vehicle | |
| EP1407949B1 (de) | Fahrbahnzustandserfassungsvorrichtung und diese Vorrichtung benutzendes Fahrzeugsteuerungssystem | |
| US6202009B1 (en) | Method for detecting fault of vehicle motion sensors | |
| JP5295300B2 (ja) | 運転者状態検出方法及び運転者状態検出システム | |
| US8589025B2 (en) | Tire cornering power on-board estimation and monitoring using steering moment | |
| EP1510428B1 (de) | Vorrichtung zur Schätzung des Reibwertes von Strassenoberflächen | |
| CN101405176A (zh) | 对驾驶方式敏感的车辆子系统控制方法和装置 | |
| JP3061459B2 (ja) | ドライバーの異常操舵判定装置 | |
| US20070016354A1 (en) | Method and device for determining a friction value representing frictions acting between a road and vehicle tires | |
| US11772679B2 (en) | Steer control logic for emergency handling of autonomous vehicles | |
| JP2008265545A (ja) | 車両の重心位置推定装置及び重心位置/ヨー慣性モーメント推定装置。 | |
| Maeda et al. | Performance of driver-vehicle system in emergency avoidance | |
| US20100131141A1 (en) | Bank angle estimation via vehicle lateral velocity with force tables | |
| EP3699804A2 (de) | Reifenmodellbestimmungsverfahren, verfahren zur berechnung von daten zum dynamischen reifenverhalten, reifenbeurteilungsverfahren und reifenkonstruktionsverfahren | |
| JP3748334B2 (ja) | 車両の姿勢制御装置 | |
| EP1760451A1 (de) | Vorrichtung und Verfahren zur Bestimmung des Reibwerts einer Strassenoberfläche | |
| JP2012212379A (ja) | 運転者状態検出システム及び運転者状態検出方法 | |
| JP3919908B2 (ja) | 運転者の運転特性決定装置 | |
| Freeman et al. | Run-off-road and recovery–state estimation and vehicle control strategies | |
| Bergman | Considerations in determining vehicle handling requirements | |
| KR102948475B1 (ko) | 차량의 조향 제어 방법 및 시스템 |
Legal Events
| Date | Code | Title | Description |
|---|---|---|---|
| PUAI | Public reference made under article 153(3) epc to a published international application that has entered the european phase |
Free format text: ORIGINAL CODE: 0009012 |
|
| AK | Designated contracting states |
Kind code of ref document: A2 Designated state(s): AT BE BG CH CY CZ DE DK EE ES FI FR GB GR HU IE IS IT LI LT LU MC NL PL PT RO SE SI SK TR |
|
| AX | Request for extension of the european patent |
Extension state: AL BA HR LV MK YU |
|
| PUAL | Search report despatched |
Free format text: ORIGINAL CODE: 0009013 |
|
| AK | Designated contracting states |
Kind code of ref document: A3 Designated state(s): AT BE BG CH CY CZ DE DK EE ES FI FR GB GR HU IE IS IT LI LT LU MC NL PL PT RO SE SI SK TR |
|
| AX | Request for extension of the european patent |
Extension state: AL BA HR LV MK YU |
|
| 17P | Request for examination filed |
Effective date: 20070611 |
|
| 17Q | First examination report despatched |
Effective date: 20070704 |
|
| AKX | Designation fees paid |
Designated state(s): DE FR GB IT |
|
| GRAP | Despatch of communication of intention to grant a patent |
Free format text: ORIGINAL CODE: EPIDOSNIGR1 |
|
| GRAS | Grant fee paid |
Free format text: ORIGINAL CODE: EPIDOSNIGR3 |
|
| GRAA | (expected) grant |
Free format text: ORIGINAL CODE: 0009210 |
|
| AK | Designated contracting states |
Kind code of ref document: B1 Designated state(s): DE FR GB IT |
|
| REG | Reference to a national code |
Ref country code: GB Ref legal event code: FG4D |
|
| REF | Corresponds to: |
Ref document number: 602004016750 Country of ref document: DE Date of ref document: 20081106 Kind code of ref document: P |
|
| PLBE | No opposition filed within time limit |
Free format text: ORIGINAL CODE: 0009261 |
|
| STAA | Information on the status of an ep patent application or granted ep patent |
Free format text: STATUS: NO OPPOSITION FILED WITHIN TIME LIMIT |
|
| 26N | No opposition filed |
Effective date: 20090625 |
|
| PGFP | Annual fee paid to national office [announced via postgrant information from national office to epo] |
Ref country code: FR Payment date: 20130912 Year of fee payment: 10 |
|
| PGFP | Annual fee paid to national office [announced via postgrant information from national office to epo] |
Ref country code: IT Payment date: 20130912 Year of fee payment: 10 |
|
| PGFP | Annual fee paid to national office [announced via postgrant information from national office to epo] |
Ref country code: GB Payment date: 20131011 Year of fee payment: 10 Ref country code: DE Payment date: 20130912 Year of fee payment: 10 |
|
| REG | Reference to a national code |
Ref country code: DE Ref legal event code: R119 Ref document number: 602004016750 Country of ref document: DE |
|
| GBPC | Gb: european patent ceased through non-payment of renewal fee |
Effective date: 20141215 |
|
| REG | Reference to a national code |
Ref country code: FR Ref legal event code: ST Effective date: 20150831 |
|
| PG25 | Lapsed in a contracting state [announced via postgrant information from national office to epo] |
Ref country code: GB Free format text: LAPSE BECAUSE OF NON-PAYMENT OF DUE FEES Effective date: 20141215 Ref country code: DE Free format text: LAPSE BECAUSE OF NON-PAYMENT OF DUE FEES Effective date: 20150701 |
|
| PG25 | Lapsed in a contracting state [announced via postgrant information from national office to epo] |
Ref country code: FR Free format text: LAPSE BECAUSE OF NON-PAYMENT OF DUE FEES Effective date: 20141231 |
|
| PG25 | Lapsed in a contracting state [announced via postgrant information from national office to epo] |
Ref country code: IT Free format text: LAPSE BECAUSE OF NON-PAYMENT OF DUE FEES Effective date: 20141215 |