EP1452136B1 - Optical device for measuring cerebral function - Google Patents
Optical device for measuring cerebral function Download PDFInfo
- Publication number
- EP1452136B1 EP1452136B1 EP04001443A EP04001443A EP1452136B1 EP 1452136 B1 EP1452136 B1 EP 1452136B1 EP 04001443 A EP04001443 A EP 04001443A EP 04001443 A EP04001443 A EP 04001443A EP 1452136 B1 EP1452136 B1 EP 1452136B1
- Authority
- EP
- European Patent Office
- Prior art keywords
- stimulus
- signal
- body movement
- time
- light
- Prior art date
- Legal status (The legal status is an assumption and is not a legal conclusion. Google has not performed a legal analysis and makes no representation as to the accuracy of the status listed.)
- Expired - Lifetime
Links
Images


Classifications
-
- A—HUMAN NECESSITIES
- A61—MEDICAL OR VETERINARY SCIENCE; HYGIENE
- A61B—DIAGNOSIS; SURGERY; IDENTIFICATION
- A61B5/00—Measuring for diagnostic purposes; Identification of persons
- A61B5/72—Signal processing specially adapted for physiological signals or for diagnostic purposes
- A61B5/7203—Signal processing specially adapted for physiological signals or for diagnostic purposes for noise prevention, reduction or removal
- A61B5/7207—Signal processing specially adapted for physiological signals or for diagnostic purposes for noise prevention, reduction or removal of noise induced by motion artifacts
-
- A—HUMAN NECESSITIES
- A61—MEDICAL OR VETERINARY SCIENCE; HYGIENE
- A61B—DIAGNOSIS; SURGERY; IDENTIFICATION
- A61B5/00—Measuring for diagnostic purposes; Identification of persons
- A61B5/02—Detecting, measuring or recording for evaluating the cardiovascular system, e.g. pulse, heart rate, blood pressure or blood flow
- A61B5/026—Measuring blood flow
- A61B5/0261—Measuring blood flow using optical means, e.g. infrared light
-
- A—HUMAN NECESSITIES
- A61—MEDICAL OR VETERINARY SCIENCE; HYGIENE
- A61B—DIAGNOSIS; SURGERY; IDENTIFICATION
- A61B5/00—Measuring for diagnostic purposes; Identification of persons
- A61B5/145—Measuring characteristics of blood in vivo, e.g. gas concentration or pH-value ; Measuring characteristics of body fluids or tissues, e.g. interstitial fluid or cerebral tissue
- A61B5/1455—Measuring characteristics of blood in vivo, e.g. gas concentration or pH-value ; Measuring characteristics of body fluids or tissues, e.g. interstitial fluid or cerebral tissue using optical sensors, e.g. spectral photometrical oximeters
- A61B5/14551—Measuring characteristics of blood in vivo, e.g. gas concentration or pH-value ; Measuring characteristics of body fluids or tissues, e.g. interstitial fluid or cerebral tissue using optical sensors, e.g. spectral photometrical oximeters for measuring blood gases
- A61B5/14553—Measuring characteristics of blood in vivo, e.g. gas concentration or pH-value ; Measuring characteristics of body fluids or tissues, e.g. interstitial fluid or cerebral tissue using optical sensors, e.g. spectral photometrical oximeters for measuring blood gases specially adapted for cerebral tissue
-
- A—HUMAN NECESSITIES
- A61—MEDICAL OR VETERINARY SCIENCE; HYGIENE
- A61B—DIAGNOSIS; SURGERY; IDENTIFICATION
- A61B5/00—Measuring for diagnostic purposes; Identification of persons
- A61B5/16—Devices for psychotechnics; Testing reaction times ; Devices for evaluating the psychological state
-
- A—HUMAN NECESSITIES
- A61—MEDICAL OR VETERINARY SCIENCE; HYGIENE
- A61B—DIAGNOSIS; SURGERY; IDENTIFICATION
- A61B2562/00—Details of sensors; Constructional details of sensor housings or probes; Accessories for sensors
- A61B2562/02—Details of sensors specially adapted for in-vivo measurements
- A61B2562/0233—Special features of optical sensors or probes classified in A61B5/00
-
- A—HUMAN NECESSITIES
- A61—MEDICAL OR VETERINARY SCIENCE; HYGIENE
- A61B—DIAGNOSIS; SURGERY; IDENTIFICATION
- A61B2562/00—Details of sensors; Constructional details of sensor housings or probes; Accessories for sensors
- A61B2562/04—Arrangements of multiple sensors of the same type
- A61B2562/046—Arrangements of multiple sensors of the same type in a matrix array
Definitions
- the present invention relates to a device for measuring human cerebral function without affecting it.
- Patent Document 1 Japanese Patent Laid-Open No. 115232/1982 , or Patent Document 2, Japanese Patent Laid-Open No. 275323/1988 .
- Patent Document 3 Japanese Patent Laid-Open No. 1997/98972 .
- Such light wave-guides as represented by optical fiber or the like to converge light (hereinafter abbreviated as living body passage light) which by irradiating light on a living body, has permeated through at a position apart by several mm to several cm while being scattered within the living body for measuring.
- living body passage light a concentration of photoabsorption substance within the living body as represented by oxygenation hemoglobin, deoxidation hemoglobin and the like or a value corresponding to the concentration
- a photoabsorption characteristic of the photoabsorption substance aimed at, corresponding to wave length of the light irradiated will be used.
- light having wave length within a range of 650 nm to 1300 nm which has high living body permeability.
- US 5,853,370 discloses an optical system for in vivo, non-invasive imaging of tissue change including an optical module, a spectrophotometer, and a processor.
- the optical module includes an array of input ports and detection ports located in a selected geometrical pattern to provide a multiplicity of arrayed source-detector pairs engaged directly with the subject.
- the spectrophotometer includes at least one light source constructed to introduce electromagnetic radiation of visible or infra-red wavelength into the examined tissue successively at the input ports, wherein the wavelength is sensitive to a constituent.of the imaged tissue, and at least one detector constructed to detect, at the detection ports, radiation of the selected wavelength that has migrated in the tissue from respective input ports.
- the processor receives signals of the detected radiation from the detector means, and is constructed and arranged to create a defined spatial image of the tissue by effectively producing from signals from the multiplicity of photon migration paths in the tissue, a succession of data sets representing, from a selected view, a succession of spatial images of the tissue being stimulated and the tissue not being stimulated, and an image data set related to differences between data of the successive data sets of the stimulated and non-stimulated tissue.
- the disorder in the advanced function is, in the case of, for example, language, often detected when it is two or three years old in which the subject begins talking. In such a case, language acquisition will be delayed as compared with a normal case, and enormous efforts will be required in order to recover from the delay in diagnosis.
- the invention provides a living body light measuring device according to claim 1.
- a language/hearing sense stimulus is given to a subject, and presence or absence of any disorder in an advanced function of an infant will be measured by a measuring method using light. At this time, a noise due to body movement will be automatically detected from the measurement signal to be removed.
- an amount of change at an arbitrary time interval will be determined by a computation to automatically judge a component of the body movement, that is, a component of the body movement noise of the data obtained, from the amount of change.
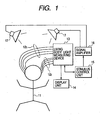
- optical fibers 12 In a state in which an infant 11 is quietly lying on a bed or the like, measurement will be performed.
- a plurality of optical fibers 12 are fitted on the head of the infant 11, a plurality of optical fibers 12 are fitted.
- optical fibers 12 1 light irradiation means
- optical fibers 12 2 for light convergence and detection
- light convergence for converging scattered light which has passed through the interior of the living body to a wave-guide into a detector for measuring a domain with a fixed area by their combination.
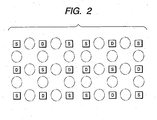
- the optical fibers 12 1 for irradiation and the optical fibers 12 2 for light convergence have been schematically shown in a state in which these two are spaced apart, but these are ordinarily arranged to be alternately dispersed in a domain with a fixed area.
- This one example is shown in Fig.2 .
- S corresponds to a position of the optical fibers 12 1 for irradiation
- D corresponds to a position of the optical fibers 12 2 for light convergence respectively.
- total Hb (total-Hb) concentration changes which is the sum total of the oxy-Hb concentration changes and deoxy-Hb concentration changes corresponds to changes in amount of blood.
- the living body light measuring device 13 is a measuring device using this near infrared light, in which a plurality of optical fibers 12 are connected, and light sources, light detectors and the like are incorporated correspondingly to each fiber 12.
- the living body light measuring device 13 processes signals obtained from the optical fibers 12 2 for light convergence to perform time series processing, imaging and the like of changes in Hb concentrations within the living body, and has, in order to display on the display unit 14, an analog-to-digital converter, a memory, and a signal processing device packaged with CPU and a necessary program although not shown.
- a stimulus control device 15 is a device for controlling a stimulus to be given to the newly born baby.
- this stimulus control device 15 a plurality of sound/voice/language data for stimuli have been recorded as analog or digital data. These sound, voice and language data are transmitted at arbitrary timing, are amplified by a signal amplifier 16, those sound, voice and language are produced through two or more speakers 17 to cause the infant 11 to listen. Timing at which sound, voice and language have been produced, a time period and the time, and types of sound, voice and language which have been selected are recorded in the living body light measuring device 13.
- the living body light measuring device 13 may be possible to instruct by the living body light measuring device 13 concerning types of sound, voice and language which are produced as timing and stimulus conversely, and to select from among the sound, voice and language which have been stored in accordance with the instruction for issuing a signal by the stimulus control device 15. In other words, it is important that the living body light measuring device 13 and the stimulus control device 15 are synchronized.
- a signal obtained from the optical fibers 12 2 for light convergence is recorded by the living body light measuring device 13 as its change in blood circulation movement.
- information and a measurement signal of the stimulus to be given to the infant from the stimulus control device 15 are displayed on the display unit 14, and after the completion of all the measurements, the signals are processed by the living body light measuring device 13 to display the result on the display unit 14.
- the signals obtained by measuring by the living body light measuring device 13 shown in Fig.1 are properly processed, whereby noise resulting from the body movement can be removed.
- This signal processing flow can be also used as post processing after the termination of the measurement, or as real time processing while measuring.
- a concentration change ⁇ C (t) of hemoglobin (Hb) will be derived. With an average value during previous T1 seconds from the first stimulus presented time as a base line, ⁇ C (t) will be derived. In this case, ⁇ C designates ⁇ C oxy (t), ⁇ C deoxy (t) which are expressed by expression (1), and ⁇ C total (t) to be expressed by expression (2).
- N is a number of measurement points sampled during T1 seconds prior to the first stimulus presented time.
- this Hb data varies from moment to moment in response to measurement to be displayed on the display unit 14.
- a value of a passing frequency band of a signal to be obtained from the optical fibers 12 2 for light convergence is automatically determined by computing a adaptive filter for calculation, or a filter value set in advance can be used, and when those values should be arbitrarily set by an operator, the ⁇ C (t) obtained is processed by Fourier transform, wavelet transform or convolution method to arbitrarily determine a band pass filter value by taking advantage of such a frequency characteristic setting screen as exemplified in Fig.4 to be described later. Since low-frequency noise and heart beat (newborn baby heat beat is 1.5 to about 2.2 Hz, adult heart beat is about 1 Hz) differ with the subject, automatization is often difficult, and this function enables fine correspondence.
- a signal ⁇ C bp (t) which has passed through a band pass filter set automatically or arbitrarily will be determined to display as shown in Fig.5 . Details concerning Figs.4 and 5 will be described later.
- data that has been obtained through the band pass filter will be attached with a numerical subscript bp to be distinguished from data that no band pass filter has been applied.
- a criterion value to be judged to contain body movement noise has been defined as a case where within 200 ms, total- ⁇ C bp has changed by 0.1 mMmm or more (when irradiation-detection distance is 20 mm, 0.066 mMmm or more) when irradiation-detection distance of fiber 12 is 30 mm.
- Data which has passed this criterion value of judgment means that on the assumption that effective scattering distance is 1 mm, a change in amount of blood of 100% does not occur within 200 ms in the cerebral cortex. Since, however, the criterion value of judgment of body movement may fluctuate according to the circumstances (for example, when the irradiation-detection distance is changed, when a spike-shaped signal is detected through the use of wavelet transform or the like), there may be cases where it becomes necessary for the operator to change the preset value.
- the body movement criterion of judgment will be rendered changeable by taking advantage of a body movement criterion of judgment setting screen for setting a criterion on the basis of which it is judged that the body movement component exemplified in Fig. 8 is contained.
- Fig. 9 has a screen for showing a result in which noise has been removed by the body movement criterion of judgment. The details of Figs.8 and 9 will be described later.
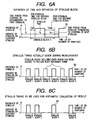
- Fig.6 shows a schematic representation of concepts of the third processing and the fourth processing.
- Figs. 6A, 6B and 6C show three types of graphs: Fig.6A shows time definition and definition of a stimulus block;.
- Fig. 6B shows actual timing of stimulus to be given during measurement; and
- Fig.6C shows timing of stimulus to be used for arithmetic evaluation of the result.
- stimulus timing waveform 51, 52, 53 is displayed with time or a number of sampling taken on the abscissa, and a period in which no stimulus is given, or with a period of contrast stimulus as 0 and a period of stimulus as 1 on the ordinate.
- the graph 6A represents various time definitions of stimulus timing, and during actual measurement, these T1, Ts, Tc, Tpre, and Tpost will be set.
- the stimulus timing waveform 51 is displayed enlarged as compared with other stimulus timing waveform 52 and 53.
- the graph 6B shows that during the measurement, data judged to contain the body movement noise has been detected during periods of the stimulus blocks 3 and 5.
- the stimulus timing waveform 52 represents that the stimulus block in which data judged to contain body movement noise has been obtained has been removed.
- the stimulus block in which data judged to contain body movement has been obtained is regarded as no stimulus having been given, and is excluded from processing.
- Fig.7A is a graph showing changes in Hb concentrations within brain obtained by performing the processing described in Fig.3 .
- This graph shows changes in Hb concentrations within brain of a newborn baby within five days after birth, and shows changes in Hb concentrations in the temple (left hemisphere language. hearing sense field) when the subject (newborn baby) is caused to listen to language at timing of stimulus indicated by a dot-and-dash line.
- Fig. 7B is a graph showing changes in Hb concentrations within brain obtained by adding and averaging all the signals obtained in the [Sixth Processing] without performing body movement judgment to be performed in the above-described [Third Processing] and [Fourth Processing] with respect to the same signal for comparison.
- the ordinate indicates values corresponding to concentration changes of total-Hb, oxy-Hb and deoxy-Hb
- the abscissa represents time
- the dot-and-dash line represents timing at which a stimulus is given to the subject (in a period of 0, no stimulus is given, but in other periods than 0, a stimulus is given).
- the solid line represents changes of total-Hb
- the dotted line changes of oxy-Hb
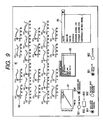
- the frequency characteristic setting screen has the following domains:
- a graph display 321 for a signal to be obtained from the optical fibers 12 2 for light convergence, and a legend 322 for representing correspondence relationship between names of signals graph displayed and line types of graph display are displayed.
- a signal selection unit 34 which is displayed as a frequency parameter setting screen.
- a pull down 342 for selecting a signal to be displayed. Since by depressing the pull down 342, signal names which can be selected are displayed below the signal selection unit 34, a signal name of a signal which should be displayed as a frequency characteristic graph is clicked on by operating a mouse cursor 33 or a keyboard, whereby a desired signal can be selected. It is also possible to select a plurality of signals to be graph-displayed.
- an ordinate selection unit 35 which is displayed as a frequency parameter setting screen.
- amplitude of oxy-Hb has been selected is shown.
- a low-frequency passing frequency display unit 361 and a high-frequency passing frequency display unit 362 of the band pass filter 1 are provided in the domain for determining a range of passing frequency of the band pass filter in the above-described 4
- a low-frequency passing frequency display unit 363 and a high-frequency passing frequency display unit 364 of the band pass filter 2 are provided in the domain for determining a range of passing frequency of the band pass filter in the above-described 4
- These display values can be increased and decreased by a predetermined numerical width by clicking on a toggle switch provided adjacent to the display unit by a mouse cursor 33.
- a domain corresponding to a frequency range displayed on the passing frequency display unit is superimposed on the display of the frequency characteristic display graph 321 for being displayed.
- the selection switch 1 or 2 can be displayed with a black dot as display 371 or 372. Instead of indicating the range of the band pass filter by a rectangular domain having different color from the background, it is also good to indicate by enclosing with a line of a rectangular domain. In this case, in order to point out explicitly the band pass filter selected, it may be possible not to display a line of a rectangular domain corresponding to a band pass filter not selected or to change into a different line type or color. In the figure, since the second band pass filter has been selected, a black dot is displayed at the center of display 372 of the selection switch 2.
- an addition button 381 In the domain for selecting a filter when a plurality of band pass filters have been set in the above-described 5), there are provided an addition button 381, a delete button 382 and an application button 383.
- the addition button 381 is depressed, whereby on the frequency characteristic display graph 321, a rectangular domain indicating a range of the band pass filter is newly displayed, further on the display portion of the high and low frequency passing frequency display unit, new high and low frequency passing frequency display units are additionally displayed and even on the selective display unit for displaying the band pass filter selected, there is newly added a selective display unit.
- the newly added display will be operated so as to become predetermined setting.
- the delete button 382 when deleting the band pass filter, in order to identify the band pass filter to be deleted, one portion of the display of the band pass filter is selected and thereafter it is deleted by depressing the delete button 382. For example, a rectangular domain indicating a range of the band pass filter which is displayed on the frequency characteristic display graph 321 will be selected and be deleted by depressing the delete button 382. As a result, the high and low frequency passing frequency display units corresponding to the band pass filter, one portion of display of which has been selected, the rectangular domain indicating a range of the band pass filter, and the selective display unit will be erased from the screen.
- the application button 383 is depressed, whereby change procedures of addition and deletion are completed, and a numerical range of the band pass filter set is decided to be stored within the memory of the living body light measuring device 13.
- the button for closing a setting screen of the band pass filter in the above-described 6) is provided side by side with the addition button 381, the delete button 382 and the application button 383. After processing of addition or deletion, and further the operation of the application button 383, the closing button 384 is depressed, whereby the screen displayed in Fig. 4 is closed. In this case, when the closing button 384 is depressed without depressing the application button 383, it is advisable to display a comment for requesting the application button 383 to be depressed because the value of the band pass filter which has been set will not be reflected in the processing hereafter.
- an automatic setting button 391 As the button for selecting whether the band pass filter will be automatically set by automatically operating an adaptive filter on the basis of a preset value or it will be set arbitrarily by the operator, in the above-described 7), there are provided an automatic setting button 391 and a manual setting selection button 392.
- the automatic setting button 391 When the automatic setting button 391 has been selected, a band pass filter which has been set in advance in a signal processing device of the living body light measuring device 13 will be automatically set.
- the manual setting selection button 392 When the manual setting selection button 392 has been selected, the band pass filter will be adjusted and set in accordance with the above-described procedure. It will be determined by the selection of the switches 391 and 392 by which it will be set.
- the figure shows a state in which the manual setting selection button 392 has been selected.
- Fig. 5 will be described in detail.
- the screens of Fig. 5 show results obtained by allowing a signal to be obtained from the optical fibers 12 2 for light convergence to pass through the band pass filter set in Fig. 4 .
- a time series graph 42 within a time series display screen 41 changes. Positions of a plurality (in the present embodiment, 24) of time series graphs 42 are arranged correspondingly to positions corresponding to the measurement positions exemplified in Fig. 2 .
- the legend 43 shows correspondence between signals to be displayed and line types.
- a signal display selection unit 45 selects a signal to be displayed as a graph.
- a body movement criterion value of judgment on the basis of which a detected signal is judged to contain body movement noise, a preset value is normally used, but there may be cases where the need for setting manually arises. For example, a case where it is outside a device constant that has been assumed, or a signal of the subject is outside the assumption.
- manual setting will be performed by a body movement criterion of judgment display setting screen 71.
- On the body movement criterion of judgment display setting screen 71 there are provided a body movement criterion value of judgment display graph 731, a body movement value of judgment input screen 74, an automatic setting selection switch 721, a manual setting selection switch 722, an application button 51, and a closing button 752.
- Selection of the manual setting or the automatic setting can be switched by selecting either the switch 721 or 722. If the automatic setting selection switch 721 has been selected, for the body movement criterion value of judgment, a preset value will be set. If the manual setting selection switch 722 has been selected, it becomes possible to set manually. Also, even by clicking on the body movement criterion value of judgment display graph 731 or the body movement value of judgment input screen 74 with the mouse cursor 75 on the screen 71, it is possible to switch an automatic setting selection unit 71 into a manual setting selection unit 72. This switching enables manual data input to the body movement criterion value of judgment display graph 731 and the body movement value of judgment input screen 74.
- the body movement value of judgment input screen 74 is composed of a signal selection unit 741 for selecting the type of a signal to be used for judgment, a time input unit 742 for setting the body movement criterion value of judgment, and a criterion value input unit 743.
- a signal selection unit 741 for selecting the type of a signal to be used for judgment
- a time input unit 742 for setting the body movement criterion value of judgment
- a criterion value input unit 743 On the signal selection unit 741, there is displayed a pull down for selecting a signal to be displayed on the body movement criterion value of judgment display graph 731 as in the case of the signal selection unit 34 on the frequency parameter setting screen described in Fig. 4 .
- judgment display graph 731 On the body movement criterion value of judgment display graph 731, there is displayed a signal selected in the signal selection unit 741, but is drawn on the basis of a numerical value (time width for calculating a difference value) inputted in the time input unit 742. Also, in this graph, at a position of a numerical value (amount of signal alteration for each time width designated by a numerical value inputted by the time input unit 742) inputted in the criterion value input unit 743, there is drawn a body movement criterion value of judgment display bar 732.
- the ordinate of the body movement criterion value of judgment display graph 731 represents a frequency
- the abscissa represents an amount of signal alteration of a time series signal designated for each arbitrary time width.
- a statistic of this frequency distribution is displayed on a statistic display unit 733. If a peculiar value (where the frequency changes suddenly) is clearly observed against the smooth frequency distribution as shown in the present embodiment, such a peculiar value is not clearly observed in many instances although this statistic is not so necessary.
- the criterion value can be determined with a dispersion ( ⁇ ) as a standard.
- a value corresponding to 3* ⁇ is selected, and this value can be inputted into the criterion value input unit 743 for setting.
- this value can be inputted into the criterion value input unit 743 for setting.
- the position of the body movement criterion value of judgment display bar 732 is changed.
- the body movement criterion value of judgment display bar 732 is moved through the use of the mouse cursor 75, whereby the numerical value of the criterion value input unit 743 also changes.
- the closing button 752 is depressed as in the case of Fig. 4 , whereby the screen displayed in Fig. 8 is closed.
- the closing button 752 is depressed without depressing an application button 751
- Fig. 9 is a view showing a time domain signal display screen responsive to the body movement criterion value of judgment according to the present invention, and displays results obtained by applying the body movement criterion value of judgment which has been set in Fig. 8 to a signal to be obtained from the optical fibers 12 2 for light convergence.
- a time series graph 82 within a time series display screen 81 changes. Positions of a plurality (in the present embodiment, 24) of time series graphs 82 are arranged correspondingly to positions corresponding to the measurement positions exemplified in Fig. 2 .
- a measurement condition display unit 88 displays conditions of measurement.
- a signal display selection unit 85 a signal to be displayed as a graph will be selected.
- a time series graph 82 to be displayed on a time series display screen 81 shown in Fig. 9 is capable of displaying results of each stimulus block in which addition and averaging are not performed, and results in which addition and averaging have been performed.
- a stimulus block display selection unit 831 is selected, and thereafter a number of a stimulus block to be displayed is inputted into a display stimulus block value input unit 832 to display a graph of the number.
- '6' is displayed on a total stimulus block number display unit 833.
- an addition and averaging display selection unit 834 has been selected, the addition and averaging result is displayed.
- the figure shows a case where the addition and averaging display selection unit 834 has been selected.
- a selection unit with body movement noise removal 841 and a selection unit without body movement noise removal 842 it is selected by a selection unit with body movement noise removal 841 and a selection unit without body movement noise removal 842 whether or not a graph to be displayed contains body movement noise.
- selection of this selection unit with body movement noise removal 841 or the selection unit without body movement noise removal 842 does not make sense, and therefore, these cannot be selected.
- it is effective to display presence or absence of body movement noise (judgment result of body movement noise) within each graph by displaying color of the line in red when a stimulus block which has not been added and averaged to be displayed is judged to contain body movement noise, and displaying color of the line in blue when it is judged to contain no body movement noise or things like that.
- the type of a signal to be displayed as a graph can be selected by a signal selection unit 85. Further, as the ordinate of each graph, an absolute value and statistic of the signal can be used. For these selections, switching can be made between an absolute value selection unit 851 and a statistic selection unit 852.
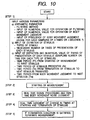
- Fig. 10 shows a flow of measurement of an embodiment according to the present invention.
- First Step Before measurement, numerical values or methods required for measurement signal processing will be inputted. These are broadly divided into the following three input items. That is, a) arithmetic parameter, b) stimulus definition input, and c) input of each timing (time) of stimulus presented definition numerical values. Each of these is specifically as below. These input values will be inputted for setting as initial input through the use of screens corresponding to items described in the first embodiment respectively.
- a control processing method for feed-back is constituted by two functions.
- a first function is to add or change the number of times of stimulus during measurement, and a second function is to change, when body movement noise has been detected, the next stimulus starting time on the basis of a parameter given in advance during measurement.
- Figs. 11A and 11B there are displayed two types of graphs: actual stimulus timing to be given during measurement, and stimulus timing to be used for arithmetic evaluation of the result.
- stimulus timing waveform 101 is displayed with time or a number of sampling taken on the abscissa, and with a time period in which no stimulus is given, or with a time period of contrast stimulus as 0 and that of stimulus as 1 on the ordinate. Therefore, as the measurement advances, stimulus blocks (set in the first step) will be increased in order.
- the stimulus timing waveform 101 in order to point out explicitly a difference between a stimulus block including data judged to contain no body movement noise and a stimulus block including data judged to contain body movement noise, the stimulus block without body movement noise has been displayed by a solid line while the stimulus block containing body movement noise has been displayed by a dotted line. Therefore, the graph A shows that body move noise has been detected during the time period of the stimulus block 3 and the stimulus block 5 during measurement.
- any other stimulus blocks than the stimulus block 3 and the stimulus block 5 will be used.
- the stimulus block to be actually used for the arithmetic evaluation and its timing are displayed in the graph B.
- Figs.12A and 12B there are displayed the following two types of graphs: stimulus timing to be actually given during measurement, and stimulus timing to be used for arithmetic evaluation of the result.
- stimulus timing waveform 111 is displayed with time or a number of sampling taken on the abscissa, and with a time period in which no stimulus is given, or with a time period of contrast stimulus as 0 and that of stimulus as 1 on the ordinate.
- the basic function of this function is to change the stimulus timing predetermined if body movement noise is detected during measurement. If body movement noise is actually detected, a discontinue signal of the stimulus under execution currently and a signal for setting the time of next stimulus presented will be transmitted to the stimulus control device 15 shown in Fig. 1 (however, if body movement noise is detected during no stimulus or contrast stimulus, no signal for discontinuing the stimulus will be transmitted).
- a time period T1 (constant) between commencement of measurement to be set in the step 1 and the first stimulus is used to operate a base line of the signal as described in the first embodiment, and a time period Tc between termination of each stimulus and the next stimulus presented or a minimal time period Tm between body movement judgment and the next stimulus can be regarded as mitigation time until a change in signal occurs because of stimulus presented or body movement is returned to the original state, it cannot be said to be appropriate to present the next stimulus immediately after body movement noise is detected. Therefore, it is effective to properly select a time period between when the body movement noise has been detected and commencement of the next stimulus in accordance with timing at which the body movement noise has been detected.
- the timing at which the body movement noise is detected has the following three:
- time T1 represents a time period until the body movement noise has been detected since the stimulus is terminated, and is monitored at all times while the subject is measured.
Landscapes
- Health & Medical Sciences (AREA)
- Life Sciences & Earth Sciences (AREA)
- Engineering & Computer Science (AREA)
- Physics & Mathematics (AREA)
- General Health & Medical Sciences (AREA)
- Biophysics (AREA)
- Surgery (AREA)
- Public Health (AREA)
- Animal Behavior & Ethology (AREA)
- Molecular Biology (AREA)
- Medical Informatics (AREA)
- Veterinary Medicine (AREA)
- Pathology (AREA)
- Biomedical Technology (AREA)
- Heart & Thoracic Surgery (AREA)
- Signal Processing (AREA)
- Physiology (AREA)
- Psychiatry (AREA)
- Optics & Photonics (AREA)
- Hematology (AREA)
- Computer Vision & Pattern Recognition (AREA)
- Artificial Intelligence (AREA)
- Neurology (AREA)
- Spectroscopy & Molecular Physics (AREA)
- Cardiology (AREA)
- Social Psychology (AREA)
- Educational Technology (AREA)
- Developmental Disabilities (AREA)
- Child & Adolescent Psychology (AREA)
- Hospice & Palliative Care (AREA)
- Psychology (AREA)
- Measurement Of The Respiration, Hearing Ability, Form, And Blood Characteristics Of Living Organisms (AREA)
- Investigating Or Analysing Materials By Optical Means (AREA)
- Measuring Pulse, Heart Rate, Blood Pressure Or Blood Flow (AREA)
Applications Claiming Priority (2)
| Application Number | Priority Date | Filing Date | Title |
|---|---|---|---|
| JP2003052600A JP4164386B2 (ja) | 2003-02-28 | 2003-02-28 | 生体光計測装置 |
| JP2003052600 | 2003-02-28 |
Publications (2)
| Publication Number | Publication Date |
|---|---|
| EP1452136A1 EP1452136A1 (en) | 2004-09-01 |
| EP1452136B1 true EP1452136B1 (en) | 2010-12-08 |
Family
ID=32767825
Family Applications (1)
| Application Number | Title | Priority Date | Filing Date |
|---|---|---|---|
| EP04001443A Expired - Lifetime EP1452136B1 (en) | 2003-02-28 | 2004-01-23 | Optical device for measuring cerebral function |
Country Status (4)
| Country | Link |
|---|---|
| US (1) | US7139597B2 (https=) |
| EP (1) | EP1452136B1 (https=) |
| JP (1) | JP4164386B2 (https=) |
| DE (1) | DE602004030387D1 (https=) |
Families Citing this family (20)
| Publication number | Priority date | Publication date | Assignee | Title |
|---|---|---|---|---|
| JP4474145B2 (ja) * | 2003-11-12 | 2010-06-02 | 株式会社日立メディコ | 光計測装置 |
| JP2005198788A (ja) | 2004-01-14 | 2005-07-28 | National Institute Of Information & Communication Technology | 生体活動計測装置 |
| JP4012900B2 (ja) | 2004-10-21 | 2007-11-21 | 株式会社日立製作所 | 生体光計測装置 |
| EP1852101B1 (en) * | 2005-02-16 | 2015-09-02 | Hitachi Medical Corporation | Biophoton measuring instrument |
| JP4663387B2 (ja) * | 2005-04-22 | 2011-04-06 | 株式会社日立製作所 | 生体光計測装置 |
| JP4813128B2 (ja) * | 2005-08-25 | 2011-11-09 | 学校法人日本大学 | 機能的近赤外分光装置の信号解析装置、機能的近赤外分光装置並びにプログラム |
| JP2007289224A (ja) * | 2006-04-21 | 2007-11-08 | Hitachi Ltd | 生体計測装置および生体計測方法 |
| KR101484930B1 (ko) * | 2006-10-13 | 2015-01-21 | 러트거스, 더 스테이트 유니버시티 | 청각 처리에서 결함들을 나타내는 유아들의 검사 및 치료 방법들 및 시스템들 |
| JP5034477B2 (ja) * | 2006-12-15 | 2012-09-26 | 株式会社日立製作所 | 生体光計測装置 |
| JP5188798B2 (ja) * | 2007-01-17 | 2013-04-24 | 株式会社日立製作所 | 生体光計測装置 |
| JP5195026B2 (ja) * | 2008-05-27 | 2013-05-08 | 株式会社島津製作所 | 光測定装置 |
| EP2314224A4 (en) | 2008-06-04 | 2013-09-18 | Hitachi Medical Corp | STIMULATING PATIENT PRESENTING DEVICE FOR AN OPTICAL MEASURING DEVICE FOR A LIVING BODY AND METHOD FOR PRESENTING THE PATIENT TO BE STIMULATED |
| WO2009148042A1 (ja) * | 2008-06-05 | 2009-12-10 | 株式会社 日立メディコ | 生体光計測装置及び画像表示プログラム |
| JP2010252906A (ja) * | 2009-04-22 | 2010-11-11 | Hitachi Medical Corp | 生体光計測装置 |
| JP5450029B2 (ja) * | 2009-12-17 | 2014-03-26 | 株式会社日立製作所 | 生体光計測装置 |
| US20120060090A1 (en) * | 2010-07-29 | 2012-03-08 | Ubersox George C | System for Automatic Mouse Control |
| JP5382666B2 (ja) | 2011-04-21 | 2014-01-08 | 学校法人 聖マリアンナ医科大学 | 濃度測定装置及び濃度測定方法 |
| CN103385695B (zh) * | 2013-07-19 | 2016-04-13 | 武汉昊博科技有限公司 | 多波长肝脏储备功能检测仪及检测icg浓度的方法 |
| JP2017023455A (ja) * | 2015-07-23 | 2017-02-02 | 株式会社アドバンテスト | 近赤外光生体計測装置及びそのプローブ |
| CN111885411A (zh) * | 2020-08-03 | 2020-11-03 | 网易(杭州)网络有限公司 | 网络直播中的显示控制方法、装置、电子设备及存储介质 |
Family Cites Families (7)
| Publication number | Priority date | Publication date | Assignee | Title |
|---|---|---|---|---|
| DE2713891A1 (de) * | 1977-03-29 | 1978-10-12 | Schweizer Helgi Jon Dr | Vorrichtung zur herstellung und anwendung rhythmischer reizstrukturen |
| JPS57115232A (en) | 1980-07-09 | 1982-07-17 | Deyuuku Univ Inc | Apparatus for measuring metabolic action in internal organ |
| JPS63275323A (ja) | 1987-05-08 | 1988-11-14 | Hamamatsu Photonics Kk | 診断装置 |
| US5853370A (en) | 1996-09-13 | 1998-12-29 | Non-Invasive Technology, Inc. | Optical system and method for non-invasive imaging of biological tissue |
| US5803909A (en) | 1994-10-06 | 1998-09-08 | Hitachi, Ltd. | Optical system for measuring metabolism in a body and imaging method |
| US6519486B1 (en) | 1998-10-15 | 2003-02-11 | Ntc Technology Inc. | Method, apparatus and system for removing motion artifacts from measurements of bodily parameters |
| US6408198B1 (en) * | 1999-12-17 | 2002-06-18 | Datex-Ohmeda, Inc. | Method and system for improving photoplethysmographic analyte measurements by de-weighting motion-contaminated data |
-
2003
- 2003-02-28 JP JP2003052600A patent/JP4164386B2/ja not_active Expired - Fee Related
-
2004
- 2004-01-23 DE DE602004030387T patent/DE602004030387D1/de not_active Expired - Lifetime
- 2004-01-23 US US10/762,498 patent/US7139597B2/en not_active Expired - Lifetime
- 2004-01-23 EP EP04001443A patent/EP1452136B1/en not_active Expired - Lifetime
Also Published As
| Publication number | Publication date |
|---|---|
| DE602004030387D1 (de) | 2011-01-20 |
| US7139597B2 (en) | 2006-11-21 |
| EP1452136A1 (en) | 2004-09-01 |
| JP2004261265A (ja) | 2004-09-24 |
| US20040171919A1 (en) | 2004-09-02 |
| JP4164386B2 (ja) | 2008-10-15 |
Similar Documents
| Publication | Publication Date | Title |
|---|---|---|
| EP1452136B1 (en) | Optical device for measuring cerebral function | |
| JP7774903B2 (ja) | 光トモグラフィを使用する経腹的胎児オキシメトリの遂行 | |
| JP4474145B2 (ja) | 光計測装置 | |
| JP3096331B2 (ja) | 診断装置 | |
| EP2591732B1 (en) | Biological photometric device and biological photometry method using same | |
| Keles et al. | Hemodynamic correlates of spontaneous neural activity measured by human whole-head resting state EEG+ fNIRS | |
| JP4006826B2 (ja) | 生体光計測装置 | |
| EP2554115B1 (en) | Apparatus and method for acquiring information on subject | |
| US20040254475A1 (en) | Optical measuring instrument | |
| JP4097522B2 (ja) | 生体光計測装置 | |
| WO2003002004A1 (en) | Biological optical measuring instrument | |
| JP2004242981A (ja) | 生体光計測装置 | |
| US8600720B2 (en) | Stimulating task presentation device and stimulating task presentation method for living body optical measurement apparatus | |
| JP4559417B2 (ja) | 生体光計測装置およびプログラム | |
| JPWO2015092872A1 (ja) | 生体光計測装置およびそれを用いた生体光計測方法 | |
| JP4856477B2 (ja) | 生体光計測装置 | |
| JP3325145B2 (ja) | 生体光計測装置 | |
| JP5210733B2 (ja) | 刺激呈示機能を有する生体光計測装置及び刺激課題呈示方法 | |
| JP4332534B2 (ja) | 生体光計測装置 | |
| JP6093142B2 (ja) | 生体光計測装置を用いた脳活動訓練支援装置、信号処理プログラム、および、信号処理方法 | |
| JP5679629B2 (ja) | 光脳機能計測装置 | |
| JP4272024B2 (ja) | 光生体計測装置 | |
| JP4230729B2 (ja) | 生体光計測装置 | |
| JPWO2015004789A1 (ja) | 生体光計測データ解析装置、解析方法およびそのためのプログラム | |
| JP2002085412A (ja) | 光測定方法及び光測定装置 |
Legal Events
| Date | Code | Title | Description |
|---|---|---|---|
| PUAI | Public reference made under article 153(3) epc to a published international application that has entered the european phase |
Free format text: ORIGINAL CODE: 0009012 |
|
| AK | Designated contracting states |
Kind code of ref document: A1 Designated state(s): AT BE BG CH CY CZ DE DK EE ES FI FR GB GR HU IE IT LI LU MC NL PT RO SE SI SK TR |
|
| AX | Request for extension of the european patent |
Extension state: AL LT LV MK |
|
| 17P | Request for examination filed |
Effective date: 20041001 |
|
| 17Q | First examination report despatched |
Effective date: 20050318 |
|
| AKX | Designation fees paid |
Designated state(s): DE FR GB IT |
|
| RBV | Designated contracting states (corrected) |
Designated state(s): DE FR GB IT |
|
| 17Q | First examination report despatched |
Effective date: 20050318 |
|
| GRAP | Despatch of communication of intention to grant a patent |
Free format text: ORIGINAL CODE: EPIDOSNIGR1 |
|
| GRAS | Grant fee paid |
Free format text: ORIGINAL CODE: EPIDOSNIGR3 |
|
| RAP1 | Party data changed (applicant data changed or rights of an application transferred) |
Owner name: HITACHI, LTD. |
|
| GRAA | (expected) grant |
Free format text: ORIGINAL CODE: 0009210 |
|
| AK | Designated contracting states |
Kind code of ref document: B1 Designated state(s): DE FR GB IT |
|
| REG | Reference to a national code |
Ref country code: GB Ref legal event code: FG4D |
|
| REF | Corresponds to: |
Ref document number: 602004030387 Country of ref document: DE Date of ref document: 20110120 Kind code of ref document: P |
|
| PLBE | No opposition filed within time limit |
Free format text: ORIGINAL CODE: 0009261 |
|
| STAA | Information on the status of an ep patent application or granted ep patent |
Free format text: STATUS: NO OPPOSITION FILED WITHIN TIME LIMIT |
|
| 26N | No opposition filed |
Effective date: 20110909 |
|
| REG | Reference to a national code |
Ref country code: DE Ref legal event code: R097 Ref document number: 602004030387 Country of ref document: DE Effective date: 20110909 |
|
| PGFP | Annual fee paid to national office [announced via postgrant information from national office to epo] |
Ref country code: FR Payment date: 20140108 Year of fee payment: 11 Ref country code: IT Payment date: 20140115 Year of fee payment: 11 |
|
| PGFP | Annual fee paid to national office [announced via postgrant information from national office to epo] |
Ref country code: DE Payment date: 20150120 Year of fee payment: 12 |
|
| PGFP | Annual fee paid to national office [announced via postgrant information from national office to epo] |
Ref country code: GB Payment date: 20150121 Year of fee payment: 12 |
|
| REG | Reference to a national code |
Ref country code: FR Ref legal event code: ST Effective date: 20150930 |
|
| PG25 | Lapsed in a contracting state [announced via postgrant information from national office to epo] |
Ref country code: FR Free format text: LAPSE BECAUSE OF NON-PAYMENT OF DUE FEES Effective date: 20150202 |
|
| PG25 | Lapsed in a contracting state [announced via postgrant information from national office to epo] |
Ref country code: IT Free format text: LAPSE BECAUSE OF NON-PAYMENT OF DUE FEES Effective date: 20150123 |
|
| REG | Reference to a national code |
Ref country code: DE Ref legal event code: R119 Ref document number: 602004030387 Country of ref document: DE |
|
| GBPC | Gb: european patent ceased through non-payment of renewal fee |
Effective date: 20160123 |
|
| PG25 | Lapsed in a contracting state [announced via postgrant information from national office to epo] |
Ref country code: GB Free format text: LAPSE BECAUSE OF NON-PAYMENT OF DUE FEES Effective date: 20160123 Ref country code: DE Free format text: LAPSE BECAUSE OF NON-PAYMENT OF DUE FEES Effective date: 20160802 |