EP1306646A1 - Projecteur de motif de reseau utilisant un reseau de cristaux liquides - Google Patents
Projecteur de motif de reseau utilisant un reseau de cristaux liquides Download PDFInfo
- Publication number
- EP1306646A1 EP1306646A1 EP01936882A EP01936882A EP1306646A1 EP 1306646 A1 EP1306646 A1 EP 1306646A1 EP 01936882 A EP01936882 A EP 01936882A EP 01936882 A EP01936882 A EP 01936882A EP 1306646 A1 EP1306646 A1 EP 1306646A1
- Authority
- EP
- European Patent Office
- Prior art keywords
- intensity
- grating pattern
- linear
- distribution
- deformed
- Prior art date
- Legal status (The legal status is an assumption and is not a legal conclusion. Google has not performed a legal analysis and makes no representation as to the accuracy of the status listed.)
- Withdrawn
Links
Images


Classifications
-
- G—PHYSICS
- G01—MEASURING; TESTING
- G01B—MEASURING LENGTH, THICKNESS OR SIMILAR LINEAR DIMENSIONS; MEASURING ANGLES; MEASURING AREAS; MEASURING IRREGULARITIES OF SURFACES OR CONTOURS
- G01B11/00—Measuring arrangements characterised by the use of optical techniques
- G01B11/24—Measuring arrangements characterised by the use of optical techniques for measuring contours or curvatures
- G01B11/25—Measuring arrangements characterised by the use of optical techniques for measuring contours or curvatures by projecting a pattern, e.g. one or more lines, moiré fringes on the object
- G01B11/2536—Measuring arrangements characterised by the use of optical techniques for measuring contours or curvatures by projecting a pattern, e.g. one or more lines, moiré fringes on the object using several gratings with variable grating pitch, projected on the object with the same angle of incidence
-
- G—PHYSICS
- G01—MEASURING; TESTING
- G01B—MEASURING LENGTH, THICKNESS OR SIMILAR LINEAR DIMENSIONS; MEASURING ANGLES; MEASURING AREAS; MEASURING IRREGULARITIES OF SURFACES OR CONTOURS
- G01B11/00—Measuring arrangements characterised by the use of optical techniques
- G01B11/24—Measuring arrangements characterised by the use of optical techniques for measuring contours or curvatures
- G01B11/25—Measuring arrangements characterised by the use of optical techniques for measuring contours or curvatures by projecting a pattern, e.g. one or more lines, moiré fringes on the object
-
- G—PHYSICS
- G06—COMPUTING; CALCULATING OR COUNTING
- G06T—IMAGE DATA PROCESSING OR GENERATION, IN GENERAL
- G06T7/00—Image analysis
- G06T7/50—Depth or shape recovery
- G06T7/521—Depth or shape recovery from laser ranging, e.g. using interferometry; from the projection of structured light
Definitions
- the present invention relates to a structure and method for processing images and for preparing a grating pattern for a three dimensional shape measuring device using a grating pattern projection method.
- Laser interferometers are widely used in the case of areas whose surface irregularities are in the order of micrometers ( ⁇ m). However, for areas whose irregularities are 100 ⁇ m or more, another measuring means is required in place of the laser interferometer.
- Typical shape measuring methods in this case are a light-section method of scanning a slit shaped laser beam above the surface of an object, a moiré pattern measuring method, a grating pattern projection method, and the like.
- the grating pattern projection method has many advantages such as simple measurement processing, a simple device structure, high measurement precision, and the like, and is therefore suitable for three dimensional shape measurement.
- Fig. 24 and Fig. 25 show the principle of three dimensional shape measurement using a grating pattern projection method.
- Fig. 24 is an example of the principle structure of a grating pattern projection device.
- a light source section 401 is constructed from a white light source and the like for lighting, such as a halogen lamp or the like, and illuminates a grating 411.
- a plurality of linear grating patterns are formed having a predetermined pitch and predetermined transmitted light intensity distribution.
- the grating pattern of the grating 411 is enlarged or reduced by a projection lens 402 and projected onto an object 400 whose three dimensional shape is to be measured.
- the projected grating pattern is deformed (curved) according to the degree of irregularities of the object 400.
- the two dimensional image of the grating pattern (hereafter referred to as 'distorted grating pattern') distorted according to the irregularities of the object 400 is detected by an image detecting section 404 comprising a CCD camera or the like via an image pickup lens 403 from a direction different to the projected direction.
- a data processing section 414 image processes the two dimensional image of the deformed grating pattern detected by the image detecting section 404 and arithmetically processes fluctuations in the intensity distribution thereof to calculate the three dimensional shape of the object 400.
- a triangulation method determined by the distances and angles of the triangular shape between the grating 411, the object 400 and the image detecting section 404.
- Fig. 25 shows the principle of the triangulation method.
- the monitor light axis 422 and base line axis 424 if the height of the position 426 of the object 400 is changed by ⁇ h, the monitor light axis 422 moves in parallel to the broken line 423 and detected position in the detection plane 427 shifts by ⁇ X.
- the height difference ⁇ h appears as the positional difference ⁇ X in the plane of the two dimensional image. Consequently, irregularity information of the object 400 can be calculated from fluctuations in the intensity distribution of the deformed grating pattern image.
- the intensity distribution at each of the pixel positions p (x,y) in the image detecting section 404 is converted to a three dimensional coordinate P (X,Y,Z) by the calculations of the triangulation method determined by the base line length L, angles ⁇ and ⁇ of the triangular shape.
- the light intensity distribution for the interval P of each cycle of the grating pattern is set as a sine wave.
- the intensity distribution I(x) of the grating pattern at a position x on the object is as shown in formula (1).
- I(x) B(x)+A(x)cos[ ⁇ (x)+ ⁇ ]
- B(x) bias intensity
- A(x) amplitude
- ⁇ is an initial phase.
- the sine wave intensity distribution grating pattern detects the phase ⁇ (x) of each position from the intensity I(x).
- a plurality of grating patterns having the same sine wave intensity distribution and with only their initial phases ⁇ changed, are projected in sequence onto the object 400, the plurality of deformed grating pattern images are detected, and the intensity distributions of the plurality of images are processed to measure the three dimensional shape. This method is called a phase shift method.
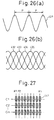
- the waveforms 432, 433, 434 and 435 of the plurality of sine waves having different initial phases are shown in Fig. 26(b).
- the phase shift method will be explained using Fig. 26(b).
- the phase shift method of this example changes the initial phases ⁇ to 0, ⁇ /2, ⁇ , and 3 ⁇ /2. If the intensities at the positions x of the deformed grating patterns, when the sine wave intensity distribution grating patterns of waveforms 432 to 435 are projected, are given as I0, I1, I2 and I3, their phases ⁇ (x) are calculated by formula (2).
- ⁇ (x) arctan[(I3-I1)/(I0-I2)]
- phase ⁇ (x) within one cycle of a grating pattern is a value within the range of 0 to 2 ⁇
- the three dimensional shape is measured from the optical arrangement shown in Fig. 24 by connecting the phases of each grating pattern in sequence.
- the bias intensity B(x) and amplitude A(x) have been omitted.
- the influence of surface reflections is not received and phases due purely to irregularities can be detected.
- a method of dividing one cycle of the grating pattern into three and shifting the initial phase ⁇ in steps of 2 ⁇ /3 to detect three deformed grating pattern images can also be used.
- a grating pattern is prepared by drawing it directly on a glass substrate or film.
- the grating pitch is changeable in accordance with irregularities, so that the grating pitch is greater when the irregularities are larger, and less when the irregularities are smaller. Since the grating pitch and intensity distribution are fixed if the grating is drawn on a glass substrate, a number of types of grating with different grating pitches are prepared and these gratings are selected and used according to the irregularities of the object to be measured.
- the phase shift method is used, the grating 411 is moved at a fixed pitch using a mechanized stage or the like.
- Liquid crystals are elements whose transmitted light intensities change in accordance with a driving voltage, and can provide a grating pattern having adjustable grating pitch and intensity distribution by means of voltage control.
- An example of the electrode structure of a conventional liquid crystal grating is shown in Fig. 27.
- the electrodes 441 have a structure wherein a plurality of separated independent pixels are formed in a matrix shape having m number of row electrodes C1, C2,...Cm and n number of column electrodes R1, R2,...Rn.
- a signal comprising multiple voltage levels is applied to the row electrodes and column electrodes to perform time division driving.
- Fig. 28(a) transmitted light intensity characteristics with respect to the driving voltages of the liquid crystal elements are shown.
- the transmitted light intensity of liquid crystals changes according to the driving voltage, and has the characteristic that although the transmitted light intensity changes substantially in proportion to the driving voltage when the driving voltage is low, and the transmitted light intensity saturates when the driving voltage is increased.
- voltages corresponding to the light intensity of, for example, 452 at point A, 453 at point B, and 454 at point C are applied to the liquid crystals, according to a set sine wave intensity distribution.
- Fig. 28(b) An example of sine wave intensity distribution is shown in Fig. 28(b).
- the transmitted light intensities of each of point A, point B, and point C when driven at the voltages shown in Fig. 28(a) are 462, 463, and 464 in Fig. 28(b).
- voltages that become sine wave intensity distributions are set according to the voltage - transmitted light intensity characteristic of liquid crystal. Since liquid crystal gratings have discrete intensity distribution, in making the gradation of the sine wave high to make a smooth intensity distribution, the driving voltage width is set narrow.
- the phase shift method is realized by electrical control.
- the intensity distribution of the grating pattern is a sine wave
- the grating pattern is projected four times, there is the problem of the increase in measurement time.
- sine wave intensity distribution by means of a liquid crystal grating
- the transmitted light intensity characteristic of the liquid crystal elements is non-linear
- the sine wave is distorted towards the peak intensity.
- the drive signal generating the sine wave the higher the gradation, the more complex a drive signal is required, therefore there is the problem that increasing the gradation of the sine wave is difficult.
- phase errors occur when converting the intensity distribution p (x,y) to phase distribution ⁇ (x,y), so there is the problem that three dimensional shape measurement errors become large. Also, there is the problem that, because trigonometric function processing is needed when converting sine wave intensities to phases, intensity data of obtained two dimensional images are standardization processed, a trigonometric table must be referred to for arctan values, and the like, the image data processing structure is complicated. Further, there is the problem that, because sine wave intensity distribution is non-linear, when calculating phases, phase calculation is necessary for each position on the image, leading to a long processing time.
- the electrode structure of conventional liquid crystal gratings is a matrix shape wherein individual pixels are separated.
- the matrix shape has gaps between adjacent pixels, its effective pixel surface area is reduced (aperture rate is reduced) and its light usage efficiency is decreased.
- the discontinuity of its intensity distribution is high because the gaps between the pixels are large, and optical noise occurs in the grating pattern.
- sine wave intensity detection errors increase due to the optical noise.
- the matrix shape is time division driven, a complex drive signal having multiple potential levels is necessary.
- the liquid crystal elements are such that changes in the transmitted light intensity are non-linear with respect to changes in the drive voltage, setting the transmitted light distribution of the liquid crystals by means of the time division drive signal so as to have a sine wave intensity distribution is difficult.
- an object of the present invention is to provide a three dimensional shape measuring device using a liquid crystal grating, for solving the above problems which occur due to using a grating pattern having a sine wave intensity distribution.
- Another object of the present invention is to provide a three dimensional shape measuring device with high measuring precision that prepares a grating pattern whose intensity distribution changes to a linear form, using a liquid crystal grating.
- a further object of the present invention is to provide a three dimensional shape measuring device with high measuring precision, that detects phase distribution that changes to linear from only one phase image signal without performing phase shifting, whose grating pattern preparation is simple, and whose measuring time is short.
- Still another object of the present invention is to provide a three dimensional shape measuring device with high measuring precision whose grating pattern preparation is simple and whose measuring time is short, by determining the non-linear characteristic of intensity distribution to correct it to a linear intensity distribution.
- the grating pattern projection apparatus of claim 1 of the present invention comprises a light source portion, a liquid crystal grating, a projector for projecting a grating pattern formed by light emitted from the light source passing through the liquid crystal grating onto an object to be measured, a liquid crystal driver for driving the liquid crystal grating so that one cycle of the grating pattern has a linear intensity distribution, a detector for detecting a deformed grating pattern distorted by projecting the grating pattern onto an object to be measured, and a processor for converting the linear intensity distribution of each cycle of the deformed grating pattern into a linear phase distribution for changing a phase linearly.
- the liquid crystal driver preferably sets the pitch of the grating pattern in accordance with surface irregularities of the object to be measured.
- the liquid crystal driver preferably prepares a triangular wave intensity distribution such that a width of an area whose intensity increases linearly and a width of an area whose intensity decreases linearly are equal in one cycle of the grating pattern, and drives the liquid crystal grating so that the grating pattern has a triangular wave intensity distribution.
- the processor preferably detects a maximum intensity or a minimum intensity of each cycle of the deformed grating pattern, converts the intensity at each position of the deformed grating pattern into a standardized intensity with the maximum intensity or the minimum intensity as a standard, and performs proportional processing of the standardized intensity to convert an intensity that changes linearly in one cycle of the deformed grating pattern into a phase that changes linearly between 0 and 2 ⁇ .
- the processor preferably comprises a smoothing processor for converting the intensity of the deformed grating pattern into an intensity distribution that changes smoothly, and a linear distribution corrector for correcting intensity changes in each intensity increase area and intensity decrease area of the smoothing processed deformed grating pattern into an intensity distribution that approximates a straight line, so that it changes linearly.
- the grating pattern includes a first grating pattern and a second grating pattern of the same grating pitch and whose intensity distributions are mutually inverse
- the projector sequentially projects the first grating pattern and the second grating pattern individually onto an object to be measured
- the detector sequentially detects a first deformed grating pattern caused by the first grating pattern and a second deformed grating pattern caused by the second grating pattern
- the processor determines whether there is a fluctuation in the reflection state of an object to be measured by detecting changes in the maximum intensity and minimum intensity of each cycle of the first and second deformed grating patterns, and either one of positions where an intensity of the first and second deformed grating patterns change discontinuously, or positions where the intensity sum of each position of the first and second deformed grating patterns changes discontinuously, and converts the linear intensity distributions of the first and second deformed grating patterns to linear phase distributions when the processor determines that the reflection state does not fluctuate, and when the processor determines
- the processor preferably converts the intensity distributions of the first and second deformed grating patterns into intensity distributions that change smoothly, and corrects the respective intensity distributions of the smoothing processed first and second deformed grating patterns to intensity distributions wherein the intensity changes of intensity increase areas and intensity decrease areas approximate straight lines so that they change linearly.
- the grating pattern includes a first grating pattern and a second grating pattern of the same grating pitch and whose intensity distributions are mutually inverse
- the projector projects any one of the first grating pattern or the second grating pattern onto an object to be measured when the surface of an object to be measured is formed from a material of uniform reflectivity
- the detector sequentially detects a first deformed grating pattern caused by the first grating pattern and a second deformed grating pattern caused by the second grating pattern.
- the liquid crystal grating has a plurality of liquid crystal elements formed in the liquid crystal grating, a single common electrode provided on one side of the plurality of liquid crystal elements, and a stripe electrode having a plurality of stripe shape electrodes and formed in a discrete arrangement provided opposite the common electrode and the liquid crystal driver applies a rectangular wave signal having the same duty ratio at the same two intensities to the common electrode and the stripe electrodes, changes the phases of the rectangular wave signal applied to the common electrode and the rectangular signal applied to the stripe electrode according to the linear intensity distribution, prepares the grating pattern having a linear intensity distribution in every cycle.
- the grating pattern is a pattern of one phase only
- the projector projects a single phase grating pattern onto an object to be measured one time only
- the detector detects a single phase deformed grating pattern caused by the single phase grating pattern one time only
- the processor has a single phase signal intensity fluctuation detector for detecting a peak intensity of each cycle of the single phase grating pattern, the peak intensity position, and the rate of intensity change, and a phase distribution calculator for converting the single phase deformed grating pattern to a linear phase distribution according to fluctuation of the peak intensity and rate of intensity change.
- the liquid crystal driver preferably drives the liquid crystal grating so that the grating pattern has a triangular wave intensity distribution, by preparing a triangular wave intensity distribution wherein, in one cycle of the grating pattern, the width of an area whose intensity increases linearly and the width of an area whose intensity decreases linearly are equal.
- the liquid crystal driver preferably drives the liquid crystal grating by means of a signal whose voltage in one cycle is a discrete stepped shape and changes symmetrically every half cycle, according to the number of gradations representing the fineness of intensity changes of linear intensity distribution.
- the single phase signal intensity fluctuation detector preferably, when the peak intensity in each cycle of the single phase deformed grating pattern is constant, obtains a linear phase distribution from a rate of intensity change where the reflectivity of an object to be measured is determined to be constant and, when the peak intensity fluctuates, obtains a linear phase distribution from a peak intensity and rate of intensity change where the reflectivity of an object to be measured is determined to be fluctuating in the vicinity of positions where the peak intensity fluctuates.
- the single phase signal intensity fluctuation detector preferably detects a rate of intensity change from a difference value of a pixel intensity of a previously set step pixel interval in one cycle of the single phase deformed grating pattern, sets a slice intensity level for separating the rate of intensity change into discrete segments when the rate of intensity change in one cycle fluctuates, compares the slice intensity level and rate of intensity change to sort the rate of intensity change into areas according to the slice intensity level, and detects the boundary positions of the areas.
- a linear phase distribution calculator when the rate of intensity change in one cycle of the single phase deformed grating pattern is detected as constant by the single phase signal intensity fluctuation detection portion, standardizes a phase difference between maximum intensities or minimum intensities in one cycle of the single phase deformed grating pattern to 2 ⁇ , and converts each pixel position from a proportional relationship between a standard pixel number between maximum intensities or minimum intensities and each pixel position in one cycle to a phase from 0 to 2 ⁇ , to obtain a linear phase distribution that changes linearly at a constant gradient in one cycle.
- the linear phase distribution calculator when the rate of intensity change in one cycle of a single phase deformed grating pattern is detected as fluctuating by the single phase signal intensity fluctuation detector, standardizes a phase difference between maximum intensities or minimum intensities in one cycle of the single phase deformed grating pattern to 2 ⁇ , converts each pixel position within an area according to a proportional relationship between a standard pixel number between maximum intensities or minimum intensities and each pixel position within the area, as well as a slice intensity level of the area, to a phase from 0 to 2 ⁇ , and connects phases of each area at boundary positions of each area, to obtain a linear phase distribution that changes linearly at a constant gradient in one cycle.
- the liquid crystal driver drives the liquid crystal grating by means of a preliminary linear intensity distribution signal
- the projector projects a preliminary grating pattern onto an object to be measured according to the preliminary linear intensity distribution signal
- the detector detects a preliminary deformed grating pattern distorted by projecting the preliminary grating pattern onto an object to be measured
- the liquid crystal driver has an intensity distribution judgment unit for detecting a non-linear characteristic of the preliminary deformed grating pattern and positions having a non-linear characteristic, and a linear distribution signal corrector for, when a non-linear characteristic of the preliminary deformed grating pattern is detected, correcting the preliminary linear intensity distribution signal so that the preliminary deformed grating pattern does not have a non-linear characteristic
- the liquid crystal driver uses a corrected preliminary linear intensity distribution signal to drive the liquid crystal grating for measuring.
- the intensity distribution judgment unit detects a difference intensity between previously set step pixels with respect to one image area of the preliminary deformed grating pattern and, determines that preliminary deformed grating pattern does not have a non-linear characteristic in a case where an absolute value of a difference intensity in one cycle of the preliminary deformed grating pattern is regarded as substantially constant, determines that the preliminary deformed grating pattern does not have a non-linear characteristic in a case where the absolute value of a difference intensity in one cycle of the preliminary deformed grating pattern fluctuates over a previously set limit, determines that the preliminary deformed grating pattern has a non-linear characteristic in a case where a difference intensity close to 0 occurs in the vicinity where the difference intensity in one cycle of the preliminary deformed grating pattern changes from a maximum value to a minimum value, determines that a nonlinear characteristic has occurred in the vicinity of the maximum intensity of the preliminary deformed grating pattern in a case and where a difference intensity close to 0 occurs in
- the linear distribution signal corrector changes the voltage level of the preliminary linear intensity distribution signal and phases between signals to control a drive effective voltage of the liquid crystal grating, performs control to reduce the drive effective voltage of the liquid crystal grating where a non-linear characteristic is determined by the intensity distribution judgment unit to have occurred in a maximum intensity area of the preliminary deformed grating pattern, and performs control to increase the drive effective voltage where a non-linear characteristic is determined by the intensity distribution judgment unit to have occurred in a minimum intensity area of the preliminary deformed grating pattern.
- the linear distribution signal corrector changes the number of gradations of the preliminary linear intensity distribution signal and phases between signals to control a drive effective voltage of the liquid crystal grating, and reduces the number of gradations where a non-linear characteristic is determined by the intensity distribution judgment portion to have occurred in a maximum intensity area of the preliminary deformed grating pattern.
- the grating pattern projection apparatus has an intensity distribution, pattern and pitch that are freely changeable, by use of a liquid crystal grating. Also, by making the intensity distribution linear, it can be converted to phase distribution by a simple comparison process. Further, if the intensity distribution of a grating pattern distorted to a non-linear shape due to noise is subjected to an arithmetic processing operation for converting it into a linear intensity distribution, a phase distribution from which the effect of the noise has been removed can be detected, improving the precision of three-dimensional shape measurement. Further still, if it approaches a straight line, increasing the linear intensity gradation of the grating pattern becomes unnecessary, and control of the grating pattern becomes easier.
- projection of a grating pattern in response to the surface reflection state of the object can be selected. Where the surface reflection state is constant, the grating pattern need only be projected once. If the surface reflection state fluctuates, the grating pattern need only be projected twice with the intensity distribution inverted in each case. By reducing the number of grating patterns projected, the measurement time is shortened.
- boundary positions where the surface reflection state changes can be easily determined from the intensity fluctuations in the deformed grating pattern obtained by the two projections.
- the effect of intensity fluctuations due to fluctuations in the surface reflection state can be removed, a phase distribution according to irregularities can be detected with precision, and a three dimensional shape can be measured faster and with more precision than with a sine wave intensity phase shift of the prior art.
- a static drive can be applied, and any light intensity distribution can easily be realized with a simple drive signal, by a pulse width modulation method using two signal levels.
- the aperture rate of the pixels can be improved and grating patterns with little noise can be projected.
- a grating pattern having a shape that matches the irregular shape of the object can be projected onto the object, and measurement precision and reliability can be improved.
- the process from preparation of the grating pattern to two dimensional image processing is done by computer processing, completely automatic measurement in real time is possible.
- the grating pattern projection apparatus projects a grating pattern having a linear intensity distribution using a liquid crystal grating.
- the intensity distribution and pattern pitch of the grating pattern can be freely changed.
- the intensity distribution of the grating pattern is set at a linear distribution having a symmetrical triangular waveform.
- the number of times the grating pattern is projected is only once, and the deformed grating pattern image is detected only once.
- the measurement time until image detection is shortened, and high speed measurement, four times faster or more compared to prior art sine wave grating projection, is possible.
- the processing time is greatly shortened.
- both the peak intensity and change of intensity rate of each cycle in the single phase image signal are detected and the phase distribution is calculated according to fluctuations therein.
- the two sets of intensity data are detected in combination, fluctuations in the reflection state and irregularity fluctuations of the object can be distinguished, improving measurement reliability.
- the basic intensity distribution of the single phase image signal is linear, the above detection can be performed between discrete step pixels, and the processing time shortened.
- the grating pattern projection apparatus projects the grating pattern having a linear intensity distribution using a liquid crystal grating
- the intensity distribution of a preliminarily projected grating pattern is a non-linear distribution
- it is corrected to a linear intensity distribution.
- the pixels of the liquid crystal grating are set in stripe shapes and a drive signal that sets a linear intensity distribution by means of a static drive is prepared.
- the drive signal can be of a dual value intensity level, and only the phases between drive signals need to be changed, preparation of the drive signal is simple.
- the intensity distribution is set to linear, there need only be a small number of intensity gradations. Even if it is an intensity distribution with a number of gradations as low as eight, a grating pattern of the same high surface resolution ae that having a high number of gradations can be prepared, and measurement resolution can be improved.
- a non-linear characteristic is determined from fluctuation of a difference intensity of the detected grating pattern image.
- the extent of the non-linear characteristic and the position(s) at which the non-linear characteristic occurs can be detected by simple arithmetic processing.
- correction of the intensity distribution because the effective drive voltage of the liquid crystal can be easily changed by merely changing the voltage and phase of a dual value voltage level, correction to a linear intensity distribution can be easily performed.
- the intensity distribution and phase distribution of the deformed grating pattern directly correspond, so that the phase distribution can be calculated with high precision. Consequently, high precision three dimensional shape measurement is possible. Also, by making the intensity distribution linear, the number of times the grating pattern is projected need only be once or twice, shortening the measurement time until image detection, and making possible high speed measurement compared to prior art sine wave grating projection. Further still, even if the contrast or the like of the grating pattern fluctuates due to fluctuations of the reflectivity of the object, stable, high precision measurement is possible, without receiving the effect of the fluctuations.
- a liquid crystal grating formed by liquid crystal elements is used, so that the pitch and intensity distribution of the projected grating pattern can be changed. If the pitch of the grating pattern is made fine, the resolution is improved, therefore, with respect to the prior art in which the resolution of the projected area is 0.1%, the present invention can achieve a resolution of the projected area of 0.03%. For example, where the projection surface area of the grating pattern is 100mm x 100mm, irregularities can be measured with a resolution of from 0.1mm to 0.03mm.
- one electrode of the liquid crystal element has a single common electrode structure (common electrodes) with the same potential.
- the other opposite electrode has the pixels discretely formed at a constant pitch in one direction (X), and formed in a continuous striped structure (stripe electrodes) in a direction (Y) perpendicular to the direction (X). There are no gaps in the Y direction of the above stripe shaped pixel structure, so the aperture rate is increased and light utilization efficiency is increased.
- the transmitted light intensity of the liquid crystal is controlled by a static type drive signal.
- a static drive since a rectangular wave signal with a 50% duty ratio is applied at two voltage levels to the common electrode and the stripe electrode, a simple drive signal can be used. Also, with the static drive, a predetermined voltage corresponding to the intensity distribution set in the striped pixels is independently applied. Further, with the static drive, using a pulse width modulation method for changing the phase of the signal applied to the stripe electrode with respect to the signal applied to the common electrode, the drive effective voltage of the liquid crystal is controlled and liquid crystal gradation control is performed.
- the intensity distribution of the projected grating pattern is important. This is because the intensity distribution of a deformed grating pattern image, deformed according to the irregularities of the object, and the position of the object are coordinated, to increase the spatial resolution of the measurement. As a result, it is set so that the intensity distribution in one cycle of the grating pattern is changed to linear. If the intensity distribution is linear, the phase also changes to linear, and the intensity distribution and phase distribution have a direct correspondence. In particular, a grating pattern having a triangular intensity distribution wherein the width of a linear area in which the intensity increases and the width of a linear area in which the intensity decreases are equal, and a phase distribution that is changed to a triangular waveform, is detected.
- the intensity distribution of the projected grating pattern is a discrete distribution and the deformed grating pattern image has an intensity distribution that has been digitized.
- a smoothing (equalizing) process is performed on the deformed grating pattern image data to convert it to intensity data that has been smoothly changed. Further, the smoothing processed intensity distribution is corrected to approximate a straight line, and is corrected to an intensity distribution that changes linearly. Thus, a phase distribution that changes linearly is calculated from the corrected intensity distribution.
- the phase distribution is detected from a linear intensity distribution image
- the maximum intensity and minimum intensity of each cycle of the deformed grating pattern are deformed, these maximum and minimum intensities are taken as a standard, and the intensities of each position of the deformed grating pattern are standardized.
- These intensities that have been standardized and linearly changed are converted to phases of values that change linearly from 0 to 2 ⁇ between standardized maximum intensities or between standardized minimum intensities of each cycle. As these standardized intensities change in straight lines, the conversion precision to phases is high.
- the phase distribution for each cycle are connected between each deformed grating pattern.
- the grating pattern having a linear intensity distribution need only be projected only once, and the three dimensional shape can be measured from the detected phase distribution. Consequently, phase shifting of the grating pattern is unnecessary.
- the surface reflectivity of the object to be measured is not constant, whether the fluctuations in intensity distribution of the deformed grating pattern have occurred due to irregularities of the object or whether they have occurred due to fluctuations in the surface reflectivity of the object cannot be distinguished.
- two types of grating patterns a first grating pattern having a linear intensity distribution and a second grating pattern, whose phase is shifted by n from that of the first grating pattern and whose intensity distribution is reversed, are prepared. Then, these two types of grating patterns are projected onto the object and a first deformed grating pattern image and second deformed grating pattern image are detected.
- the surface reflectivity of the object is determined to be constant. If at this time it is thought that the intensity distribution has fluctuated due only due to the irregularities of the object, standardization processing and calculation of the phase distribution are performed, with the maximum intensity and minimum intensity of any one deformed grating pattern image from among the first deformed grating pattern image and second deformed grating pattern image as a standard.
- the above standardization processing is performed using the intensity distribution of a deformed grating pattern image from among the first deformed grating pattern image and the second deformed grating pattern image.
- a first phase distribution and a second phase distribution are calculated respectively with regard to a range in which the surface reflectivity changes and a range other than that in which the surface reflectivity changes. Further, the first phase distribution and second phase distribution are connected at a positions where the surface reflectivity changes.
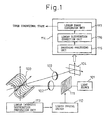
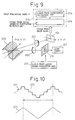
- Fig. 1 shows an outline of a grating pattern projector using a liquid crystal grating.
- the light source 101 is constructed from a light source for lighting such as a halogen lamp or the like, and emits a white light onto a liquid crystal grating 111 placed in front thereof.
- the liquid crystal elements that form the liquid crystal grating 111 are formed in a straight striped electrode pattern, N in number, having a constant pitch and shape as explained above, and are driven by a liquid crystal driver 112.
- the grating pattern having a linear intensity distribution is prepared from the liquid crystal grating 111.
- Linear intensity distribution data is prepared by a linear intensity distribution preparation unit 113, and drives the liquid crystal driver 112.
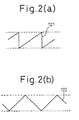
- Fig. 2(a) shows a first waveform example having a linear intensity distribution.
- the waveform 121 is a waveform example having a saw tooth wave form in which the intensity increase area changes continuously and the intensity decrease area changes suddenly in a step form.
- Fig. 2(b) shows a second waveform example having a linear intensity distribution.
- the waveform 122 is a triangular waveform in which the intensity increase area and the intensity decrease area both change continuously and the widths of the intensity increase area and the intensity decrease area are equal. Although the waveforms 121 and 122 both have linear intensity distributions, the triangular wave intensity distribution shown in the waveform 122 is more favorable.
- the liquid crystal grating 111 projects a grating pattern having a linear intensity distribution through a projection lens 102 and onto the object 100 whose three dimensional shape is to be measured.
- the grating pattern deforms (curves) according to the irregularities in the surface of the object 100, and a two dimensional image of the deformed grating pattern is detected by an image detection unit 104 comprising a CCD camera or the like, via a pickup lens 103 from a direction different from the projection direction.
- the detected deformed grating pattern image includes data relating to the irregularities of the object 100.
- the detected deformed grating pattern image is processed by a arithmetic processing portion 114 to measure the three dimensional shape of the object 100.
- the arithmetic processing unit 114 performs image processing and the like on the deformed grating pattern having a linear intensity distribution, and is constructed from a smoothing arithmetic processing unit 115, a linear distribution correction unit 116, linear phase conversion unit 117, and the like.
- the projected grating pattern due to the effect of the pixels of the liquid crystal grating 111 being discretely formed, the effect of the lens characteristics of the projection optical system, and the like, has an intensity distribution that does not change to a linear intensity distribution, but instead changes to a non-linear somewhat stepped shape.
- the deformed grating pattern image is smoothed by the smoothing arithmetic processing unit 115 by a method of moving averages or the like, to convert it into an image whose intensity distribution changes smoothly.
- the image is further processed by the linear distribution correction unit 116 and converted into an image having a linear intensity distribution.
- the linear intensity distribution corresponds to the three dimensional shape of the object 100.
- the corrected intensity distribution is standardized and converted into a phase distribution.
- the linear phase conversion unit 117 detects the maximum intensity and minimum intensity of each cycle of the deformed grating pattern image having linear intensity distribution, and converts the linearly changed values from 0 to 2 ⁇ between the maximum intensities or between the standardized minimum intensities to phases, with the maximum intensity and minimum intensity as standards.
- the phase distribution corresponds to the irregularities of the object 100
- the actual three dimensional shape is obtained by the triangulation method described above using the phase distribution.
- the device structure shown in Fig. 1 is an example in which a three dimensional shape is measured from a single deformed grating pattern image, by projecting a grating pattern having a linear intensity distribution onto the object 100 only once.
- the above method is effective where the object 100 has a single surface reflectivity.
- the operation of the arithmetic processing unit 114 will be explained in detail using the intensity distribution waveform example of the deformed grating pattern shown in Fig. 3. It will be explained with the example of a deformed grating pattern having the triangular wave intensity distribution indicated by the waveform 122 of Fig. 2(b).
- Reference number 131 of Fig. 3 is the intensity distribution of the liquid crystal grating 111, and the intensity distribution in the period L of one cycle changes to linear with a step shape.
- the step shape is due to the electrodes of the liquid crystal grating 111 being formed discretely, a discrete intensity distribution drive signal being applied, and the number of gradations of the linear intensity distribution being kept to a small number.
- the intensity distribution of the present embodiment is a case where there are eight gradations in one cycle of the grating pattern.
- waveform 132 of Fig. 3 is a waveform that exhibits changes in the intensity level of the triangular wave intensity distribution 131 indicated by gray gradations, intensities changing in a step form.
- the grating pattern having this intensity distribution is projected onto to the object 100, image blurring occurs due to diffraction expansion, the characteristics of the projection optical system, and the like. Accordingly, the step width of the intensity distribution on the surface of the object 100 decreases, and the intensity distribution becomes somewhat a intensity distribution such as the waveform 133 of Fig. 3.
- the deformed grating pattern image detected by the image detection portion 104 is converted to a signal in which the intensity changes substantially smoothly in the smoothing arithmetic processing portion 115 using a method of moving averages.
- a straight line approximation is performed on the smoothed signal in the linear distribution correction portion 116, to convert it to a signal that changes linearly.
- image processing is performed in a state where the number of gradations of the deformed grating pattern is high.
- the waveform 134 of Fig. 3 is an example of a signal that has been straight line approximated by the linear distribution correction portion 116.
- an intensity distribution that changes linearly is converted to a phase distribution that changes linearly.
- the maximum intensity of the signal 134 is Vm and the minimum intensity is Vn.
- the intensities Vm and Vn are constant at any location.
- the intensities in each cycle are standardized by setting Vm to 1 and Vn to 0.
- a straight line type proportional process is performed with the phase of the maximum intensity position as 0 and the phase of the minimum intensity position as ⁇ , so that the phase of any intensity position within one cycle can be made a value within the range of 0 to 2 ⁇ . Consequently, phases that do not rely on the value of the intensity can be obtained.
- phase calculation accuracy is increased compared to the case of prior art sine wave intensity distributions. Also, even if it is a grating pattern having an intensity distribution that changes in step form with coarse gradations, by converting it into a continuous straight line intensity distribution, it becomes equivalent to preparing a grating pattern having a high number of gradations, improving in-plane resolution. Further still, in the case of an object with the same surface reflectivity, the measurement time can be shortened by not performing phase shifting.
- the operation in cases where the object 100 has a plurality of surface reflectivities will be explained.
- the surface of the object 100 is constructed from a plurality of materials having different reflectivities, it cannot be distinguished whether the intensity fluctuations have occurred due to irregularities or fluctuations in the surface reflectivity with only one deformed grating pattern image.
- two types of grating patterns having different intensity distributions are projected onto the object 100.
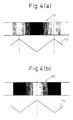
- the intensity distribution 141 of Fig. 4(a) is identical to the intensity distribution 131 of Fig. 3, and is the intensity distribution of a first grating pattern whose intensity changes in a step form and linearly.
- the waveform 142 as explained by Fig. 3, is a signal in which a first deformed grating pattern image is corrected to a linear intensity change.
- the intensity distribution 143 of Fig. 4(b) is the intensity distribution of a second grating pattern, whose phase has been shifted (inverted) by ⁇ with respect to the intensity distribution of the first grating pattern.
- the waveform 144 similarly to the waveform 142, is a signal in which a second deformed grating pattern image is corrected to a linear distribution.
- Fig. 5 is the distribution of the surface reflectivity of the object 100, the surface reflectivity differing between an area 145 and an area 146.
- the first grating pattern and second grating pattern having the same pitch but whose intensity distributions are inverse are each projected sequentially onto the object 100, and a first deformed grating pattern and second deformed grating pattern whose phases differ by ⁇ are sequentially detected.
- the point that fluctuations in the surface reflection state of the object can be determined from fluctuations in the combined intensity distributions of the two types of deformed grating patterns, and the point that the boundary positions where the reflectivity changes can be detected, differ from the prior art.
- the waveform 151 indicated by the solid line in Fig. 6 is a first deformed grating pattern intensity signal
- the waveform 152 indicated by the broken line is a second deformed grating pattern intensity signal.
- the intensity fluctuations of the two deformed grating patterns are compared to detect fluctuations in the reflection state of the surface.
- the waveforms 151 and 152 both have the same maximum intensity and minimum intensity and both have intensities that change linearly, in the single cycle intervals 161 and 162. Further, in the single cycle intervals 161 and 162 the intensity sum of the two signals is constant. As a result, the reflectivity of the surface is determined to be the same in these intervals.
- standardization and proportional processing of the intensities shown in Fig. 3 are performed on either one of the signals of the waveforms 151 and 152, to convert it to phase that changes linearly.
- the solid line waveform 153 and the broken line waveform 154 are the linear intensity signals of the first deformed grating pattern and the second deformed grating pattern.
- the signal intensities differ in the single cycle intervals 163 and 164.
- the intensities change linearly across the entire cycle, the maximum intensities and minimum intensities are the same as those of the interval 161 described above, and the sum of the intensities is constant.
- the intensities change discontinuously and the values of the maximum intensities and minimum intensities differ from those of the interval 163.
- the waveform 155 is the change in the sum of the intensities of the two waveforms 153 and 154, and the sum of the intensities change discontinuously at the boundary positions of the interval 165. Thus, it is determined that the reflection state of the surface has changed in the interval 165.
- the reflectivity of the interval 165 is higher than the reflectivity of the interval 163.
- the waveform 156 is a phase distribution that changes linearly.
- the waveform 156 is a phase that changes within a range of from 0 to 2 ⁇ in one cycle, converted from the intensity distribution of either one of the first deformed grating pattern and the second deformed grating pattern by the method described above.
- the intensity in the interval 163 is constant, the intensity is converted to a phase by proportional processing.
- the intensity in part of the cycle 164 differs for an interval, the intensity cannot be converted to a phase by simple proportional processing.
- the intensity is converted to the first phase (o to ⁇ and ⁇ to 2 ⁇ ) indicated by the solid line.
- interval 165 (corresponding to the second phase) within interval 164, proportional processing is performed on the intensity to convert it to a second phase ( ⁇ to ⁇ ). Then, at the positions where the intensity is discontinuous (A and B in Fig. 6), the first phase and the second phase are smoothly connected. By this means, the second phase is arranged at the position indicated by the broken line (157 in Fig. 6).
- the phases are detected according to irregularities only, without being influenced by intensity fluctuations due to surface reflections.
- the number of phase shifts can be low, and the measurement time is shorter than the case of the prior art phase shift.
- a single grating pattern is projected where the surface of the object is the same reflective materials, and where the reflective materials differ, the grating patterns to be projected are selected according to the reflection state of the surface so that only two grating patterns are projected.
- the liquid crystal grating 111 has a striped electrode structure and is driven by a static type drive signal.
- the reference number 170 of Fig. 7 indicates an example of the stripe electrode structure.
- the stripe electrodes 170 are constructed from N number of pixels 171, 172,... that are continuous in the vertical direction and discretely independent at a constant pitch in the horizontal direction. At this time, with regard to the width of the pixels in the horizontal direction, these have a structure wherein the gaps between the pixels are made narrow to increase the efficiency of light use (high aperture rate).
- a single common electrode having the same potential over its entirety is formed on a glass substrate on the side opposite the glass on which the stripe electrodes are formed. Also, color filters such as those used for television displays and the like are removed and a monochromatic grating pattern is projected.
- the number of grating patterns is N/(n x m).
- the light transmittance characteristic of the liquid crystal is determined according to the effective voltage applied between the common electrode and stripe electrodes.
- the drive signal is prepared from the linear intensity data prepared by the linear intensity distribution preparation unit 113 so that an effective voltage value corresponding to the linear intensity can be obtained.
- the electrode structure of the liquid crystal grating of the present invention has one common electrode opposite the stripe electrodes, a static type drive system can be applied.
- the liquid crystal drive signal when static driving is performed, it is a rectangular wave signal having two intensity levels.
- the effective voltage is changed by changes to the phase of the signal applied to the stripe electrodes with respect to a common signal applied to the common electrode. Due to the static drive driving each of the individual stripe electrodes, an arbitrary voltage can be applied to each electrode and the drive margin limit of the liquid crystal is small.
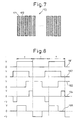
- Fig. 8 shows an example of a liquid crystal drive signal waveform when a linear intensity distribution is realized.
- the signal 181 is a common signal applied to the common electrode, and is a rectangular wave signal in which one cycle has intensity levels (0 to V) of values 2T and 2, and the duty ratio is 50% (the H level and L level intervals are equal).
- Signals 182 and 183 are rectangular signals both applied to the stripe electrodes, have the same cycle, duty ratio and voltage levels as the common signal 181, and different phases to the common electrode 181.
- Signal 182 has a small phase difference to the signal 181, while the signal 183 has a large phase difference to the signal 181. Comparing signal 182 and signal 181, the interval during which they both have a common voltage within one cycle is long.
- Signal 184 and signal 185 are between electrode voltage signals, applied between the electrodes facing the liquid crystals. Signals 184 and 185 correspond respectively to the drive signals 182 and 183.
- the effective voltage because it is determined according to a phase difference of signals applied to the common electrode and stripe electrodes, modulates the phase with respect to the common electrode 52 according to the strength of the linear intensity.
- the pulse width of the stripe electrode drive signal which coincides with the potential of the common signal, is modulated, and the linear intensity is set freely. In this manner, the signal 182 becomes a signal set to a small linear intensity, and signal 183 becomes a signal set to a large linear intensity.
- a high contrast, low noise grating pattern can be prepared.
- a signal whose phase is changed with respect to the signal 181 is prepared so that the intensity of the linear distribution is changed in proportion.
- the effective voltage can be adjusted by adjusting the width in one cycle.
- a liquid crystal grating formed by liquid crystal elements is used so that the pitch length and intensity distribution of the projected grating pattern are freely adjustable.
- the intensity distribution of the grating pattern projected onto the object is set so that it has a linear intensity distribution within one cycle of the grating pattern.
- the grating pattern in particular, is preferably set so that the width of an area where the intensity increases linearly and the width of an area where it decreases linearly are equal, the amplitudes of each of the intensity increase area and decrease area are also equal, and it has a symmetrical triangular wave intensity distribution.
- the single phase linear signal that creates the linear intensity distribution grating pattern is a linear signal whose voltage is discrete and stepped within one cycle of the grating pattern, a signal that changes symmetrically every half cycle, and a signal for driving the liquid crystal grating.
- the voltage step width is set according to the number of gradations that dictate the fineness of the intensity distribution, by the single phase linear signal. When the gradations are to be increased and the intensity of the grating pattern changed in small increments, the voltage step width is set small.
- the intensity distribution of the grating pattern projected by the liquid crystal grating makes a substantially continuous linear intensity distribution pattern due to a diffraction effect caused by the grating pattern, an image blurring effect on the grating edge portions caused by the optical system, or the like.
- the higher the gradation the more the surface density of the grating pattern is improved.
- the grating pattern having the linear intensity distribution according to the present invention can be processed as a grating pattern of substantially the same quality as a grating pattern having high gradation, even if the gradation is not set high, by giving it a linear distribution and using the image processing method to be described below.
- a drive signal having a linear distribution of approximately eight gradations for example can be prepared.
- the grating pattern is projected onto the object once only, a deformed grating pattern image of one phase only is detected and stored, and a three dimensional shape is calculated by processing the single phase image signal.
- the arithmetic process is performed by detecting peak intensities (maximum intensity and minimum intensity) of each cycle of the single phase image signal and pixel positions where the peak intensities are obtained, and detecting fluctuations in the rate of intensity change. Further, the surface reflection state of the object is detected from the peak intensities, and changes in the irregular shape of the object are detected from the rate of intensity change, In particular, the rate of intensity change is an important value that corresponds to changes in fine irregularities in the object existing within one cycle of the deformed grating pattern.
- Detection of the peak intensities and rate of intensity change is not detection by intensities between two continuous pixels, but detection from intensities between pixels separated by a preset step only (stepped pixels interval).
- the rate of intensity change is detected from a difference value in the intensities of stepped pixel intervals.
- simplification and acceleration of the processing can be realized.
- the basic intensity distribution is linear, processing of stepped pixel intervals is possible. where the rate of intensity change in one cycle fluctuates, the rate of intensity change is discretely separated into segments.
- a plurality of slice intensity levels are provided in the rate of intensity change, the detected rate of intensity change and slice intensity levels are compared, and the rates of intensity change in the regions of the set slice intensity levels are separated.
- the width of the region where the rate of intensity change changes is used in the determination that takes place when they are separated. Accordingly, separation is not performed when the rate of intensity change fluctuates in small widths.
- the intensity distribution of the deformed grating pattern fluctuates due to irregularities in the object and surface reflectivity fluctuations.
- fluctuations in the intensity distribution of the single phase image signal are irregularities or fluctuations in reflectivity is distinguished, fluctuations in the peak intensities of the single phase image signal are detected.
- the peak intensities in each cycle of the single phase image signal are constant, the reflectivity within that range is determined to be constant and, if the peak intensities fluctuate, the reflectivity in the vicinity of positions where they change is determined to have fluctuated.
- the phase distribution for measuring the irregularities of the object is calculated based on rate of intensity change data.
- the phase distribution for measuring the irregularities of the object is calculated based on both peak intensity and rate of intensity change data.
- the intensity distribution of the single phase image signal changes if the irregularities of the object change, the irregularities of the object are detected from fluctuations in the rate of intensity change.
- the rate of intensity change of the single phase image signal is a positive/negative equal value.
- the rate of intensity change appears as an absolute value. If the absolute value of the rate of intensity change in one cycle of the single phase image signal is constant, because the signal intensity during that interval undergoes a constant linear change, the irregularities of the object have the same constant gradient. If the absolute value of the rate of intensity change in one cycle fluctuates, the gradient of irregularities of the object during that interval change.
- the irregular shape of the object is calculated from the phase distribution according to the rate of intensity change of the single phase image signal.
- the rate of intensity change changes not only due to the irregular shape but also due to reflectivity fluctuations in the object, fluctuations in rate of intensity change due to reflectivity fluctuations are cancelled out, and rates of intensity change due to irregularities are extracted to calculate phase distribution.
- the rate of intensity change at a position where the reflectivity changes changes stepwise in widths of a few pixels.
- the rate of intensity change that occurs in this case is canceled as a type of noise. If the rate of intensity change in one cycle of the single phase image signal is constant, it is converted to a phase that changes linearly with a uniform gradient across the entire cycle. If the rate of intensity change in one cycle of the single phase image signal fluctuates, a phase distribution that changes linearly in each range separated according to the size of the fluctuation is calculated.
- the phase difference between maximum intensities or between minimum intensities of the single phase image signal within that cycle is standardized to 2 ⁇
- a phase is allocated to each pixel position from a proportional relationship between a standard number of pixels in maximum intensity gaps or minimum intensity gaps and each pixel position, and phases that change linearly within one cycle are calculated.
- the phases are not calculated from the ratio of the intensity of each pixel position to the peak intensities, but rather the pixel positions in one cycle are converted directly to linear phases.
- the basic shape of the intensity distribution can be linear, and simplification and acceleration of the arithmetic processing can be realized.
- the single phase image signal is a symmetrical triangular wave signal
- the phase difference at intervals of half a cycle in regions where the intensity increases and regions where it decreases can be standardized to ⁇ and allocated to phases that change linearly with each range, and the phases can be connected later.
- the phase difference between maximum intensities or between minimum intensities of the single phase image signal within that cycle is standardized to 2 ⁇ , and a phase is allocated to each pixel position within each region according to a proportional relationship between a standard number of pixels in maximum intensity gaps or minimum intensity gaps and each pixel position, and the slice intensity level of each region.
- the phase of each region is connected at boundary positions where the rate of intensity change changes, and a phase distribution in which gradients in one cycle differ but change linearly within each region is calculated.
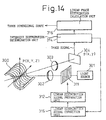
- FIG. 9 shows an outline of a grating pattern projection apparatus using a liquid crystal grating.
- a light source 201 is constructed from a white light source for lighting such as a halogen lamp or the like, and emits a white light onto a liquid crystal grating 211.
- a single phase linear signal preparation unit 212 prepares a single phase linear signal whose intensity during one cycle changes linearly and applies it to the liquid crystal grating 211.
- the liquid crystal grating 211 creates a grating pattern having a linear intensity distribution according to the single phase linear signal, and projects it through a projecting lens 202 onto the object 200 whose three dimensional shape is to be measured.
- Fig. 10 shows a waveform example having a linear intensity distribution.
- the waveform 221 is the waveform of a single phase linear signal for driving the liquid crystal grating 211
- the waveform 223 is an intensity distribution waveform of a grating pattern having a linear intensity distribution.
- the single phase linear signal 221 is a signal whose voltage is discrete, which has a stepped waveform, and which changes in linear steps, and the interval of one cycle of which is L.
- the liquid crystal grating 211 has a structure in which the pixels are separated and independent, and due to reasons such as limitations when preparing the drive signal and the like, is driven by voltage that changes stepwise.
- the step voltage and the number of liquid crystal pixels to which the same voltage is applied are set according to the size and number of liquid crystal pixels, the number of grating patterns projected, the intensity gradation, and the like.
- the example of Fig. 10 is a five gradation signal having five levels between the minimum intensity and the maximum intensity.
- the waveform 222 indicated by the dotted line in Fig. 10 is a triangular wave signal that is symmetrical in the interval of once cycle, has had its intensity changed to link the central portions of the stepped wave, in which the widths of the intensity increase regions and the intensity decrease regions are equal, and which has the same voltage amplitude as the waveform 221.
- the waveform 223 is the intensity distribution waveform of the grating pattern projected onto the object 200 and has a symmetrical triangular intensity distribution corresponding to the waveform 222. Even if the voltage of the single phase linear signal is a step shape, the projected grating pattern has a distribution whose intensity changes substantially continuously.
- the grating pattern projected onto the object 200 distorts according to the irregularities in the surface of the object 200, and a two dimensional image of the deformed grating pattern is detected by a single phase image detection unit 204 comprising a CCD camera or the like, via a pickup lens 203 from a direction different from the projection direction, and stored.
- the present invention is a structure that image processes by projecting one (single phase) grating pattern, and detecting one (single phase) deformed grating pattern only.
- the basic shape of the intensity distribution of the single phase deformed grating pattern is a linear intensity distribution corresponding to the projected grating pattern.
- the single phase image signal whose intensity changes linearly and which was detected by the single phase image detection portion 204 is image processed by the single phase linear image processing portion 214 and the three dimensional shape of the object 200 is calculated.
- the single phase linear image processing unit 214 is constructed from a single phase signal intensity fluctuation detection unit 215 for detecting fluctuations in the intensity of the single phase image signal, and a linear phase distribution calculation unit 216 for calculating a linear phase distribution according to the detection result of the intensity fluctuation of the single phase signal.
- the intensity of the single phase image signal fluctuates according to changes in the irregularities of the surface and the surface reflectivity of the object 200. Fluctuations are detected from the symmetrical linear distribution which is the basic intensity distribution of the single phase image signal, the phase distribution corresponding to these fluctuations are calculated, and the irregular shapes are measured. Accordingly, in the present invention, detection of the intensity fluctuations of the linear single phase image signal is an important requisite.
- the single phase signal intensity fluctuation detection unit 215 detects the sizes of peak intensities of the signal and the pixel positions which are the peak intensities in each cycle of the single phase image signal, and detects fluctuations in the rate of intensity change occurring in each cycle of the single phase image signal.
- the sizes and positions of the peak intensities are detected from the intensities between step pixels, and the rate of intensity change is detected from the difference in intensities between step pixels. If the rate of intensity change within one cycle is constant, the intensity of the single phase image signal in one cycle changes with a constant gradient, and the irregularities are constant. If the rate of intensity change in one cycle fluctuates, the gradient of the intensity of the single phase image signal in one cycle changes, and the irregularities fluctuate. At this time, a distinction of reflectivity fluctuation and irregularity fluctuation is performed according to pixel widths where the rate of intensity change occurs.
- the linear phase distribution calculation unit 216 calculates the phase distribution that changes linearly in each cycle of the single phase image signal based on the intensity fluctuation detection result of the single phase signal intensity fluctuation detection unit 215. If the rate of intensity change within one cycle is constant, a phase distribution that changes linearly with a uniform gradient across the entire cycle is calculated. At this time, the interval of maximum intensity and the interval of minimum intensity of the single phase image signal is taken as one cycle, and the phase difference of a standard pixel interval is standardized to 2 ⁇ . Also, the phase determined by the proportional relationship between the number of pixels in a standard pixel interval and each pixel position is allocated to each pixel position, to calculate a phase that changes linearly as a whole.
- the rate of intensity change in one cycle fluctuates, a number of slice intensity levels are provided with respect to the rate of intensity change. Then, the detected rate of intensity change is compared to the set slice intensity level, is divided into a number of discrete rate of intensity change regions, and detected together with the pixel positions where these region change. At this time, separation is not performed if the pixel width in the regions where the rate of intensity change changes is small.
- the rate of intensity change within each of the regions is assumed to be constant and a phase distribution that changes linearly in each region is calculated.
- the phase difference of a standard pixel interval in one cycle of the single phase image signal is standardized to 2 ⁇ , and a phase distribution that changes linearly within the limits of the regions is calculated according to the proportional relationship between the standard number of pixels and pixel positions within the regions, and the size of the rate of intensity change.
- the phases in each region at the boundary positions where the rate of intensity change changes are connected, and a phase distribution is calculated that changes linearly in each of the segments of one cycle.
- the specific operations of the single phase signal intensity fluctuation detection unit 215 and the linear phase distribution calculation unit 216 will be explained using the various waveform examples shown in Fig. 11.
- the waveform 230 of Fig. 11 is an example of a single phase image signal waveform
- waveform 231 is an example of a rate of intensity change waveform
- waveform 232 is an example of a phase distribution waveform.
- fluctuations in the intensity level of the single phase image signal 230 and the rate of intensity change waveform 231 are calculated, and the phase distribution waveform 232 is calculated from these data.
- the single phase image signal 230 of Fig. 11 has a half cycle intensity fall interval 241 and a half cycle intensity rise interval 242 in the interval 251 of one cycle, both the intervals 241 and 242 having their intensities changing linearly at a uniform gradient at a value P where the amplitude is constant.
- the reflectivity of the object 200 is determined to be constant, and pixel positions g1 and g2 of maximum intensity taken as the standard positions of one cycle are detected and stored. Also, if the intensity of the single phase image signal 230 fluctuates minutely due to noise and the like, after being converted to a signal whose intensity changes smoothly by being smoothing processed or the like, it can be subjected to signal processing.
- the rate of intensity change waveform 231 of Fig. 11, in the fall interval 241 and rise interval 242 of the one cycle interval 251, has a constant size value whose size is equal but whose sign differs (-Sp and Sp). To express this as an absolute value, in the one cycle interval 251, the rate of intensity change is constant. Accordingly, the reflectivity of the object 200 in this interval is constant and irregularities are also constant.
- the phase distribution waveform 232 of Fig. 11 due to the absolute value of the rate of intensity change being constant between the pixel g1 and pixel g2 of the one cycle interval 251, has a phase in the interval 251 which changes continuously and linearly from 0 to 2 ⁇ .
- the phases at the position of the pixel g1 and the position of the pixel g2 are respectively 0 and 2 ⁇ .
- the phase of each pixel position is not calculated from the intensity of each pixel position with respect to the amplitude P of the single phase image signal 230, but rather the phase of each pixel position is calculated from the proportional relationship of the number of pixels and the pixel positions.
- the intensity changes discontinuously in the interval 253 therein, and the minimum intensity also changes.
- the rate of intensity change waveform 231 in this case changes discontinuously and stepwise at the positions 247 and 248. Where the rate of intensity change changes stepwise, a determination that the reflectivity only has changed is performed. Accordingly, even if fluctuations occur in the rate of intensity change, they are not compared to a slice intensity level and are separated into rate of intensity change regions.
- the rate of intensity change of the intensity fall interval 245 and intensity rise interval 246 of the interval 253 is a value the same as in the case of the interval 251.
- the rate of intensity change in intervals 243 and 244 on both sides of the interval 253 within the one cycle interval 252 is a value equal to the rate of intensity change in the interval 251.
- the entirety of the interval 252 is the same irregularity shape, and the same irregularity shape as the interval 251.
- the phase of each pixel position is calculated from the proportional relationship between the standard number of pixels in the one cycle interval 252 and each pixel position. Consequently, as an entire cycle, a phase that changes continuously from 0 to 2 ⁇ is calculated. In this way, even if a stepwise fluctuation occurs in the rate of intensity change, the phase distribution can be calculated without receiving that effect,
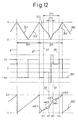
- the waveform 260 of Fig. 12 is a waveform example of a single phase image signal
- the waveform 261 is a waveform example of a rate of intensity change
- the waveform 262 is a waveform example of a phase distribution.
- a case is shown wherein, although the reflectivity in one cycle is constant, the rate of intensity change fluctuates.
- the interval 251 of one cycle is the same as in the case of Fig. 11, and the rate of intensity change in that interval is constant.
- the rate of intensity change changes in the interval 272 within the cycle, and the rate of intensity change changes further in the interval 273 therewithin. Since the peak intensity of the single phase image signal in the interval 271 in one cycle is a constant value P, the reflectivity in that interval is constant and the irregular shape changes.
- the rate of intensity change is greater than in the interval 251, and in the other intervals within the interval 272, the rate of intensity change is less than in the interval 251. Also, the rate of intensity change in the other intervals 243 and 244 within the interval 271 is the same as in interval 251. Further, several slice intensity levels of the rate of intensity change are provided. In addition, the rate of intensity change obtained from the single phase image signal and the slice intensity levels are compared, and the rate of intensity change is separated into segments having discrete slice intensity levels.
- the waveform 261 of the rate of intensity change is a waveform that indicates a rate of intensity change separated into segments of discrete slice intensity levels.
- interval 271 pixel positions g3, g4, g5 and g6 where the segments change are detected and stored.
- the rate of intensity change is large, the change in irregularities also appears large, and when the rate of intensity change is small, the change in irregularities also appears small.
- the reflectivity in interval 271 is constant and the pixel width (region) in each segment is broad, separation is performed for each segment.
- the waveform 262 of phase distribution in interval 271 is a phase calculated distribution that changes linearly in each segment.
- the phase of each pixel position is calculated from the proportional relationship between the standard number of pixels in one cycle interval and each pixel position.
- the gradient of the phase change of each region is made different according to the size of the rate of intensity change. where the rate of intensity change is large, the rate of change of the phase corresponds to large. Because this rate of intensity change is discretely classified, the gradient of the phase change is determined according to this classification.
- phase widths of each region are taken as ⁇ 1, ⁇ 2, ⁇ 3, ⁇ 4 and ⁇ 5, and continuity of the phases at the boundaries of each region is performed.
- the phases at each boundary are respectively ⁇ 1, ⁇ 2, ⁇ 3 and ⁇ 4, and phases that change linearly in each region from 0 to 2 ⁇ over the entire cycle are calculated.
- the phase distribution can be simply and precisely calculated.
- Fig. 13 shows a flow chart of the arithmetic process when calculating the phase distribution within one cycle of the single phase image signal according to the present invention.
- Step 280 performs detection and storage of a single phase image signal of the deformed grating pattern image.
- Step 281 sets a step pixel number for performing processing of the single phase image signal, and takes the intensity at pixel positions separated into five pixels, for example, as the subject to be processed.
- Step 282 detects a peak intensity (maximum intensity or minimum intensity) within one cycle of the single phase image signal and the pixel positions which are peak intensities.
- Step 283 detects and stores a standard number of pixels in one cycle of a maximum intensity interval or a minimum intensity interval detected in step 282. This standard number of pixels is a standard when performing the following phase calculation.
- Step 285 determines the existence of irregularities and reflection fluctuations in one cycle, and determines this from data of both fluctuations of the peak intensities of step 282 and fluctuations in the rate of intensity change of step 284. Generally, if the peak intensity changes, the reflectivity changes, and if the rate of intensity change changes, the irregularity distribution changes. Also, where fluctuations of the rate of intensity change occur between stepwise narrow width pixels, it is determined that these are boundary positions where the reflectivity fluctuates. In the subsequent processing steps, only rates of intensity change due to irregularity fluctuations are extracted, according to the above determination result.
- step 286 the slice intensity levels, for separating the rate of intensity change into discrete segments, are set.
- Step 287 compares the slice intensity levels with the rate of intensity change detected in step 284, and separates the discrete rate of intensity change into segments. If the rate of intensity change does not fluctuate, the entire cycle is one segment. At this time, it is determined whether to separate the rate of intensity change according to the irregularity and reflectivity fluctuation determination result of step 285. For example, as indicated by 247 and 248 in Fig. 11, where the rate of intensity change changes stepwise in narrow widths, it is processed as a type of noise, and not separated.
- Step 288 the pixel positions of the boundaries of each segment are detected and stored.
- step 289 calculation of phases that change linearly in the region of each segment is performed.
- the rate of intensity change in each region is constant, positions in those regions change uniformly to linear.
- Phase processing takes the phase difference of the interval of one cycle as 2 ⁇ . If the rate of intensity change in the interval of one period is constant, the phase of each pixel position can be calculated from the proportional relationship between the standard number of pixels in one cycle interval and each pixel position. If the rate of intensity change in the interval of one period fluctuates, the phase of each pixel position in each region is calculated. In other words, in each region, the phase of each pixel position is calculated from the proportional relationship between the number of pixels included in a region and each pixel position, using the phase change gradient that changes linearly with the region.
- Step 290 is connection of the phases, and connects the phases calculated for each region at the boundary positions of each region. Accordingly, step 290, although there are kinks at the boundary positions of each region, calculates phase distributions that change linearly at different gradients across the entire cycle. Phase distributions of each cycle detected by the above procedure are converted to two dimensional phase distributions, and three dimensional shapes are calculated from the two dimensional phase distributions.
- the present invention projects onto an object a single phase grating pattern having a linear intensity distribution by driving a liquid crystal grating with a single phase linear signal, detects a only single phase deformed grating pattern image, and image processes a single phase image signal.
- image processing of the single phase image signal in particular, fluctuations in a rate of intensity change are detected, a phase distribution the changes linearly according to the detected fluctuations is calculated, and a three dimensional shape is measured from the calculated phase distribution.
- a liquid crystal grating formed by liquid crystal elements is used so that pitch length and intensity distribution of the projected grating pattern can be freely adjusted by electric signals.
- the intensity distribution of the projected grating pattern is an important requisite that determines measurement resolution measurement time and, in particular, gradations must be imparted on the intensity distribution in each cycle in order to increase resolution.
- the intensity distribution of the grating pattern is set to have a linear intensity distribution in each single cycle.
- this linear intensity distribution is preferably a symmetrical triangular waveform distribution in which the length and amplitude of a region where the intensity increases linearly and a region where the intensity decreases linearly are both equal.
- a linear distribution signal is prepared to drive the liquid crystal grating.
- the linear distribution signal is a signal in which an effective voltage for driving the liquid crystal grating is discrete and changes stepwise and linearly, and is set to a signal that changes symmetrically every half cycle of the grating pattern.
- the number of steps when the effective voltage changes stepwise corresponds to the number of gradations of the grating pattern intensity.
- the intensity distribution of the grating pattern projected from the liquid crystal grating is an intensity distribution pattern that changes substantially continuously and linearly. This is for the reasons of diffraction due to the minute electrodes of the liquid crystal grating and the image blurring effect at the edge portion of the grating due to the projection optical system. This improves the surface density of the grating pattern to the extent of a high intensity gradation in a sine wave or the like.
- a grating pattern having a linear intensity distribution is a grating pattern having the same quality as one with a high number of gradations and having a substantially continuous and linear intensity distribution, even if the number of gradations is not increased. As a result, even with a low number of gradations, such as eight or thereabouts for example, a highly precise linear intensity distribution can be attained.
- the liquid crystal grating is driven by a linear distribution signal that generates an effective voltage that sets the liquid crystal grating with a linear intensity distribution, and a two dimensional image of the grating pattern projected onto an object is detected.
- a linear distribution signal that generates an effective voltage that sets the liquid crystal grating with a linear intensity distribution
- a two dimensional image of the grating pattern projected onto an object is detected.
- the present invention detects the non-linear characteristic of the intensity distribution of the grating pattern and the position where the non-linear characteristic occurs, controls the drive effective voltage of the liquid crystal grating by changing the linear distribution signal according to the extent and position of the non-linear characteristic, and automatically corrects it to a linear intensity distribution grating pattern.
- a preliminary grating pattern is projected on the object, and the non-linear characteristic is determined from the intensity distribution of a detected preliminary deformed grating pattern image.
- the image of a specific partial range within the detected two dimensional image is taken as the subject of the determination, and the existence of a non-linear characteristic in the intensity distribution is determined from fluctuations in a difference intensity which is the difference in image intensity between previously set pixel step intervals in that image region.
- the pitch of the grating pattern is short, the existence of a non-linear characteristic is determined by fluctuations in the difference intensity of an adjacent pixel interval.
- the pitch of the grating pattern is long or where determination of the non-linear characteristic is simplified, the existence of a non-linear characteristic can be determined by a discrete pixel interval difference intensity.
- the absolute value of the difference intensity within one cycle is constant.
- the absolute value of the difference intensity within the one cycle fluctuates.
- a slice intensity level is provided for the difference intensity, and the difference intensity and slice intensity level are compared and determined. If fluctuations of the absolute value of the difference intensity are present in the slice intensity level, the absolute value of the difference intensity is taken to be substantially constant and intensity distribution is determined to be a linear intensity distribution. In this case, actual measurement is performed, fluctuations in the intensity distribution of the deformed grating pattern image are image processed and the three dimensional shape is measured.
- the intensity distribution is determined as having a non-linear characteristic.
- the non-linear characteristic occurs in the vicinity of the peaks of the maximum intensity and minimum intensity of the intensity distribution. In such cases, a region of intermediate intensity between the maximum intensity and minimum intensity of the difference intensity exists. The extent of the non-linear characteristic is determined from a width where the intermediate intensity occurs. Also, the position where the non-linear characteristic occurs is detected from the position where the difference intensity fluctuates.
- an intermediate intensity is generated during the period when the difference intensity changes from a maximum intensity to a minimum intensity, it is determined that a non-linear characteristic has occurred in the vicinity of the maximum intensity, and if an intermediate intensity is generated during the period when the difference intensity changes from a minimum intensity to a maximum intensity, it is determined that a non-linear characteristic has occurred in the vicinity of the minimum intensity.
- the intensity distribution is determined to have a non-linear characteristic, it is corrected so that it becomes a linear intensity distribution.
- the first method of such correction is a method of changing the voltage and the phase between signals of the linear distribution signal to change the drive effective voltage of the liquid crystal grating. Where the non-linear characteristic is large, the drive effective voltage is changed to a larger voltage. Where a non-linear characteristic occurs in the vicinity of the maximum intensity of the intensity distribution, the drive effective voltage is controlled so that it is smaller, and where a non-linear characteristic occurs in the vicinity of the minimum intensity, the drive effective voltage is controlled so that it is larger.
- the second method of correcting the intensity distribution is a method of changing the number of gradations of the linear distribution signal and changing the effective voltage in accordance with the number of gradations. For example, where a non-linear characteristic occurs in the vicinity of the maximum intensity of the intensity distribution, the number of gradations is reduced and the drive effective voltage is controlled so that it decreases. when the number of gradations has been reduced, the length of one pitch of the grating pattern shortens. Where an inconsistency occurs in measurement due to a change in the grating pitch, adjustment is performed to change the cycle of the linear distribution signal so that the grating pitch lengthens. In this manner a grating pattern set to a linear intensity distribution is projected at an object, and a linear phase distribution is calculated according to the intensity distribution to measure a three dimensional shape.
- FIG. 14 an outline of a grating pattern projection apparatus using a liquid crystal grating is shown.
- a light source 301 is constructed from a white light source for lighting such as a halogen lamp or the like, and emits a white light onto a liquid crystal grating 311.
- the liquid crystal grating 311 is constructed by liquid crystal pixels arranged in a predetermined shape (for example striped shape pixel arrangement), and creates a grating pattern having an intensity distribution according to a drive effective voltage applied to each of the liquid crystal pixels.
- the grating pattern created by the liquid crystal grating 311 is projected through a projecting lens 302 onto the object 300 whose three dimensional shape is to be measured.
- the intensity distribution in one cycle of the grating pattern of the present invention is set to a linearly distribution.
- a linear distribution signal for setting the intensity distribution of the grating pattern to a linear distribution is prepared in the linear distribution signal preparation unit 312, and an effective voltage is applied to the liquid crystal grating 311 according to the voltage and phase of the linear distribution signal.
- the liquid crystal grating 311 Due to the liquid crystal grating 311 being constructed with its pixels separated and independent, it is driven by a discrete signal whose drive effective voltage changes in a step shape between pixels. At this time, the step voltage width and number of liquid crystal pixels to which this same step voltage is applied are set in accordance with the size and number of liquid crystal pixels, number of projected grating patterns, number of intensity gradations of the linear intensity distribution, and the like.
- the wave 320 of Fig. 15 is an example of an effective voltage for driving the liquid crystal grating 311, and the effective voltage changes symmetrically in a step shape at linear step widths in the interval L of one cycle.
- the linear distribution signal that generates this effective voltage will be described later.
- the waveform 320 is an example of a five gradation signal having five voltage levels between the minimum intensity and the maximum intensity, and the voltage 322 takes the light intensity A452 of Fig. 28(a), while the voltage 324 similarly takes the light intensity B453.
- the waveform 325 of Fig. 15 is a symmetrical triangular wave signal, has had its intensity changed to link the central portions of the stepped wave of waveform 320, and has intensity increase regions and intensity decrease regions whose widths are equal.
- the liquid crystal grating 311 is driven by the discrete signal 320 whose effective voltage changes stepwise and linearly, the actually projected grating pattern has a distribution in which the intensity changes substantially continuously. This is caused by the occurrence of a light blurring effect due to diffraction and the like resulting from the grating pitch of the liquid crystal grating 311 being short.
- the liquid crystal grating 311 is driven by a digitized signal 320, if the drive effective voltage is within the optimum drive voltage range for the liquid crystal grating 311, a grating pattern having a continuous linear intensity distribution such as waveform 325 can be attained.
- the grating pattern projected at the object 300 distorts according to the surface irregularities of the object.
- This deformed grating pattern is detected and stored as a two dimensional image by an image detection portion 304 comprising a CCD, via a projection lens 303 in a direction different to the direction that it was projected from.
- setting the grating pattern to one having a linear intensity distribution is an important requisite. Measurement errors occur when a grating pattern having a non-linear intensity distribution is projected. Therefore, before the actual three dimensional shape measurement, the grating pattern is provisionally projected at the object 300, and whether the intensity distribution of the detected deformed grating pattern image is correct and a linear distribution is determined by the intensity distribution determination portion 314.
- an image within a specified partial range of the deformed grating pattern image is subject to determination.
- a difference intensity which is the difference of the image intensity between adjacent pixels within the target region. Where the grating pitch is long or the determination of a non-linear characteristic is simplified, the difference in image intensity between a plurality of discrete pixel steps is detected and determined.
- the absolute value of the difference intensity in that one cycle is constant.
- the size of the absolute value of the detected difference intensity is recognized as substantially constant, it is determined to be a linear intensity distribution.
- correction of the intensity distribution is not executed, and a deformed grating pattern image is image processed to measure the three dimensional shape.
- the intensity distribution is determined to have a non-linear characteristic. In the above determination, a slice intensity level is provided, and it is determined whether the absolute value of the difference intensity exceeds the slice intensity level.
- the non-linear characteristic of an intensity distribution occur in the vicinity of maximum intensity and minimum intensity peaks.
- the absolute value of the difference intensity exists in a region close to 0.
- the extent of the non-linear characteristic is determined from the size of the intermediate intensity level of the difference intensity and the width where the intermediate intensity exists.
- the position at which a non-linear characteristic occurs is determined from the position at which the difference intensity fluctuates.
- a first method for executing correction of the intensity distribution is a method of changing the drive effective voltage applied to the liquid crystal grating 311. In the first method, the voltage level of the linear distribution signal and phase of the signal are changed. If a non-linear characteristic occurs in a maximum intensity region of the intensity distribution, correction is performed to reduce the drive effective voltage. If a non-linear characteristic occurs in a minimum intensity region of the intensity distribution, correction is performed to increase the drive effective voltage.
- a second method for executing correction of the intensity distribution is a method of changing the number of gradations of the drive effective voltage applied to the liquid crystal grating 311. For example, if a non-linear characteristic occurs in a maximum intensity region of the intensity distribution, correction is performed to reduce the number of gradations and reduce the drive effective voltage.
- the grating pattern corrected to a linear intensity distribution by the above controls is projected at the object 300 and a deformed grating pattern image detected.
- the basic shape of the intensity distribution of the deformed grating pattern is a linear intensity distribution according to the projected grating pattern.
- the deformed grating pattern image is image processed and a phase distribution that changes linearly is calculated according to the intensity distribution in the linear phase distribution calculations portion 316 to measure the three dimensional shape of the object.
- the electrode structure of the liquid crystal grating 311 in the present embodiment is the same as the structure explained by Fig. 7 with regard to the first embodiment. Also, when preparing a grating pattern with a linear intensity distribution, the example of the drive signal applied liquid crystal grating 311 is the same as the explanatory structure of Fig. 8 relating to the first embodiment.
- the intensity gradation in one cycle of the grating pattern is n, and the same voltage is applied to an m number of stripe electrodes per each intensity gradation, the number of grating patterns is N/(n x m).
- the present invention has the characteristic that, as it is set to linear intensity distribution, even if the number of gradations n is not increased, the same effects are attained as that for a high gradation. As a result, by reducing the number of electrodes m to which the same effective voltage is applied, the number of grating patterns can be increased, and high precision measurement is possible.
- Fig. 16 shows an example of the intensity distribution of a grating pattern prepared by an effective voltage set to a linear intensity distribution.
- the waveform 331 of Fig. 16 is a signal that changes stepwise while the effective voltage is between va and Vb, and is attained by a linear distribution signal.
- the waveform 332 of Fig. 17 is a transmitted light intensity characteristic with respect to a drive effective voltage of the liquid crystal elements.
- the line 334 is a low effective voltage V1 and the line 335 is a high effective voltage V2 drive. If the liquid crystal grating 331 is driven within the effective voltage range of V1 and V2, the transmitted light intensity changes linearly. Consequently, the effective voltages Va and Vb must be between V1 and v2.
- the waveform 336 of Fig. 18 is an example of a linear intensity distribution
- waveform 337 is an example of an intensity distribution having a non-linear characteristic. If the effective voltage range (va to Vb) of the waveform 331 is within the linear voltage range (V1 to V2) of the liquid crystal grating 311, a linear intensity distribution such as that of waveform 336 can be attained. However, even if the effective voltage of the waveform 331 changes linearly, if the voltage range thereof shifts from the linear voltage range of the liquid crystal grating 311, it becomes an intensity distribution having a non-linear characteristic as in the waveform 337.
- the intensity in the region 338 in the vicinity of the peak intensity saturates and changes so that it has a non-linear characteristic.
- the region 339 lower than the peak intensity linear intensity distribution is maintained.
- the present invention corrects an intensity distribution having a non-linear characteristic as in the waveform 337 to the linear intensity distribution of waveform 336.
- Fig. 19 an example of determination of the intensity distribution of a grating pattern is shown.
- whether the intensity distribution has a non-linear characteristic or not is determined from fluctuations in a difference intensity, using the difference intensity between specific pixels in the deformed grating pattern image detected by the image detection portion 313.
- Fig. 19(a) is a determination example of a case where the intensity distribution is linear.
- the waveform 341 is the waveform of a linear intensity distribution
- waveform 342 is the waveform of a difference intensity.
- the maximum intensity of the difference intensity is Sp
- the minimum intensity is -Sp
- the absolute values are each Sp.
- the absolute value of the difference intensity in the interval L of one cycle is constant. Because there is no fluctuation in the difference intensity, in this case it is determined that it is a linear intensity distribution. Consequently, correction of the intensity distribution is not performed.
- Fig. 19(b) is a case where intensity distribution has a non-linear characteristic.
- the waveform 343 has a non-linear characteristic in the vicinity of the maximum intensity, and the intensity changes to linear in the other regions.
- the waveform 344 is a difference intensity waveform, and the absolute value of the difference intensity in the region of the waveform 343 where the intensity distribution changes linearly is Sp.
- the difference intensity fluctuates and there is a region where the intensity distribution approaches 0. The smaller the rate of intensity change becomes in the vicinity of the maximum intensity, the closer the value of the difference intensity comes to 0.
- Line 346 and line 347 of waveform 344 are slice intensity levels (absolute value of Ss) that determine fluctuations of the difference intensity. Detected fluctuations of the difference intensity are compared with the slice intensity levels, and where the difference intensity exceeding the set slice intensity level fluctuates, it is determined that the intensity distribution has a non-linear characteristic.
- the position where a non-linear characteristic occurs can be determined from the position where the difference intensity fluctuates.
- the waveform 343 if a difference intensity close to 0 occurs in the interval during which the difference intensity changes from a maximum value to a minimum value, it is determined that a non-linear characteristic has occurred in the vicinity of the maximum intensity. If a difference intensity close to 0 occurs in the interval during which the difference intensity changes from a minimum value to a maximum value, it is determined that a non-linear characteristic has occurred in the vicinity of the minimum intensity. Further, the extent of the non-linear characteristic is determined by the size of the width at which the absolute value of the difference intensity is substantially close to 0. The above determination of the position and size of the non-linear characteristic is effective when correcting the intensity distribution.
- Fig. 20 and Fig. 21 show a method when correcting an intensity distribution having a non-linear characteristic to a linear intensity distribution.
- Fig. 20 is the light transmission characteristic with respect to the liquid crystal drive voltage, as shown in Fig. 17. If driven at the high voltage range 351 between the effective voltages V1 and V2 indicated by the two solid lines, the signal becomes saturated in the region where the intensity is high, as in the waveform 343 of Fig. 19(b). At this time, the effective voltage is corrected so that it becomes lower. Thus, the drive voltage shifts to the voltage range 352 between the effective voltages V3 and V4 indicated by the dotted lines. In this voltage range 352 saturation of the light intensity does not occur and the intensity distribution can be corrected to linear.
- the effective voltage is changed by changing the voltage levels V of the rectangular shaped linear distribution signals 181, 182 and 183 shown in Fig. 8. Also, the voltage V of the linear distribution signal is kept constant and the phases of the drive signals 182 and 183 applied to the stripe electrode can be changed with respect to the standard voltage 181 applied to the common electrode, to change the effective voltage.
- the above control of the effective voltage is performed according to the extent of the non-linear characteristic, if the non-linear characteristic is small, the change to the effective voltage is small, and if the non-linear characteristic is large, the change to the effective voltage is large. Also, the direction in which the effective voltage is changed according to the position where the non-linear characteristic occurs.
- the above correction is preferably feedback correction executed by repeating the determination and correction a number of times.
- FIG. 21 A second example of correcting the drive effective voltage is shown in Fig. 21.
- the waveform 353 of Fig. 21 shows an intensity gradation of the effective voltage applied to the liquid crystal grating 311.
- the waveform 353 has a minimum intensity Va, a maximum intensity vb, and seven gradations.
- the waveform 354 indicates an intensity gradation having a new effective voltage that corrects the intensity distribution.
- the waveform 354 changes the minimum intensity sets the maximum intensity from Va to Vc, and changes the number of gradations to 5. By reducing the number of gradations in the region where the effective voltage is high, the effective voltage can be lowered and the intensity distribution corrected to linear.
- the example shown in Fig. 21 is effective where the drive effective voltage is higher than the optimum voltage range.
- the grating pitch is shortened and a fault occurs, the number of stripe electrodes to which a voltage of the same gradation is applied can be increased and the pitch can be simultaneously corrected so that the grating pitch is substantially the same as the waveform 353. For example, if a fault occurs in the measurement of large irregularities due to two adjacent electrodes among the stripe electrodes 170 of Fig. 7 being driven by the same voltage, the grating pitch can be lengthened by driving four adjacent electrodes with the same voltage.
- Fig. 22 shows a flow chart for when the intensity distribution is determined and corrected.
- Step 360 when preparing a linear distribution signal, sets conditions such as number of gradations and pitch of the grating pattern, the drive effective voltage, and the like, prepares a linear distribution signal by modulating a phase difference between rectangular waveform signals as shown in Fig. 8, and drives the liquid crystal grating 311.
- Step 361 is a preliminary projection of the grating pattern, and is a projection performed to determine whether the intensity distribution of the grating pattern projected at the object is an optimum linear distribution.
- the intensity distribution of the grating pattern is a distribution according to the effective voltage of the linear distribution signal set in step 360, the surface reflectivity of the object, the brightness of the lighting source, and the like.
- Step 362 detects the two dimensional image of the grating pattern, and stores the image detected by the CCD camera or the like.
- Step 363 sets the range where determination of the intensity distribution of the image is performed, and extracts a partial range of the two dimensional image detected in step 362. By making only a partial range the target for determination, image processing is simplified.
- Step 364 is detection of the difference intensity, and detects a difference intensity which is the difference in image intensity between adjacent pixels within the set image range. The difference intensity indicates the rate of intensity change of an image and used in determining non-linear characteristics of intensity distributions.
- Step 365 is the setting of slice intensity levels with respect to the difference intensity, makes a specific intensity between the maximum value and the minimum value of the difference intensity a slice intensity level, and uses it to determine the size of a fluctuation and the position of a fluctuation of the difference intensity.
- Step 366 is a intensity distribution determination, and performs determination of whether the intensity distribution of a grating pattern has a non-linear characteristic.
- the fluctuation of the absolute value of the difference intensity detected in step 364 and the absolute value of the slice intensity level set in step 365 are compared. If the fluctuation of the absolute value of the difference intensity is less than the absolute value of the slice intensity level, the intensity distribution is determined as not having a non-linear characteristic, correction of the intensity distribution is not performed, and the intensity distribution correction routine is finished.
- Step 366 if the fluctuation of the absolute value of the difference intensity exceeds the absolute value of the slice intensity level, it is determined that the intensity distribution has a non-linear characteristic. At this time, the extent of the non-linear characteristic is determined from the size of the fluctuation of the absolute value of the difference intensity, and the position at which the non-linear characteristic occurs is determined from the position where the difference intensity fluctuates.
- Step 367 is a change to the linear distribution signal, and changes the linear distribution signal set in step 360 according to the non-linear characteristic detected in step 366 and the position where the non-linear characteristic occurs. The value of the new effective voltage based on the changed linear distribution signal is applied to the liquid crystal grating 311. Thereafter, the operation is repeatedly executed from step 362. If the intensity distribution becomes linear by way of repeated correction, the correction routine is finished.
- Fig. 23(a) is a case where a single phase triangular waveform grating pattern is projected.
- the waveform 370 is the intensity distribution of a projected grating pattern
- waveform 372 is the waveform of a phase distribution attained by image processing.
- the maximum intensity (Pm) and minimum intensity (Pn) of each cycle of the grating pattern waveform 370 having a linear intensity distribution are detected and stored.
- the phase distribution of the waveform 372 is the conversion of the intensities of each of the positions in the waveform 370 to linear phase distributions, with the peak intensities Pm and Pn in the interval L of one cycle of the waveform 370 as standards. Since the intensity distribution is a linear distribution, the phase distribution is calculated by simple proportional processing.
- Fig. 23(b) is a case where a dual phase linear grating pattern whose intensity distributions are reversed is projected onto an object.
- waveforms 374 and 376 show the intensity distributions of a projected grating pattern.
- the intensity distributions of the waveforms 374 and 376 are mutually inverse.
- the intensity sum at each position is constant, this is effective in cases where, for example, the surface reflectivity of the object fluctuates. If the reflectivity is constant the intensity sum is constant, and if the reflectivity fluctuates the intensity sum also fluctuates, therefore fluctuations in the reflectivity can be detected from fluctuations in the intensity sum.
- Fig. 23(b) is an example of a case where the intensity sum is constant and the reflectivity is constant.
- the waveform 378 is the same intensity distribution as the waveform 372 previously described.
- the intensity distribution of the waveform 378 is the intensities of each of the positions of the waveform 376 converted to a linear phase distribution, with the peak intensities Pm and Pn of the waveform 376, for example, as standards.
- the present invention creates a grating pattern having a linear intensity distribution, determines the intensity distribution of the grating pattern projected at an object, and automatically corrects it to a linear intensity distribution if there are non-linear characteristics.
- a difference intensity is used in the determination of intensity distribution, the size of a non-linear characteristic and the position where the non-linear characteristic occurs are detected from the size of a fluctuation of the difference intensity and the position of the fluctuation.
- the drive effective voltage of the liquid crystal grating is changed to correct the intensity distribution, according to the extent and position where the non-linear characteristic occurs.
Applications Claiming Priority (7)
| Application Number | Priority Date | Filing Date | Title |
|---|---|---|---|
| JP2000170083 | 2000-06-07 | ||
| JP2000170083 | 2000-06-07 | ||
| JP2000308718 | 2000-10-10 | ||
| JP2000308718 | 2000-10-10 | ||
| JP2000374059 | 2000-12-08 | ||
| JP2000374059 | 2000-12-08 | ||
| PCT/JP2001/004790 WO2001094880A1 (fr) | 2000-06-07 | 2001-06-06 | Projecteur de motif de reseau utilisant un reseau de cristaux liquides |
Publications (2)
| Publication Number | Publication Date |
|---|---|
| EP1306646A1 true EP1306646A1 (fr) | 2003-05-02 |
| EP1306646A4 EP1306646A4 (fr) | 2006-08-16 |
Family
ID=27343644
Family Applications (1)
| Application Number | Title | Priority Date | Filing Date |
|---|---|---|---|
| EP01936882A Withdrawn EP1306646A4 (fr) | 2000-06-07 | 2001-06-06 | Projecteur de motif de reseau utilisant un reseau de cristaux liquides |
Country Status (3)
| Country | Link |
|---|---|
| US (1) | US7009718B2 (fr) |
| EP (1) | EP1306646A4 (fr) |
| WO (1) | WO2001094880A1 (fr) |
Cited By (5)
| Publication number | Priority date | Publication date | Assignee | Title |
|---|---|---|---|---|
| CN102506759A (zh) * | 2011-11-16 | 2012-06-20 | 四川大学 | 一种大口径非球面朗奇检测方法 |
| EP2392900A3 (fr) * | 2010-06-03 | 2014-04-09 | Canon Kabushiki Kaisha | Interféromètre |
| CN105157616A (zh) * | 2015-07-31 | 2015-12-16 | 西安工业大学 | 一种阴影莫尔轮廓测量装置、其标定方法和测量方法 |
| CN111043989A (zh) * | 2019-12-16 | 2020-04-21 | 电子科技大学 | 一种基于液晶底片的正弦条纹场投射模块 |
| CN112378348A (zh) * | 2020-10-28 | 2021-02-19 | 华中科技大学 | 一种针对低质量条纹图像的迭代相位校正方法 |
Families Citing this family (38)
| Publication number | Priority date | Publication date | Assignee | Title |
|---|---|---|---|---|
| WO2002005543A1 (fr) * | 2000-07-06 | 2002-01-17 | Seiko Epson Corporation | Procede de traitement d'image, support d'enregistrement, et dispositif de traitement d'image |
| JP3912666B2 (ja) * | 2001-03-21 | 2007-05-09 | 株式会社リコー | 光学的形状測定装置 |
| JP4206693B2 (ja) * | 2002-05-17 | 2009-01-14 | 株式会社日立製作所 | 画像表示装置 |
| US7317464B2 (en) * | 2002-08-21 | 2008-01-08 | Intel Corporation | Pulse width modulated spatial light modulators with offset pulses |
| US7315383B1 (en) * | 2004-07-09 | 2008-01-01 | Mohsen Abdollahi | Scanning 3D measurement technique using structured lighting and high-speed CMOS imager |
| US7796246B2 (en) * | 2005-12-26 | 2010-09-14 | Gwangju Institute Of Science And Technology | 3-D shape measuring method for auto-grinding equipment of LCD color filter and 3-D shape measuring apparatus for the same |
| JP4199238B2 (ja) * | 2006-01-11 | 2008-12-17 | パナソニック株式会社 | 撮影システム |
| DE102006002077A1 (de) * | 2006-01-13 | 2007-07-26 | GOM - Gesellschaft für Optische Meßtechnik mbH | Einrichtung und Verfahren zum dreidimensionalen optischen Vermessen |
| GB0615956D0 (en) * | 2006-08-11 | 2006-09-20 | Univ Heriot Watt | Optical imaging of physical objects |
| US7474415B2 (en) * | 2006-09-13 | 2009-01-06 | Chung Shan Institute Of Science And Technology, Armaments Bureau, M.N.D. | Measurement method of three-dimensional profiles and reconstruction system thereof using subpixel localization with color gratings and picture-in-picture switching on single display |
| DE102006044229B4 (de) * | 2006-09-20 | 2023-09-28 | Carl Zeiss Microscopy Gmbh | Verfahren und Vorrichtung zur Bildverarbeitung mit höheren Harmonischen eines Beleuchtungsgitters |
| DE102006048234A1 (de) * | 2006-10-11 | 2008-04-17 | Steinbichler Optotechnik Gmbh | Verfahren und Vorrichtung zur Bestimmung der 3D-Koordinaten eines Objekts |
| JP2008145139A (ja) * | 2006-12-06 | 2008-06-26 | Mitsubishi Electric Corp | 形状計測装置 |
| JP4962852B2 (ja) * | 2007-03-05 | 2012-06-27 | 株式会社ニコン | 形状測定方法および形状測定装置 |
| US8224066B2 (en) * | 2007-05-29 | 2012-07-17 | Gerd Haeusler | Method and microscopy device for the deflectometric detection of local gradients and the three-dimensional shape of an object |
| US20090008955A1 (en) * | 2007-07-03 | 2009-01-08 | Sergio Desoto | System and method for automatically designing an automobile wrap |
| JP2009128030A (ja) * | 2007-11-20 | 2009-06-11 | Tokyo Univ Of Agriculture & Technology | 格子投影型モアレ装置、及び形状測定方法 |
| JP5397704B2 (ja) * | 2008-03-11 | 2014-01-22 | 株式会社ニコン | 形状測定装置 |
| DE102008015499C5 (de) * | 2008-03-25 | 2013-01-10 | Steinbichler Optotechnik Gmbh | Verfahren und Vorrichtung zur Bestimmung der 3D-Koordinaten eines Objekts |
| JP4518172B2 (ja) * | 2008-03-31 | 2010-08-04 | ブラザー工業株式会社 | 画像生成装置および印刷装置 |
| US20100149551A1 (en) * | 2008-12-16 | 2010-06-17 | Faro Technologies, Inc. | Structured Light Imaging System and Method |
| US8441532B2 (en) * | 2009-02-24 | 2013-05-14 | Corning Incorporated | Shape measurement of specular reflective surface |
| CA2762637C (fr) | 2009-11-04 | 2012-08-28 | Technologies Numetrix Inc. | Dispositif et procede d'obtention de donnees de surface d'objet tridimensionnelles |
| DE102010022827A1 (de) * | 2010-06-05 | 2011-12-08 | TSK Prüfsysteme GmbH | Höhenvermessungs-Vorrichtung zur Höhenvermessung einer Kraftfahrzeug-Zentralelektrik |
| US8990682B1 (en) * | 2011-10-05 | 2015-03-24 | Google Inc. | Methods and devices for rendering interactions between virtual and physical objects on a substantially transparent display |
| US20140267965A1 (en) * | 2011-11-18 | 2014-09-18 | Sharp Kabushiki Kaisha | Optical deflector |
| DE102013200657B4 (de) * | 2013-01-17 | 2015-11-26 | Sypro Optics Gmbh | Vorrichtung zur Erzeugung eines optischen Punktmusters |
| DE102016208049A1 (de) * | 2015-07-09 | 2017-01-12 | Inb Vision Ag | Vorrichtung und Verfahren zur Bilderfassung einer vorzugsweise strukturierten Oberfläche eines Objekts |
| JP6190486B2 (ja) * | 2016-04-08 | 2017-08-30 | キヤノン株式会社 | 画像処理装置、画像処理装置の制御方法、およびプログラム |
| JP6909377B2 (ja) * | 2016-07-11 | 2021-07-28 | 高知県公立大学法人 | 検査システムおよび検査方法 |
| US10360693B2 (en) * | 2017-03-01 | 2019-07-23 | Cognex Corporation | High speed structured light system |
| KR101955847B1 (ko) * | 2018-01-23 | 2019-03-11 | 한국표준과학연구원 | 위상천이 편향측정법에서 비선형 응답특성을 보상하기 위한 시스템 및 방법 |
| JP7006392B2 (ja) * | 2018-03-09 | 2022-01-24 | 富士通株式会社 | 検査方法、装置、システム及びプログラム |
| CN111566438B (zh) * | 2018-12-19 | 2022-03-25 | 合刃科技(深圳)有限公司 | 图像获取方法及系统 |
| WO2021022379A1 (fr) * | 2019-08-07 | 2021-02-11 | Lensvector Inc. | Détection et classification d'objet optique avec une commande de faisceau dynamique |
| CN112379570B (zh) * | 2020-11-25 | 2022-05-03 | 东莞埃科思科技有限公司 | 一种投影机装调方法 |
| US20220252893A1 (en) * | 2021-02-09 | 2022-08-11 | Himax Technologies Limited | Light projection apparatus |
| US11823406B1 (en) * | 2023-07-19 | 2023-11-21 | Mloptic Corp. | Moiré-based distance measurement system |
Citations (3)
| Publication number | Priority date | Publication date | Assignee | Title |
|---|---|---|---|---|
| US4349277A (en) * | 1980-06-11 | 1982-09-14 | General Electric Company | Non-contact measurement of surface profile |
| US4443706A (en) * | 1982-10-01 | 1984-04-17 | Robotic Vision Systems, Inc. | Method for locating points on a three-dimensional surface using light intensity variations |
| WO1996027115A1 (fr) * | 1995-02-27 | 1996-09-06 | Robert Zeien | Dispositif de decalage de phase a generateur de grille active de maniere selective |
Family Cites Families (5)
| Publication number | Priority date | Publication date | Assignee | Title |
|---|---|---|---|---|
| CH672722A5 (fr) * | 1986-06-24 | 1989-12-29 | Marco Brandestini | |
| JPH0498106A (ja) | 1990-08-16 | 1992-03-30 | Nippon Telegr & Teleph Corp <Ntt> | 3次元形状計測方法 |
| JP2711042B2 (ja) * | 1992-03-30 | 1998-02-10 | シャープ株式会社 | クリーム半田の印刷状態検査装置 |
| JP3831089B2 (ja) * | 1997-09-10 | 2006-10-11 | シチズン時計株式会社 | 格子パターン投影法を用いた3次元形状測定装置 |
| JP3281918B2 (ja) * | 1999-10-12 | 2002-05-13 | 和歌山大学長 | 形状計測方法および装置 |
-
2001
- 2001-06-06 EP EP01936882A patent/EP1306646A4/fr not_active Withdrawn
- 2001-06-06 WO PCT/JP2001/004790 patent/WO2001094880A1/fr not_active Application Discontinuation
- 2001-06-06 US US10/297,409 patent/US7009718B2/en not_active Expired - Fee Related
Patent Citations (3)
| Publication number | Priority date | Publication date | Assignee | Title |
|---|---|---|---|---|
| US4349277A (en) * | 1980-06-11 | 1982-09-14 | General Electric Company | Non-contact measurement of surface profile |
| US4443706A (en) * | 1982-10-01 | 1984-04-17 | Robotic Vision Systems, Inc. | Method for locating points on a three-dimensional surface using light intensity variations |
| WO1996027115A1 (fr) * | 1995-02-27 | 1996-09-06 | Robert Zeien | Dispositif de decalage de phase a generateur de grille active de maniere selective |
Non-Patent Citations (6)
| Title |
|---|
| G. SANSONI ET AL.: "A Novel, Adaptive System for 3-D Optical Profilometry Using a Liquid Crystal Light Projector" IEEE TRANS. INSTR. MEAS., vol. 43, no. 4, August 1994 (1994-08), pages 558-566, XP002387172 * |
| G. SANSONI ET AL.: "Three-dimensional imaging based on gray-code light projection" APPLIED OPTICS, vol. 36, no. 19, 1 July 1997 (1997-07-01), pages 4463-4472, XP002387175 * |
| KEN YAMATANI ET AL.: "Three dimensional surface profilometry using structured liquid crystal grating" PROCEEDINGS OF SPIE 3782, 291, 1999, pages 291-296, XP002387208 * |
| LIANG MENG, FANG QIANG: "Three-dimensional profilometry based on coded linear-structure light with isosceles teeth" APPLIED OPTICS, vol. 38, no. 31, 1 November 1999 (1999-11-01), pages 6528-6531, XP002387174 * |
| QIANG FANG, SUNDE ZHENG: "linearly coded profilometry" APPLIED OPTICS, vol. 36, no. 11, 10 April 1997 (1997-04-10), pages 2401-2407, XP002387173 * |
| See also references of WO0194880A1 * |
Cited By (8)
| Publication number | Priority date | Publication date | Assignee | Title |
|---|---|---|---|---|
| EP2392900A3 (fr) * | 2010-06-03 | 2014-04-09 | Canon Kabushiki Kaisha | Interféromètre |
| US8860949B2 (en) | 2010-06-03 | 2014-10-14 | Canon Kabushiki Kaisha | Interferometer |
| CN102506759A (zh) * | 2011-11-16 | 2012-06-20 | 四川大学 | 一种大口径非球面朗奇检测方法 |
| CN105157616A (zh) * | 2015-07-31 | 2015-12-16 | 西安工业大学 | 一种阴影莫尔轮廓测量装置、其标定方法和测量方法 |
| CN105157616B (zh) * | 2015-07-31 | 2017-08-22 | 西安工业大学 | 一种阴影莫尔轮廓测量装置、其标定方法和测量方法 |
| CN111043989A (zh) * | 2019-12-16 | 2020-04-21 | 电子科技大学 | 一种基于液晶底片的正弦条纹场投射模块 |
| CN112378348A (zh) * | 2020-10-28 | 2021-02-19 | 华中科技大学 | 一种针对低质量条纹图像的迭代相位校正方法 |
| CN112378348B (zh) * | 2020-10-28 | 2021-10-08 | 华中科技大学 | 一种针对低质量条纹图像的迭代相位校正方法 |
Also Published As
| Publication number | Publication date |
|---|---|
| US20040046966A1 (en) | 2004-03-11 |
| US7009718B2 (en) | 2006-03-07 |
| EP1306646A4 (fr) | 2006-08-16 |
| WO2001094880A1 (fr) | 2001-12-13 |
Similar Documents
| Publication | Publication Date | Title |
|---|---|---|
| US7009718B2 (en) | Grating pattern projection apparatus using liquid crystal grating | |
| CN107607060B (zh) | 一种应用于光栅三维投影测量中的相位误差补偿方法 | |
| US6100990A (en) | Method and apparatus for determining reflective optical quality using gray-scale patterns | |
| CN107091617B (zh) | 形状测定系统、形状测定装置以及形状测定方法 | |
| CN108370406B (zh) | 摄像装置 | |
| US5193120A (en) | Machine vision three dimensional profiling system | |
| US5636025A (en) | System for optically measuring the surface contour of a part using more fringe techniques | |
| JP5252820B2 (ja) | 3次元計測方法及びそれを用いた3次元形状計測装置 | |
| US7548324B2 (en) | Three-dimensional shape measurement apparatus and method for eliminating 2π ambiguity of moire principle and omitting phase shifting means | |
| CN108981611B (zh) | 一种基于畸变全局修正的数字投影光栅图像拟合校正方法 | |
| JP3831089B2 (ja) | 格子パターン投影法を用いた3次元形状測定装置 | |
| KR102398723B1 (ko) | 측정 물체의 표면을 광학적으로 측정하는 방법 및 장치 | |
| EP0736167B1 (fr) | Systeme de mesure de contours | |
| CN113237437B (zh) | 一种基于位相编码元件的结构光三维形貌测量方法及装置 | |
| CN113092073A (zh) | 一种液晶空间光调制器相位调制特性自动测量方法 | |
| CN108240800B (zh) | 表面形貌的量测方法 | |
| TWI622755B (zh) | 表面形貌的量測方法 | |
| JP3851189B2 (ja) | 液晶格子を用いた格子パタン投影装置 | |
| JP2538435B2 (ja) | 縞位相分布解析方法および縞位相分布解析装置 | |
| Schoenleber et al. | Fast and flexible shape control with adaptive LCD fringe masks | |
| JPH04278406A (ja) | 3次元計測方法 | |
| JP2974223B2 (ja) | 光学式形状認識装置 | |
| JP2765151B2 (ja) | 3次元形状測定方法 | |
| JPH07264611A (ja) | 投射型ディスプレイのコンバーゼンス補正装置 | |
| CN116824069B (zh) | 利用高频信号检测饱和点的自适应条纹方法 |
Legal Events
| Date | Code | Title | Description |
|---|---|---|---|
| PUAI | Public reference made under article 153(3) epc to a published international application that has entered the european phase |
Free format text: ORIGINAL CODE: 0009012 |
|
| 17P | Request for examination filed |
Effective date: 20021207 |
|
| AK | Designated contracting states |
Designated state(s): AT BE CH CY DE DK ES FI FR GB GR IE IT LI LU MC NL PT SE TR |
|
| RBV | Designated contracting states (corrected) |
Designated state(s): AT BE DE GB |
|
| A4 | Supplementary search report drawn up and despatched |
Effective date: 20060719 |
|
| 17Q | First examination report despatched |
Effective date: 20070110 |
|
| RAP1 | Party data changed (applicant data changed or rights of an application transferred) |
Owner name: CITIZEN HOLDINGS CO., LTD. |
|
| STAA | Information on the status of an ep patent application or granted ep patent |
Free format text: STATUS: THE APPLICATION IS DEEMED TO BE WITHDRAWN |
|
| 18D | Application deemed to be withdrawn |
Effective date: 20070721 |