EP1179728A2 - Vorrichtung und Verfahren zum Messen der Wellenlängedispersion - Google Patents
Vorrichtung und Verfahren zum Messen der Wellenlängedispersion Download PDFInfo
- Publication number
- EP1179728A2 EP1179728A2 EP01104531A EP01104531A EP1179728A2 EP 1179728 A2 EP1179728 A2 EP 1179728A2 EP 01104531 A EP01104531 A EP 01104531A EP 01104531 A EP01104531 A EP 01104531A EP 1179728 A2 EP1179728 A2 EP 1179728A2
- Authority
- EP
- European Patent Office
- Prior art keywords
- wavelength dispersion
- light
- wavelength
- frequency
- measuring device
- Prior art date
- Legal status (The legal status is an assumption and is not a legal conclusion. Google has not performed a legal analysis and makes no representation as to the accuracy of the status listed.)
- Withdrawn
Links
Images


Classifications
-
- G—PHYSICS
- G01—MEASURING; TESTING
- G01M—TESTING STATIC OR DYNAMIC BALANCE OF MACHINES OR STRUCTURES; TESTING OF STRUCTURES OR APPARATUS, NOT OTHERWISE PROVIDED FOR
- G01M11/00—Testing of optical apparatus; Testing structures by optical methods not otherwise provided for
- G01M11/30—Testing of optical devices, constituted by fibre optics or optical waveguides
- G01M11/33—Testing of optical devices, constituted by fibre optics or optical waveguides with a light emitter being disposed at one fibre or waveguide end-face, and a light receiver at the other end-face
- G01M11/335—Testing of optical devices, constituted by fibre optics or optical waveguides with a light emitter being disposed at one fibre or waveguide end-face, and a light receiver at the other end-face using two or more input wavelengths
-
- G—PHYSICS
- G01—MEASURING; TESTING
- G01M—TESTING STATIC OR DYNAMIC BALANCE OF MACHINES OR STRUCTURES; TESTING OF STRUCTURES OR APPARATUS, NOT OTHERWISE PROVIDED FOR
- G01M11/00—Testing of optical apparatus; Testing structures by optical methods not otherwise provided for
- G01M11/30—Testing of optical devices, constituted by fibre optics or optical waveguides
- G01M11/33—Testing of optical devices, constituted by fibre optics or optical waveguides with a light emitter being disposed at one fibre or waveguide end-face, and a light receiver at the other end-face
- G01M11/333—Testing of optical devices, constituted by fibre optics or optical waveguides with a light emitter being disposed at one fibre or waveguide end-face, and a light receiver at the other end-face using modulated input signals
-
- G—PHYSICS
- G01—MEASURING; TESTING
- G01M—TESTING STATIC OR DYNAMIC BALANCE OF MACHINES OR STRUCTURES; TESTING OF STRUCTURES OR APPARATUS, NOT OTHERWISE PROVIDED FOR
- G01M11/00—Testing of optical apparatus; Testing structures by optical methods not otherwise provided for
- G01M11/30—Testing of optical devices, constituted by fibre optics or optical waveguides
- G01M11/33—Testing of optical devices, constituted by fibre optics or optical waveguides with a light emitter being disposed at one fibre or waveguide end-face, and a light receiver at the other end-face
- G01M11/336—Testing of optical devices, constituted by fibre optics or optical waveguides with a light emitter being disposed at one fibre or waveguide end-face, and a light receiver at the other end-face by measuring polarization mode dispersion [PMD]
Definitions
- the present invention relates to a device measuring dispersion on an optical transmission line, and more particularly, to a device monitoring a dispersion value of an optical transmission line and optimally compensating for dispersion.
- wavelength dispersion tolerance In an optical transmission system of a transmission speed of 10 Gbps or faster, its wavelength dispersion tolerance is very small. For example, the wavelength dispersion tolerance of a 40-Gbps NRZ system is 100 ps/nm or smaller. In contrast, for a ground optical transmission system, a relay section is not always uniform. A system using a 1.3 ⁇ m zero-dispersion SMF (Single Mode Fiber) of approximately 17 ps/nm/km exceeds the wavelength dispersion tolerance, even if a relay section varies only by several kilometers.
- SMF Single Mode Fiber
- the dispersion compensation amount for each relay section must be suitably set while strictly measuring the wavelength dispersion amount not only at the start of system use but also in system use. For example, if a temperature change of 100 degrees centigrade occurs on a DSF (Dispersion Shifter Fiber) transmission line of 500 kilometers, a wavelength dispersion change amount results in approximately 105 ps/nm, which is nearly equivalent to the wavelength dispersion tolerance of an NRZ signal.
- DSF Dispersion Shifter Fiber
- a system automatically measuring a dispersion amount is essential not only for an SMF transmission line but also for a system using a 1.55 ⁇ m zero-dispersion DSF or an NZ-DSF transmission line.
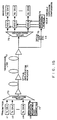
- Fig. 1 shows the outline of the configuration of a wavelength dispersion measuring device using the twin-pulse method.
- the twin-pulse method is a method obtaining a wavelength dispersion amount (group delay) by using two optical pulse signals having different wavelengths, and by measuring the delay difference between the two pulses after being transmitted over a fiber to be measured.
- group delay a wavelength dispersion amount
- two LDs producing different wavelengths, and their driving units are required.
- an electric signal pulse is generated from a pulse generator 10, and at the same time, a trigger signal for starting measurement is transmitted to a group delay measuring instrument.
- the electric pulse transmitted from the pulse generator 10 is input to two driving units 11-1 and 11-2, which are made to simultaneously output optical pulses to LDs 12-1 and 12-2 that respectively produce lights having wavelengths ⁇ 1 and ⁇ 2.
- Optical pulses produced by the LDs 12-1 and 12-2 are multiplexed by an optical multiplexer such as a half mirror 13, a coupler, etc., and are propagated through an optical fiber transmission line 14.
- the two optical pulses that propagate through the optical fiber transmission line 14 are detected by a detector 15, and the detection result of the optical pulses is transmitted to the group delay measuring instrument 17.
- the trigger signal output from the pulse generator 10 is delayed in a delaying circuit 16 by an amount of time required to propagate the optical pulses through the optical fiber transmission line, and input to the group delay measuring unit 17 as a trigger signal for starting up the group delay measuring unit 17.
- the group delay measuring unit 17 detects the difference between the arrival times of the two optical pulses detected by the detector 15, and calculates the group delay times of the optical pulses having the wavelengths ⁇ 1 and ⁇ 2.
- Figs. 3A and 3B show the states of optical pulses propagated with the twin-pulse method.
- optical pulses having wavelengths ⁇ 1 and ⁇ 2 are simultaneously generated, multiplexed, and output. Since the optical pulses having the wavelengths ⁇ 1 and ⁇ 2 are simultaneously output at this time, the pulses are multiplexed into one and input to a transmission line as shown on the right side of Fig. 3A. However, a group delay is caused by the wavelength dispersion of the transmission line. Therefore, when the optical pulses having the wavelengths ⁇ 1 and ⁇ 2 are received on a receiving side, there is a reception time lag between the optical pulses as shown in Fig. 3B. Here, it is assumed that the group delay of the optical pulse having the wavelength ⁇ 1 is larger than that of the optical pulse having the wavelength ⁇ 2.
- a group delay time can be calculated based on the difference between the arrival times of the two optical pulses having the wavelengths ⁇ 1 and ⁇ 2, and a wavelength dispersion amount can be calculated by using the difference between the wavelengths ⁇ 1 and ⁇ 2.
- Fig. 2 shows the outline of the configuration of a wavelength dispersion measuring device using the optical phase comparison method.
- the optical phase comparison method is a method obtaining a wavelength dispersion amount not by directly measuring a group delay time difference, but by acquiring a phase difference between modulated optical signals, which is caused by a group delay time difference.
- an electric pulse is generated by a pulse generator 10.
- a trigger signal for notifying a phase detector 18 of a measurement reference time of the propagation time of an optical pulse is transmitted by the pulse generator 10.
- the electric pulse transmitted from the pulse generator 10 is input to a driving unit 11, and an optical pulse having a wavelength ⁇ is output from an LD 12.
- This optical pulse propagates through a transmission line 14, and is detected by a photodetector 15.
- the photodetector 15 inputs the signal indicating the detection of the optical pulse to a phase detector 18.
- the phase detector 18 measures the delay time of the arrival of the optical pulse with reference to the time at which the trigger signal is received from the pulse generator 101.
- the wavelength of the optical pulse transmitted from the LD 12 is changed, and the above described measurement is repeated in a similar manner.
- the propagation time of the optical pulse which indicates the delay time when the optical pulse transmitted with the different wavelength is detected on a receiving side from the reference time, may differ.
- This propagation time difference is a group delay time difference.
- Fig. 3C shows the state of optical pulses used in the optical phase comparison method.
- the reference time is a time point immediately after the optical pulse is output from the LD 12, an instant when the optical pulse it output, etc. Accordingly, no influence of wavelength dispersion on the transmission line has been exerted yet.
- the optical pulse having the wavelength ⁇ 1 is detected by the photodetector 15
- the optical pulse is in the state of being influenced by the wavelength dispersion on the transmission line after being propagated.
- the optical pulse having the wavelength ⁇ 2 is in the same state when being detected by the optical detector 15.
- the wavelength dispersion of the wavelength ⁇ 1 is assumed to be larger than that of the wavelength ⁇ 2, the speed at which the optical pulse having the wavelength ⁇ 1 propagates through the transmission line is slower than that of the optical pulse having the wavelength ⁇ 2. As a result, the amount of time required until the optical pulse having the wavelength ⁇ 1 is detected after propagating through the transmission line 14 becomes longer. Accordingly, a group delay time caused by the wavelength dispersion of a transmission line can be measured by detecting the difference between the times when the optical pulses having the wavelengths ⁇ 1 and ⁇ 2 arrive at the photodetector 15. Then, the wavelength dispersion can be measured from the group delay time and the wavelength difference.
- the propagation time of a transmission line is included and the group delay time difference between two waves is obtained from a phase difference with these methods, the propagation delay time of a transmission line must be accurately obtained. Additionally, the number of components such as LDs, driving units, etc. are large. Furthermore, a high SNR is required to make a phase comparison on the order of GHz at a receiving end, leading to a difficulty in securing the optical SNR at the receiving end of a wavelength dispersion light to be monitored.
- An object of the present invention is to provide a wavelength dispersion measuring device which has a small number of components, and causes no optical SNR problem.
- a wavelength dispersion measuring device comprises: a modulating unit modulating a light output from a light source; a transmitting unit transmitting the modulated light to a transmission line as a wavelength dispersion measurement light; a light receiving unit receiving the modulated light which propagates through the transmission line; a filter unit extracting a sideband signal from the received modulated light; and a phase difference detecting unit detecting a phase difference between different frequency band components of the sideband signal, and is characterized in that the wavelength dispersion value of the transmission line is calculated from the phase difference.
- a wavelength dispersion measuring method comprises the steps of: (a) modulating a light output from a light source; (b) transmitting the modulated light to a transmission line as a wavelength dispersion measurement light; (c) receiving the modulated light which propagates through the transmission line; (d) extracting a sideband signal from the received modulated light; and (e) detecting a phase difference between different frequency band components of the sideband signal, and is characterized in that the wavelength dispersion value of the transmission line is calculated from the phase difference.
- a wavelength dispersion value is measured with the wavelength difference between side lobes of a wavelength dispersion measurement light. Accordingly, there is no need to measure the propagation delay time of a transmission line, leading to simplification of the circuitry configuration of the device, and a reduction in the number of components. Additionally, if a sideband signal is extracted by using heterodyne detection, the frequency band can be dropped from an optical to an electric frequency, and the phase difference between sideband signals can be accurately detected by measuring the electric signal, etc. Consequently, a noise amount included at the time of the detection of the phase difference can be reduced, thereby improving the optical SNR.
- dispersion amount dt( ⁇ )/d ⁇
- a change amount of the dispersion amount is referred to as a dispersion slope, and is defined as follows.
- dispersion slope d(dt( ⁇ )d ⁇ )/d ⁇
- the change amount ⁇ t is proportional to a phase difference ⁇ as is known. ⁇ t ⁇ 1/f ⁇
- the dispersion amount can be obtained by measuring the phase difference ⁇ corresponding to a frequency difference.
- the intensity of light is modulated with a high-frequency signal (f 1 ) by using a pair of light sources and an intensity modulator, and the wavelength dispersion amount of a transmission line is measured by obtaining a group delay time difference between the sideband signals resultant from the modulation.
- the intensity of light is modulated with two high-frequency signals having different frequencies (f 1 , f 2 ), and the wavelength dispersion amount of a transmission line is measured from the group delay time difference between the sideband signals having different wavelengths resultant from the modulation.
- Fig. 4 explains a wavelength dispersion measuring device according to a first preferred embodiment of the present invention.
- a high-frequency signal having a signal frequency (f 1 ) on which a low-frequency signal f m is superposed is used as a driving signal of an intensity modulator.
- a low-frequency oscillator 20 generating an electric signal having a frequency f m , and a high-frequency oscillator 21 generating an electric signal having a frequency f 1 are arranged, and a low-frequency signal is superposed on a high-frequency signal in a low-frequency superposing circuit 22.
- the high-frequency signal on which the low-frequency signal is superposed is applied to an optical intensity modulator 23, which modulates the intensity of the light from an LD 31 which outputs a light having a frequency f s .
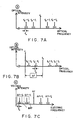
- Fig. 5A Spectrum of the light output from the optical intensity modulator 23 is shown in Fig. 5A.
- Optical sidebands f s -f 1 and f s +f 1 are produced symmetrically with respect to an optical oscillation frequency f s from the LD 31, and sub-sidebands -fm and +fm are respectively produced by superposing a low-frequency signal.
- the optical spectrum range before the wavelength dispersion measurement light and the local oscillation light are multiplexed is shown in Fig. 5B. Additionally, the frequency spectrum at an electric stage after being hetrodyne-detected by the PD 26 is shown in Fig. 5C.
- the signal obtained by being heterodyne-detected is amplified by an amplifier 27, it is split into two. Then, two sideband components are extracted by using bandpass filters (BPFs) 28-2 and 28-1 having central wavelengths ⁇ f-f 1 and ⁇ f+f 1 . Next, their intensities are detected by intensity detectors 29-1 and 29-2, so that a signal the intensity of which varies with the frequency f m superposed on the transmitting side is obtained. The phase difference between the modulated signals the intensities of which are changed corresponds to the propagation delay difference between the optical sidebands f s -f 1 and f s +f 1 .
- BPFs bandpass filters
- the output of the modulator that modulates f 1 with f m results in a spectrum having the sidebands f s -f 1 and f s +f 1 centering on f s .
- the operations of the optical intensity modulator, the operations of which are multiplication are represented by the sum of F m (t) ⁇ exp(j2 ⁇ f 1 t), F m (t) ⁇ exp(-j2 ⁇ f 1 t) ⁇ E s and E s .
- E ⁇ E* (E* is a complex conjugate)
- the signal becomes as follows.
- E ⁇ E* ⁇ F m (t)exp(j2 ⁇ (f s -f 1 )t) + exp(j2 ⁇ f s t) + F m (t)exp(j2 ⁇ (f s +f 1 )t) + exp(j2 ⁇ f L t) ⁇ ⁇ ⁇ F m (t)exp(-j2 ⁇ (f s -f 1 )t) + exp(-j2 ⁇ f s t) + F m (t)exp(-j2 ⁇ (f s +f 1 )t) + exp(-j2 ⁇ f L t) ⁇
- a principal item is only the following one. Namely, a product of ⁇ F m (t)exp(j2 ⁇ (f s -f 1 )t) + exp(j2 ⁇ f s t) + F m (t)exp(j2 ⁇ (f s +f 1 )t) + exp(j 2 ⁇ f L t) and exp(-j2 ⁇ f L t) ⁇
- ⁇ ⁇ t. If this is measured, it can be measured in a range having a low frequency ⁇ f as shown in Fig. 5C.
- ⁇ f f s -f L .
- Fig. 6 shows the configuration of a wavelength dispersion measuring device according to another preferred embodiment of the present invention.
- a signal obtained by adding two types of high-frequency signals, which respectively have single frequencies and f 1 and f 2 and a low-frequency signal f m is respectively superposed on is used as a driving signal of an intensity modulator.
- a low-frequency oscillator 20 and high-frequency oscillators #1 and #2 35-1 and 35-2 are arranged.
- a low-frequency signal is respectively superposed on the high-frequency signals generated from the high-frequency oscillators #1 and #2 35-1 and 35-2 by low-frequency superposing circuits 36-1 and 36-2.
- the two signals are added by an adder 37, and applied to an optical intensity modulator 23.
- the light for the optical intensity modulator the light having a frequency f s from the LD 31 is used.
- Optical spectrum generated with the above described configuration is shown in Fig. 7A.
- Optical sidebands f s -f 2 , f s -f 1 , f s +f 1 , and f s +f 2 are produced symmetrically with respect to the oscillation frequency f s of the wavelength dispersion measurement light, and besides, sub-sidebands -f m and +f m are produced by respectively superposing a low-frequency signal.
- the wavelength dispersion measurement light propagates through the transmission line 24, it is multiplexed by an optical multiplexer 25 with the light generated from the local oscillator LD 32.
- the spectrum allocation at this time is shown in Fig. 7B.
- the wavelength dispersion measurement light multiplexed with the local oscillation light is received by the PD 26, and converted into an electric signal.
- the spectrum at an electric stage after the heterodyne detection is shown in Fig. 7C.
- this signal is amplified by an amplifier 27, it is branched into two.
- Two sideband components are then extracted from the branched signals by respectively using bandpass filters (BPFs) 28-1 and 28-2 having the bandwidths ⁇ f-f 2 and ⁇ f-f 1 .
- BPFs bandpass filters
- the intensities of the sideband components are detected by using intensity detectors 29-1 and 29-2, so that the signal the intensity of which changes with a frequency f m superposed on a transmitting side can be obtained.
- the phase difference between the signals detected by the intensity detectors 29-1 and 29-2 is measured by a phase comparator 30. This phase difference between the two signals the intensities of which are modulated corresponds to the propagation delay difference between the optical sidebands f s -f 2 and f s -f 1 .
- the principle of the wavelength dispersion measurement according to this preferred embodiment is represented as follows, if it is put into an expression by being limited to the optical sidebands f s -f 2 and f s -f 1 .
- phase of the low-frequency signal superposed on the two high-frequency signals must be settled on the transmitting side in Fig. 6. If there is a phase difference on the transmitting side, it must be canceled by a phase comparator on the receiving side.
- amplitudes of the signals input to a phase comparator on the receiving side in Figs. 4 and 6 must be equalized, and amplitude saturation (limit) must be determined prior to the phase comparator.
- the wavelength dispersion amount of an existing transmission line can be measured with high accuracy, whereby the dispersion in an ulta-fast optical transmission system can be compensated with high accuracy.
- the signal for measuring wavelength dispersion is extracted by using bandpass filters, whereby the frequency range input to an intensity measuring device is narrowed, and an optical SNR can be improved.
- a setting value of f m is determined depending on a demanded wavelength dispersion measurement accuracy, the total wavelength dispersion value of a transmission line to be measured, and a low-frequency phase difference detection accuracy to be demanded, as described above.
- Figs. 8 through 12 exemplify the configuration for the heterodyne detection in a wavelength dispersion measuring device according to the preferred embodiment of the present invention.
- Figs. 8 through 12 adopt the configuration shown in Fig. 6 (the configuration of the transmitting side and the BPF frequencies on the receiving side) .
- the configuration shown in Fig. 4 may be applied. Namely, the single high-frequency oscillator on the transmitting side is used, and the optical sideband signals having ⁇ f-f 1 and ⁇ f+f 1 are extracted by bandpass filters on a receiving side, so that the phase difference between these signals may be measured.
- AFC automatic frequency control
- the polarization plane of the wavelength dispersion measurement light to be multiplexed and that of the local oscillation light must coincide. This is because both of these lights cannot be efficiently multiplexed if the polarization planes of the lights do not coincide. Namely, the multiplexed lights are not mixed completely (a frequency conversion capability, etc. do not fully work). Especially, if the polarization planes of both of the lights are orthogonal, they are not mixed at all (these lights propagate as absolutely independent lights). Therefore, it is necessary to make their polarization planes coincide. Examples of this method include an active polarization method and a polarization diversity method.
- a polarization controller is automatically controlled to maximize an electric reception intensity while monitoring the intensity on a receiving side.
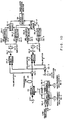
- Fig. 8 shows the configuration of the active polarization method which optimizes the polarization state of a local oscillation light.
- a signal having a high frequency f 1 is output from the high-frequency oscillator #1 35-1, whereas a signal having a high frequency f 2 is output from the high-frequency oscillator #2 35-2.
- a signal having a low frequency f m generated from the low-frequency oscillator 20 is respectively superposed on the high-frequency signals by the low-frequency superposing circuits 36-1 and 36-2.
- the high-frequency signals on which the low-frequency signal is superposed are added by an adder 37, and the added signal is applied to an optical intensity modulator 23.
- the intensity of the light having a frequency f s which is input from the LD 31 to the optical intensity modulator 23, is modulated with the high-frequency signal applied from the adder 37.
- the optical signal the intensity of which is modulated propagates through the transmission line 24, and enters the optical multiplexer 25.
- the local oscillation light from the local oscillation LD 32 which is polarization-controlled by a polarization controller 41, is input to the optical multiplexer 25, and multiplexed with the above described signal.
- the optical signal output from the optical multiplexer 25 is received by the PD 26, and converted into an electric signal.
- the amplifier 27 amplifies the output of the PD 26, and transmits the amplified output to the succeeding stage.
- the output of the amplifier 27 is input to an intensity monitor 40.
- the intensity of the optical signal received by the PD 26 is detected, and at the same time, a control signal is transmitted to the polarization controller 41 so that the intensity of the received light is maximized.
- the polarization plane of the local oscillation light is controlled to coincide with the wavelength dispersion measurement light in all cases.
- the output of the amplifier 27 is branched into two, from which sideband signals having corresponding frequencies are extracted by the bandpass filters 28-1 and 28-2 the central frequencies of which are respectively ⁇ f-f 2 and ⁇ f-f 1 .
- the sideband signals extracted by the bandpass filters 28-1 and 28-2 are respectively detected by the intensity detectors 29-1 and 29-2.
- the phase difference between the sideband signals is detected by the phase comparator 30. This phase difference is converted into a wavelength dispersion value, and displayed on a wavelength dispersion monitor not shown.
- Fig. 9 shows another configuration of the active polarization method optimizing the polarization state of a wavelength dispersion measurement light which propagates through a transmission line.
- a high-speed polarization controller and a feedback control system which follow the changing speed of the polarization state of the wavelength dispersion light while being propagated on a transmission line.
- a polarization controller 45 is arranged not on the side of the local oscillation LD 32 but on the transmission line through which the wavelength dispersion measurement light propagates. Namely, the polarization of the wavelength dispersion measurement light which propagates through the transmission line is controlled to maximize the optical reception intensity of the PD 26, which is detected by the intensity monitor 40. Since the polarization of the local oscillation light generated by the local oscillation LD 32 is uniform, control is performed so that the polarization plane of the local oscillation light coincides with that of the wavelength dispersion measurement light.
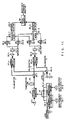
- Fig. 10 shows the configuration of the polarization diversity method optimizing the polarization state of a wavelength dispersion measurement light that propagates through a transmission line.
- a signal having a frequency f 1 and a signal having a frequency f 2 are respectively output from the high-frequency oscillators #1 35-1 and #2 35-2.
- a low-frequency signal having a frequency f m output from the low-frequency oscillator 20 is superposed on these high-frequency signals by the low-frequency superposing circuits 36-1 and 36-2.
- the signals on which the low-frequency signal is superposed and output from the low-frequency superposing circuits 36-1 and 36-2 are added by the adder 37, and applied to the optical intensity modulator 23 as a modulation signal.
- a light having a frequency f s is input from the LD 31.
- the intensity of this light is modulated by the modulation signal from the adder 37. In this way, a wavelength dispersion measurement light is transmitted from the optical intensity modulator 23 to the transmission line 24.
- the wavelength dispersion measurement light is separated into polarizations P and S by a polarization separator 50-1, and the separated waves are respectively input to optical multiplexers 25-1 and 25-2. Additionally, a local oscillation light output from the local oscillation LD 32 is separated into polarizations P and S by a polarization separator 50-2, and the polarizations are respectively input to the optical multiplexers 25-1 and 25-2.
- the polarization P of the wavelength dispersion measurement light and that of the local oscillation light are multiplexed by the optical multiplexer 25-1, whereas the polarization S of the wavelength dispersion measurement light and that of the local oscillation light are multiplexed by the optical multiplexer 25-2. Namely, the same polarizations are coupled, thereby fully combining both of the lights.
- the outputs of the optical multiplexers 25-1 and 25-2 are received by PDs 26-1 and 26-2, amplified by amplifiers 27-1 and 27-2, and branched.
- sideband signals are extracted from the branched signals by bandpass filters 28-1 and 28-3 having a central wavelength ⁇ f-f 2 , and bandpass filters having a central wavelength ⁇ f-f 1 .
- the intensities of the sideband signals extracted by the bandpass filters 28-1 through 28-4 are detected by intensity detectors 29-1 through 29-4.
- the intensities resultant from the detection of the sideband signals in the same frequency bands are added by intensity adders 51-1 and 51-2. That is, in Fig. 10, the detection result of the polarization P and the detection result of the polarization S in the ⁇ f-f 2 band are added by the intensity adder 51-2, whereas the detection result of the polarization P and the detection result of the polarization S in the ⁇ f-f 1 band are added by the intensity adder 51-2.
- phase difference between the signals obtained by the intensity adders 51-1 and 51-2 is detected by the phase comparator 30, and this difference is converted into a wavelength dispersion value and output to a wavelength dispersion monitor not shown.
- Fig. 11 shows another configuration of the polarization diversity method optimizing the polarization state of a wavelength dispersion measurement light which propagates through a transmission line.
- a phase difference is detected from the signals detected by the intensity detectors 29-a and 29-b by a phase detector 30, and a wavelength dispersion value is output to a wavelength dispersion monitor not shown.
- a variable dispersion compensator arranged in the system is optimally set by using the wavelength dispersion measurement values in Figs. 8 through 11. If the absolute value of the wavelength dispersion value itself on a transmission line is measured, the wavelength dispersion measurement light is not passed through the variable dispersion compensator within the system, as a wavelength dispersion measurement method at this time.
- Fig. 12 exemplifies the configuration of an automatic dispersion compensating system which passes a wavelength dispersion measurement light through a variable dispersion compensator, and measures a wavelength dispersion amount after dispersion compensation.
- the configuration shown in Fig. 12 is based on the configuration shown in Fig. 6 (the configuration of the transmitting side and the BPF frequencies on the receiving side) . However, also the configuration shown in Fig. 4 is applicable.
- a variable dispersion compensator 60 is arranged between the transmission line 24 and the optical multiplexer 60.
- a wavelength dispersion measurement light is influenced by wavelength dispersion including the wavelength dispersion caused by the variable dispersion compensator 60. Therefore, also the wavelength dispersion value obtained by the phase comparator 30 includes the wavelength dispersion caused by the variable dispersion compensator 60.
- a control circuit 61 makes a calculation from the wavelength dispersion value obtained by the phase comparator 30 for a control signal to be transmitted to the variable dispersion compensator 60 in order to make the wavelength dispersion value optimum, and controls the variable dispersion compensator 60. In this way, a system automatically compensating for the wavelength dispersion of a transmission line can be configured.
- the configuration shown in Fig. 12 does not include the configuration for controlling the polarizations of a local oscillation light and a wavelength dispersion measurement light.
- the configurations shown in Figs. 8 through 11 are applicable also the configuration shown in Fig. 12.
- variable dispersion compensator As the variable dispersion compensator, a VIPA (Virtually Imaged Phased Array) dispersion compensator (Source: M. Shirasaki et al., “Dispersion Compensation Using the Virtual Imaged Phased Array", APCC/OECC '99 Technical Digest Vol. 2 pp. 1367-370), and a fiber grating dispersion compensator (Source: M. M. Ohn et al., “Tunable Fiber Grating Dispersion Using a Piesoelectric Stack", OFC' Technical Digest WJ3 pp. 155-156) exist.
- VIPA Virtual Imaged Phased Array
- a fiber grating dispersion compensator Source: M. M. Ohn et al., “Tunable Fiber Grating Dispersion Using a Piesoelectric Stack", OFC' Technical Digest WJ3 pp. 155-156
- Fig. 13 exemplifies the configuration of an automatic dispersion compensating system in the case where a wavelength dispersion measurement light is not passed through a variable dispersion compensator within the system.
- Transmitters Tx CH-1 to Tx CH-N are transmitters transmitting a normal communication signal. These transmitters transmit signals by putting them on wavelengths ⁇ 1 to ⁇ N. At this time, also the wavelength dispersion light measurement light having a wavelength ⁇ s is transmitted from a wavelength dispersion measurement light transmitter 77.
- Optical signals from the transmitters Tx CH-1 to Tx CH-N and the light from the dispersion measurement light transmitter 77 are wavelength-multiplexed by an optical multiplexer 70.
- variable dispersion compensator 75 Its monitoring information is fed back to the variable dispersion compensator 75 through which the optical signal having CH1 to N pass, so that the wavelength dispersion of the transmission line is compensated.
- the multiplexed optical signal whose wavelength dispersion is compensated is input to an optical demultiplexer 76, which demultipelxes the multiplexed signal into signals having respective wavelengths.
- the optical signals having the respective wavelengths are received by corresponding receivers Rx CH-1 to CH-N.
- Fig. 14 exemplifies the configuration of an automatic dispersion compensating system in the case where a wavelength dispersion measurement light is passed through a variable dispersion compensator within the system.
- wavelengths ⁇ 1 to ⁇ N and ⁇ s are allocated to transmitters Tx CH-1 to Tx CH-N and a wavelength dispersion measurement light transmitter 77.
- Optical signals are output with these wavelengths.
- An optical multiplexer 70 multiplexes these wavelengths, and generates an optical wavelength-mutiplexed signal to be transmitted to a transmission line 72.
- the generated optical wavelength-multiplexed signal propagates through the transmission line 72 on which an optical amplification repeater 71 is arranged.
- the wavelength dispersion of the wavelength-multiplexed signal is compensated, and input to an optical demultiplexer 76.
- the optical demultiplexer 76 demultiplexes the multiplexed signal into signals having respective wavelengths, and received by receivers Rx CH-1 to CH-N.
- the wavelength dispersion measurement light is input to a wavelength dispersion monitor 74, and a wavelength dispersion value is measured.
- This measurement value is converted into a control signal for the variable dispersion compensator, which is controlled by this control signal to optimally compensate for the wavelength dispersion of the transmission line.
- the dispersion value of each channel differs depending on the dispersion slope of a transmission line. Therefore, it is important to consider the wavelength dispersion slope in a WDM system. Especially, the faster the transmission speed per channel and the smaller the wavelength dispersion tolerance, the more the strictness of the slope is required.
- a configuration where a variable dispersion compensator is arranged within each of the receivers (Rx CH-1 to CH-N), and a dispersion compensation amount is individually set is considered as a system which takes the dispersion slope compensation into account.
- Fig. 15 exemplifies the configuration of an automatic wavelength dispersion compensating system which enables the dispersion slope compensation.
- optical signals having wavelengths ⁇ 1 to ⁇ N and a wavelength dispersion measurement light having a wavelength ⁇ s are transmitted from transmitters Tx CH-1 to Tx CH-N and a wavelength dispersion measurement light transmitter 77. These signals are input to an optical multiplexer 70, and multiplexed.
- the wavelength-multiplexed signal propagates through a transmission line 72 including an optical amplification repeater 71. Part of the wavelength-multiplexed signal is branched before being input to an optical demultiplexer 76.
- the wavelength dispersion measurement light is extracted by an optical filter 73. Then, a wavelength dispersion value is measured by a wavelength dispersion monitor 74.
- the wavelength-multiplexed signal input to the optical demultiplexer 76 is branched into optical signals having respective wavelengths, and input to variable dispersion compensators VCD-1 to VCD-N which are arranged for the respective wavelengths.
- the wavelength dispersion monitor 74 controls the variable dispersion compensators VCD-1 through VCD-N so that the wavelength dispersion of the respective waves are optimally compensated based on the measured wavelength dispersion value. In this way, the optical signals having the respective wavelengths whose dispersion are compensated are received by receivers Rx CH-1 to CH-N.
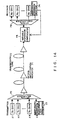
- Figs. 16A and 16B exemplify the frequency allocation of a plurality of signal lights, a wavelength dispersion measurement light, and a local oscillation light in a WDM system.
- one of a plurality of frequencies prepared at predetermined frequency (wavelength) intervals is used as a wavelength dispersion measurement light.
- Fig. 16A shows the state of spectrum in the case where the frequency of the wavelength dispersion measurement light is set as a frequency lower than any other signal lights on the low-frequency side, and the local oscillation light is allocated to a further lower frequency on the low-frequency side.
- Fig. 16B shows the state of spectrum in the case where the frequency of the wavelength dispersion measurement light is set as a frequency higher than any other signal lights on the high-frequency side, and the local oscillation light is allocated to a further higher frequency on the low-frequency side.
- the wavelength dispersion measuring device is applied to a wavelength multiplexing system, in the heterodyne detection on the receiving side, it is important to suitably set the frequencies of a signal light, a wavelength dispersion measurement light, and a local oscillation light so as not to cause crosstalk with the signal component having a different wavelength when the sideband component of the wavelength dispersion measurement light is extracted by a BPF.
- an optical intensity modulator As an optical intensity modulator which generates a wavelength dispersion measurement light on a transmitting side, an LiNbO 3 Mach-Zehnder modulator exists. As other optical intensity modulators, a field absorbing semiconductor modulator, a Mach-Zehnder semiconductor modulator exist.
- a fixed dispersion compensator may be arranged within an optical amplification repeater.
- a wavelength dispersion value is measured by using the sideband signal obtained by modulating a transmission light, thereby simplifying the circuit configuration of a wavelength dispersion measuring device. Additionally, since a bandpass filter is used, a limitation is imposed on the frequency range of a received optical light, leading to a reduction in noise produced by light reception. Namely, an optical SNR can be improved.
Landscapes
- Physics & Mathematics (AREA)
- Chemical & Material Sciences (AREA)
- Optics & Photonics (AREA)
- Analytical Chemistry (AREA)
- General Physics & Mathematics (AREA)
- Dispersion Chemistry (AREA)
- Optical Communication System (AREA)
- Optical Modulation, Optical Deflection, Nonlinear Optics, Optical Demodulation, Optical Logic Elements (AREA)
- Investigating Or Analysing Materials By Optical Means (AREA)
Applications Claiming Priority (2)
| Application Number | Priority Date | Filing Date | Title |
|---|---|---|---|
| JP2000240594A JP4004720B2 (ja) | 2000-08-09 | 2000-08-09 | 波長分散測定装置及びその方法 |
| JP2000240594 | 2000-08-09 |
Publications (2)
| Publication Number | Publication Date |
|---|---|
| EP1179728A2 true EP1179728A2 (de) | 2002-02-13 |
| EP1179728A3 EP1179728A3 (de) | 2003-08-20 |
Family
ID=18731924
Family Applications (1)
| Application Number | Title | Priority Date | Filing Date |
|---|---|---|---|
| EP01104531A Withdrawn EP1179728A3 (de) | 2000-08-09 | 2001-03-02 | Vorrichtung und Verfahren zum Messen der Wellenlängendispersion |
Country Status (3)
| Country | Link |
|---|---|
| US (1) | US6573985B2 (de) |
| EP (1) | EP1179728A3 (de) |
| JP (1) | JP4004720B2 (de) |
Cited By (2)
| Publication number | Priority date | Publication date | Assignee | Title |
|---|---|---|---|---|
| ES2216689A1 (es) * | 2002-10-02 | 2004-10-16 | Universitat Politecnica De Catalunya | Metodo para medir la respuesta frecuencial de retardo de grupo eliminando errores debidos a variaciones frecuenciales en la respuesta de amplitud. |
| WO2009079168A1 (en) | 2007-12-17 | 2009-06-25 | Verizon Services Organization Inc. | In-channel residual chromatic dispersion measurement |
Families Citing this family (20)
| Publication number | Priority date | Publication date | Assignee | Title |
|---|---|---|---|---|
| US20020159672A1 (en) * | 2001-03-13 | 2002-10-31 | Fells Julian A. | Adjustable dispersion compensators, adjustable optical filters, and control signals and strain applicators therefor |
| US7536108B2 (en) | 2001-06-29 | 2009-05-19 | Nippon Telegraph & Telephone Corporation | High precision chromatic dispersion measuring method and automatic dispersion compensating optical link system that uses this method |
| US7035538B2 (en) * | 2001-07-09 | 2006-04-25 | University Of Southern California | Monitoring optical dispersion based on vestigial side band optical filtering |
| US6724468B2 (en) * | 2002-07-31 | 2004-04-20 | Agilent Technologies, Inc | Single sweep phase shift method and apparatus for measuring chromatic and polarization dependent dispersion |
| DE60325152D1 (de) * | 2002-10-03 | 2009-01-22 | Tyco Telecomm Us Inc | Vorrichtung und Verfahren zur schnellen Einstellung einer optimalen Dispersion in optischen Übertragungssystemen |
| US7075659B2 (en) * | 2004-02-05 | 2006-07-11 | Agilent Technologies, Inc. | Heterodyne optical network analysis that utilizes signal modulation |
| JP2006054660A (ja) * | 2004-08-11 | 2006-02-23 | Nippon Telegr & Teleph Corp <Ntt> | 光送信装置および光伝送システム |
| JP4516389B2 (ja) * | 2004-09-08 | 2010-08-04 | 関西電力株式会社 | 波長多重伝送システム |
| US7375680B2 (en) * | 2005-05-12 | 2008-05-20 | L-3 Communications Corporation | Ionosphere delay measurement using carrier phase |
| CN101369845B (zh) * | 2007-08-16 | 2012-05-23 | 华为技术有限公司 | 一种色散监测方法、系统及装置 |
| JP5148381B2 (ja) * | 2008-06-18 | 2013-02-20 | 株式会社アドバンテスト | 光測定装置 |
| TW201043942A (en) * | 2009-06-04 | 2010-12-16 | Univ Nat Chiao Tung | System and method for measuring dispersion |
| JP5493089B2 (ja) * | 2010-09-14 | 2014-05-14 | ニューブレクス株式会社 | 分布型光ファイバセンサ |
| WO2015050559A1 (en) * | 2013-10-04 | 2015-04-09 | Halliburton Energy Services Inc. | Real-time programmable ice and applications in optical measurements |
| CN104570545B (zh) * | 2015-01-22 | 2017-07-14 | 上海交通大学 | 全光可调谐宽带线性调频信号的产生装置 |
| US10404397B2 (en) * | 2015-12-23 | 2019-09-03 | Adva Optical Networking Se | Wavelength division multiplexed telecommunication system with automatic compensation of chromatic dispersion |
| US10122460B2 (en) | 2017-01-13 | 2018-11-06 | Adva Optical Networking Se | Method and apparatus for automatic compensation of chromatic dispersion |
| FR3078598B1 (fr) * | 2018-03-01 | 2020-02-07 | Thales | Dispositif et procede photonique de conversion de frequence a double bande |
| US11243141B2 (en) * | 2018-09-21 | 2022-02-08 | National Institute Of Standards | Method and apparatus for chromatic dispersion measurement based on optoelectronic oscillations |
| US10931376B2 (en) | 2019-04-30 | 2021-02-23 | At&T Intellectual Property I, L.P. | Enhancement of optical communications and optical fiber performance |
Family Cites Families (23)
| Publication number | Priority date | Publication date | Assignee | Title |
|---|---|---|---|---|
| JPS59157524A (ja) | 1983-02-28 | 1984-09-06 | Fujitsu Ltd | 光フアイバの波長分散係数測定方法 |
| CA1195138A (en) * | 1983-06-06 | 1985-10-15 | Paul J. Vella | Measuring chromatic dispersion of fibers |
| JPS60127430A (ja) | 1983-12-14 | 1985-07-08 | Fujitsu Ltd | 単一モ−ドフアイバの波長分散測定法 |
| JPS61234330A (ja) * | 1985-04-10 | 1986-10-18 | Sumitomo Electric Ind Ltd | シングルモ−ドフアイバの分散測定法 |
| JPS6215430A (ja) | 1985-07-15 | 1987-01-23 | Fujitsu Ltd | 光フアイバ測定装置 |
| JPS6242023A (ja) | 1985-08-20 | 1987-02-24 | Fujitsu Ltd | 波長分散測定器 |
| US4856899A (en) * | 1985-12-20 | 1989-08-15 | Yokogawa Electric Corporation | Optical frequency analyzer using a local oscillator heterodyne detection of incident light |
| JPH079386B2 (ja) * | 1988-05-18 | 1995-02-01 | 国際電信電話株式会社 | 光ファイバ分散特性測定方式 |
| US5298962A (en) * | 1992-11-05 | 1994-03-29 | Hughes Aircraft Company | Pulse compression signal processor utilizing identical saw matched filters for both up and down chirps |
| JP2994531B2 (ja) * | 1993-07-06 | 1999-12-27 | ケイディディ株式会社 | 光波長分散測定方法及び装置 |
| JP3237684B2 (ja) | 1993-10-19 | 2001-12-10 | 日本電信電話株式会社 | 光ファイバの波長分散測定装置 |
| US5956131A (en) * | 1996-07-17 | 1999-09-21 | Lucent Technologies Inc. | System and method for mapping chromatic dispersion in optical fibers |
| US5969806A (en) * | 1997-06-30 | 1999-10-19 | Tyco Submarine Systems Ltd. | Chromatic dispersion measurement in a fiber optic cable |
| JP3090197B2 (ja) * | 1997-07-28 | 2000-09-18 | 日本電気株式会社 | 波長多重光通信装置 |
| JP3394902B2 (ja) * | 1998-02-20 | 2003-04-07 | アンリツ株式会社 | 波長分散測定装置及び偏波分散測定装置 |
| EP0948151B1 (de) * | 1998-03-30 | 2006-02-01 | Fujitsu Limited | Verfahren zur Einstellung der Signalwellenlänge in einem optischen Übertragungssystem |
| JP3337980B2 (ja) * | 1998-06-29 | 2002-10-28 | 沖電気工業株式会社 | 光送信器及び光伝送システム |
| JP2000019068A (ja) | 1998-06-30 | 2000-01-21 | Fujitsu Ltd | 波長分散測定装置及び方法 |
| JP3536688B2 (ja) * | 1998-11-09 | 2004-06-14 | Kddi株式会社 | Wdm光伝送システム及び方法並びに光送信装置 |
| JP2000329651A (ja) * | 1999-05-19 | 2000-11-30 | Advantest Corp | 偏波モード分散測定装置 |
| US6388785B2 (en) * | 2000-02-08 | 2002-05-14 | University Of Southern California | Optical compensation for dispersion-induced power fading in optical transmission of double-sideband signals |
| US6362874B1 (en) * | 2000-03-08 | 2002-03-26 | Lucent Technologies Inc. | Polarization mode dispersion measurement using phase-sensitive sideband detection |
| US6407805B1 (en) * | 2000-06-02 | 2002-06-18 | Agilent Technologies, Inc. | Time delay measurement using optical signals modulated at multiple frequencies |
-
2000
- 2000-08-09 JP JP2000240594A patent/JP4004720B2/ja not_active Expired - Fee Related
-
2001
- 2001-02-26 US US09/791,847 patent/US6573985B2/en not_active Expired - Fee Related
- 2001-03-02 EP EP01104531A patent/EP1179728A3/de not_active Withdrawn
Cited By (4)
| Publication number | Priority date | Publication date | Assignee | Title |
|---|---|---|---|---|
| ES2216689A1 (es) * | 2002-10-02 | 2004-10-16 | Universitat Politecnica De Catalunya | Metodo para medir la respuesta frecuencial de retardo de grupo eliminando errores debidos a variaciones frecuenciales en la respuesta de amplitud. |
| ES2216689B1 (es) * | 2002-10-02 | 2006-04-01 | Universitat Politecnica De Catalunya | Metodo para medir la respuesta frecuencial de retardo de grupo eliminando errores debidos a variaciones frecuenciales en la respuesta de amplitud. |
| WO2009079168A1 (en) | 2007-12-17 | 2009-06-25 | Verizon Services Organization Inc. | In-channel residual chromatic dispersion measurement |
| EP2245767A4 (de) * | 2007-12-17 | 2013-04-24 | Verizon Patent & Licensing Inc | Kanalinterne messung der restlichen chromatischen dispersion |
Also Published As
| Publication number | Publication date |
|---|---|
| US6573985B2 (en) | 2003-06-03 |
| JP4004720B2 (ja) | 2007-11-07 |
| EP1179728A3 (de) | 2003-08-20 |
| JP2002055025A (ja) | 2002-02-20 |
| US20020018213A1 (en) | 2002-02-14 |
Similar Documents
| Publication | Publication Date | Title |
|---|---|---|
| US6573985B2 (en) | Wavelength dispersion measuring device and a method thereof | |
| US7035538B2 (en) | Monitoring optical dispersion based on vestigial side band optical filtering | |
| EP2375591B1 (de) | Ausgleichsvorrichtung für die Polarisierungsfluktuation und optisches Kommunikationssystem | |
| US20030020985A1 (en) | Receiver for high-speed optical signals | |
| US20030194166A1 (en) | Apparatus and method for measurement and adaptive control of polarization mode dispersion in optical fiber transmission systems | |
| US20030165286A1 (en) | Wavelength division multiplex transmission system | |
| JP4278913B2 (ja) | 波長分散と偏波モード分散を共に補償するシステム及び方法 | |
| US11106111B2 (en) | Multiple Kerr-frequency-comb generation using different lines from a remote Kerr comb | |
| US7512345B2 (en) | Wavelength division multiplexing optical transmission system and method | |
| US20050047791A1 (en) | Dispersion compensation control method and apparatus thereof and optical transmission method and system thereof | |
| JP2014049987A (ja) | 光信号受信装置、光信号受信方法および光周波数分割多重伝送システム | |
| JPH1048582A (ja) | 変調装置、送信装置、変調方法及び通信システム | |
| US20030180051A1 (en) | Wavelength division multiplex transmission system or a polarisation division multiplex system with means for measuring dispersion characteristics, an optical transmitter, an optical receiver and a method therefore | |
| US8498536B2 (en) | Dispersion measurement of optical fibres during operation | |
| JP2019200379A (ja) | 波長変換装置、伝送装置、及び伝送システム | |
| JP3147563B2 (ja) | 光分散補償方法および光分散補償器 | |
| JP2004221968A (ja) | 光伝送方式 | |
| JP2004228925A (ja) | 波長多重光伝送装置 | |
| US6788833B1 (en) | Method and system for suppressing signal distortions associated with nonlinearity in optical fibers | |
| JP3379473B2 (ja) | 分散測定装置 | |
| EP2725725B1 (de) | Optisches Übertragungssystem und Steuerungsverfahren | |
| EP1381176A2 (de) | Vorrichtung zur Messung der Farbenzerstreuung | |
| JP3788417B2 (ja) | 分散測定方法 | |
| JP2004128974A (ja) | 分散モニタ装置、分散モニタ方法および自動分散補償システム | |
| EP2575277A2 (de) | Optische Empfangsvorrichtung und optisches Netzwerksystem |
Legal Events
| Date | Code | Title | Description |
|---|---|---|---|
| PUAI | Public reference made under article 153(3) epc to a published international application that has entered the european phase |
Free format text: ORIGINAL CODE: 0009012 |
|
| AK | Designated contracting states |
Kind code of ref document: A2 Designated state(s): AT BE CH CY DE DK ES FI FR GB GR IE IT LI LU MC NL PT SE TR |
|
| AX | Request for extension of the european patent |
Free format text: AL;LT;LV;MK;RO;SI |
|
| PUAL | Search report despatched |
Free format text: ORIGINAL CODE: 0009013 |
|
| AK | Designated contracting states |
Designated state(s): AT BE CH CY DE DK ES FI FR GB GR IE IT LI LU MC NL PT SE TR |
|
| AX | Request for extension of the european patent |
Extension state: AL LT LV MK RO SI |
|
| 17P | Request for examination filed |
Effective date: 20030821 |
|
| AKX | Designation fees paid |
Designated state(s): DE FR GB |
|
| STAA | Information on the status of an ep patent application or granted ep patent |
Free format text: STATUS: THE APPLICATION HAS BEEN WITHDRAWN |
|
| 18W | Application withdrawn |
Effective date: 20060502 |