EP0483527A2 - Burst signal spectrum measuring system with stepwise sweeping - Google Patents
Burst signal spectrum measuring system with stepwise sweeping Download PDFInfo
- Publication number
- EP0483527A2 EP0483527A2 EP91116629A EP91116629A EP0483527A2 EP 0483527 A2 EP0483527 A2 EP 0483527A2 EP 91116629 A EP91116629 A EP 91116629A EP 91116629 A EP91116629 A EP 91116629A EP 0483527 A2 EP0483527 A2 EP 0483527A2
- Authority
- EP
- European Patent Office
- Prior art keywords
- frequency
- measuring
- signal
- burst
- burst signal
- Prior art date
- Legal status (The legal status is an assumption and is not a legal conclusion. Google has not performed a legal analysis and makes no representation as to the accuracy of the status listed.)
- Withdrawn
Links
- 238000001228 spectrum Methods 0.000 title claims description 94
- 238000010408 sweeping Methods 0.000 title description 5
- 238000001514 detection method Methods 0.000 claims abstract description 60
- 230000010355 oscillation Effects 0.000 claims abstract description 35
- 230000008859 change Effects 0.000 claims abstract description 11
- 230000001360 synchronised effect Effects 0.000 claims abstract description 7
- 238000005259 measurement Methods 0.000 claims description 82
- 238000000034 method Methods 0.000 claims description 22
- 238000004364 calculation method Methods 0.000 claims description 16
- 230000004044 response Effects 0.000 claims description 13
- 238000012935 Averaging Methods 0.000 claims description 12
- 238000009825 accumulation Methods 0.000 claims description 5
- 238000006243 chemical reaction Methods 0.000 claims description 3
- 238000005070 sampling Methods 0.000 description 17
- 230000006870 function Effects 0.000 description 11
- 238000010586 diagram Methods 0.000 description 10
- 230000003595 spectral effect Effects 0.000 description 6
- 238000010183 spectrum analysis Methods 0.000 description 6
- 238000009826 distribution Methods 0.000 description 5
- 238000012986 modification Methods 0.000 description 4
- 230000004048 modification Effects 0.000 description 4
- 230000011664 signaling Effects 0.000 description 4
- 230000003111 delayed effect Effects 0.000 description 2
- 230000002093 peripheral effect Effects 0.000 description 2
- 238000002360 preparation method Methods 0.000 description 2
- 230000002035 prolonged effect Effects 0.000 description 2
- 230000002411 adverse Effects 0.000 description 1
- 230000008901 benefit Effects 0.000 description 1
- 238000011161 development Methods 0.000 description 1
- 230000018109 developmental process Effects 0.000 description 1
- 239000002699 waste material Substances 0.000 description 1
Images






Classifications
-
- G—PHYSICS
- G01—MEASURING; TESTING
- G01R—MEASURING ELECTRIC VARIABLES; MEASURING MAGNETIC VARIABLES
- G01R23/00—Arrangements for measuring frequencies; Arrangements for analysing frequency spectra
- G01R23/16—Spectrum analysis; Fourier analysis
- G01R23/173—Wobbulating devices similar to swept panoramic receivers
Definitions
- the present invention generally relates to a spectrum analyzing system for receiving and sweeping a measuring signal to analyze a spectrum thereof and, more particularly, to a spectrum analyzer for discretely selecting and receiving a frequency component included in a burst signal and measuring the frequency component.
- a conventional spectrum analyzer has an arrangement of Fig. 17 to display a frequency component included in a measuring signal as a series of spectral waveforms on a screen.
- reference numeral 1 denotes a measuring unit for sweeping and detecting a measuring signal.
- the measuring unit 1 is arranged to cause a mixer 3 to frequency-convert the input measuring signal in accordance with a local oscillation signal from a sweep oscillator 2 and cause a detector 5 to detect a signal passing through a band-pass filter 4.
- Reference numeral 7 denotes a sweep control circuit for sweeping and controlling the frequency of the local oscillation signal in accordance with a sweep signal.
- Reference numeral 8 denotes a display unit for displaying a detection output from the detector 5 on a frequency axis. A spectral waveform of the measuring signal falling within the frequency range determined by the sweep signal is displayed on the screen of the display unit 8.
- a measuring signal having a frequency F1 shown in Fig. 18A is input, assuming that a sweep signal corresponding to the frequency range from a start frequency F0 lower than the frequency F1 to a frequency several times the frequency F1 is output, as shown in Fig. 18B, a spectral waveform shown in Fig. 18C is displayed on the screen of the display unit 8.
- the sweep period may be shortened.
- the band of the band-pass filter 4 and the response time of the detector 5 are limited, the conventional spectrum analyzer cannot cope with a high-speed burst modulated signal.
- a general spectrum analyzer comprises a local oscillator and a mixer.
- the local oscillator is frequency-swept for a predetermined sweep period to sequentially convert signals in a frequency range to be measured into intermediate frequency (IF) signals.
- IF intermediate frequency
- the bandwidth of the received IF signals are narrowed by a band-pass filter having a desired bandwidth.
- the frequency-analyzed signals are then detected.
- the swept and analyzed signal is displayed such that its frequency is plotted along the abscissa and the corresponding signal amplitude is plotted along the ordinate.
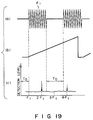
- the above general spectrum analyzer When the above general spectrum analyzer is used to perform spectrum analysis upon reception of a burst signal (e.g., a signal obtained such that a high-frequency signal F1 amplitude-modulated by a rectangular low-frequency signal F0 used as in a television system repeats ON and OFF intervals at a period of the low-frequency signal, as shown in Fig. 20), the sweep time of the spectrum analyzer is not sufficiently matched with the ON interval (or the OFF interval) of the burst signal. As a result, a satisfactory measurement result cannot be obtained.
- a burst signal e.g., a signal obtained such that a high-frequency signal F1 amplitude-modulated by a rectangular low-frequency signal F0 used as in a television system repeats ON and OFF intervals at a period of the low-frequency signal, as shown in Fig. 20
- the spectrum of the burst signal shown in Fig. 20 has a well-known distribution, as shown in Fig. 21. This distribution is measured and observed with the general spectrum analyzer for performing so-called continuous sweep for a sweep time long enough to render the ON/OFF intervals of the burst signal negligible.
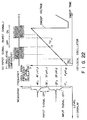
- Fig. 22 is an example of a measurement of a harmonic wave of a signal F1 included in the burst signal, as shown in (a) of Fig. 22.
- the frequency of a local oscillator is swept to receive signals of the measuring frequency F1 to frequency F4 by a sweep voltage (the frequency of the local oscillator is a frequency as a sum of the measuring frequency and an intermediate frequency F if ). Since the burst signal of the input signal is set in a non-signaling state during the OFF interval T0, the measuring frequencies F1 and 3F1 received in this state cannot be measured.
- the measuring frequencies 2F1 and 4F1 can be measured because the burst signal is present during the reception time.
- the spectrum analyzer in Reference 3 is the same as the general spectrum analyzer up to detection of the spectrum. Continuous analog frequency sweep is performed regardless of the OFF/ON intervals of the burst signal, and the spectrum is detected. The detected and output spectrum data is processed as follows.
- References 1, 2, and 3 disclose a technique aiming at obtaining and displaying the whole spectrum distribution of the high-frequency signal included in the burst signal as continuous spectrum data independently of the ON/OFF timings of the burst signal. For example, even if all components from a tailing portion near -70 dB of the high-frequency signal included in the burst signal to a peak value near 0 dB are to be measured, continuous display as in the general spectrum analyzer incompatible with a conventional burst signal can be performed, resulting in convenience.
- a plurality of specific discrete frequency levels may often be measured as an application of a spectrum analyzer.
- the above spectrum analyzers of References 1, 2, and 3 have following drawbacks 1 , 2 .
- the measurement of a plurality of specific discrete frequency levels is exemplified as follows.
- the level of the frequency F1 (F1 ⁇ F2 ⁇ F3 ⁇ F4) of the burst signal output from a transmitter must be 10 dBm or more and the levels of the frequencies F2, F3, and F4 must be -60 dB or less with respect to the level of the frequency F0.
- an object of the present invention to provide a new and improved spectrum analyzing apparatus which can measure a spectrum of a burst signal within a short period of time.
- a desired high-frequency signal is discretely selected from high-frequency signals synchronized with the ON interval and included in units of ON intervals, thereby performing spectrum analysis.
- a frequency to be measured is not set in a level measuring time (i.e., an ON interval of the burst signal), but is set during the OFF interval of the burst signal. That is, the level of the burst signal is not swept during the measurement, and an influence of the sweep time in equation (1) can be prevented. Therefore, the level of the discrete specific frequency component can be measured within a short period of time.
- the time zone for analyzing each frequency component and the time zone for receiving each burst component can always have a predetermined relationship. For example, it is possible to perform analysis of only a 20- ⁇ m interval from the leading edge of a burst component having a 100- ⁇ s duration at all frequency points.
- a spectrum analyzing apparatus comprising: receiving means for receiving a burst signal to be measured, converting the burst signal into an intermediate frequency signal in accordance with a local oscillation signal having a predetermined swept frequency, and detecting the intermediate frequency signal, thereby outputting a signal representing a spectrum of the burst signal; frequency setting means for setting frequency information for determining a plurality of measuring frequencies from a first measuring frequency to an n th (where n is a natural number) measuring frequency; measuring time determining means for determining measurement start and end times in association with the burst signal and for outputting measurement start and end signals corresponding to the measurement start and end times; frequency control means for determining a desired number of measuring frequencies from an i th (where 1 ⁇ i ⁇ n ) measuring frequency to a k th (where i ⁇ k ⁇ n ) measuring frequency in accordance with the frequency information set by the frequency setting means, and for stepwise-setting the pre
- a method for measuring a spectrum of a burst signal comprising the steps of: receiving a burst signal to be measured, converting the burst signal into an intermediate frequency signal in accordance with a local oscillation signal having a predetermined swept frequency, detecting the intermediate frequency signal, and outputting a signal representing a spectrum of the burst signal; preparing a predetermined number n of measuring frequencies; setting the sweep frequency of the local oscillation signal to a frequency for receiving a first measuring frequency of the predetermined number n of measuring frequencies; performing first measuring time determination for determining start and end times of a first measuring time in correspondence with a first burst portion of the burst signal; performing first level detection for detecting a level of the first measuring frequency included in the burst signal between the start and end times of the first measuring time in accordance with the signal representing the spectrum of the burst signal; performing first next-stage setting for setting the sweep frequency of the local oscillation signal to a frequency for
- a method for measuring a spectrum of a burst signal using a spectrum analyzer for receiving an input signal, converting the input signal into an intermediate frequency signal in accordance with a local oscillation signal of a predetermined swept frequency oscillated by a local oscillator, detecting the intermediate frequency signal, and outputting spectrum data of the input signal comprising the steps of: preparing a predetermined number n of measuring frequencies; setting the local oscillator to an oscillation frequency for receiving a first measuring frequency of the predetermined number n of measuring frequencies; performing first measuring time determination for determining start and end times of a first measuring time in correspondence with a first burst portion of the burst signal; performing first level detection for detecting a level of the first measuring frequency included in the burst signal between the start and end times of the first measuring time in accordance with the spectrum data from the spectrum analyzer; performing first next-stage setting for setting the local oscillator to an oscillation frequency for receiving a second measuring frequency of the
- a spectrum analyzer comprising: a measuring unit for converting a measuring signal into an intermediate frequency band of a predetermined bandwidth and detecting the intermediate frequency band while a reception frequency is set variable by variably controlling a local oscillation frequency of a local oscillator; a waveform memory for storing a magnitude of a detection signal output from the measuring unit in correspondence with a frequency; means for analyzing a frequency component included in a signal to be measured, on the basis of a storage value of the waveform memory; analysis target frequency data setting means for setting frequency data of a desired analysis target frequency or interval frequency data thereof; and sweep control means for changing the reception frequency of the measuring unit into the desired analysis target frequency corresponding to the frequency data set by the analysis target frequency data setting means and for outputting an address signal corresponding to the received analysis target frequency to the waveform memory every time a signal synchronized with an ON/OFF change of the signal to be measured is received.
- the desired analysis target frequency signals are sequentially received, and their detection outputs are sequentially stored at addresses of the waveform memory in correspondence with the analysis target frequencies.
- Fig. 1 is a block diagram showing an arrangement of a spectrum analyzer according to the first embodiment of the present invention.
- a measuring unit 10 frequency-converts a measuring signal input to a mixer 11 into an intermediate frequency band in accordance with a local oscillation signal from a local oscillator 12, and causes a detector 14 to detect a signal passing through a band-pass filter 13.
- the bandwidth of this band-pass filter 13 determines the resolution of this spectrum analyzer.
- This local oscillator 12 comprises a synthesizer type oscillator having extremely high frequency stability to output a local oscillation signal having a frequency higher than the input frequency data by a center frequency (intermediate frequency) of the band-pass filter 13.
- a comparator 15 compares an output voltage from the detector 14 with a reference voltage Vr. When a detection output voltage exceeding the reference voltage Vr is input to the comparator 15, its output is set at "H" level.
- a switch 16 is kept on while the output from the comparator 15 is kept at "H" level.
- a peak hold circuit 17 holds a peak value of the detection output input through the switch 16.
- a sampling circuit 18 samples the peak value held by the peak hold circuit 17 and converts the peak value into a digital value.
- a sampling signal generator 19 outputs a sampling pulse synchronized with a trailing edge of an output from the comparator 15 to the sampling circuit 18.
- a reset signal generator 20 outputs a reset signal slightly delayed from the sampling signal to the peak hold circuit 17, thereby resetting the peak hold circuit 17.
- a waveform memory 21 sequentially stores output values from the sampling circuit 18 as spectrum values.
- the waveform memory 21 has, for example, 500 addresses.
- a display unit 22 develops spectrum values stored in the waveform memory 21 and displays the spectrum values on a frequency axis.
- a start frequency setting unit 30 sets a sweep start frequency F(st).
- a frequency span setting unit 31 sets a sweep frequency span F(sp).
- a frequency step setting unit 32 sets a sweep frequency step ⁇ F.
- a sweep control unit 33 comprises a reception frequency variable unit 33a for increasing frequency data for the local oscillator 12 by ⁇ F and an address variable unit 33b for addressing the waveform memory 21 every time the reset signal is received from the reset signal generator 20.
- Fig. 2 shows an arrangement of the sweep control unit 33.
- the frequency step ⁇ F set in the frequency step setting unit 32 is input to an adder 35 together with storage data of a register 34.
- a sum from the adder 35 is updated and set in the register 34 through a switch 36.
- the switch 36 is turned on every time the reset signal from the reset signal generator 20 is received.
- a start frequency F(st) set in the start frequency setting unit 30 is added to the storage value of the register 34 in an adder 37.
- a sum from the adder 37 is output as frequency data for the local oscillator 12.
- An address step calculation unit 38 multiplies a total address count P (500 in this case) of the waveform memory 21 with a value obtained by dividing the set frequency step ⁇ F by the frequency span F(sp) to calculate an address step of the waveform memory 21 in correspondence with the frequency step ⁇ F.
- This address step ⁇ A is input together with the storage value of a register 39 to an adder 40.
- An output from the adder 40 updates the current value of the register 39 and is set therein through a switch 41.
- This switch 41 is turned on every time it receives the reset signal from the reset signal generator 20.
- a reset circuit 42 resets the registers 34 and 39.
- the functions of the sweep control unit 33 can be achieved by a CPU and its peripheral circuits in practice.
- the start frequency F(st) and the frequency step ⁇ F are set to F1
- the frequency span is set to F2 higher several times the frequency F1 (in this case, assume that both the storage contents of the registers 34 and 39 of the sweep control unit 33 are set to "0").
- the local oscillator 12 outputs a local oscillation signal having a frequency obtained by adding an intermediate frequency to F1.
- the frequency F1 of a fundamental wave of the burst signal is set in a reception enable state.
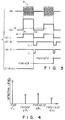
- a peak value of a detection output obtained while the switch 16 is ON is held by the peak hold circuit 17.
- a sampling signal falling in synchronism with the trailing edge of the output from the comparator is output from the sampling signal generator 19, as shown in (d) of Fig. 3.
- Spectrum data sampled at time t2 by this sampling signal is stored in the waveform memory 21 addressed ("0" in this case) by an output value of the register 39 in the sweep control unit 33.
- the apparatus when a burst signal is input and its detection output voltage is higher than the reference voltage Vr, the apparatus is shifted to a state for receiving harmonic waves of higher orders.
- spectrum data stored in the waveform memory 21 by step sweep for every frequency F1 is read out by the display unit 22.
- the readout spectrum data is displayed as a spectral line shape on the frequency axis.
- the level of the fundamental wave of the input burst signal and the levels of its harmonic components are observed on this display screen.
- the local oscillator 12 in the measuring unit 10 comprises a synthesizer type oscillator having frequency stability much higher than that of an analog oscillator, even if a nonsignaling state of the burst signal continues for a relatively long period of time, a measurement error caused by a frequency drift and nonlinearity of the sweep frequency does not occur. Observation having high reproducibility can be performed.
- the frequency step is set to the frequency of the fundamental wave of the burst signal, and measurements of this fundamental wave and its harmonic components are performed at the respective points. If a frequency step is larger than a value obtained by dividing the frequency span F(sp) by the address count P of the waveform memory 21, arbitrary setting can be performed.
- the frequency step need not be a permanent value.
- an arbitrary reception frequency (or an arbitrary frequency step) may be stored in a frequency table 51, and the reception frequency may be set variable stepwise in accordance with frequency data read out in response to an output from a counter 52 for counting an output count of the sampling or reset signals.
- sweeping may be performed near the next spectrum by a large frequency step ⁇ F2.
- the input of the burst signal is detected by the detection output from the measuring unit 10.
- a measuring signal may be detected by a wide-band detector 60, and a detection voltage signal therefrom may be input to the comparator 15. Even if a spectrum having a high level is not present in the initial reception frequency (start frequency), stepwise sweep can be started.
- sampling of the detection output and stepwise sweep are started by an input level of a burst signal.
- an external gate signal synchronized with a burst period may be input in place of a comparator output. In this case, even if disturbance noise is input in a non-signaling state, the step variable unit for the reception frequency in the measuring unit is not started.
- one (e.g., W a ) of a plurality of signals e.g., W a , W b , and W c ) having different frequency distributions and generated in a time-serial order (e.g., W a , W b , W c , W a , W b , W c ) can be extracted in accordance with an external gate signal and can be analyzed.
- reception of a signal component of an analysis target frequency corresponding to preset frequency data can be switched in synchronism with the ON/OFF change of the measuring signal.
- Spectra such as that of a burst signal modulated with a high-speed pulse can be accurately measured in a state free from an unobservable range.
- a description of a method is incorporated in a description of an apparatus because the method is described in the form of control of the apparatus.
- the description of the method is included in a series of operation descriptions in item (2) below.
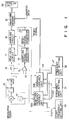
- Fig. 9 shows an arrangement of a spectrum analyzer according to the second embodiment of the present invention.
- Fig. 9 (I and II) mainly describes components required to practice the present invention. Components required when the apparatus is used as a general spectrum analyzer but not required for practicing the present invention are not described.
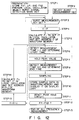
- a burst measurement key 7a of function keys 7 in Fig. 9 (I and II) when a burst measurement key 7a of function keys 7 in Fig. 9 (I and II) is set, spectrum analysis of a burst signal is performed by the spectrum analyzer.
- a normal measurement key 7b When a normal measurement key 7b is set, general spectrum analysis is performed. The arrangement and operation upon operation of the normal measurement key 7b will be omitted.
- Fig. 9 shows an arrangement obtained by systematizing the respective parts of the first embodiment and adding some new components thereto.
- the arrangement of Fig. 9 incorporates a function of spectrum analysis of a burst signal and enhances this function.
- the level measurement and display operations are repeated in each measurement stage. However, levels may be displayed after all the measurements are completed.
- the input signal is a PSK-modulated signal such as a ⁇ /4-shifted QPSK signal
- its amplitude is constantly changed.
- frequency components are not measured throughout the entire burst range, its maximum peak cannot be detected.
- the present invention is based on peak detection in one burst range while the reception frequency is fixed at each frequency point. Therefore, the characteristics of any burst signal can be sufficiently analyzed regardless of its modulation schemes.
- the present invention is not limited to the burst signal as its object. For example, even if three different signals, i.e., Wa, Wb, and Wc are continuously and repeatedly input, only the signal Wa can be received as an external synchronization signal, thereby analyzing the spectrum of this frequency component.
- the frequency setting unit 2 can be set for only the target frequencies, thereby eliminating measurement of unnecessary frequency components and hence performing high-speed measurements.
- the frequency control unit 3 may be arranged, as shown in Fig. 14.
- the frequency setting unit 2 is arranged to receive the absolute value of a measuring frequency and write it in a frequency table 3d.
- the frequency table 3d outputs frequency data to the local oscillator 1a in a predetermined order every time an initialization setting signal or reset signal is input.
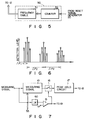
- Fig. 15 shows another arrangement of a level detector 5 according to the second embodiment as shown in Figs. 9-I and 9-II.
- the level detector 5 comprises a gate circuit 5a, an A/D converter 5d, a gate time measuring unit 5e, and a root-mean-squre (r.m.s) calculating unit 5f.
- the gate time measuring unit 5e measures the ON interval of the gate signal and transmits measured time T to the r.m.s calculation unit 5f.
- the A/D converter 5d always performs conversion of the time T at a period which can be divided into a plurality of times (e.g., 100 times).
- the resultant data is supplied from the A/D converter 5d to the r.m.s calculation unit 5f through the gate circuit 5a.
- the calculation content of the r.m.s calculation unit 5f is cleared in response to the reset signal.
- the r.m.s calculation unit 5f then performs an accumulation calculation of (where T is given from the gate time measuring unit 5e) for data x supplied through the gate circuit 5a and completes this calculation in response to a sampling signal, thereby outputting the calculation result to the waveform memory 9.
- the r.m.s calculation unit 5f performs the following calculation:
- Fig. 16 shows still another arrangement based on the second embodiment of Figs. 9-I and 9-II. While the system of Figs. 9-I and 9-II switches the measuring frequency every burst component, the system of Fig. 16 switches the frequency every time K burst components are received and its average value is calculated. An averaging unit 55 is added in the arrangement of Fig. 16.
- the averaging unit 55 comprises an averaging circuit 55a for calculating an average value of the sum i.e., of detection data y output for very burst component from the level detector and supplying the average value to the waveform memory, and a 1/K frequency divider 55b for initializing the averaging circuit 55a in response to a reset signal every time K-time averaging is completed, and outputting a 1/K reset signal to cause the frequency control circuit to update the reception frequency and the waveform memory to update its content. Note that the averaging circuit 55a and the 1/K frequency divider 55b are initialized prior to the start of measurement.
- the arrangement of Fig. 16 requires averaging of the measurement results.
- the frequency switching time required for controlling the local frequency stepwise can be shortened to 1/K by performing K-time measurements at the same frequency.
- the second embodiment of the present invention can effectively cope with spectrum analysis of the burst signal.
- a method of measuring the discrete spectra of the burst signal within a short period of time and measuring a peak value of the spectra of the burst signal and a system for measuring a spectrum of the burst signal by stepwise sweep by means of a spectrum analyzer.
- an address variable unit 3c may be used as a simple counter for generating consecutive values such as 0, 1, 2, 3,..., and addresses 0, 1, 2, 3,... of a waveform memory may be accessed in accordance with these values.
- Data stored at the addresses 0, 1, 2, 3,... of the waveform memory may be displayed at positions corresponding to addresses 0, P/n, 2P/n, and 3P/n,... of the waveform memory, respectively.
- a circuit equivalent to the address variable unit 3c in Fig. 10 is required in the waveform memory.
Landscapes
- Physics & Mathematics (AREA)
- Mathematical Physics (AREA)
- General Physics & Mathematics (AREA)
- Monitoring And Testing Of Transmission In General (AREA)
Applications Claiming Priority (2)
| Application Number | Priority Date | Filing Date | Title |
|---|---|---|---|
| JP26187790 | 1990-09-29 | ||
| JP261877/90 | 1990-09-29 |
Publications (2)
| Publication Number | Publication Date |
|---|---|
| EP0483527A2 true EP0483527A2 (en) | 1992-05-06 |
| EP0483527A3 EP0483527A3 (enExample) | 1994-01-19 |
Family
ID=17368005
Family Applications (1)
| Application Number | Title | Priority Date | Filing Date |
|---|---|---|---|
| EP91116629A Withdrawn EP0483527A2 (en) | 1990-09-29 | 1991-09-27 | Burst signal spectrum measuring system with stepwise sweeping |
Country Status (2)
| Country | Link |
|---|---|
| US (1) | US5210483A (enExample) |
| EP (1) | EP0483527A2 (enExample) |
Cited By (1)
| Publication number | Priority date | Publication date | Assignee | Title |
|---|---|---|---|---|
| EP0992159A4 (en) * | 1997-06-27 | 2001-01-31 | Trilithic Inc | ACCESS NOISE MONITORING SYSTEM |
Families Citing this family (11)
| Publication number | Priority date | Publication date | Assignee | Title |
|---|---|---|---|---|
| US5493209A (en) * | 1993-10-20 | 1996-02-20 | Tektronix, Inc. | Tunable trigger acquisition system and method for making in-service time-domain signal measurements |
| JPH08248070A (ja) * | 1995-03-08 | 1996-09-27 | Anritsu Corp | 周波数スペクトル分析装置 |
| JPH09196977A (ja) * | 1996-01-16 | 1997-07-31 | Advantest Corp | スペクトラムアナライザ |
| US5939887A (en) * | 1997-09-05 | 1999-08-17 | Tektronix, Inc. | Method for measuring spectral energy interference in a cable transmission system |
| JPH11133072A (ja) * | 1997-10-27 | 1999-05-21 | Advantest Corp | スペクトラムアナライザ測定方法 |
| US6421619B1 (en) | 1998-10-02 | 2002-07-16 | International Business Machines Corporation | Data processing system and method included within an oscilloscope for independently testing an input signal |
| US6389365B1 (en) * | 1999-08-25 | 2002-05-14 | Agilent Technologies, Inc. | Method for operating a spectrum analyzer to display a marker of a signal of interest |
| EP1635181A1 (en) * | 2004-09-13 | 2006-03-15 | Rohde & Schwarz GmbH & Co. KG | Apparatus and method for pulse measurement |
| US7714564B2 (en) * | 2008-01-16 | 2010-05-11 | Agilent Technologies, Inc. | Gated sweep in spectrum analyzers |
| CN103259534B (zh) * | 2013-05-20 | 2016-04-20 | 中国电子科技集团公司第四十一研究所 | 一种改进信号分析仪扫描线性度的方法 |
| KR101812915B1 (ko) * | 2014-04-15 | 2017-12-27 | 미쓰비시덴키 가부시키가이샤 | 회로 차단기 |
Family Cites Families (11)
| Publication number | Priority date | Publication date | Assignee | Title |
|---|---|---|---|---|
| DE1591819C3 (de) * | 1967-10-24 | 1973-10-18 | Wandel U. Goltermann, 7410 Reutlingen | Dekadisch einstellbarer Wobbeisender |
| US4007423A (en) * | 1974-12-09 | 1977-02-08 | Intech Laboratories, Inc. | System and apparatus for electronic spectral analysis |
| GB2034900B (en) * | 1978-11-17 | 1982-10-20 | Marconi Instruments Ltd | Spectrum analyser |
| DE3504759C2 (de) * | 1984-02-16 | 1997-08-28 | Hewlett Packard Co | Wobbel-Messvorrichtung |
| JPS61174674U (enExample) * | 1985-04-22 | 1986-10-30 | ||
| JPH0664822B2 (ja) * | 1986-02-17 | 1994-08-22 | アルプス電気株式会社 | デイスク駆動装置 |
| JPH07122648B2 (ja) * | 1986-11-22 | 1995-12-25 | ソニー株式会社 | スペクトラムアナライザ |
| US4845691A (en) * | 1987-06-02 | 1989-07-04 | Anritsu Corporation | Group delay time measurement apparatus with automatic aperture value setting function |
| JP2766685B2 (ja) * | 1988-09-26 | 1998-06-18 | アンリツ株式会社 | スペクトラムアナライザ |
| US5038096A (en) * | 1989-07-28 | 1991-08-06 | Hewlett-Packard Company | Spectrum analyzer circuit for pulsed input signals |
| JP2891497B2 (ja) * | 1990-01-25 | 1999-05-17 | アンリツ株式会社 | スペクトラムアナライザ |
-
1991
- 1991-09-26 US US07/767,074 patent/US5210483A/en not_active Expired - Fee Related
- 1991-09-27 EP EP91116629A patent/EP0483527A2/en not_active Withdrawn
Cited By (1)
| Publication number | Priority date | Publication date | Assignee | Title |
|---|---|---|---|---|
| EP0992159A4 (en) * | 1997-06-27 | 2001-01-31 | Trilithic Inc | ACCESS NOISE MONITORING SYSTEM |
Also Published As
| Publication number | Publication date |
|---|---|
| US5210483A (en) | 1993-05-11 |
| EP0483527A3 (enExample) | 1994-01-19 |
Similar Documents
| Publication | Publication Date | Title |
|---|---|---|
| US5210483A (en) | Burst signal spectrum measuring system with stepwise sweeping | |
| US4611164A (en) | Spectrum analyzer with automatic peak frequency tuning function | |
| US5068614A (en) | Swept frequency domain relectometry enhancement | |
| US4257104A (en) | Apparatus for spectrum analysis of an electrical signal | |
| JP2002506525A5 (enExample) | ||
| US4264958A (en) | Video processor for a spectrum analyzer | |
| JP2577566B2 (ja) | スペクトラムアナライザ | |
| US5818215A (en) | Direct digital synthesizer driven phase lock loop spectrum analyzer | |
| US5162724A (en) | Spectrum analyzer capable of displaying signals obtained during a specified period by means of continuous sweep | |
| JP2002296310A (ja) | 電力分布表示制御装置および電力分布表示制御方法 | |
| EP0420082B1 (en) | Digitally synchronized sweep signal source | |
| JP3375919B2 (ja) | 信号分析装置 | |
| JP4260344B2 (ja) | スペクトラムアナライザ | |
| JPH07209352A (ja) | スペクトラム・アナライザ | |
| US3990004A (en) | Multi-frequency range operation of a network analyzer system | |
| EP0150409B1 (en) | Keyboard-operated rf network analyzer | |
| EP1640734B1 (en) | A method and apparatus for measuring the input frequency response of a digital receiver | |
| US4138646A (en) | Wideband absolute calibration system | |
| JPH05172871A (ja) | バースト信号のスペクトラム測定方法及びスペクトラムアナライザ | |
| JP2001249149A (ja) | 信号分析装置 | |
| JP3369700B2 (ja) | バースト波立ち上がり立ち下がり特性評価装置 | |
| JP2849787B2 (ja) | 受信装置及びその自動校正方法。 | |
| US20060286953A1 (en) | Signal measuring device | |
| JP3127017B2 (ja) | 周波数分析装置 | |
| JP3102656B2 (ja) | スペクトラム・アナライザ |
Legal Events
| Date | Code | Title | Description |
|---|---|---|---|
| PUAI | Public reference made under article 153(3) epc to a published international application that has entered the european phase |
Free format text: ORIGINAL CODE: 0009012 |
|
| AK | Designated contracting states |
Kind code of ref document: A2 Designated state(s): DE FR GB |
|
| PUAL | Search report despatched |
Free format text: ORIGINAL CODE: 0009013 |
|
| AK | Designated contracting states |
Kind code of ref document: A3 Designated state(s): DE FR GB |
|
| 17P | Request for examination filed |
Effective date: 19940225 |
|
| STAA | Information on the status of an ep patent application or granted ep patent |
Free format text: STATUS: THE APPLICATION HAS BEEN WITHDRAWN |
|
| 18W | Application withdrawn |
Withdrawal date: 19950710 |