WO2024252604A1 - 情報処理装置、情報処理方法及び情報処理プログラム - Google Patents
情報処理装置、情報処理方法及び情報処理プログラム Download PDFInfo
- Publication number
- WO2024252604A1 WO2024252604A1 PCT/JP2023/021302 JP2023021302W WO2024252604A1 WO 2024252604 A1 WO2024252604 A1 WO 2024252604A1 JP 2023021302 W JP2023021302 W JP 2023021302W WO 2024252604 A1 WO2024252604 A1 WO 2024252604A1
- Authority
- WO
- WIPO (PCT)
- Prior art keywords
- improvement
- plan
- unit
- plans
- cost
- Prior art date
- Legal status (The legal status is an assumption and is not a legal conclusion. Google has not performed a legal analysis and makes no representation as to the accuracy of the status listed.)
- Ceased
Links
Images














Classifications
-
- G—PHYSICS
- G06—COMPUTING OR CALCULATING; COUNTING
- G06Q—INFORMATION AND COMMUNICATION TECHNOLOGY [ICT] SPECIALLY ADAPTED FOR ADMINISTRATIVE, COMMERCIAL, FINANCIAL, MANAGERIAL OR SUPERVISORY PURPOSES; SYSTEMS OR METHODS SPECIALLY ADAPTED FOR ADMINISTRATIVE, COMMERCIAL, FINANCIAL, MANAGERIAL OR SUPERVISORY PURPOSES, NOT OTHERWISE PROVIDED FOR
- G06Q10/00—Administration; Management
- G06Q10/06—Resources, workflows, human or project management; Enterprise or organisation planning; Enterprise or organisation modelling
- G06Q10/063—Operations research, analysis or management
- G06Q10/0631—Resource planning, allocation, distributing or scheduling for enterprises or organisations
Definitions
- This disclosure relates to improvement proposals for improving production activities.
- Patent Document 1 discloses a technology for evaluating improvement proposals for capital investment in the manufacturing industry.
- the costs required to implement an improvement plan include equipment costs and costs other than the equipment costs.
- the technology disclosed in Patent Document 1 takes into account the equipment costs, but does not take into account the costs other than the equipment costs.
- the costs other than the equipment costs are, for example, the costs of materials, workers, energy, etc.
- the technology disclosed in Patent Document 1 does not take into account costs other than equipment costs, and therefore has the problem that when manufacturing staff evaluate improvement proposals, they are unable to make a comprehensive evaluation that includes costs other than equipment costs.
- the primary objective of this disclosure is to resolve these issues. More specifically, the primary objective of this disclosure is to enable a comprehensive evaluation of improvement proposals, including costs other than equipment costs.
- the information processing device includes: an investment cost calculation unit that calculates an equipment cost required for implementing each of a plurality of improvement plans for improving production activities and a cost other than the equipment cost as an investment cost; an improvement effect calculation unit that calculates an improvement effect on the production activity by implementing each of the plurality of improvement plans; a priority order setting unit that sets priorities for the plurality of improvement plans using the investment cost and the improvement effect for each improvement plan; and a presentation unit that presents the priorities of the plurality of improvement plans that have been set by the priority order setting unit.
- This disclosure makes it possible to comprehensively evaluate improvement proposals, including costs other than equipment costs.
- FIG. 1 is a diagram showing a configuration example of an improvement implementation support system according to first to third embodiments.
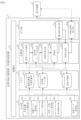
- FIG. 2 is a diagram showing a configuration example of an improvement implementation support device 7 according to the first embodiment.
- 1 is a diagram showing an example of a manufacturing process in a factory according to the first to third embodiments;
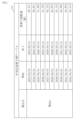
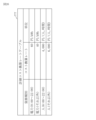
- FIG. 13 is a diagram showing an example of an annual supply and demand quantity actual result table 762 according to the first to third embodiments.
- FIG. 13 is a diagram showing an example of a process-by-process supply and demand quantity actual result table 763 according to the first to third embodiments.
- FIG. 13 is a diagram showing an example of a production time breakdown table 765 according to the first to third embodiments.
- FIG. 13 is a diagram showing an example of a resource consumption table 769 according to the first to third embodiments.
- FIG. 13 is a diagram showing an example of a cost conversion rate table 770 according to the first to third embodiments.
- FIG. 13 is a diagram showing an example of a resource consumption cost table 771 according to the first to third embodiments.
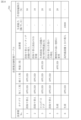
- FIG. 13 is a diagram showing an example of an improvement plan detailed information table 764 according to the first to third embodiments.
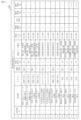
- FIG. 13 is a diagram showing an example of an improvement plan relationship table 768 according to the first to third embodiments.
- FIG. 13 is a diagram showing an example of an annual demand forecast table 774 according to the first to third embodiments.
- FIG. 13 is a diagram showing an example of a composite improvement plan effect table 772 according to the first to third embodiments.
- FIG. 13 is a diagram showing an example of a priority evaluation table 773 according to the first to third embodiments.
- FIG. 13 is a diagram showing an example of a roadmap graph 775 according to the first to third embodiments.
- FIG. 13 is a diagram showing an example of a total accumulated cost graph 776 according to the first to third embodiments.
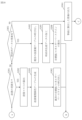
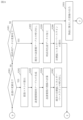
- 4 is a flowchart showing an example of the operation of the improvement implementation support device 7 according to the first embodiment. 4 is a flowchart showing an example of the operation of the improvement implementation support device 7 according to the first embodiment.
- FIG. 13 is a diagram showing a configuration example of an improvement implementation support device 7 according to a second embodiment.
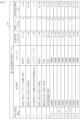
- FIG. 13 is a diagram showing an example of an improvement plan table 761 according to the second and third embodiments.
- FIG. 13 is a diagram showing an example of an order relation determination graph 766 according to the second and third embodiments.
- FIG. 13 is a diagram showing an example of an inclusion relationship determination graph 767 according to the second and third embodiments.
- 13 is a flowchart showing an example of the operation of the improvement implementation support device 7 according to the second embodiment.
- 13 is a flowchart showing an example of the operation of the improvement implementation support device 7 according to the second embodiment.
- FIG. 13 is a diagram showing a configuration example of an improvement implementation support device 7 according to a third embodiment.
- FIG. 13 is a diagram showing an example of a detailed cost conversion rate table 777 according to the third embodiment.
- FIG. 13 is a diagram showing an example of a production plan table 778 according to the third embodiment.
- FIG. 13 is a diagram showing an example of a unit resource consumption table 779 according to the third embodiment.
- FIG. 13 is a diagram showing an example of a process-by-process production capacity table 780 according to the third embodiment.
- FIG. 13 is a diagram showing an example of an initial equipment operation plan 781 before improvement according to the third embodiment.
- FIG. 13 is a diagram showing an example of an improved equipment operation plan 782 according to the third embodiment.
- FIG. 13 is a diagram showing an example of an improved equipment operation plan 783 according to the third embodiment.
- FIG. 13 is a diagram showing an example of an improved equipment operation plan 784 according to the third embodiment.
- FIG. 13 is a diagram showing an example of a pre-improvement cost table 785 according to the third embodiment.
- FIG. 13 is a diagram showing an example of an improved cost table 786 according to the third embodiment.
- 13 is a flowchart showing an example of the operation of the improvement implementation support device 7 according to the third embodiment.
- Patent Document 1 does not take into account costs other than equipment costs, so there is a problem in that when manufacturing staff evaluate improvement proposals, they are unable to make a comprehensive evaluation that includes costs other than equipment costs. Furthermore, the technique disclosed in Patent Document 1 lacks information for manufacturing staff to make investment decisions, such as the implementation period for improvement proposals and the investment payback period. Furthermore, the technique disclosed in Patent Document 1 does not take into consideration the order in which improvement plans are implemented and the impact of overlapping improvements. In other words, the technique disclosed in Patent Document 1 has a problem in that it is not possible to present an improvement plan that maximizes the improvement effect with the minimum investment amount and in the shortest period of time. In this embodiment, a configuration that addresses these issues will be described.
- the improvement implementation support device 7 which will be described later with reference to FIG. 1 etc., sets priorities for a plurality of improvement plans for improving production activities. Then, the improvement implementation support device 7 presents the priorities of the multiple improvement plans.
- the multiple improvement options include composite improvement options, which are made up of two or more improvement options.
- the improvement implementation support device 7 sets priorities for a plurality of improvement plans in the following procedure.
- the improvement implementation support device 7 calculates the investment cost for implementing each of the multiple improvement proposals.
- Investment costs include capital costs and non-capital costs.
- Equipment costs are the costs required for purchasing, renting, maintaining, etc. production equipment.
- Costs other than equipment costs include, for example, material costs, labor costs, energy costs, and software costs.
- Material costs are the costs required for materials necessary for production.
- Labor costs are the costs required for human resources such as workers.
- Energy costs are the costs required for energy (electricity, gas, water, etc.) consumed for production.
- Software costs are the costs required for software necessary to operate production equipment.
- the improvement implementation support device 7 calculates the improvement effect on production activities by implementing each of the multiple improvement plans. For a composite improvement plan, the improvement implementation support device 7 calculates the improvement effect by using the relationship between two or more improvement plans that constitute the composite improvement plan.
- the improvement implementation support device 7 uses at least one of an inclusion relationship between two or more improvement plans and an order relationship between two or more improvement plans as the relationship between two or more improvement plans that constitute a composite improvement plan.
- the improvement implementation support device 7 sets priorities for the multiple improvement plans based on the calculated investment costs and improvement effects. More specifically, the improvement implementation support device 7 calculates a priority evaluation value for each improvement plan by dividing the square of the improvement effect by the investment cost. Then, the improvement implementation support device 7 sets priorities for the multiple improvement plans in descending order of priority evaluation value.
- the improvement implementation support device 7 may also calculate, for each improvement proposal, a payback period, which is the period required to recover the investment cost, using the investment cost and the improvement effect.
- the improvement implementation support device 7 may also present a payback period for each improvement proposal.
- the improvement implementation support device 7 may generate visualization information that visualizes the investment cost recording schedule and the improvement effect realization schedule for any one of the multiple improvement plans. Furthermore, the improvement implementation support device 7 may generate visualization information that visualizes the cumulative transition of the sum of the investment costs and improvement effects for any one of the multiple improvement plans. Furthermore, the improvement implementation support device 7 may present the generated visualization information.
- FIG. 1 shows an example of the configuration of an improvement implementation support system according to the present embodiment.
- the improvement implementation support system includes one or more production facilities 1, a production control device 2, a cost input device 3, an improvement proposal input device 4, a demand forecasting device 5, an equipment operation plan derivation device 6, an improvement implementation support device 7, and a display device 8.
- Each component of the improvement implementation support system is connected to one or more other components of the improvement implementation support system.
- An example of the configuration of the improvement implementation support device 7 includes a control unit 71 , an input unit 72 , a memory 73 , a calculation unit 74 , and an output unit 75 .
- the improvement implementation support device 7 is a computer and corresponds to an information processing device.
- the operation procedure of the improvement implementation support device 7 corresponds to an information processing method.
- the program that realizes the operation of the improvement implementation support device 7 corresponds to an information processing program.
- the production facility 1 is a facility for industrially producing items that can be sold.
- the multiple production facilities 1 may be different from each other.
- Specific examples of the production facilities 1 are manufacturing facilities for industrial products or power generation facilities.
- the factory includes a plurality of production facilities 1. In the following, the production facilities 1 will also be simply referred to as facilities.
- the production control device 2 controls one or more pieces of production equipment 1 based on the output from the improvement implementation support device 7.
- the cost input device 3 inputs the cost required for the investment into the input unit 72.
- the cost required for the investment is, for example, material cost, labor cost, energy cost, and software cost, as described above.
- the cost input device 3 inputs the cost for each improvement plan into the input unit 72.
- the improvement plans include composite improvement plans.
- the improvement proposal input device 4 inputs a plurality of past improvement examples into the input section 72 .
- the improvement cases include specific examples of improvement proposals, improvement effects, target resources, and data that enables the relationship between the improvement cases to be determined.
- the improvement effect is expressed as an effect rate, an effect amount, etc.
- the resources that are the subject of the effect are people, electricity, water usage, etc.
- the data that enables determination of the relationship between the improvement cases is data that enables determination of the relationship between the improvement cases, such as an inclusion relationship or an order relationship between the improvement cases.
- the demand forecasting device 5 forecasts production demand based on production performance data from the factory and inputs the forecasted demand into the input unit 72.
- the equipment operation plan derivation device 6 derives an equipment operation plan and inputs the equipment operation plan to the input unit 72.
- the display device 8 displays the output from the improvement implementation support device 7.
- the display device 8 is, for example, an LCD (Liquid Crystal Display).
- the control unit 71 manages the input and output of data within the improvement implementation support device 7, and also controls communications with other devices.
- the input unit 72 inputs information to the improvement implementation support device 7.
- the memory 73 stores data used by the improvement implementation support device 7 for calculations.
- the calculation unit 74 calculates various data in the improvement implementation support device 7.
- the output unit 75 outputs the calculation results of the calculation unit 74 in the improvement implementation support device 7 as graphs and tables.
- the control unit 71, the input unit 72, the calculation unit 74, and the output unit 75 are realized by cooperation of software and hardware.
- the control unit 71, the input unit 72, the calculation unit 74, and the output unit 75 are configured by a processor, which is hardware, and a program, which is software.
- the operations of the control unit 71, the input unit 72, the calculation unit 74, and the output unit 75, which will be described later, are achieved by the processor executing the program that realizes the functions of the control unit 71, the input unit 72, the calculation unit 74, and the output unit 75.
- the programs that realize the functions of the control unit 71, the input unit 72, the calculation unit 74, and the output unit 75 are stored in an auxiliary storage device (not shown). These programs are then loaded from the auxiliary storage device into the memory 73 and executed by the processor.
- the input unit 72 includes a production performance data measurement unit 721, an equipment cost acquisition unit 722, a SW cost acquisition unit 723, a material/labor cost acquisition unit 724, an improvement proposal acquisition unit 725, an improvement relationship acquisition unit 726, and a demand data acquisition unit 727.
- the following describes each unit included in the input unit 72.
- the information used by each unit included in the input unit 72 will basically be described later.
- the dashed arrows in Fig. 2 indicate data flows, and the solid arrows indicate function flows.
- the dashed arrows and the solid arrows in Fig. 19 and Fig. 25 have the same meanings.
- the production performance data measurement unit 721 is an interface for inputting production performance data of one or more production facilities 1 .
- the production performance data measuring section 721 processes the data format of the production performance data so that it is in a format usable by the calculation section 74 of the improvement implementation support device 7 .
- the equipment cost acquisition unit 722 is an interface for inputting the equipment cost from the cost input device 3 .
- the facility cost includes the maintenance cost of the current production facility 1 and the introduction cost of new production facility 1 .
- the SW cost acquisition unit 723 is an interface for inputting the SW (software) cost from the cost input device 3 .
- the SW cost includes the maintenance cost of the currently installed SW and the introduction cost of a new SW.
- the material/labor cost acquisition unit 724 is an interface for inputting material costs and labor costs from the cost input device 3 .
- the material cost includes the cost of purchasing the materials currently in use and the cost of introducing new materials.
- Labor costs include current labor costs and training costs required to apply the improvement proposals.
- the improvement plan acquisition unit 725 is an interface for inputting a plurality of past improvement example data from the improvement plan input device 4 .
- the improvement example data includes improvement plans, improvement effects such as an effect ratio and an effect amount, and resources that are targets of the effects such as manpower, electricity, and water usage.
- the improvement relationship acquisition unit 726 is an interface for inputting the relationships between improvement plans from the improvement plan input device 4 .
- the relationship between improvement plans is an inclusion relationship and an order relationship between a plurality of past improvement cases.
- the improvement relationship acquisition unit 726 stores the acquired relationships between the improvement plans in the improvement plan/cost DB 732 as an improvement plan relationship table 768 .
- the demand data acquisition unit 727 is an interface for inputting demand data from the demand forecasting device 5 .
- the demand data is data obtained by predicting production demand based on production performance data in a factory.
- the memory 73 stores a resource consumption/production quantity database 731, an improvement plan/cost database 732, and a demand forecast database 733.
- the information stored in the memory 73 will be described below with concrete examples.
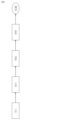
- FIG. 3 shows the manufacturing process in a factory.
- the premise of a specific example of information stored in memory 73 will be described.
- FIG. 3 represents a production step. 3 shows the manufacturing process when compressors for use in refrigerators or air conditioners are manufactured in a factory. It is assumed that the factory manufactures four types of products (product A, product B, product C, and product D). Here, product A is a compressor for home air conditioners. It is assumed that product A has a small profit margin and is sold in large quantities. As for the other products, they are not presented as concrete examples and detailed explanations are omitted.
- the six improvement examples are as follows: (1) Introduction of one-touch changeover equipment (2) 5S management of changeover parts (3) Optimization of equipment ON/OFF time before and after production (4) Rationalization of changeover work (5) Change to highly volatile paint (6) Introduction of high-performance processing equipment
- processing equipment is equipment corresponding to the processing process.
- 5S management is a management method that is an acronym of the Japanese words "Seiri (organization),""Seiton(order),”"Seisou(cleaning),”"Seiketsu(cleanliness),” and "Shitsuke (discipline).”
- the resource consumption/production quantity database 731 in Figure 2 is a database that stores an annual supply and demand quantity actual table 762, a process-by-process supply and demand quantity actual table 763, a production time breakdown table 765, a resource consumption table 769, a cost conversion rate table 770, and a resource consumption cost table 771.
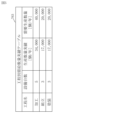
- the annual production quantity actual result table 762 shows the actual production quantity (supply amount) and demand quantity (demand amount) of a product.
- FIG. 4 shows a specific example of the annual supply and demand quantity actual result table 762 .
- the annual supply and demand quantity actual result table 762 includes actual production quantities, actual demand quantities, and product unit prices of four types of products for the past three years (FY2020 to FY2022).
- the start and end dates indicate the start and end dates of each fiscal year.
- FIG. 5 shows a specific example of the actual supply and demand quantity by process table 763.
- the actual supply and demand quantity by process table 763 includes the number of equipment units by process for product A in fiscal year 2022, actual production quantity, and actual demand quantity.
- FIG. 5 shows, as an example, actual supply and demand quantities by process for only product A.
- a product name column may be added to the actual supply and demand quantity by process table 763.
- product A, product B, product C, and product D may be described in the product name column to manage the number of equipment units, actual production quantity, and actual demand quantity by product.
- equipment information for each process may be added to the process-specific supply and demand quantity actual result table 763.
- the name of the equipment performing the processing process (processing equipment A, processing equipment B, processing equipment C, etc.) may be added as equipment information for the processing process.
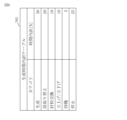
- FIG. 6 shows a specific example of the production time breakdown table 765 .
- the production time breakdown table 765 includes categories and time breakdowns for the main factory in fiscal year 2022.
- the production time breakdown table 765 may be calculated for each process or each production facility.
- a category refers to the operating state of a facility.
- the categories include production, changeover, material exchange, startup/shutdown, standby, stop, etc.
- the categories are set in advance according to information that can be obtained from the facility.
- the time breakdown is the breakdown of the time required for each category relative to the total time.
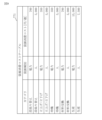
- FIG. 7 shows a specific example of the resource consumption table 769 .
- the resource consumption table 769 includes a category, a resource type, a resource consumption amount, and a unit.
- the categories are the same as those shown in FIG.
- the resource type indicates the type of resource consumed in each category.
- the resource types are classified into electricity and people as an example.
- the resource consumption is the amount of resource consumed to date in each category.
- the unit is the unit of resource consumption.
- the resource consumption amount is shown in units of weeks, but the resource consumption amount may be shown in units other than weeks.
- FIG. 8 shows a specific example of the cost conversion rate table 770.
- the cost conversion rate table 770 includes a resource type, a cost conversion rate, and a unit.
- the resource types are the same as those shown in FIG.
- the cost conversion rate is set for each resource type in FIG.
- the unit is the unit of the cost conversion rate.
- FIG. 9 shows a specific example of the resource consumption cost table 771 .
- the resource consumption cost table 771 includes a category, a resource type, and a resource consumption cost.
- the categories are the same as those shown in FIG.
- the resource types are the same as those shown in FIG.
- the resource consumption cost is calculated by (resource consumption amount) x (cost conversion rate) using the resource consumption amount in the resource consumption amount table 769 (FIG. 7) and the cost conversion rate in the cost conversion rate table 770 (FIG. 8).
- the improvement plan/cost database 732 in FIG. 2 is a database that stores an improvement plan detailed information table 764 and an improvement plan relationship table 768 .
- the investment cost is affected by the equipment of the factory, the number of people assigned to the process, the wage system of each person such as hourly wage, etc. For this reason, a reference value is stored in the investment cost of the improvement plan relationship table 768 until the calculation unit 74 performs the calculation.
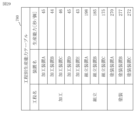
- FIG. 10 shows a specific example of the improvement plan detailed information table 764 .
- the improvement plan detailed information table 764 includes an improvement plan number, a category, a processing process, an assembly process, a painting process, an improvement plan, a production capacity, and a work time reduction rate.
- the categories are the same as those shown in FIG.
- the processing, assembly and painting steps shown in FIG. 10 correspond to the processing, assembly and painting steps shown in FIG.
- the columns for processing process, assembly process, and painting process may be deleted from the improvement plan detailed information table 764 in Figure 10, and a new column called process information may be added, with the names of processes such as processing, assembly, and painting being entered in the process information column.
- FIG. 10 shows a specific example of the improvement plan detailed information table 764 .
- the improvement plan detailed information table 764 includes an improvement plan number, a category, a processing process, an assembly process, a painting process, an improvement plan, a production capacity, and a work time reduction rate.
- the categories are the same as those shown
- improvement plan No. 1 is "Introduce one-touch changeover equipment” related to the category “changeover” and is applied to the processing process and the assembly process.
- the production capacity shown in Fig. 10 is, for example, the production volume per year for one high-performance equipment unit assumed when the high-performance equipment, which is improvement plan No. 6, is introduced.
- the unit of production capacity is, for example, [pieces/year, units].
- the work reduction ratio indicates the ratio of the work time that can be reduced when each improvement plan is applied. The work reduction ratio is expressed as [%].
- FIG. 11 shows a specific example of the improvement plan relationship table 768 .
- the improvement plan relationship table 768 includes a serial number (#), an improvement plan No., an improvement plan, a category, a resource type, an effect ratio, an investment cost type, an investment cost, a preparation period, an inclusion relationship, a pre-order relationship, and a post-order relationship.
- the serial number (#) reflects the improvement plan number and resource type, similar to the improvement plan detailed information table 764 (FIG. 10).
- FIG. 11 there are 12 serial numbers, which is the product of the number of improvement plan numbers (six improvement plans) and the number of resource types (two: "electricity" and "people").
- Past improvement cases are stored with serial numbers in the improvement plan/cost database 732.
- Fig. 11 only improvement cases included in the improvement plan detail information table 764 (Fig. 10) are included.
- all past improvement plans may be included in the improvement plan relationship table 768 so that the calculation unit 74 can extract necessary improvement plans.
- the effect rate indicates the effect rate when the improvement plan is implemented.
- the investment cost type is detailed information on the investment cost that is required to calculate the investment cost.
- the preparation period indicates the preparation period for implementing the improvement plan. This preparation period includes the period until new high-performance equipment is introduced in accordance with the timing of equipment renewal. Specifically, the preparation period may include the period required for estimating the construction work for the introduction of new high-performance equipment or the period until the construction work is accepted and ordered. The preparation period may also include the training period for applying new operations.
- a preset numerical value is used for the inclusion relationship, the pre-order relationship, and the post-order relationship between the improvement proposals.
- the numerical value shown in the inclusion relationship indicates the corresponding improvement plan No.
- the improvement plan of improvement plan No. 1 includes the improvement plan of improvement plan No. 2 and the improvement plan of improvement plan No. 4.
- the "1" in the inclusion relationship of improvement plan No. 2 indicates that the improvement plan of improvement plan No. 2 is included in the improvement plan of improvement plan No. 1.
- the "1" in the inclusion relationship of improvement plan No. 4 indicates that the improvement plan of improvement plan No. 4 is included in the improvement plan of improvement plan No. 1.
- the improvement plan for Improvement Plan No. 1 includes the improvement plans for Improvement Plan No. 2 and Improvement Plan No. 4. The details of the inclusion relationships of the improvement plans will be described later in the second embodiment with reference to FIG.
- FIG. 11 shows that improvement plan No. 6 is implemented after improvement plan No. 1, improvement plan No. 2, and improvement plan No. 4. That is, the "6" before the order relationship of improvement plan No. 1 indicates that the improvement plan No. 6 will be implemented before the improvement plan No. 1. Similarly, the "6" before the order relationship of improvement plan No. 2 indicates that the improvement plan No. 6 will be implemented before the improvement plan No. 2. Similarly, the “6" before the order relationship of improvement plan No. 4 indicates that the improvement plan No. 6 will be implemented before the improvement plan No. 4. Furthermore, the "1, 2, 4" after the order relationship of improvement plan No. 6 indicates that the improvement plans No. 1, No. 2, and No.
- improvement plan No. 6 "Introduction of one high-performance equipment unit”
- the number of equipment units to be introduced will be greater due to fluctuations in production time compared to implementing improvement plan No. 1 "Introduction of one-touch changeover equipment", improvement plan No. 2 "5S management of changeover parts", and improvement plan No. 4 "Streamlining changeover work” after improvement plan No. 6. Therefore, it is desirable to implement improvement plan No. 6 after improvement plan No. 1, improvement plan No. 2, and improvement plan No. 4.
- the details of the order relationship will be described later in the second embodiment with reference to FIG.
- the demand forecast database 733 is a database that stores an annual demand forecast table 774 .
- the annual demand forecast table 774 shows the forecast of demand for the product.
- FIG. 12 shows a specific example of the annual demand forecast table 774 .
- the annual demand forecast table 774 shows the forecast demand quantities of products for the next 10 years (2023 to 2033).
- FIG. 12 shows only the demand forecast quantity for the next 10 years for product A among the four products shown in the annual supply and demand quantity actual result table 762 (FIG. 4).
- the calculation unit 74 includes an investment cost calculation unit 741 , an improvement plan table generation unit 742 , an evaluation unit 744 , and an information generation unit 745 .
- Each unit of the calculation unit 74 will be described below.
- the information used by each unit of the calculation unit 74 will basically be described later.
- the investment cost calculation unit 741 calculates the investment cost for each improvement plan. That is, the investment cost calculation unit 741 calculates the investment cost for each row of the improvement plan relationship table 768 ( FIG. 11 ). The investment cost calculation unit 741 calculates the investment cost using the acquired information, the number of people assigned to the equipment in the factory, the number of people assigned to the process, and the salary form of each person such as hourly wage.
- the acquired information is information acquired by the equipment cost acquisition unit 722, the SW cost acquisition unit 723, the material/labor cost acquisition unit 724, and the improvement plan acquisition unit 725.
- the improvement plan table generating unit 742 modifies the improvement plan relationship table 768 in FIG. 11 based on the investment costs calculated by the investment cost calculating unit 741 and the acquired information.
- the evaluation unit 744 calculates the improvement effect for each improvement proposal.
- the evaluation unit 744 calculates the investment payback period (hereinafter simply referred to as the payback period), which is the period required to recover the investment cost, using the investment cost and the improvement effect for each improvement proposal.
- the evaluation unit 744 sets priorities for the multiple improvement plans based on the investment costs and improvement effects.
- the evaluation unit 744 corresponds to an improvement effect calculation unit, a priority order setting unit, and a payback period calculation unit.
- the processes performed by the evaluation unit 744 correspond to an improvement effect calculation process, a priority order setting process, and a payback period calculation process.
- the evaluation unit 744 uses the resource consumption amount table 769 (FIG. 7) and the cost conversion rate table 770 (FIG. 8) to generate the resource consumption cost table 771 (FIG. 9) in the above-mentioned manner.
- the evaluation unit 744 uses the effect ratio in the improvement plan relationship table 768 (FIG. 11) to calculate the improvement effect of each row in the composite improvement plan effect table 772 (FIG. 13).
- the evaluation unit 744 uses the improvement effect and investment cost in the composite improvement plan-specific effect table 772 (FIG. 13) to calculate the investment payback period for each row in the composite improvement plan-specific effect table 772 (FIG. 13).
- the evaluation unit 744 calculates the priority evaluation value shown in the priority evaluation table 773 (FIG. 14). Detailed calculation methods for the improvement effect, the payback period, and the priority evaluation value will be described later.
- FIG. 13 shows a specific example of a table 772 of effects by composite improvement plans for the pressing process.
- the composite improvement plan-specific effect table 772 includes a composite improvement plan number, an improvement plan, a category, an improvement effect, an investment cost, and an investment payback period.
- the evaluation unit 744 calculates various information in the composite improvement plan effect table 772 in the following manner.
- the evaluation unit 744 calculates the improvement effect using the resource consumption cost in the resource consumption cost table 771 (FIG. 9) and the effect ratio in the improvement plan relationship table 768 (FIG. 11). For example, in the case of improvement plan No.
- the evaluation unit 744 converts the improvement effect on a weekly basis into an annual basis to obtain the improvement effect [yen/year] shown in the composite improvement plan effect table 772 (FIG. 13).
- the evaluation unit 744 adds up the improvement effects of each improvement plan included in the composite improvement plan.
- the evaluation unit 744 calculates an improvement effect that reflects the effect due to the relationship between the improvement plans. For example, with regard to the improvement effect of the composite improvement plan No. 1 and 4, the evaluation unit 744 ignores the improvement effect of the improvement plan No. 4 and applies only the improvement effect of the improvement plan No. 1. Therefore, the evaluation unit 744 calculates the improvement effect of the composite improvement plan No. 1 and 4 to be 171,000 yen/year, which is the same as the improvement effect of the improvement plan No. 1.
- the evaluation unit 744 performs the calculation again. In addition, the evaluation unit 744 calculates the investment payback period by dividing the investment cost by the improvement effect in the composite improvement plan effect table 772 .
- FIG. 14 shows a specific example of the priority evaluation table 773 for the pressing process.
- the priority evaluation table 773 includes a priority order, a composite improvement plan number, an improvement effect, an investment cost, an investment payback period, and a priority evaluation value.
- the evaluation unit 744 ranks the composite improvement plans in descending order of priority evaluation value based on a priority evaluation value described below.
- the user desires an improvement plan that has a large improvement effect and a short payback period, so the evaluation unit 744 calculates the priority evaluation value so that a high priority evaluation value is assigned to an improvement plan that has a large improvement effect and a short payback period.
- the evaluation unit 744 may calculate the priority evaluation value based on a different criterion.
- the information generator 745 generates a roadmap graph 775 (FIG. 15) and a total accumulated cost graph 776 (FIG. 16).
- the roadmap graph 775 is visualization information that visualizes the investment cost allocation schedule and the improvement effect realization schedule.
- the total accumulated cost graph 776 is visualization information that visualizes the cumulative transition of the sum of the investment costs and improvement effects.
- the information generation unit 745 generates a roadmap graph 775 and a total accumulated cost graph 776 using the priority evaluation table 773 ( Figure 14) generated by the evaluation unit 744 and the annual demand forecast table 774 ( Figure 12) stored in the demand forecast database 733.
- FIG. 15 shows an example of a roadmap graph 775 .
- the positive area on the vertical axis represents the improvement effect by applying the improvement plan
- the negative area on the vertical axis represents the investment cost required to apply the improvement plan.
- the horizontal axis is a time series, and in Fig. 15, one section represents one year.
- the roadmap graph 775 is represented as a stacked bar graph in which the improvement plans are arranged in the order in which they are applied.
- the improvement plan No. is written in the bar graph. Specifically, "1", "3", and "6" in the bar graph are improvement plan No.
- the payback period for each improvement plan and the payback period for a composite improvement plan are also shown in the roadmap graph 775. 15, the composite improvement plans Nos. 1, 3, and 6 that have the highest priority in the priority evaluation table 773 (FIG. 14) are initially displayed.
- the selection button 7750 shown in the upper right of FIG. 15 it is possible to display a roadmap graph 775 for each improvement plan in order of priority.
- the user can select any improvement plan using the selection button 7750.
- the information generating unit 745 generates a roadmap graph 775 of the improvement plan selected by the user.
- the investment cost bar graph is displayed for each of the improvement plans constituting the composite improvement plan Nos. 1, 3, and 6.
- the investment cost bar graph is displayed taking into consideration the constraints of the order relationship.
- the length of the investment cost bar graph for each improvement plan corresponds to the value obtained by dividing the investment cost in the priority evaluation table 773 (FIG. 14) by the preparation period.
- the roadmap graph 775 in FIG. 15 is generated on the assumption that the improvement effect will be realized in the preparation period, that is, the year following the period in which the investment cost exists.
- FIG. 16 shows an example of a total accumulated cost graph 776 .
- the vertical axis represents the sum (combined value) of the improvement effect and the investment cost when the improvement plan is applied, and the horizontal axis represents a time series.
- the total value for the first year is calculated as (this year's improvement effect) - (this year's investment cost).
- the total value for the second year is calculated as (previous year's total value) + (this year's improvement effect) - (this year's investment cost).
- the total value for the third year and onwards is calculated using the total cumulative value as (previous year's total cumulative value) + (this year's improvement effect) - (this year's investment cost).
- the total accumulated cost graph 776 similarly to the roadmap graph 775 (FIG.
- the composite improvement plans Nos. 1, 3, and 6 having the highest priority in the priority evaluation table 773 are initially displayed.
- a total accumulated cost graph 776 for each improvement plan can be displayed in order of priority using the selection button 7760 shown in the upper right of FIG.
- the user can select any improvement plan using the selection button 7760.
- the information generating unit 745 generates a total accumulated cost graph 776 of the improvement plan selected by the user.
- the output unit 75 includes a priority order presenting unit 751 and a visualization information presenting unit 752. Each unit included in the output unit 75 will be described below.
- the priority level presentation unit 751 outputs the priority level evaluation table 773 ( FIG. 14 ) generated by the evaluation unit 744 of the calculation unit 74 to the display device 8 .
- the priority order presentation unit 751 corresponds to a presentation unit.
- the process performed by the priority order presentation unit 751 corresponds to a presentation process.
- the visualized information presentation unit 752 outputs the roadmap graph 775 ( FIG. 15 ) and the total accumulated cost graph 776 ( FIG. 16 ) generated by the information generation unit 745 of the calculation unit 74 to the display device 8 .
- the visualization information presentation unit 752 also corresponds to a presentation unit.
- the process performed by the visualization information presentation unit 752 also corresponds to a presentation process.
- Step S201 Determining whether it is the first time
- the process proceeds to step S202.
- the roadmap graph 775 of the improvement plan has been presented and completion has been determined, the process proceeds to step S301.
- the determination in step S201 is made by referring to a flag, which will be described later.
- Step S202 Calculation of investment costs
- the investment cost calculation unit 741 recalculates the investment costs stored in the improvement plan/cost database 732 using various information acquired by the equipment cost acquisition unit 722, the SW cost acquisition unit 723, the material/labor cost acquisition unit 724, and the improvement plan acquisition unit 725 in the input unit 72. Then, the investment cost calculation unit 741 stores the recalculated investment cost in the improvement plan/cost database 732 .
- Step S203 Generation of improvement plan relationship table
- the improvement plan table generating unit 742 generates an improvement plan relationship table 768 (FIG. 11) based on the investment costs calculated by the investment cost calculating unit 741 and various acquired data. Then, the improvement plan table generating unit 742 stores the improvement plan relationship table 768 in the improvement plan/cost database 732 .
- Step S205 Processing of time-series production data
- the improvement proposal table generation unit 742 generates an annual supply and demand quantity actual table 762 ( Figure 4) and a process-by-process supply and demand quantity actual table 763 ( Figure 5) based on the time series data of production quantity stored in the resource consumption/production quantity database 731.
- Step S206 Calculation of target value/energy baseline
- the improvement plan table generating unit 742 generates a resource consumption amount table 769 (FIG. 7) and a cost conversion rate table 770 (FIG. 8) based on the time series data of the resource consumption amount. Then, the improvement plan table generating unit 742 stores the resource consumption amount table 769 and the cost conversion rate table 770 in the resource consumption amount/production amount database 731 .
- the improvement plan table generating unit 742 also determines a category based on the time series data of the production quantity and the resource consumption amount, and generates a production time breakdown table 765 ( FIG. 6 ). Then, the improvement plan table generating unit 742 stores the production time breakdown table 765 in the resource consumption amount/production quantity database 731.
- the resource consumption table 769 (FIG. 7) shows an energy baseline of resource consumption (resource consumption in the case of average production).
- the improvement plan table generating unit 742 may use a design value for this energy baseline.
- the improvement plan table generating unit 742 may calculate the target value using time-series data of the resource consumption amount. Also, the improvement plan table generating unit 742 may use a design value as the target value.
- Step S207 Calculation of improvement effect
- the evaluation unit 744 uses the resource consumption amount table 769 (FIG. 7) and the cost conversion rate table 770 (FIG. 8) stored in the resource consumption amount/production amount database 731 to generate the resource consumption cost table 771 (FIG. 9) in the above-mentioned manner.
- the evaluation unit 744 calculates the improvement effect in the composite improvement plan-specific effect table 772 (FIG. 13) for each composite improvement plan using the effect ratio shown in the improvement plan relationship table 768 (FIG. 11).
- Step S208 Calculation of investment payback period
- the evaluation unit 744 calculates the payback period for each improvement plan using the improvement effect and the investment cost calculated in step S207.
- the evaluation unit 744 calculates the payback period by dividing the investment cost by the improvement effect.
- Step S209 Calculation of improvement priority order
- the evaluation unit 744 calculates a priority evaluation value in the priority evaluation table 773 (FIG. 14) for each improvement plan using the improvement effect calculated in step S207 and the investment payback period calculated in step S208. Then, the evaluation unit 744 outputs the improvement effect, investment payback period, and priority evaluation value for each improvement plan to the priority order presentation unit 751.
- the priority order presenting unit 751 outputs the improvement effect, investment payback period, and priority evaluation value for each improvement plan to the display device 8.
- Step S210 Output of improvement plan roadmap
- the information generation unit 745 generates a roadmap graph 775 (Figure 15) and a total accumulated cost graph 776 (Figure 16) using the priority evaluation table 773 ( Figure 14) generated by the evaluation unit 744 and the annual demand forecast table 774 ( Figure 12) stored in the demand forecast database 733. Then, the information generation unit 745 outputs the roadmap graph 775 and the total accumulated cost graph 776 to the visualization information presentation unit 752.
- the visualization information presentation unit 752 outputs a roadmap graph 775 and a total accumulated cost graph 776 to the display device 8.
- Step S214 Completion determination
- the information generating unit 745 stores a flag indicating that the calculation in the improvement implementation support device 7 has been completed in a predetermined storage area. This flag is used for the determination in step S201.
- Step S301 Determining whether the improvement plan has been updated
- the investment cost calculation unit 741 calculates the investment cost again (step S202).
- the improvement plan table generation unit 742 generates the improvement plan relationship table again (step S203). The improvement effect and roadmap graph 775 (FIG. 15) changes accordingly.
- Step S302 Calling up existing target values/energy baseline
- the improvement plan table generator 742 retrieves the most recently calculated target value/energy baseline.
- Step S401 Determination of whether time-series data has been updated
- the process proceeds to step S402.
- Step S402 Calling an existing improvement plan table
- the improvement plan table generating unit 742 calls the most recently generated improvement plan table. Thereafter, the improvement plan table generating unit 742 processes the time-series production data (step S205) and calculates the target value/energy baseline (step S206). The improvement effect and roadmap graph 775 (FIG. 15) changes accordingly.
- Step S501 Output of pre-calculated information
- a roadmap graph 775 of an improvement plan is presented and completion is determined (NO in S201)
- the evaluation unit 744 acquires various information required to output the roadmap graph 775.
- the improvement plans are prioritized based on the investment cost and improvement effect. Therefore, according to this embodiment, the manufacturing staff can easily confirm the improvement plan that will provide the maximum improvement effect with the minimum investment cost.
- the improvement implementation support device 7 generates a roadmap graph 775 based on the relationships between improvement plans prepared in advance by, for example, a manufacturing staff. In contrast to this, in this embodiment, the improvement implementation support device 7 judges the relationships between improvement plans, and generates a roadmap graph 775 based on the judgment result.
- FIG. 19 shows an example of the configuration of an improvement implementation support device 7 according to this embodiment.
- the input unit 72 includes a production performance data measurement unit 721, an equipment cost acquisition unit 722, a SW cost acquisition unit 723, a material/labor cost acquisition unit 724, an improvement proposal acquisition unit 725, and a demand data acquisition unit 727. These are similar to those described in the first embodiment, and therefore a detailed description thereof will be omitted.
- the input unit 72 in FIG. 19 does not include an improvement relationship acquisition unit 726 .
- the relationship between the improvement plans is not acquired as input data, but is determined by the calculation unit 74. For this reason, the improvement relationship acquisition unit 726 does not exist in FIG.
- the memory 73 stores a resource consumption/production quantity database 731, an improvement plan/cost database 732, and a demand forecast database 733.
- the contents of the improvement plan/cost database 732 have been partially changed from those in embodiment 1. For this reason, the following description will focus on the changes to the improvement plan/cost database 732.
- the resource consumption/production quantity database 731 and the demand forecast database 733 are similar to those described in the first embodiment.
- the improvement plan/cost database 732 is a database that stores an improvement plan table 761 (FIG. 20), an improvement plan detailed information table 764 (FIG. 10), and an improvement plan relationship table 768 (FIG. 11).
- the investment cost in the improvement plan table 761 is affected by the equipment of the factory, the number of people assigned to the process, the wage system of each person such as hourly wage, etc. For this reason, the investment cost in the improvement plan table 761 stores a reference value until the calculation unit 74 performs the calculation.
- FIG. 20 shows a specific example of the improvement plan table 761.
- the improvement plan table 761 includes a serial number (#), an improvement plan No., an improvement plan, a category, a resource type, an effect ratio, an investment cost type, an investment cost, and a preparation period.
- the initial investment costs are only reference values.
- the inclusion relationships, pre-order relationships, and post-order relationships that exist in the improvement plan relationship table 768 (FIG. 11) of the first embodiment do not exist.
- Each item in the improvement plan table 761 is the same as the item with the same name in the improvement plan relationship table 768. Therefore, detailed explanations of these will be omitted.
- the calculation unit 74 includes an investment cost calculation unit 741 , an improvement plan table generation unit 742 , a relationship derivation unit 743 , an evaluation unit 744 , and an information generation unit 745 .
- a relationship derivation unit 743 is added in the calculation unit 74 in FIG. 19, a relationship derivation unit 743 is added.
- the relationship derivation unit 743 determines the relationship between the improvement plans.
- part of the operation of the improvement plan table generating unit 742 is different from that in the first embodiment.
- the following mainly describes changes to the improvement plan table generating unit 742 and the calculation method of the relationship deriving unit 743.
- the elements other than the improvement plan table generating unit 742 and the relationship deriving unit 743 are the same as those shown in the first embodiment, so detailed description of these will be omitted.
- the improvement plan table generation unit 742 generates the improvement plan table 761 shown in FIG. 20 based on the investment costs calculated by the investment cost calculation unit 741 and various acquired data.
- the relationship derivation unit 743 determines the inclusion relationships and order relationships of the improvement plans, that is, the relationships between the improvement plans, using an algorithm. First, before describing the order relationship with reference to FIG. 21, the effect of increasing production time by applying improvement plan No. 1 will be described.
- Fig. 6 is a specific example of the production time breakdown table 765.
- Fig. 10 is a specific example of the improvement plan detailed information table 764.
- the production time increase effect of improvement plan No. 1 will be described with reference to Figs. 6 and 10.
- the changeover time reduction rate after applying improvement plan No. 1 is calculated using the production time breakdown of 30% (0.3) and the changeover time breakdown of 20% (0.2) in the production time breakdown table 765 (FIG. 6), and the work reduction rate of 50% (0.5) in the improvement plan detailed information table 764 (FIG. 10).
- FIG. 21 shows a specific example of the order relation determination graph 766 .
- the positive area on the vertical axis represents the improvement effect by applying the improvement plan
- the negative area on the vertical axis represents the investment cost required to apply the improvement plan
- the horizontal axis is a time series.
- the order relation determination graph 766 is expressed as a stacked bar graph in which the improvement plans are arranged in the order in which they are applied.
- Fig. 21 an example is assumed in which two improvement plans, namely, improvement plan No. 6 "Introduction of high-performance equipment” and improvement plan No. 1 "Introduction of one-touch changeover equipment", are applied.
- the "Before” on the left side of Fig. 21 shows an example in which improvement plan No. 1 is applied after improvement plan No. 6 without considering the order relationship.
- "After” on the right side of Fig. 21 shows an example in which improvement plan No. 6 is applied after improvement plan No. 1 is applied, taking into account the order relationship.
- the actual production quantity for the processing process in the process-specific supply and demand quantity actual table 763 in Figure 5 is 34,000 units/year.
- the current processing process has a production capacity of 34,000 units/year.
- improvement plan No. 1 is applied and then improvement plan No. 6 is applied as "After.”
- the total value of the investment cost and improvement effect when the minimum demand is met changes as follows: Reducing the number of pieces of equipment reduces labor costs.
- the introduction of high-performance equipment stabilizes production, reducing defective products and lowering manufacturing costs, which in turn reduces material costs.
- the introduction of high-performance equipment has the effect of reducing maintenance costs. Also, by making it easier to identify the cause of problems, the labor costs required for workers' non-working time are reduced.
- the relationship derivation unit 743 performs anomaly-like calculations to determine the order relationship of improvement proposals.
- FIG. 22 shows a specific example of the inclusion relationship determination graph 767.
- the positive area on the vertical axis represents the improvement effect by applying the improvement plan
- the negative area on the vertical axis represents the investment cost required to apply the improvement plan
- the horizontal axis is a time series.
- the inclusion relationship determination graph 767 is expressed as a stacked bar graph in which the improvement plans are arranged in the order in which they are applied.
- two improvement plans namely, improvement plan No. 4 "Streamlining changeover work” and improvement plan No. 1 "Introduction of one-touch changeover equipment"
- the "Before” on the left side of Fig. 22 shows an example in which improvement plan No. 1 is applied after improvement plan No. 4 without considering the inclusion relationship.
- “After” on the right side of Fig. 22 shows an example in which improvement plan No. 4 is applied after improvement plan No. 1 is applied, taking into account the inclusion relationship.
- the maximum time reduction (upper limit) for the improvement of the changeover is assumed to be 30 minutes/(equipment, day).
- the maximum time reduction (upper limit) is set on the assumption that it becomes difficult to guarantee the quality of the product if the changeover work time is reduced too much.
- the task reduction rate is 50%.
- the task reduction rate: 50% corresponds to the maximum value (upper limit value) of the reduction time: 30 minutes/(equipment, day).
- Improvement Plan No. 4 Streamlining changeover work
- Improvement Plan No. 1 “Introduction of one-touch changeover equipment”
- "Introduction of one-touch changeover equipment” in improvement plan No. 1 is implemented first.
- the relationship derivation unit 743 performs anomaly-like calculations to determine the inclusion relationships of improvement proposals.
- Step S204 Calculation process of the relationship between improvement plans
- the relationship derivation unit 743 determines the inclusion relationship and sequential relationship of the improvement plans, that is, the relationship between the improvement plans, using an algorithm based on the actual annual supply and demand quantity table 762, the actual supply and demand quantity by process table 763, the improvement plan detailed information table 764, and the production time breakdown table 765. Then, the relationship derivation unit 743 adds the values of the inclusion relationship, the before order relationship, and the after order relationship to the improvement plan table 761 of FIG. 20, thereby generating the improvement plan relationship table 768 of FIG. Furthermore, the relationship derivation unit 743 stores the generated improvement plan relationship table 768 in the improvement plan/cost database 732 .
- the improvement implementation support device 7 determines the relationship between improvement plans using an algorithm. Therefore, according to this embodiment, the manufacturing staff does not need to determine in advance the relationships between the improvement plans.
- the roadmap graph 775 and the total accumulated cost graph 776 are output to support the manufacturing staff in making decisions regarding improvements.
- a revised value of the improvement effect is presented to the manufacturing staff.
- FIG. 25 shows an example of the configuration of an improvement implementation support device 7 according to this embodiment.
- the input unit 72 includes a production performance data measurement unit 721, an equipment cost acquisition unit 722, a SW cost acquisition unit 723, a material/labor cost acquisition unit 724, an improvement proposal acquisition unit 725, a demand data acquisition unit 727, and a plan acquisition unit 728.
- a plan acquisition section 728 is added in the input section 72 of FIG. 25, a plan acquisition section 728 is added.
- the elements other than the plan acquisition unit 728 are similar to those shown in Fig. 19. Therefore, detailed description of these will be omitted.
- the plan acquisition unit 728 is an interface that inputs the equipment operation plan from the equipment operation plan derivation device 6.
- the memory 73 stores a resource consumption/production quantity database 731, an improvement plan/cost database 732, a demand forecast database 733, and a plan database 734.
- the memory 73 in FIG. 25 includes a plan database 734 added thereto.
- the elements other than the plan database 734 are similar to those shown in Fig. 19. Therefore, detailed description of these will be omitted.
- Plan database 734 is a database that stores information necessary to generate and modify equipment operation plans.
- the plan database 734 stores a detailed cost conversion rate table 777, a production plan table 778 relating to embodiment 3, a unit resource consumption table 779, a process-by-process production capacity table 780, an initial equipment operation plan before improvement 781, an improved equipment operation plan 782, an improved equipment operation plan 783, an improved equipment operation plan 784, a pre-improvement cost table 785, and an improved cost table 786.
- FIG. 26 shows a specific example of the detailed cost conversion rate table 777 .
- the detailed cost conversion rate table 777 includes a resource type, a cost conversion rate, and a unit.
- the cost conversion rates in the detailed cost conversion rate table 777 are more detailed than the cost conversion rates in the cost conversion rate table 770 (FIG. 8).
- the cost conversion rates in the cost conversion rate table 770 are the average values of the cost conversion rates in the cost conversion rate table 777.
- FIG. 27 shows a specific example of a production plan table 778 in a facility operation plan.
- the production plan table 778 includes the product name, start (date), end (date), equipment name, and production quantity.
- an equipment operation plan is generated from processing equipment A to assembly equipment A to painting equipment A.
- an equipment operation plan is generated from processing equipment A' to assembly equipment A to painting equipment A.
- the delivery date is set to September 28, 2023.
- processing device A processes 400 products.
- assembly device A combines two products and assembles them into one product.
- assembly device A produces 200 products.
- painting device A paints the 200 products.
- FIG. 28 shows a specific example of the unit resource consumption table 779 .
- the unit resource consumption table 779 indicates the resource consumption per unit production amount.
- the unit resource consumption table 779 includes a resource type, a resource consumption conversion rate, and a unit. For the sake of simplicity, FIG. 28 shows only power as a resource type.
- FIG. 29 shows a specific example of the process-by-process production capacity table 780.
- the process-by-process production capacity table 780 includes a process name, an equipment name, and a production capacity.
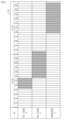
- FIG. 30 shows a specific example of an initial equipment operation plan 781 before improvement.
- An initial equipment operation plan before improvement 781 represents an initial equipment operation plan before various improvement proposals are applied.
- the initial equipment operation plan 781 before improvement in Fig. 30 is an equipment operation plan in which the production start time is fixed at 8:30.
- the initial equipment operation plan 781 before improvement in Fig. 30 represents an equipment operation plan for two days, September 28, 2023 and September 29, 2023.
- One grid on the horizontal axis represents one hour.
- an initial equipment operation plan 781 before improvement in FIG. 30 is an equipment operation plan regarding processing equipment A, assembly equipment A, and painting equipment A.
- the shaded time periods are the time periods during which each device operates. That is, processing device A operates from 8:30 to 13:30 on September 28th. Assembly device A operates from 13:30 to 1:30 on September 29th. Furthermore, painting device A operates from 9:30 to 23:30 on September 29th.
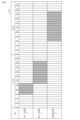
- FIG. 31 shows a specific example of the improved equipment operation plan 782 .
- the improved equipment operation plan 782 represents the equipment operation plan after various improvement proposals have been applied.
- An improved equipment operation plan 782 in FIG. 31 is an equipment operation plan in which the production start time is fixed at 8:30.
- 31 is an equipment operation plan for the processing equipment A', the assembly equipment A, and the painting equipment A.
- the improved equipment operation plan 782 in Fig. 31 takes into consideration the relationships between the improvement plans from improvement plan No. 1 to improvement plan No. 6. More specifically, the improved equipment operation plan 782 in Fig. 31 presents equipment operation plans in the cases where improvement plans No. 1, 3, 5, and 6 are respectively applied.
- the other elements are the same as the initial equipment operation plan 781 before improvement in FIG.
- FIG. 32 shows a specific example of the improved equipment operation plan 783.
- the improved equipment operation plan 783 represents the equipment operation plan after various improvement proposals are applied.
- An improved equipment operation plan 783 in FIG. 32 is an equipment operation plan in which the production start time is fixed at 6:00.
- the other elements are the same as the improved equipment operation plan 782 in FIG.
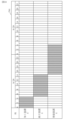
- FIG. 33 shows a specific example of the improved equipment operation plan 784 .
- the improved equipment operation plan 784 represents the equipment operation plan after various improvement proposals are applied.
- the improved equipment operation plan 783 in FIG. 33 is an equipment operation plan in which the production start time is fixed at 0:00 and assembly equipment A and painting equipment A are operated continuously. The other elements are the same as the improved equipment operation plan 782 in FIG.
- FIG. 34 shows a specific example of the pre-improvement cost table 785 .
- the pre-improvement cost table 785 indicates the labor costs, resource consumption costs, and the like in the pre-improvement initial facility operation plan 781 (FIG. 30).
- the pre-improvement cost table 785 includes a serial number (#), a labor cost, a resource consumption cost, and a total cost.
- FIG. 35 shows a specific example of the improved cost table 786 .
- the improved cost table 786 shows the labor costs, resource consumption costs, etc. in the improved equipment operation plan 782 (FIG. 31), the improved equipment operation plan 783 (FIG. 32), and the improved equipment operation plan 784 (FIG. 33).
- the improved cost table 786 includes a serial number (#), an improved labor cost, an improved resource consumption cost, an improved total cost, and a reduction rate.
- the calculation unit 74 includes an investment cost calculation unit 741, an improvement plan table generation unit 742, a relationship derivation unit 743, an evaluation unit 744, an information generation unit 745, a plan optimization unit 746, and an improvement effect correction unit 747. 25.
- a plan optimization unit 746 and an improvement effect correction unit 747 are added in FIG.
- the other elements are the same as those shown in Fig. 19. Therefore, detailed description of the other elements will be omitted.
- the plan optimization unit 746 and the improvement effect correction unit 747 will be described below.
- the plan optimization unit 746 is notified of the improvement plan selected by the user (hereinafter referred to as the selected improvement plan) from the improvement plan selection unit 753 of the output unit 75. Then, based on the selected improvement plan notified from the improvement plan selection unit 753, the plan optimization unit 746 optimizes the equipment operation plan so as to minimize the total cost of labor costs and resource consumption costs. In this embodiment, the plan optimization unit 746 sets 48 different production start times per day in 30-minute intervals. The plan optimization unit 746 also performs a brute-force determination of applicable combinations of start times for subsequent processes. In this manner, in this embodiment, the plan optimization unit 746 optimizes the equipment operation plan. Note that such combinations cannot be made manually.
- the plan optimization unit 746 may perform optimization calculations by increasing parameters, such as the order of products to be produced.
- the reduction ratio of serial number #2 is the largest.
- the equipment operation plan of serial number #2 is the improved equipment operation plan 783 in FIG. 32. Therefore, in this embodiment, the improved equipment operation plan 783 is the optimum case.
- the plan optimization unit 746 performs a brute force judgment, but the equipment operation plan may be optimized by other methods.
- the plan optimization unit 746 may optimize the equipment operation plan by using a solution search method based on a genetic algorithm or a Lagrangian relaxation method. In this way, the plan optimization unit 746 can generate facility operation plan information that minimizes the total cost in a finite time.
- the improvement effect correction unit 747 corrects the improvement effect of the selected improvement plan from the improvement effect calculated for the selected improvement plan by the evaluation unit 744. More specifically, the evaluation unit 744 refines the time resolution of the value output as the improvement effect by the information generation unit 745 based on the equipment operation plan optimized by the plan optimization unit 746. In this way, the improvement effect correction unit 747 can present a more accurate improvement effect that is in line with the operation of the actual manufacturing site. For example, when there is an annual schedule, the improvement effect correction unit 747 corrects the improvement effect by using the post-improvement cost table 786 (FIG. 35).
- the improvement effect correction unit 747 corrects the improvement effect by converting the equipment operation plan into annual data based on the period for which the equipment operation plan was generated. In this embodiment, the improvement effect correction unit 747 finally corrects the improvement effect.
- the improvement effect correction unit 747 may not correct the improvement effect, but may simply present the improvement effect based on the equipment operation plan together with the improvement effect output as a roadmap.
- the output unit 75 includes a priority order presenting unit 751 , a visualization information presenting unit 752 , an improvement plan selecting unit 753 , a plan presenting unit 754 , and a correction effect presenting unit 755 .
- an improvement plan selection section 753, a plan presentation section 754, and a correction effect presentation section 755 are added.
- the other elements are the same as those shown in Fig. 19. Therefore, detailed description of the other elements will be omitted.
- the improvement plan selection unit 753, the plan presentation unit 754, and the correction effect presentation unit 755 will be described below.
- the plan presentation unit 754 and the correction effect presentation unit 755 also function as presentation units.
- the improvement plan selection unit 753 is an interface that determines the improvement plan selected by the user. More specifically, the improvement plan selection unit 753 determines the improvement plan selected by the user from among a plurality of improvement plans included in the composite improvement plans of the roadmap graph 775 presented by the visualization information presentation unit 752. Then, the improvement plan selection unit 753 notifies the selected improvement plan to the plan optimization unit 746 .
- the plan presentation unit 754 outputs the equipment operation plan optimized by the plan optimization unit 746 to the display device 8.
- the correction effect presentation unit 755 outputs the improvement effect corrected by the improvement effect correction unit 747 to the display device 8.
- FIG. 36 is a flowchart showing an example of the operation of the improvement implementation support device 7 in the third embodiment. The operation of the improvement implementation support device 7 will be described with reference to FIG. In the following, the description of the processes overlapping with those in FIG. 23 will be omitted.
- Step S211 Determine whether the user has selected an improvement plan
- the improvement plan selection unit 753 determines whether or not the user has selected an improvement plan from among the multiple improvement plans included in the composite improvement plans of the roadmap graph 775 presented by the visualization information presentation unit 752 .
- the improvement plan selection unit 753 notifies the plan optimization unit 746 of the selected improvement plan, which is the improvement plan selected by the user. Then, the process proceeds to S211. If the user does not select an improvement plan, the process proceeds to S214.
- Step S212 Automatic application process of improvement plan to facility operation plan
- the plan optimization unit 746 optimizes the equipment operation plan based on the selected improvement plan notified by the improvement plan selection unit 753 so that the total cost of labor and resource consumption costs in the equipment operation plan is minimized.
- the plan optimization unit 746 outputs the equipment operation plan optimized by the plan optimization unit 746 to the display device 8 via the plan presentation unit 754.
- Step S213 Calculation of the correction value of the improvement effect
- the improvement effect correction unit 747 calculates a correction value of the value output by the information generation unit 745 as the improvement effect based on the equipment operation plan optimized by the plan optimization unit 746 . Furthermore, the evaluation unit 744 generates an improved cost table 786 (FIG. 35) in which the corrected values of the improvement effects are indicated. Then, the evaluation unit 744 presents an improved cost table 786 indicating the corrected values of the improvement effects on the display device 8 via the corrected effect presenting unit 755 .
- the improvement implementation support device 7 optimizes the facility operation plan so as to minimize costs based on the improvement plan selected by the user. Therefore, according to this embodiment, the manufacturing staff can correct and estimate the improvement amount when multiple improvement proposals calculated in advance are applied, and can easily confirm the realistic improvement amount.
- first to third embodiments have been described above, two or more of these embodiments may be combined for implementation. Alternatively, one of these embodiments may be partially implemented. Alternatively, two or more of these embodiments may be partially combined and implemented. Furthermore, the configurations and procedures described in these embodiments may be modified as necessary.
- the processor that realizes the control unit 71, the input unit 72, the calculation unit 74, and the output unit 75 is an IC (Integrated Circuit) that performs processing.
- the processor is a CPU (Central Processing Unit), a DSP (Digital Signal Processor), or the like.
- the memory 73 is a RAM (Random Access Memory).
- the auxiliary storage device (not shown) is a ROM (Read Only Memory), a flash memory, a HDD (Hard Disk Drive), or the like.
- the auxiliary storage device also stores an OS (Operating System). At least a portion of the OS is then executed by the processor.
- the processor executes at least a part of the OS, and executes a program that realizes the functions of the control unit 71, the input unit 72, the calculation unit 74, and the output unit 75.
- the processor executes the OS to perform tasks, memory management, file management, communication control, and the like.
- at least one of information, data, signal values, and variable values indicating the results of processing by the control unit 71, input unit 72, calculation unit 74, and output unit 75 is stored in at least one of the memory 73, the auxiliary storage device, a register within the processor, and a cache memory.
- the programs for realizing the functions of the control unit 71, the input unit 72, the calculation unit 74, and the output unit 75 may be stored in a portable recording medium such as a magnetic disk, a flexible disk, an optical disk, a compact disk, a Blu-ray (registered trademark) disk, a DVD, etc. Then, the portable recording medium in which the programs for realizing the functions of the control unit 71, the input unit 72, the calculation unit 74, and the output unit 75 are stored may be distributed.
- the "part" in at least one of the control unit 71, the input unit 72, the calculation unit 74, and the output unit 75 may be read as a "circuit” or a "process” or a “procedure” or a “processing” or a “circuitry”.
- the improvement implementation support device 7 may be realized by a processing circuit, such as a logic IC (Integrated Circuit), a GA (Gate Array), an ASIC (Application Specific Integrated Circuit), or an FPGA (Field-Programmable Gate Array).
- the control unit 71, the input unit 72, the calculation unit 74, and the output unit 75 are each realized as part of a processing circuit.
- the higher-level concept of a processor and a processing circuit is called “processing circuitry.” That is, a processor and a processing circuit are each specific examples of "processing circuitry.”
Landscapes
- Business, Economics & Management (AREA)
- Human Resources & Organizations (AREA)
- Engineering & Computer Science (AREA)
- Strategic Management (AREA)
- Entrepreneurship & Innovation (AREA)
- Economics (AREA)
- Operations Research (AREA)
- Game Theory and Decision Science (AREA)
- Development Economics (AREA)
- Marketing (AREA)
- Educational Administration (AREA)
- Quality & Reliability (AREA)
- Tourism & Hospitality (AREA)
- Physics & Mathematics (AREA)
- General Business, Economics & Management (AREA)
- General Physics & Mathematics (AREA)
- Theoretical Computer Science (AREA)
- Management, Administration, Business Operations System, And Electronic Commerce (AREA)
Abstract
投資コスト計算部(741)は、生産活動を改善するための複数の改善案の各々を実施するのに要する設備コストと設備コスト以外のコストとを投資コストとして計算する。評価部(744)は、複数の改善案の各々の実施による生産活動への改善効果を計算し、改善案ごとの投資コストと改善効果とを用いて、複数の改善案に優先順位を設定する。また、優先順位提示部(751)は、設定された、複数の改善案の優先順位を提示する。
Description
本開示は、生産活動を改善するための改善案に関する。
特許文献1には、製造業における設備投資への改善案を評価する技術が開示されている。
改善案を実施するのに要するコストには、設備コストと設備コスト以外のコストがある。特許文献1に開示の技術では、設備コストについては考慮されているが、設備コスト以外のコストは考慮されていない。設備コスト以外のコストは、例えば、材料、作業者、エネルギー等のコストである。
特許文献1に開示の技術では、設備コスト以外のコストは考慮されていないため、製造スタッフが改善案を評価する際に、設備コスト以外のコストを含めた総合的な評価をすることができないという課題がある。
特許文献1に開示の技術では、設備コスト以外のコストは考慮されていないため、製造スタッフが改善案を評価する際に、設備コスト以外のコストを含めた総合的な評価をすることができないという課題がある。
本開示は、このような課題を解決することを主な目的としている。より具体的には、本開示は、設備コスト以外のコストを含めた改善案の総合的な評価を可能にすることを主な目的とする。
本開示に係る情報処理装置は、
生産活動を改善するための複数の改善案の各々を実施するのに要する設備コストと前記設備コスト以外のコストとを投資コストとして計算する投資コスト計算部と、
前記複数の改善案の各々の実施による前記生産活動への改善効果を計算する改善効果計算部と、
改善案ごとの前記投資コストと前記改善効果とを用いて、前記複数の改善案に優先順位を設定する優先順位設定部と、
前記優先順位設定部により設定された、前記複数の改善案の優先順位を提示する提示部とを有する。
生産活動を改善するための複数の改善案の各々を実施するのに要する設備コストと前記設備コスト以外のコストとを投資コストとして計算する投資コスト計算部と、
前記複数の改善案の各々の実施による前記生産活動への改善効果を計算する改善効果計算部と、
改善案ごとの前記投資コストと前記改善効果とを用いて、前記複数の改善案に優先順位を設定する優先順位設定部と、
前記優先順位設定部により設定された、前記複数の改善案の優先順位を提示する提示部とを有する。
本開示によれば、設備コスト以外のコストを含めた改善案の総合的な評価を可能にする。
実施の形態の説明及び図面において、同じ要素及び対応する要素には同じ符号を付している。同じ符号が付された要素の説明は、適宜に省略又は簡略化する。図中の矢印はデータの流れ又は処理の流れを主に示している。
実施の形態1.
以下、本実施の形態について、図面を参照しながら詳細に説明する。
以下、本実施の形態について、図面を参照しながら詳細に説明する。
***概要***
本実施の形態に係る構成を説明する前に、本実施の形態の概要を説明する。
前述したように、特許文献1に開示の技術では、設備コスト以外のコストは考慮されていないため、製造スタッフが改善案を評価する際に、設備コスト以外のコストを含めた総合的な評価をすることができないという課題がある。
また、特許文献1に開示の技術では、改善案の実施期間、投資の回収期間等の製造スタッフが投資判断をするための情報が不足している。
更に、特許文献1に開示の技術では、改善案の実施の順番、改善の重複による影響を考慮していない。
つまり、特許文献1に開示の技術では、最小の投資額、且つ最短期間で、改善効果が最大化する改善案を提示することができないという課題がある。
本実施の形態では、これらの課題に対処する構成を説明する。
本実施の形態に係る構成を説明する前に、本実施の形態の概要を説明する。
前述したように、特許文献1に開示の技術では、設備コスト以外のコストは考慮されていないため、製造スタッフが改善案を評価する際に、設備コスト以外のコストを含めた総合的な評価をすることができないという課題がある。
また、特許文献1に開示の技術では、改善案の実施期間、投資の回収期間等の製造スタッフが投資判断をするための情報が不足している。
更に、特許文献1に開示の技術では、改善案の実施の順番、改善の重複による影響を考慮していない。
つまり、特許文献1に開示の技術では、最小の投資額、且つ最短期間で、改善効果が最大化する改善案を提示することができないという課題がある。
本実施の形態では、これらの課題に対処する構成を説明する。
具体的には、図1等を参照して後述する改善実施支援装置7が、生産活動を改善するための複数の改善案に優先順位を設定する。
そして、改善実施支援装置7が、複数の改善案の優先順位を提示する。
複数の改善案には、複合改善案が含まれる。複合改善案は、2以上の改善案で構成される。
改善実施支援装置7は、以下の手順にて、複数の改善案に優先順位を設定する。
そして、改善実施支援装置7が、複数の改善案の優先順位を提示する。
複数の改善案には、複合改善案が含まれる。複合改善案は、2以上の改善案で構成される。
改善実施支援装置7は、以下の手順にて、複数の改善案に優先順位を設定する。
改善実施支援装置7は、複数の改善案の各々を実施するための投資コストを計算する。
投資コストには、設備コストと設備コスト以外のコストが含まれる。
設備コストは、生産設備の購入、レンタル、維持等に要するコストである。
設備コスト以外のコストは、例えば、材料コスト、労務コスト、エネルギーコスト、ソフトウェアコストである。材料コストは、生産のために必要な材料に要するコストである。労務コストは、作業員等の人材に要するコストである。エネルギーコストは、生産のために消費するエネルギー(電気、ガス、水等)に要するコストである。ソフトウェアコストは、生産設備を稼動させるために必要なソフトウェアに要するコストである。
投資コストには、設備コストと設備コスト以外のコストが含まれる。
設備コストは、生産設備の購入、レンタル、維持等に要するコストである。
設備コスト以外のコストは、例えば、材料コスト、労務コスト、エネルギーコスト、ソフトウェアコストである。材料コストは、生産のために必要な材料に要するコストである。労務コストは、作業員等の人材に要するコストである。エネルギーコストは、生産のために消費するエネルギー(電気、ガス、水等)に要するコストである。ソフトウェアコストは、生産設備を稼動させるために必要なソフトウェアに要するコストである。
また、改善実施支援装置7は、複数の改善案の各々の実施による生産活動への改善効果を計算する。
複合改善案については、改善実施支援装置7は、複合改善案を構成する2以上の改善案間の関係性を用いて、改善効果を計算する。
改善実施支援装置7は、複合改善案を構成する2以上の改善案間の関係性として、2以上の改善案間の包含関係及び2以上の改善案間の順序関係の少なくともいずれかを用いる。
複合改善案については、改善実施支援装置7は、複合改善案を構成する2以上の改善案間の関係性を用いて、改善効果を計算する。
改善実施支援装置7は、複合改善案を構成する2以上の改善案間の関係性として、2以上の改善案間の包含関係及び2以上の改善案間の順序関係の少なくともいずれかを用いる。
そして、改善実施支援装置7は、計算した投資コストと改善効果とに基づき、複数の改善案に優先順位を設定する。
より具体的には、改善実施支援装置7は、改善案ごとに、改善効果の二乗値を投資コストで除算して得られる優先度評価値を計算する。
そして、改善実施支援装置7は、優先度評価値が大きい順に、複数の改善案に優先順位を設定する。
より具体的には、改善実施支援装置7は、改善案ごとに、改善効果の二乗値を投資コストで除算して得られる優先度評価値を計算する。
そして、改善実施支援装置7は、優先度評価値が大きい順に、複数の改善案に優先順位を設定する。
また、改善実施支援装置7は、改善案ごとに、投資コストと改善効果とを用いて、投資コストを回収するのに要する期間である回収期間を計算してもよい。また、改善実施支援装置7は、改善案ごとに回収期間を提示してもよい。
更に、改善実施支援装置7は、複数の改善案のうちの任意の改善案について、投資コストの計上スケジュール及び改善効果の実現スケジュールを可視化する可視化情報を生成してもよい。
また、改善実施支援装置7は、複数の改善案のうちの任意の改善案について、投資コスト及び改善効果の合算の累積推移を可視化する可視化情報を生成してもよい。
更に、改善実施支援装置7は、生成した可視化情報を提示してもよい。
また、改善実施支援装置7は、複数の改善案のうちの任意の改善案について、投資コスト及び改善効果の合算の累積推移を可視化する可視化情報を生成してもよい。
更に、改善実施支援装置7は、生成した可視化情報を提示してもよい。
以上が、本実施の形態に係る改善実施支援装置7の動作の概要である。
次に、改善実施支援装置7を含む改善実施支援システムの構成を説明する。
次に、改善実施支援装置7を含む改善実施支援システムの構成を説明する。
***全体構成の説明***
図1は、本実施の形態に係る改善実施支援システムの構成例を示している。
改善実施支援システムは、図1に示すように、1つ以上の生産設備1と、生産制御装置2と、コスト入力装置3と、改善案入力装置4と、需要予測装置5と、設備稼働計画導出装置6と、改善実施支援装置7と、表示装置8とを備える。
図1は、本実施の形態に係る改善実施支援システムの構成例を示している。
改善実施支援システムは、図1に示すように、1つ以上の生産設備1と、生産制御装置2と、コスト入力装置3と、改善案入力装置4と、需要予測装置5と、設備稼働計画導出装置6と、改善実施支援装置7と、表示装置8とを備える。
改善実施支援システムの各構成要素は、改善実施支援システムのいずれか1つ以上の構成要素と接続している。
改善実施支援装置7の構成例として、制御部71と、入力部72と、メモリ73と、計算部74と、出力部75とを備える。
改善実施支援装置7は、コンピュータであり、情報処理装置に相当する。また、改善実施支援装置7の動作手順は、情報処理方法に相当する。また、改善実施支援装置7の動作を実現するプログラムは、情報処理プログラムに相当する。
改善実施支援装置7の構成例として、制御部71と、入力部72と、メモリ73と、計算部74と、出力部75とを備える。
改善実施支援装置7は、コンピュータであり、情報処理装置に相当する。また、改善実施支援装置7の動作手順は、情報処理方法に相当する。また、改善実施支援装置7の動作を実現するプログラムは、情報処理プログラムに相当する。
生産設備1は、販売可能なものを工業的に生産する設備である。複数の生産設備1は、互いに異なってもよい。生産設備1は、具体例として、工業製品の製造設備又は発電設備である。
工場には、複数の生産設備1が含まれる。また、以下では、生産設備1は、単に設備ともいう。
工場には、複数の生産設備1が含まれる。また、以下では、生産設備1は、単に設備ともいう。
生産制御装置2は、改善実施支援装置7からの出力に基づいて1つ以上の生産設備1を制御する。
コスト入力装置3は、投資に要するコストを入力部72に入力する。投資に要するコストは、例えば、前述したように、材料コスト、労務コスト、エネルギーコスト、ソフトウェアコストである。
コスト入力装置3は、改善案ごとにコストを入力部72に入力する。なお、前述したように、改善案には複合改善案も含まれる。
コスト入力装置3は、改善案ごとにコストを入力部72に入力する。なお、前述したように、改善案には複合改善案も含まれる。
改善案入力装置4は、過去の複数の改善事例を入力部72に入力する。
改善事例には、具体例として、改善案、改善効果、効果対象資源、改善事例間の関係を判定可能なデータがある。
改善効果は、効果割合、効果量等である。
効果対象資源の対象となる資源は、人、電力、水使用量等である。
改善事例間の関係を判定可能なデータは、改善事例の包含関係、順序関係といった改善事例間の関係を判定可能なデータである。
改善事例には、具体例として、改善案、改善効果、効果対象資源、改善事例間の関係を判定可能なデータがある。
改善効果は、効果割合、効果量等である。
効果対象資源の対象となる資源は、人、電力、水使用量等である。
改善事例間の関係を判定可能なデータは、改善事例の包含関係、順序関係といった改善事例間の関係を判定可能なデータである。
需要予測装置5は、工場における生産実績データをもとに生産の需要を予測し、予測した需要を入力部72に入力する。
設備稼働計画導出装置6は、設備稼働計画を導出し、設備稼働計画を入力部72に入力する。
表示装置8は、改善実施支援装置7からの出力を表示する。表示装置8は、例えば、LCD(Liquid Crystal Display)である。
***改善実施支援装置7の構成の説明***
制御部71は、改善実施支援装置7の内部のデータの入出力を管理するとともに、他の装置との通信を制御する。
制御部71は、改善実施支援装置7の内部のデータの入出力を管理するとともに、他の装置との通信を制御する。
入力部72は、改善実施支援装置7に情報を入力する。
メモリ73は、改善実施支援装置7が計算に用いるデータを記憶している。
計算部74は、改善実施支援装置7において、各種データの計算を行う。
出力部75は、改善実施支援装置7において、計算部74の計算結果をグラフ及び表として出力する。
制御部71と入力部72と計算部74と出力部75は、ソフトウェアとハードウェアとの協動により実現される。
つまり、制御部71と入力部72と計算部74と出力部75は、ハードウェアであるプロセッサとソフトウェアであるプログラムにより構成される。そして、後述する制御部71と入力部72と計算部74と出力部75の各々の動作は、制御部71と入力部72と計算部74と出力部75の各々の機能を実現するプログラムをプロセッサが実行することで達成される。
制御部71と入力部72と計算部74と出力部75の各々の機能を実現するプログラムは、図示していない補助記憶装置に格納されている。そして、これらプログラムが、補助記憶装置からメモリ73にロードされ、プロセッサにより実行される。
つまり、制御部71と入力部72と計算部74と出力部75は、ハードウェアであるプロセッサとソフトウェアであるプログラムにより構成される。そして、後述する制御部71と入力部72と計算部74と出力部75の各々の動作は、制御部71と入力部72と計算部74と出力部75の各々の機能を実現するプログラムをプロセッサが実行することで達成される。
制御部71と入力部72と計算部74と出力部75の各々の機能を実現するプログラムは、図示していない補助記憶装置に格納されている。そして、これらプログラムが、補助記憶装置からメモリ73にロードされ、プロセッサにより実行される。
***入力部72の説明***
入力部72は、図2に示すように、生産実績データ測定部721と、設備コスト取得部722と、SWコスト取得部723と、材料/労務コスト取得部724と、改善案取得部725と、改善関係性取得部726と、需要データ取得部727とを備える。
以下、入力部72が備える各部を説明する。入力部72が備える各部が用いる情報については、基本的に後述する。
なお、図2に示す破線矢印は、データフローを表す。また、実線矢印は機能フローを表す。図19及び図25においても破線矢印と実線矢印の意味は同じである。
入力部72は、図2に示すように、生産実績データ測定部721と、設備コスト取得部722と、SWコスト取得部723と、材料/労務コスト取得部724と、改善案取得部725と、改善関係性取得部726と、需要データ取得部727とを備える。
以下、入力部72が備える各部を説明する。入力部72が備える各部が用いる情報については、基本的に後述する。
なお、図2に示す破線矢印は、データフローを表す。また、実線矢印は機能フローを表す。図19及び図25においても破線矢印と実線矢印の意味は同じである。
生産実績データ測定部721は、一つ以上の生産設備1の生産実績データを入力するインタフェースである。
生産実績データ測定部721は、改善実施支援装置7の計算部74で使用可能な形式になるよう、生産実績データのデータフォーマットの加工を行う。
生産実績データ測定部721は、改善実施支援装置7の計算部74で使用可能な形式になるよう、生産実績データのデータフォーマットの加工を行う。
設備コスト取得部722は、設備コストをコスト入力装置3より入力するインタフェースである。
設備コストには、現在の生産設備1における維持コストと、新規の生産設備1の導入コストとが含まれる。
設備コストには、現在の生産設備1における維持コストと、新規の生産設備1の導入コストとが含まれる。
SWコスト取得部723は、SW(ソフトウェア)コストをコスト入力装置3より入力するインタフェースである。
SWコストには、現在導入しているSWの維持コストと、新規SWの導入コストとが含まれる。
SWコストには、現在導入しているSWの維持コストと、新規SWの導入コストとが含まれる。
材料/労務コスト取得部724は、材料コストと労務コストとをコスト入力装置3より入力するインタフェースである。
材料コストには、現在使用している材料の購入費と、新規材料の導入コストとが含まれる。
労務コストには、現在の人件費と、改善案の適用に際して要する教育コストとが含まれる。
材料コストには、現在使用している材料の購入費と、新規材料の導入コストとが含まれる。
労務コストには、現在の人件費と、改善案の適用に際して要する教育コストとが含まれる。
改善案取得部725は、過去の複数の改善事例データを改善案入力装置4より入力するインタフェースである。
改善事例データには、改善案と、効果割合、効果量等の改善効果と、人、電力、水使用量等の効果対象資源とが含まれる。
改善事例データには、改善案と、効果割合、効果量等の改善効果と、人、電力、水使用量等の効果対象資源とが含まれる。
改善関係性取得部726は、改善案間の関係性を改善案入力装置4より入力するインタフェースである。
改善案間の関係性は、過去の複数の改善事例の間の包含関係及び順序関係である。
改善関係性取得部726は、取得した改善案間の関係性を改善案関係性テーブル768として、改善案/コストDB732に記憶する。
改善案間の関係性は、過去の複数の改善事例の間の包含関係及び順序関係である。
改善関係性取得部726は、取得した改善案間の関係性を改善案関係性テーブル768として、改善案/コストDB732に記憶する。
需要データ取得部727は、需要データを需要予測装置5より入力するインタフェースである。
需要データは、工場における生産実績データをもとに生産の需要を予測して得られたデータである。
需要データは、工場における生産実績データをもとに生産の需要を予測して得られたデータである。
***メモリ73の説明***
メモリ73は、図2に示すように、資源消費量/生産数量データベース731と、改善案/コストデータベース732と、需要予測データベース733とを記憶している。
以下、具体例を交えてメモリ73が記憶している情報を説明する。
メモリ73は、図2に示すように、資源消費量/生産数量データベース731と、改善案/コストデータベース732と、需要予測データベース733とを記憶している。
以下、具体例を交えてメモリ73が記憶している情報を説明する。
図3は、工場における製造過程を示す。
図3を参照して、メモリ73が記憶している情報の具体例の前提を説明する。
図3を参照して、メモリ73が記憶している情報の具体例の前提を説明する。
図3の四角形の各々は、生産工程を示す。
図3は、冷蔵庫又は空気調和機に用いられる圧縮機を工場で製造する際の製造過程を示す。本工場では、4種類の製品(製品A、製品B、製品C、及び製品D)を製造しているものとする。ここで、製品Aは、家庭用空気調和機向けの圧縮機である。製品Aは、利幅が小さく、販売数が多いものとする。それ以外の製品に関しては、具体例として提示しないため、詳細な説明を省略する。
図3は、冷蔵庫又は空気調和機に用いられる圧縮機を工場で製造する際の製造過程を示す。本工場では、4種類の製品(製品A、製品B、製品C、及び製品D)を製造しているものとする。ここで、製品Aは、家庭用空気調和機向けの圧縮機である。製品Aは、利幅が小さく、販売数が多いものとする。それ以外の製品に関しては、具体例として提示しないため、詳細な説明を省略する。
また、2023年度以降の需要予測と、現在の本工場における各生産工程に対応する生産能力とを比較すると、加工工程に対応する生産能力は不足しているものとする。一方、他の生産工程に対する生産能力は十分であるものとする。
更に、生産技術者の分析によって、本工場の加工工程と、組立工程と、塗装工程とにおいては、労務コスト及び電力コストにて余剰コストが発生していることが判明している。
そこで、本工場の所有者は、生産効率の向上と余剰コストの削減のため、生産技術者の提案した改善事例(改善案)リストの中から、次の6つの改善事例(改善案)を適用するための検討に着手している。
6つの改善事例(改善案)とは、以下の改善事例(改善案)である。
(1)段取り替えワンタッチ設備の導入
(2)段取り替え部品の5S管理
(3)生産前後における設備のON/OFF時間の適正化
(4)段取り替え作業の合理化
(5)揮発性の高い塗料への変更
(6)高性能の加工設備の導入
ここで、加工設備は、加工工程に対応する設備である。また、5S管理とは、日本語での「Seiri(整理)」、「Seiton(整頓)」、「Seisou (清掃)」、「Seiketsu (清潔)」及び「Shitsuke (しつけ)」の頭文字を取った管理方法である。
更に、生産技術者の分析によって、本工場の加工工程と、組立工程と、塗装工程とにおいては、労務コスト及び電力コストにて余剰コストが発生していることが判明している。
そこで、本工場の所有者は、生産効率の向上と余剰コストの削減のため、生産技術者の提案した改善事例(改善案)リストの中から、次の6つの改善事例(改善案)を適用するための検討に着手している。
6つの改善事例(改善案)とは、以下の改善事例(改善案)である。
(1)段取り替えワンタッチ設備の導入
(2)段取り替え部品の5S管理
(3)生産前後における設備のON/OFF時間の適正化
(4)段取り替え作業の合理化
(5)揮発性の高い塗料への変更
(6)高性能の加工設備の導入
ここで、加工設備は、加工工程に対応する設備である。また、5S管理とは、日本語での「Seiri(整理)」、「Seiton(整頓)」、「Seisou (清掃)」、「Seiketsu (清潔)」及び「Shitsuke (しつけ)」の頭文字を取った管理方法である。
しかしながら、前記6つの改善事例(改善案)のうち、1つ以上の改善事例を適用した後における長期的な改善効果及び投資回収期間が判然としない。このため、改善事例(改善案)をどう組み合わせて、どの順序で適用するべきかを一目で判断することができないという課題がある。
以下、本実施の形態により本課題を解決する方法を説明する。
以下、本実施の形態により本課題を解決する方法を説明する。
***資源消費量/生産数量データベース731の説明***
図2の資源消費量/生産数量データベース731は、年単位需給数量実績テーブル762と、工程別需給数量実績テーブル763と、生産時間内訳テーブル765と、資源消費量テーブル769と、コスト換算レートテーブル770と、資源消費コストテーブル771とを格納するデータベースである。
図2の資源消費量/生産数量データベース731は、年単位需給数量実績テーブル762と、工程別需給数量実績テーブル763と、生産時間内訳テーブル765と、資源消費量テーブル769と、コスト換算レートテーブル770と、資源消費コストテーブル771とを格納するデータベースである。
***年単位需給数量実績テーブル762の説明***
年単位生産数量実績テーブル762は、生産物の生産数量(供給量)と需要数量(需要量)との実績を示す。
図4は、年単位需給数量実績テーブル762の具体例を示している。
図4に示すように、年単位需給数量実績テーブル762は、過去3年間(2020年度~2022年度)における4種類の製品の生産数量実績と、需要数量実績と、製品単価とを含む。
開始は、各年度の開始日を示す。終了は、各年度の終了日を示す。
年単位生産数量実績テーブル762は、生産物の生産数量(供給量)と需要数量(需要量)との実績を示す。
図4は、年単位需給数量実績テーブル762の具体例を示している。
図4に示すように、年単位需給数量実績テーブル762は、過去3年間(2020年度~2022年度)における4種類の製品の生産数量実績と、需要数量実績と、製品単価とを含む。
開始は、各年度の開始日を示す。終了は、各年度の終了日を示す。
***工程別需給数量実績テーブル763の説明***
図5は、工程別需給数量実績テーブル763の具体例を示している。
図5に示すように、工程別需給数量実績テーブル763は、2022年度における製品Aの工程別の設備台数と、生産数量実績と、需要数量実績とを含む。
図5では、一例として、製品Aのみの工程別需給数量実績を提示している。
工程別需給数量実績テーブル763に、製品名列を追加してもよい。そして、製品名列に、製品A、製品B、製品C、製品Dを記述して、製品別に設備台数と生産数量実績と需要数量実績を管理するようにしてもよい。
また、工程別需給数量実績テーブル763に、各工程の設備情報を追加してもよい。例えば、加工工程の設備情報として、加工工程を行う設備の名称(加工設備A、加工設備B、加工設備C等)を追加してもよい。
図5は、工程別需給数量実績テーブル763の具体例を示している。
図5に示すように、工程別需給数量実績テーブル763は、2022年度における製品Aの工程別の設備台数と、生産数量実績と、需要数量実績とを含む。
図5では、一例として、製品Aのみの工程別需給数量実績を提示している。
工程別需給数量実績テーブル763に、製品名列を追加してもよい。そして、製品名列に、製品A、製品B、製品C、製品Dを記述して、製品別に設備台数と生産数量実績と需要数量実績を管理するようにしてもよい。
また、工程別需給数量実績テーブル763に、各工程の設備情報を追加してもよい。例えば、加工工程の設備情報として、加工工程を行う設備の名称(加工設備A、加工設備B、加工設備C等)を追加してもよい。
***生産時間内訳テーブル765の説明***
図6は、生産時間内訳テーブル765の具体例を示している。
図6に示すように、生産時間内訳テーブル765は、2022年度の本工場におけるカテゴリと、時間内訳とを含む。
生産時間内訳テーブル765は、工程別もしくは生産設備1別に算出してもよい。
ここで、カテゴリとは、設備の運転状態である。カテゴリには、図6に示すように、生産、段取り替え、材料交換、立上げ/立下げ、待機、停止等がある。カテゴリは、設備から取得できる情報に応じて、事前に設定することとする。
時間内訳は、各カテゴリに要する時間の全体の時間に対する内訳である。
図6は、生産時間内訳テーブル765の具体例を示している。
図6に示すように、生産時間内訳テーブル765は、2022年度の本工場におけるカテゴリと、時間内訳とを含む。
生産時間内訳テーブル765は、工程別もしくは生産設備1別に算出してもよい。
ここで、カテゴリとは、設備の運転状態である。カテゴリには、図6に示すように、生産、段取り替え、材料交換、立上げ/立下げ、待機、停止等がある。カテゴリは、設備から取得できる情報に応じて、事前に設定することとする。
時間内訳は、各カテゴリに要する時間の全体の時間に対する内訳である。
***資源消費量テーブル769の説明***
図7は、資源消費量テーブル769の具体例を示している。
図7に示すように、資源消費量テーブル769は、カテゴリと、資源種別と、資源消費量と、単位とを含む。
カテゴリは、図6に示すものと同じである。
資源種別は、各カテゴリで消費される資源の種類を示す。図7では、一例として、資源種別を電力と人とに分類している。
資源消費量は、各カテゴリで現在までに消費された資源の量である。
単位は、資源消費量の単位である。
図7では、週の単位で資源消費量を示すが、週以外の単位で資源消費量を示してもよい。
図7は、資源消費量テーブル769の具体例を示している。
図7に示すように、資源消費量テーブル769は、カテゴリと、資源種別と、資源消費量と、単位とを含む。
カテゴリは、図6に示すものと同じである。
資源種別は、各カテゴリで消費される資源の種類を示す。図7では、一例として、資源種別を電力と人とに分類している。
資源消費量は、各カテゴリで現在までに消費された資源の量である。
単位は、資源消費量の単位である。
図7では、週の単位で資源消費量を示すが、週以外の単位で資源消費量を示してもよい。
***コスト換算レートテーブル770の説明***
図8は、コスト換算レートテーブル770の具体例を示している。
図8に示すように、コスト換算レートテーブル770は、資源種別と、コスト換算レートと、単位とを含む。
資源種別は、図7に示すものと同じである。
コスト換算レートは、図7の資源種別に対して設定される。
単位は、コスト換算レートの単位である。
図8は、コスト換算レートテーブル770の具体例を示している。
図8に示すように、コスト換算レートテーブル770は、資源種別と、コスト換算レートと、単位とを含む。
資源種別は、図7に示すものと同じである。
コスト換算レートは、図7の資源種別に対して設定される。
単位は、コスト換算レートの単位である。
***資源消費コストテーブル771の説明***
図9は、資源消費コストテーブル771の具体例を示している。
図9に示すように、資源消費コストテーブル771は、カテゴリと、資源種別と、資源消費コストとを含む。
カテゴリは、図6に示すものと同じである。
資源種別は、図7に示すものと同じである。
資源消費コストは、資源消費量テーブル769(図7)の資源消費量と、コスト換算レートテーブル770(図8)のコスト換算レートとを用いて、(資源消費量)×(コスト換算レート)によって計算される。
図9は、資源消費コストテーブル771の具体例を示している。
図9に示すように、資源消費コストテーブル771は、カテゴリと、資源種別と、資源消費コストとを含む。
カテゴリは、図6に示すものと同じである。
資源種別は、図7に示すものと同じである。
資源消費コストは、資源消費量テーブル769(図7)の資源消費量と、コスト換算レートテーブル770(図8)のコスト換算レートとを用いて、(資源消費量)×(コスト換算レート)によって計算される。
***改善案/コストデータベース732の説明***
図2の改善案/コストデータベース732は、改善案詳細情報テーブル764と、改善案関係性テーブル768とを格納するデータベースである。
なお、投資コストは、工場の設備、工程に割り当てられている人数、各人員の時給等の給与形態等に影響される。このため、改善案関係性テーブル768の投資コストには、計算部74で計算を行うまでは参考値が格納してある。
図2の改善案/コストデータベース732は、改善案詳細情報テーブル764と、改善案関係性テーブル768とを格納するデータベースである。
なお、投資コストは、工場の設備、工程に割り当てられている人数、各人員の時給等の給与形態等に影響される。このため、改善案関係性テーブル768の投資コストには、計算部74で計算を行うまでは参考値が格納してある。
***改善案詳細情報テーブル764の説明***
図10は、改善案詳細情報テーブル764の具体例を示している。
図10に示すように、改善案詳細情報テーブル764は、改善案No.と、カテゴリと、加工工程と、組立工程と、塗装工程と、改善案と、生産能力と、作業時間短縮割合とを含む。
カテゴリは、図6に示すものと同じである。
図10に示す加工工程、組立工程及び塗装工程は、図3に示す加工、組立及び塗装に対応する。
また、図10の改善案詳細情報テーブル764から、加工工程、組立工程及び塗装工程列を削除し、新たに工程情報という列を追加し、工程情報の列内に加工、組立及び塗装等の工程名を記載してもよい。
図10において、「APPLIED」は改善案が適用される工程を示す。
例えば、改善案No.1は、カテゴリ「段取り替え」に関連する「段取り替えワンタッチ設備を導入」であり、加工過程と組立過程に適用される。
図10に示す生産能力は、例えば、改善案No.6である高性能設備を導入した場合に想定される高性能設備1台における1年間の生産数量である。生産能力の単位は、一例として[個/年,台]である。
また、作業短縮割合は、各改善案を適用した場合に作業時間を短縮するとこができる割合を示す。作業短縮割合は、[%]で表わされる。
図10は、改善案詳細情報テーブル764の具体例を示している。
図10に示すように、改善案詳細情報テーブル764は、改善案No.と、カテゴリと、加工工程と、組立工程と、塗装工程と、改善案と、生産能力と、作業時間短縮割合とを含む。
カテゴリは、図6に示すものと同じである。
図10に示す加工工程、組立工程及び塗装工程は、図3に示す加工、組立及び塗装に対応する。
また、図10の改善案詳細情報テーブル764から、加工工程、組立工程及び塗装工程列を削除し、新たに工程情報という列を追加し、工程情報の列内に加工、組立及び塗装等の工程名を記載してもよい。
図10において、「APPLIED」は改善案が適用される工程を示す。
例えば、改善案No.1は、カテゴリ「段取り替え」に関連する「段取り替えワンタッチ設備を導入」であり、加工過程と組立過程に適用される。
図10に示す生産能力は、例えば、改善案No.6である高性能設備を導入した場合に想定される高性能設備1台における1年間の生産数量である。生産能力の単位は、一例として[個/年,台]である。
また、作業短縮割合は、各改善案を適用した場合に作業時間を短縮するとこができる割合を示す。作業短縮割合は、[%]で表わされる。
図11は、改善案関係性テーブル768の具体例を示している。
図11に示すように、改善案関係性テーブル768は、通し番号(#)と、改善案No.と、改善案と、カテゴリと、資源種別と、効果割合と、投資コスト種別と、投資コストと、準備期間と、包含関係と、順序関係前と、順序関係後とを含む。
ただし、投資コストの初期値は、前述した通り参考値である。
また、通し番号(#)は、改善案詳細情報テーブル764(図10)と同様の改善案No.と、資源種別とを反映させた通し番号である。図11では、改善案No.の数(6つの改善案)と資源種別の数(「電力」及び「人」の2つ)の乗算値である、12個の通し番号を持つ。
改善案/コストデータベース732には、過去の改善事例が通し番号で格納されている。図11では、改善案詳細情報テーブル764(図10)に含まれる改善事案のみが含まれる。しかし、計算部74が必要な改善案を抽出できるように、過去の改善案のすべてが改善案関係性テーブル768に含まれていてもよい。
効果割合は、改善案を実施した場合の効果割合を示す。
投資コスト種別は、投資コストを算出するために必要となる、投資コストの詳細情報である。
準備期間は、改善案を実施するための準備期間を示す。この準備期間には、設備の更新タイミングに合わせて、新規高性能設備を導入するまでの期間が含まれる。具体的には、準備期間に、新規高性能設備導入に向けた工事の見積もりに要する期間又は工事の受理発注が行われるまでの期間が含まれていてもよい。また、準備期間に、新規オペレーションを適用するための教育期間が含まれていてもよい。
図11に示すように、改善案関係性テーブル768は、通し番号(#)と、改善案No.と、改善案と、カテゴリと、資源種別と、効果割合と、投資コスト種別と、投資コストと、準備期間と、包含関係と、順序関係前と、順序関係後とを含む。
ただし、投資コストの初期値は、前述した通り参考値である。
また、通し番号(#)は、改善案詳細情報テーブル764(図10)と同様の改善案No.と、資源種別とを反映させた通し番号である。図11では、改善案No.の数(6つの改善案)と資源種別の数(「電力」及び「人」の2つ)の乗算値である、12個の通し番号を持つ。
改善案/コストデータベース732には、過去の改善事例が通し番号で格納されている。図11では、改善案詳細情報テーブル764(図10)に含まれる改善事案のみが含まれる。しかし、計算部74が必要な改善案を抽出できるように、過去の改善案のすべてが改善案関係性テーブル768に含まれていてもよい。
効果割合は、改善案を実施した場合の効果割合を示す。
投資コスト種別は、投資コストを算出するために必要となる、投資コストの詳細情報である。
準備期間は、改善案を実施するための準備期間を示す。この準備期間には、設備の更新タイミングに合わせて、新規高性能設備を導入するまでの期間が含まれる。具体的には、準備期間に、新規高性能設備導入に向けた工事の見積もりに要する期間又は工事の受理発注が行われるまでの期間が含まれていてもよい。また、準備期間に、新規オペレーションを適用するための教育期間が含まれていてもよい。
包含関係、順序関係前、順序関係後の改善案間の関係性には、事前に設定された数値が使用される。
包含関係に示される数値は対応する改善案No.を示す。図11では、改善案No.1の改善案は改善案No.2の改善案と改善案No.4の改善案とを含む。改善案No.2の包含関係の「1」は改善案No.2の改善案が改善案No.1の改善案に包含されることを示す。同様に、改善案No.4の包含関係の「1」は改善案No.4の改善案が改善案No.1の改善案に包含されることを示す。
改善案No.1の「段取り替えワンタッチ設備の導入」を実施することで、段取り替え作業の短縮時間の上限値に達してしまう。このため、その後に実施予定であった、改善案No.2の「段取り替え部品の5S管理」及び改善案No.4の「段取り替え作業の合理化」を実施する必要がなくなる。このため、改善案No.1の改善案は改善案No.2の改善案と改善案No.4の改善案とを含む。
改善案の包含関係の詳細は、実施の形態2において図22を利用して後述する。
包含関係に示される数値は対応する改善案No.を示す。図11では、改善案No.1の改善案は改善案No.2の改善案と改善案No.4の改善案とを含む。改善案No.2の包含関係の「1」は改善案No.2の改善案が改善案No.1の改善案に包含されることを示す。同様に、改善案No.4の包含関係の「1」は改善案No.4の改善案が改善案No.1の改善案に包含されることを示す。
改善案No.1の「段取り替えワンタッチ設備の導入」を実施することで、段取り替え作業の短縮時間の上限値に達してしまう。このため、その後に実施予定であった、改善案No.2の「段取り替え部品の5S管理」及び改善案No.4の「段取り替え作業の合理化」を実施する必要がなくなる。このため、改善案No.1の改善案は改善案No.2の改善案と改善案No.4の改善案とを含む。
改善案の包含関係の詳細は、実施の形態2において図22を利用して後述する。
順序関係前と順序関係後に格納されている数値は、対応する改善案No.を示す。
図11では、改善案No.6の改善案を改善案No.1の改善案と改善案No.2の改善案と改善案No.4の改善案の後に実施することを示す。
つまり、改善案No.1の順序関係前の「6」は改善案No.6の改善案を改善案No.1の改善案の前に実施することを示す。同様に、改善案No.2の順序関係前の「6」は改善案No.6の改善案を改善案No.2の改善案の前に実施することを示す。同様に、改善案No.4の順序関係前の「6」は改善案No.6の改善案を改善案No.4の改善案の前に実施することを示す。更に、改善案No.6の順序関係後の「1、2、4」は改善案No.6の改善案の後に改善案No.1、改善案No.2及び改善案No.4の改善案を実施することを示す。
改善案No.6の「高性能設備1台の導入」を先に実施すると、改善案No.1の「段取り替えワンタッチ設備の導入」と改善案No.2の「段取り替え部品の5S管理」と改善案No.4の「段取り替え作業の合理化」の後に実施する場合と比べて、生産可能時間の変動により、導入する設備の台数が多くなる。このため、改善案No.6の改善案を改善案No.1の改善案と改善案No.2の改善案と改善案No.4の改善案の後に実施することが望ましい。
順序関係の詳細は、実施の形態2において図21を利用して後述する。
図11では、改善案No.6の改善案を改善案No.1の改善案と改善案No.2の改善案と改善案No.4の改善案の後に実施することを示す。
つまり、改善案No.1の順序関係前の「6」は改善案No.6の改善案を改善案No.1の改善案の前に実施することを示す。同様に、改善案No.2の順序関係前の「6」は改善案No.6の改善案を改善案No.2の改善案の前に実施することを示す。同様に、改善案No.4の順序関係前の「6」は改善案No.6の改善案を改善案No.4の改善案の前に実施することを示す。更に、改善案No.6の順序関係後の「1、2、4」は改善案No.6の改善案の後に改善案No.1、改善案No.2及び改善案No.4の改善案を実施することを示す。
改善案No.6の「高性能設備1台の導入」を先に実施すると、改善案No.1の「段取り替えワンタッチ設備の導入」と改善案No.2の「段取り替え部品の5S管理」と改善案No.4の「段取り替え作業の合理化」の後に実施する場合と比べて、生産可能時間の変動により、導入する設備の台数が多くなる。このため、改善案No.6の改善案を改善案No.1の改善案と改善案No.2の改善案と改善案No.4の改善案の後に実施することが望ましい。
順序関係の詳細は、実施の形態2において図21を利用して後述する。
***需要予測データベース733の説明***
需要予測データベース733は、年単位需要予測テーブル774を格納するデータベースである。
需要予測データベース733は、年単位需要予測テーブル774を格納するデータベースである。
***年単位需要予測テーブル774の説明***
年単位需要予測テーブル774は、生産物の需要の予測を示す。
図12は、年単位需要予測テーブル774の具体例を示している。
図12に示すように、年単位需要予測テーブル774は、将来10年間(2023年度~2033年度)の製品の需要予測数量を示す。
図12では、簡単化のため、年単位需給数量実績テーブル762(図4)に示す4つの製品のうち製品Aの将来10年間の需要予測数量のみを示す。
年単位需要予測テーブル774は、生産物の需要の予測を示す。
図12は、年単位需要予測テーブル774の具体例を示している。
図12に示すように、年単位需要予測テーブル774は、将来10年間(2023年度~2033年度)の製品の需要予測数量を示す。
図12では、簡単化のため、年単位需給数量実績テーブル762(図4)に示す4つの製品のうち製品Aの将来10年間の需要予測数量のみを示す。
***計算部74の説明***
計算部74は、図2に示すように、投資コスト計算部741と、改善案テーブル生成部742と、評価部744と、情報生成部745とを備える。
以下、計算部74が備える各部を説明する。
計算部74が備える各部が用いる情報については、基本的に後述する。
計算部74は、図2に示すように、投資コスト計算部741と、改善案テーブル生成部742と、評価部744と、情報生成部745とを備える。
以下、計算部74が備える各部を説明する。
計算部74が備える各部が用いる情報については、基本的に後述する。
***投資コスト計算部741の説明***
投資コスト計算部741は、改善案ごとに、投資コストを計算する。つまり、投資コスト計算部741は、改善案関係性テーブル768(図11)の行ごとに投資コストを計算する。
投資コスト計算部741は、取得情報と、工場の設備に割り当てられている人数と、工程に割り当てられている人数と、各人員の時給等の給与形態とを用いて、投資コストを計算する。取得情報は、設備コスト取得部722とSWコスト取得部723と材料/労務コスト取得部724と改善案取得部725が取得した情報である。
投資コスト計算部741は、改善案ごとに、投資コストを計算する。つまり、投資コスト計算部741は、改善案関係性テーブル768(図11)の行ごとに投資コストを計算する。
投資コスト計算部741は、取得情報と、工場の設備に割り当てられている人数と、工程に割り当てられている人数と、各人員の時給等の給与形態とを用いて、投資コストを計算する。取得情報は、設備コスト取得部722とSWコスト取得部723と材料/労務コスト取得部724と改善案取得部725が取得した情報である。
***改善案テーブル生成部742の説明***
改善案テーブル生成部742は、投資コスト計算部741が計算した投資コスト及び取得情報をもとに、図11の改善案関係性テーブル768を修正する。
改善案テーブル生成部742は、投資コスト計算部741が計算した投資コスト及び取得情報をもとに、図11の改善案関係性テーブル768を修正する。
***評価部744の説明***
評価部744は、改善案ごとに、改善効果を計算する
また、評価部744は、改善案ごとに、投資コストと改善効果とを用いて、投資コストを回収するのに要する期間である投資回収期間(以下、単に回収期間ともいう)を計算する。
更に、評価部744は、投資コストと改善効果とに基づき、複数の改善案に優先順位を設定する。
評価部744は、改善効果計算部、優先順位設定部及び回収期間計算部に相当する。評価部744により行われる処理は、改善効果計算処理、優先順位設定処理及び回収期間計算処理に相当する。
評価部744は、改善案ごとに、改善効果を計算する
また、評価部744は、改善案ごとに、投資コストと改善効果とを用いて、投資コストを回収するのに要する期間である投資回収期間(以下、単に回収期間ともいう)を計算する。
更に、評価部744は、投資コストと改善効果とに基づき、複数の改善案に優先順位を設定する。
評価部744は、改善効果計算部、優先順位設定部及び回収期間計算部に相当する。評価部744により行われる処理は、改善効果計算処理、優先順位設定処理及び回収期間計算処理に相当する。
より具体的には、評価部744は、資源消費量テーブル769(図7)と、コスト換算レートテーブル770(図8)とを用いて、資源消費コストテーブル771(図9)を前述の方法で生成する。
また、評価部744は、改善案関係性テーブル768(図11)の効果割合を使用して、複合改善案別効果テーブル772(図13)の各行の改善効果を算出する。
また、評価部744は、複合改善案別効果テーブル772(図13)の改善効果と投資コストとを用いて、複合改善案別効果テーブル772(図13)の各行の投資回収期間を算出する。
また、評価部744は、優先度評価テーブル773(図14)に示す優先度評価値を算出する。
改善効果、投資回収期間及び優先度評価値の詳細な計算方法は後述する。
また、評価部744は、改善案関係性テーブル768(図11)の効果割合を使用して、複合改善案別効果テーブル772(図13)の各行の改善効果を算出する。
また、評価部744は、複合改善案別効果テーブル772(図13)の改善効果と投資コストとを用いて、複合改善案別効果テーブル772(図13)の各行の投資回収期間を算出する。
また、評価部744は、優先度評価テーブル773(図14)に示す優先度評価値を算出する。
改善効果、投資回収期間及び優先度評価値の詳細な計算方法は後述する。
***複合改善案別効果テーブル772の説明***
図13は、プレス工程の複合改善案別効果テーブル772の具体例を示している。
図13に示すように、複合改善案別効果テーブル772は、複合改善案No.と、改善案と、カテゴリと、改善効果と、投資コストと、投資回収期間とを含む。
評価部744は、複合改善案別効果テーブル772の各種情報を以下の方法で算出する。
評価部744は、資源消費コストテーブル771(図9)の資源消費コストと、改善案関係性テーブル768(図11)の効果割合とを用いて改善効果を算出する。
例えば、改善案No.2の場合、評価部744は、改善対象資源種別が電力の改善効果を、700円/週×0.05=35円/週と算出する。また、評価部744は、改善対象資源種別が人の改善効果を、5000円×0.05=250円/週と算出する。
したがって、評価部744は、改善案No.2の改善効果の合計値として、35円/週+250円/週=285円/週を得る。
図13は、プレス工程の複合改善案別効果テーブル772の具体例を示している。
図13に示すように、複合改善案別効果テーブル772は、複合改善案No.と、改善案と、カテゴリと、改善効果と、投資コストと、投資回収期間とを含む。
評価部744は、複合改善案別効果テーブル772の各種情報を以下の方法で算出する。
評価部744は、資源消費コストテーブル771(図9)の資源消費コストと、改善案関係性テーブル768(図11)の効果割合とを用いて改善効果を算出する。
例えば、改善案No.2の場合、評価部744は、改善対象資源種別が電力の改善効果を、700円/週×0.05=35円/週と算出する。また、評価部744は、改善対象資源種別が人の改善効果を、5000円×0.05=250円/週と算出する。
したがって、評価部744は、改善案No.2の改善効果の合計値として、35円/週+250円/週=285円/週を得る。
評価部744は、週単位の改善効果を、年単位に換算して、複合改善案別効果テーブル772(図13)に示す改善効果[万円/年]を得る。
評価部744は、複合改善案の改善効果を算出する場合は、複合改善案に含まれる各改善案の改善効果を積算する。
評価部744は、複合改善案の改善効果を算出する場合は、複合改善案に含まれる各改善案の改善効果を積算する。
また、前述したように、改善案間の関係性を判定する必要がある場合は、評価部744は、改善案間の関係性による効果を反映させた改善効果を算出する。
例えば、複合改善案No.1,4の改善効果については、評価部744は、改善案No.4に関する改善効果を無視し、改善案No.1の改善効果のみを適用する。このため、評価部744は、複合改善案No.1,4の改善効果を、改善案No.1の改善効果と同様の17.10万円/年と算出する。
例えば、複合改善案No.1,4の改善効果については、評価部744は、改善案No.4に関する改善効果を無視し、改善案No.1の改善効果のみを適用する。このため、評価部744は、複合改善案No.1,4の改善効果を、改善案No.1の改善効果と同様の17.10万円/年と算出する。
改善対象資源種別の投資コストに関しては、設備を導入する台数などに修正が発生し、再計算が必要になった場合は、評価部744は、再度計算を行う。
また、評価部744は、投資回収期間を、複合改善案別効果テーブル772における(投資コスト)÷(改善効果)によって計算する。
また、評価部744は、投資回収期間を、複合改善案別効果テーブル772における(投資コスト)÷(改善効果)によって計算する。
***優先度評価テーブル773の説明***
図14は、プレス工程の優先度評価テーブル773の具体例を示している。
図14の例では、優先度評価テーブル773は、優先順位と、複合改善案No.と、改善効果と、投資コストと、投資回収期間と、優先度評価値とを含む。
優先順位として、評価部744は、後述する優先度評価値をもとに、優先度評価値の大きいものから順に複合改善案に順位を付ける。
図14の例において、評価部744は、優先度評価値を、(改善効果)÷(投資回収期間)=(改善効果)×(改善効果)÷(投資コスト)によって計算する。
ユーザは、改善効果が大きく、投資回収期間が短い改善案を希望する。このため、評価部744は、改善効果が大きく、投資回収期間が短い改善案に高い優先度評価値が付与されるように優先度評価値を算出する。
但し、評価部744は、異なる基準で優先度評価値を算出してもよい。
図14は、プレス工程の優先度評価テーブル773の具体例を示している。
図14の例では、優先度評価テーブル773は、優先順位と、複合改善案No.と、改善効果と、投資コストと、投資回収期間と、優先度評価値とを含む。
優先順位として、評価部744は、後述する優先度評価値をもとに、優先度評価値の大きいものから順に複合改善案に順位を付ける。
図14の例において、評価部744は、優先度評価値を、(改善効果)÷(投資回収期間)=(改善効果)×(改善効果)÷(投資コスト)によって計算する。
ユーザは、改善効果が大きく、投資回収期間が短い改善案を希望する。このため、評価部744は、改善効果が大きく、投資回収期間が短い改善案に高い優先度評価値が付与されるように優先度評価値を算出する。
但し、評価部744は、異なる基準で優先度評価値を算出してもよい。
***情報生成部745の説明***
情報生成部745は、ロードマップグラフ775(図15)と合計累積コストグラフ776(図16)とを生成する。
ロードマップグラフ775は、投資コストの計上スケジュール及び改善効果の実現スケジュールを可視化する可視化情報である。
合計累積コストグラフ776は、投資コスト及び改善効果の合算の累積推移を可視化する可視化情報である。
情報生成部745は、評価部744により生成された優先度評価テーブル773(図14)と、需要予測データベース733に格納された年単位需要予測テーブル774(図12)とを用いて、ロードマップグラフ775と合計累積コストグラフ776とを生成する。
情報生成部745は、ロードマップグラフ775(図15)と合計累積コストグラフ776(図16)とを生成する。
ロードマップグラフ775は、投資コストの計上スケジュール及び改善効果の実現スケジュールを可視化する可視化情報である。
合計累積コストグラフ776は、投資コスト及び改善効果の合算の累積推移を可視化する可視化情報である。
情報生成部745は、評価部744により生成された優先度評価テーブル773(図14)と、需要予測データベース733に格納された年単位需要予測テーブル774(図12)とを用いて、ロードマップグラフ775と合計累積コストグラフ776とを生成する。
***ロードマップグラフ775の説明***
図15は、ロードマップグラフ775の具体例を示している。
図15は、ロードマップグラフ775の具体例を示している。
図15のロードマップグラフ775において、縦軸の正の領域が、改善案を適用することによる改善効果である。また、縦軸の負の領域が、改善案を適用するために要する投資コストである。また、横軸は時系列であり、図15では、1区間が1年を表している。
図15では、ロードマップグラフ775を、改善案を適用順に並べた積み上げ棒グラフで表現している。
ロードマップグラフ775において、改善案No.は棒グラフ内に記載されている。具体的には、棒グラフ内の「1」、「3」及び「6」が改善案N0.である。
改善案別の投資回収期間及び、複合改善案の投資回収期間もロードマップグラフ775内に記載されている。
更に、図15のロードマップグラフ775では、優先度評価テーブル773(図14)において優先順位が最も高い複合改善案No.1,3,6が初期表示されている。
図15では、ロードマップグラフ775を、改善案を適用順に並べた積み上げ棒グラフで表現している。
ロードマップグラフ775において、改善案No.は棒グラフ内に記載されている。具体的には、棒グラフ内の「1」、「3」及び「6」が改善案N0.である。
改善案別の投資回収期間及び、複合改善案の投資回収期間もロードマップグラフ775内に記載されている。
更に、図15のロードマップグラフ775では、優先度評価テーブル773(図14)において優先順位が最も高い複合改善案No.1,3,6が初期表示されている。
図15の右上に示す選択ボタン7750を用いて、優先順位の高い順に、改善案ごとのロードマップグラフ775を表示させることが可能である。
ユーザは、選択ボタン7750を用いて任意の改善案を選択することができる。情報生成部745は、ユーザにより選択された改善案のロードマップグラフ775を生成する。
投資コストの棒グラフは、複合改善案No.1,3,6を構成する改善案ごとに表示される。投資コストの棒グラフは、順序関係の制約を考慮した上で表示される。改善案ごとの投資コストの棒グラフの長さは、優先度評価テーブル773(図14)の投資コストを準備期間で除算して得られる値に対応する。
図15のロードマップグラフ775は、準備期間、つまり、投資コストが存在する期間の次の年に改善効果が出ることを前提にして生成されている。
ユーザは、選択ボタン7750を用いて任意の改善案を選択することができる。情報生成部745は、ユーザにより選択された改善案のロードマップグラフ775を生成する。
投資コストの棒グラフは、複合改善案No.1,3,6を構成する改善案ごとに表示される。投資コストの棒グラフは、順序関係の制約を考慮した上で表示される。改善案ごとの投資コストの棒グラフの長さは、優先度評価テーブル773(図14)の投資コストを準備期間で除算して得られる値に対応する。
図15のロードマップグラフ775は、準備期間、つまり、投資コストが存在する期間の次の年に改善効果が出ることを前提にして生成されている。
***合計累積コストグラフ776の説明***
図16は、合計累積コストグラフ776の具体例を示している。
図16は、合計累積コストグラフ776の具体例を示している。
合計累積コストグラフ776では、縦軸が改善案を適用した場合における改善効果と投資コストの合計値(合算値)を表している。また、横軸は時系列を表している。
ここで、1年目の合計値は、(今年度の改善効果)―(今年度の投資コスト)で計算される。2年目の合計値は、(前年度の合計値)+(今年度の改善効果)―(今年度の投資コスト)で計算される。3年目以降の合計値は、合計累積値を用いることで、(前年度の合計累積値)+(今年度の改善効果)―(今年度の投資コスト)によって計算される。
合計累積コストグラフ776では、ロードマップグラフ775(図15)と同様に、優先度評価テーブル773(図14)において、優先順位が最も高い複合改善案No.1,3,6が初期表示されている。
ロードマップグラフ775と同様に、図16の右上に示す選択ボタン7760を用いて、優先順位の高い順に、改善案ごとの合計累積コストグラフ776を表示させることが可能である。
ユーザは、選択ボタン7760を用いて任意の改善案を選択することができる。情報生成部745は、ユーザにより選択された改善案の合計累積コストグラフ776を生成する。
ここで、1年目の合計値は、(今年度の改善効果)―(今年度の投資コスト)で計算される。2年目の合計値は、(前年度の合計値)+(今年度の改善効果)―(今年度の投資コスト)で計算される。3年目以降の合計値は、合計累積値を用いることで、(前年度の合計累積値)+(今年度の改善効果)―(今年度の投資コスト)によって計算される。
合計累積コストグラフ776では、ロードマップグラフ775(図15)と同様に、優先度評価テーブル773(図14)において、優先順位が最も高い複合改善案No.1,3,6が初期表示されている。
ロードマップグラフ775と同様に、図16の右上に示す選択ボタン7760を用いて、優先順位の高い順に、改善案ごとの合計累積コストグラフ776を表示させることが可能である。
ユーザは、選択ボタン7760を用いて任意の改善案を選択することができる。情報生成部745は、ユーザにより選択された改善案の合計累積コストグラフ776を生成する。
***出力部75の説明***
出力部75は、図2に示すように、優先順位提示部751と、可視化情報提示部752とを備える。以下、出力部75が備える各部を説明する。
出力部75は、図2に示すように、優先順位提示部751と、可視化情報提示部752とを備える。以下、出力部75が備える各部を説明する。
優先順位提示部751は、計算部74の評価部744により生成された優先度評価テーブル773(図14)を表示装置8に出力する。
優先順位提示部751は、提示部に相当する。また、優先順位提示部751により行われる処理は、提示処理に相当する。
優先順位提示部751は、提示部に相当する。また、優先順位提示部751により行われる処理は、提示処理に相当する。
可視化情報提示部752は、計算部74の情報生成部745により生成されたロードマップグラフ775(図15)及び合計累積コストグラフ776(図16)を表示装置8に出力する。
可視化情報提示部752も、提示部に相当する。また、可視化情報提示部752により行われる処理も、提示処理に相当する。
可視化情報提示部752も、提示部に相当する。また、可視化情報提示部752により行われる処理も、提示処理に相当する。
***動作の説明***
図17及び図18は、実施の形態1における改善実施支援装置7の動作の一例を示すフローチャートである。
図17及び図18を用いて、改善実施支援装置7の動作を説明する。
図17及び図18は、実施の形態1における改善実施支援装置7の動作の一例を示すフローチャートである。
図17及び図18を用いて、改善実施支援装置7の動作を説明する。
(ステップS201:初回かどうかの判定)
改善実施支援装置7において、改善案のロードマップグラフ775の提示及び完了判定が一度も行われていない場合は、処理がステップS202に移行する。
一方、改善案のロードマップグラフ775の提示及び完了判定が行われている場合は、処理がステップS301に移行する。
ステップS201の判定は、後述するフラグを参照することで行われる。
改善実施支援装置7において、改善案のロードマップグラフ775の提示及び完了判定が一度も行われていない場合は、処理がステップS202に移行する。
一方、改善案のロードマップグラフ775の提示及び完了判定が行われている場合は、処理がステップS301に移行する。
ステップS201の判定は、後述するフラグを参照することで行われる。
(ステップS202:投資コストの算出)
投資コスト計算部741は、入力部72における設備コスト取得部722と、SWコスト取得部723と、材料/労務コスト取得部724と、改善案取得部725とにより取得した各種情報を用いて、改善案/コストデータベース732に格納されている投資コストを再計算する。
そして、投資コスト計算部741は、再計算後の投資コストを改善案/コストデータベース732に格納する。
投資コスト計算部741は、入力部72における設備コスト取得部722と、SWコスト取得部723と、材料/労務コスト取得部724と、改善案取得部725とにより取得した各種情報を用いて、改善案/コストデータベース732に格納されている投資コストを再計算する。
そして、投資コスト計算部741は、再計算後の投資コストを改善案/コストデータベース732に格納する。
(ステップS203:改善案関係性テーブルの生成)
改善案テーブル生成部742は、投資コスト計算部741で計算した投資コスト及び各種取得データをもとに、改善案関係性テーブル768(図11)を生成する。
そして、改善案テーブル生成部742は、改善案関係性テーブル768を改善案/コストデータベース732に格納する。
改善案テーブル生成部742は、投資コスト計算部741で計算した投資コスト及び各種取得データをもとに、改善案関係性テーブル768(図11)を生成する。
そして、改善案テーブル生成部742は、改善案関係性テーブル768を改善案/コストデータベース732に格納する。
(ステップS205:時系列生産データの加工)
改善案テーブル生成部742が、資源消費量/生産数量データベース731に格納されている、生産数量の時系列データをもとに、年単位需給数量実績テーブル762(図4)と、工程別需給数量実績テーブル763(図5)とを生成する。
改善案テーブル生成部742が、資源消費量/生産数量データベース731に格納されている、生産数量の時系列データをもとに、年単位需給数量実績テーブル762(図4)と、工程別需給数量実績テーブル763(図5)とを生成する。
(ステップS206:目標値/エネルギーベースラインの算出)
改善案テーブル生成部742が、資源消費量の時系列データをもとに、資源消費量テーブル769(図7)と、コスト換算レートテーブル770(図8)とを生成する。
そして、改善案テーブル生成部742は、資源消費量テーブル769とコスト換算レートテーブル770を資源消費量/生産数量データベース731に格納する。
また、改善案テーブル生成部742は、生産数量と資源消費量の時系列データをもとに、カテゴリを判定し、生産時間内訳テーブル765(図6)を生成する。そして、改善案テーブル生成部742は、生産時間内訳テーブル765を資源消費量/生産数量データベース731に格納する。
資源消費量テーブル769(図7)は、資源消費量のエネルギーベースライン(平均的な生産をしている場合の資源消費量)を表す。改善案テーブル生成部742は、このエネルギーベースラインに設計値を用いてもよい。
また、ステップS206において、改善案テーブル生成部742は、資源消費量の時系列データを用いて、目標値を算出してもよい。また、改善案テーブル生成部742は、目標値に設計値を用いてもよい。
改善案テーブル生成部742が、資源消費量の時系列データをもとに、資源消費量テーブル769(図7)と、コスト換算レートテーブル770(図8)とを生成する。
そして、改善案テーブル生成部742は、資源消費量テーブル769とコスト換算レートテーブル770を資源消費量/生産数量データベース731に格納する。
また、改善案テーブル生成部742は、生産数量と資源消費量の時系列データをもとに、カテゴリを判定し、生産時間内訳テーブル765(図6)を生成する。そして、改善案テーブル生成部742は、生産時間内訳テーブル765を資源消費量/生産数量データベース731に格納する。
資源消費量テーブル769(図7)は、資源消費量のエネルギーベースライン(平均的な生産をしている場合の資源消費量)を表す。改善案テーブル生成部742は、このエネルギーベースラインに設計値を用いてもよい。
また、ステップS206において、改善案テーブル生成部742は、資源消費量の時系列データを用いて、目標値を算出してもよい。また、改善案テーブル生成部742は、目標値に設計値を用いてもよい。
(ステップS207:改善効果の算出)
評価部744が、資源消費量/生産数量データベース731に格納された、資源消費量テーブル769(図7)と、コスト換算レートテーブル770(図8)とを用いて、資源消費コストテーブル771(図9)を前述の方法で生成する。
また、評価部744は、改善案関係性テーブル768(図11)に示す効果割合を用いて、複合改善案別効果テーブル772(図13)の改善効果を複合改善案ごとに算出する。
評価部744が、資源消費量/生産数量データベース731に格納された、資源消費量テーブル769(図7)と、コスト換算レートテーブル770(図8)とを用いて、資源消費コストテーブル771(図9)を前述の方法で生成する。
また、評価部744は、改善案関係性テーブル768(図11)に示す効果割合を用いて、複合改善案別効果テーブル772(図13)の改善効果を複合改善案ごとに算出する。
(ステップS208:投資回収期間の算出)
評価部744は、ステップS207で算出した改善効果と投資コストとを用いて、投資回収期間を改善案ごとに算出する。評価部744は、(投資コスト)÷(改善効果)によって投資回収期間を算出する。
評価部744は、ステップS207で算出した改善効果と投資コストとを用いて、投資回収期間を改善案ごとに算出する。評価部744は、(投資コスト)÷(改善効果)によって投資回収期間を算出する。
(ステップS209:改善優先順位の算出)
評価部744は、ステップS207で算出した改善効果とステップS208で算出した投資回収期間とを用いて、優先度評価テーブル773(図14)の優先度評価値を改善案ごとに算出する。
そして、評価部744は、改善案ごとの改善効果と投資回収期間と優先度評価値とを優先順位提示部751に出力する。
優先順位提示部751は、改善案ごとの改善効果と投資回収期間と優先度評価値とを表示装置8に出力する。
評価部744は、ステップS207で算出した改善効果とステップS208で算出した投資回収期間とを用いて、優先度評価テーブル773(図14)の優先度評価値を改善案ごとに算出する。
そして、評価部744は、改善案ごとの改善効果と投資回収期間と優先度評価値とを優先順位提示部751に出力する。
優先順位提示部751は、改善案ごとの改善効果と投資回収期間と優先度評価値とを表示装置8に出力する。
(ステップS210:改善案のロードマップの出力)
情報生成部745が、評価部744により生成された優先度評価テーブル773(図14)と、需要予測データベース733に格納された年単位需要予測テーブル774(図12)とを用いて、ロードマップグラフ775(図15)と合計累積コストグラフ776(図16)を生成する。
そして、情報生成部745は、ロードマップグラフ775と合計累積コストグラフ776とを可視化情報提示部752に出力する。
可視化情報提示部752は、ロードマップグラフ775と合計累積コストグラフ776とを表示装置8に出力する。
情報生成部745が、評価部744により生成された優先度評価テーブル773(図14)と、需要予測データベース733に格納された年単位需要予測テーブル774(図12)とを用いて、ロードマップグラフ775(図15)と合計累積コストグラフ776(図16)を生成する。
そして、情報生成部745は、ロードマップグラフ775と合計累積コストグラフ776とを可視化情報提示部752に出力する。
可視化情報提示部752は、ロードマップグラフ775と合計累積コストグラフ776とを表示装置8に出力する。
(ステップS214:完了判定)
情報生成部745が、改善実施支援装置7における計算が完了したことを示すフラグを既定の記憶領域に格納する。
このフラグは、ステップS201の判定に使用する。
情報生成部745が、改善実施支援装置7における計算が完了したことを示すフラグを既定の記憶領域に格納する。
このフラグは、ステップS201の判定に使用する。
(ステップS301:改善案の更新有の判定)
改善案のロードマップグラフ775の提示及び完了判定が行われる場合(ステップS201でNOの場合)に、改善案の更新があれば、投資コスト計算部741が投資コストの算出(ステップS202)を再度行う。また、改善案テーブル生成部742が改善案関係性テーブルの生成(ステップS203)を再度行う。
これらに応じて、改善効果及びロードマップグラフ775(図15)が変化する。
改善案のロードマップグラフ775の提示及び完了判定が行われる場合(ステップS201でNOの場合)に、改善案の更新があれば、投資コスト計算部741が投資コストの算出(ステップS202)を再度行う。また、改善案テーブル生成部742が改善案関係性テーブルの生成(ステップS203)を再度行う。
これらに応じて、改善効果及びロードマップグラフ775(図15)が変化する。
(ステップS302:既存の目標値/エネルギーベースラインの呼び出し処理)
改善案テーブル生成部742が、直近に計算した目標値/エネルギーベースラインを呼び出す。
改善案テーブル生成部742が、直近に計算した目標値/エネルギーベースラインを呼び出す。
(ステップS401:時系列データの更新有の判定)
改善案のロードマップグラフ775の提示及び完了判定が行われる場合(S201でNOの場合)に、改善案の更新がなく(S301でNOの場合)、時系列データの更新があれば、処理がステップS402に移行する。
改善案のロードマップグラフ775の提示及び完了判定が行われる場合(S201でNOの場合)に、改善案の更新がなく(S301でNOの場合)、時系列データの更新があれば、処理がステップS402に移行する。
(ステップS402:既存の改善案テーブルの呼び出し)
改善案テーブル生成部742が、直近に生成された改善案テーブルを呼び出す。
その後、改善案テーブル生成部742が、時系列生産データの加工(ステップS205)と、目標値/エネルギーベースラインの算出(ステップS206)を行う。
これらに応じて、改善効果及びロードマップグラフ775(図15)が変化する。
改善案テーブル生成部742が、直近に生成された改善案テーブルを呼び出す。
その後、改善案テーブル生成部742が、時系列生産データの加工(ステップS205)と、目標値/エネルギーベースラインの算出(ステップS206)を行う。
これらに応じて、改善効果及びロードマップグラフ775(図15)が変化する。
(ステップS501:事前に算出した情報の出力)
改善案のロードマップグラフ775の提示及び完了判定が行われる場合(S201でNOの場合)に、改善案の更新がなく(S301でNOの場合)、時系列データの更新もなければ(ステップS401でNO)、評価部744が、ロードマップグラフ775を出力するために必要となる各種情報を取得する。
改善案のロードマップグラフ775の提示及び完了判定が行われる場合(S201でNOの場合)に、改善案の更新がなく(S301でNOの場合)、時系列データの更新もなければ(ステップS401でNO)、評価部744が、ロードマップグラフ775を出力するために必要となる各種情報を取得する。
***実施の形態1の効果の説明***
以上のように、本実施の形態では、投資コストと改善効果に基づき、改善案に優先順位を設定する。
このため、本実施の形態によれば、製造スタッフは、最小の投資コストで最大の改善効果が得られる改善案を容易に確認することができる。
以上のように、本実施の形態では、投資コストと改善効果に基づき、改善案に優先順位を設定する。
このため、本実施の形態によれば、製造スタッフは、最小の投資コストで最大の改善効果が得られる改善案を容易に確認することができる。
実施の形態2.
以下、本実施の形態について、図面を参照しながら詳細に説明する。
特に、実施の形態1との差異について、重点的に説明する。
以下で説明していない事項は、実施の形態1と同様である。
以下、本実施の形態について、図面を参照しながら詳細に説明する。
特に、実施の形態1との差異について、重点的に説明する。
以下で説明していない事項は、実施の形態1と同様である。
実施の形態1では、改善実施支援装置7は、例えば製造スタッフによって事前に用意されている改善案の間の関係性をもとにロードマップグラフ775を生成する。
これに対して、本実施の形態では、改善実施支援装置7が、改善案間の関係性を判定し、判定結果をもとにロードマップグラフ775を生成する。
これに対して、本実施の形態では、改善実施支援装置7が、改善案間の関係性を判定し、判定結果をもとにロードマップグラフ775を生成する。
***構成の説明***
図19は、本実施の形態に係る改善実施支援装置7の構成例を示す。
図19は、本実施の形態に係る改善実施支援装置7の構成例を示す。
入力部72は、図19に示すように、生産実績データ測定部721と、設備コスト取得部722と、SWコスト取得部723と、材料/労務コスト取得部724と、改善案取得部725と、需要データ取得部727とを備える。
これらは、実施の形態1で説明したものと同様である。このため、これらの詳細な説明は省略する。
図2と比較して、図19の入力部72では、改善関係性取得部726が存在しない。
本実施の形態では、入力データとして、改善案間の関係性を取得せず、計算部74が改善案間の関係性を判定する。このため、図19には改善関係性取得部726は存在しない。
これらは、実施の形態1で説明したものと同様である。このため、これらの詳細な説明は省略する。
図2と比較して、図19の入力部72では、改善関係性取得部726が存在しない。
本実施の形態では、入力データとして、改善案間の関係性を取得せず、計算部74が改善案間の関係性を判定する。このため、図19には改善関係性取得部726は存在しない。
メモリ73は、図19に示すように、資源消費量/生産数量データベース731と、改善案/コストデータベース732と、需要予測データベース733とを記憶している。
計算部74が改善案間の関係性を判定することに関連して、改善案/コストデータベース732の内容が実施の形態1から一部変更されている。このため、以下では、改善案/コストデータベース732の変更点を中心に説明する。
なお、資源消費量/生産数量データベース731と需要予測データベース733は、実施の形態1で説明したものと同様である。
計算部74が改善案間の関係性を判定することに関連して、改善案/コストデータベース732の内容が実施の形態1から一部変更されている。このため、以下では、改善案/コストデータベース732の変更点を中心に説明する。
なお、資源消費量/生産数量データベース731と需要予測データベース733は、実施の形態1で説明したものと同様である。
改善案/コストデータベース732は、改善案テーブル761(図20)と、改善案詳細情報テーブル764(図10)と、改善案関係性テーブル768(図11)とを格納するデータベースである。
なお、改善案テーブル761における投資コストは、工場の設備、工程に割り当てられている人数、各人員の時給等の給与形態等に影響される。このため、改善案テーブル761における投資コストには、計算部74で計算を行うまでは参考値が格納してある。
なお、改善案テーブル761における投資コストは、工場の設備、工程に割り当てられている人数、各人員の時給等の給与形態等に影響される。このため、改善案テーブル761における投資コストには、計算部74で計算を行うまでは参考値が格納してある。
図20は、改善案テーブル761の具体例を示している。
改善案テーブル761は、通し番号(#)と、改善案No.と、改善案と、カテゴリと、資源種別と、効果割合と、投資コスト種別と、投資コストと、準備期間とを含む。
ただし、投資コストの初期値は、前述した通り参考値である。
改善案テーブル761では、実施の形態1の改善案関係性テーブル768(図11)で存在していた包含関係、順序関係前及び順序関係後が存在していない。
改善案テーブル761の各項目は、改善案関係性テーブル768の同じ名称の項目と同様である。このため、これらの詳細な説明は省略する。
改善案テーブル761は、通し番号(#)と、改善案No.と、改善案と、カテゴリと、資源種別と、効果割合と、投資コスト種別と、投資コストと、準備期間とを含む。
ただし、投資コストの初期値は、前述した通り参考値である。
改善案テーブル761では、実施の形態1の改善案関係性テーブル768(図11)で存在していた包含関係、順序関係前及び順序関係後が存在していない。
改善案テーブル761の各項目は、改善案関係性テーブル768の同じ名称の項目と同様である。このため、これらの詳細な説明は省略する。
計算部74は、図19に示すように、投資コスト計算部741と、改善案テーブル生成部742と、関係性導出部743と、評価部744と、情報生成部745とを備える。
図2と比較して、図19の計算部74では、関係性導出部743が追加されている。
関係性導出部743は改善案間の関係性を判定する。
また、本実施の形態では、改善案テーブル生成部742の動作の一部が実施の形態1と異なっている。
以下では、改善案テーブル生成部742の変更点及び関係性導出部743の計算方法を中心に説明する。
改善案テーブル生成部742及び関係性導出部743以外の要素は、実施の形態1に示したものと同様である。このため、これらの詳細な説明は省略する。
図2と比較して、図19の計算部74では、関係性導出部743が追加されている。
関係性導出部743は改善案間の関係性を判定する。
また、本実施の形態では、改善案テーブル生成部742の動作の一部が実施の形態1と異なっている。
以下では、改善案テーブル生成部742の変更点及び関係性導出部743の計算方法を中心に説明する。
改善案テーブル生成部742及び関係性導出部743以外の要素は、実施の形態1に示したものと同様である。このため、これらの詳細な説明は省略する。
改善案テーブル生成部742は、投資コスト計算部741で計算した投資コスト及び各種取得データをもとに、図20の改善案テーブル761を生成する。
関係性導出部743は、改善案の包含関係及び順序関係、つまり、改善案間の関係性をアルゴリズムによって判定する。
まず、順序関係について、図21を用いた説明を行う前に、改善案No.1を適用することによる生産時間の増加効果を説明する。
まず、順序関係について、図21を用いた説明を行う前に、改善案No.1を適用することによる生産時間の増加効果を説明する。
図6は、生産時間内訳テーブル765の具体例である。また、図10は、改善案詳細情報テーブル764の具体例である。図6及び図10を参照して改善案No.1の生産時間増加効果を説明する。
改善案No.1の生産時間増加効果は、以下のように計算できる。
(改善案No.1適用後の生産可能時間割合)/(改善案No.1適用前の生産可能時間割合)={(改善案No.1適用前の生産可能時間割合)+(改善案No.1適用後の段取り替え時間削減割合)}/(改善適用前の生産時間割合)
=(0.3+0.2×0.5)/0.3=4/3
ここで、改善案No.1適用後の段取り替え時間削減割合は、生産時間内訳テーブル765(図6)の生産の時間内訳30%(0.3)及び段取り替えの時間内訳20%(0.2)と、改善案詳細情報テーブル764(図10)の作業短縮割合50%(0.5)を用いて計算している。
改善案No.1の生産時間増加効果は、以下のように計算できる。
(改善案No.1適用後の生産可能時間割合)/(改善案No.1適用前の生産可能時間割合)={(改善案No.1適用前の生産可能時間割合)+(改善案No.1適用後の段取り替え時間削減割合)}/(改善適用前の生産時間割合)
=(0.3+0.2×0.5)/0.3=4/3
ここで、改善案No.1適用後の段取り替え時間削減割合は、生産時間内訳テーブル765(図6)の生産の時間内訳30%(0.3)及び段取り替えの時間内訳20%(0.2)と、改善案詳細情報テーブル764(図10)の作業短縮割合50%(0.5)を用いて計算している。
図21は、順序関係判定グラフ766の具体例を示している。
順序関係判定グラフ766は、ロードマップグラフ775と同様に、縦軸の正の領域が、改善案を適用することによる改善効果を表している。また、縦軸の負の領域が、改善案を適用するために要する投資コストを表している。また、横軸は時系列である。
順序関係判定グラフ766は、ロードマップグラフ775と同様に、縦軸の正の領域が、改善案を適用することによる改善効果を表している。また、縦軸の負の領域が、改善案を適用するために要する投資コストを表している。また、横軸は時系列である。
図21では、順序関係判定グラフ766を、改善案を適用順に並べた積み上げ棒グラフとして表現している。
図21では、改善案No.6の「高性能設備の導入」と、改善案No.1の「段取り替えワンタッチ設備の導入」という2つの改善案を適用する例を想定している。
図21の左側の「Before」は、順序関係を考慮せず、改善案No.6の後に改善案No.1を適用した例を示す。
図21の右側の「After」は、順序関係を考慮し、改善案No.1を適用した後に改善案No.6を適用する例を示す。
図21では、改善案No.6の「高性能設備の導入」と、改善案No.1の「段取り替えワンタッチ設備の導入」という2つの改善案を適用する例を想定している。
図21の左側の「Before」は、順序関係を考慮せず、改善案No.6の後に改善案No.1を適用した例を示す。
図21の右側の「After」は、順序関係を考慮し、改善案No.1を適用した後に改善案No.6を適用する例を示す。
図5の工程別需給数量実績テーブル763の加工工程の生産数量実績は、34000個/年である。つまり、現状の加工工程には、34000個/年の生産能力がある。
ここで、改善案No.6の「高性能設備の導入」を先に実施する「Before」を適用する場合を考える。
高性能設備の生産能力は、図10の改善案詳細情報テーブル764より10000個/(年、台)である。
このため、4台の高性能設備を導入することによって、図5の工程別需給数量実績テーブル763の加工工程の需要数量実績である40000個/年に到達する(現状の段取り替え時間で、生産数を満たすためには、設備4台が必要となる)。
つまり、高性能設備に変更することによって、従来の加工工程の設備台数5台より、1台台数を減らすことができている。
高性能設備の生産能力は、図10の改善案詳細情報テーブル764より10000個/(年、台)である。
このため、4台の高性能設備を導入することによって、図5の工程別需給数量実績テーブル763の加工工程の需要数量実績である40000個/年に到達する(現状の段取り替え時間で、生産数を満たすためには、設備4台が必要となる)。
つまり、高性能設備に変更することによって、従来の加工工程の設備台数5台より、1台台数を減らすことができている。
同様にして、順序関係を考慮し、改善案No.1を適用した後に改善案No.6を適用する「After」を適用する場合を考える。
改善案No.1の「段取り替えワンタッチ設備の導入」による生産時間増加効果は、前述の計算結果の通り、4/3である。
高性能設備の生産能力は、図10の改善案詳細情報テーブル764より10000個/(年、台)である。
先に「段取り替えワンタッチの導入」を実施すると、生産時間は増加する。このため、高性能設備を3台導入するだけで済む。
従って、10000個/(年、台)×3×(4/3)=40000個/年と、加工工程の需要数量実績である40000個/年に到達する。
改善案No.1の「段取り替えワンタッチ設備の導入」による生産時間増加効果は、前述の計算結果の通り、4/3である。
高性能設備の生産能力は、図10の改善案詳細情報テーブル764より10000個/(年、台)である。
先に「段取り替えワンタッチの導入」を実施すると、生産時間は増加する。このため、高性能設備を3台導入するだけで済む。
従って、10000個/(年、台)×3×(4/3)=40000個/年と、加工工程の需要数量実績である40000個/年に到達する。
図21の「Before」と「After」とを比較した結果、「Before」では、1台分の投資が無駄になるという結論が得られる。
また、「After」では設備を導入する台数が1台分減少するため、設備の投資コストが削減される。
また、「After」では設備を導入する台数が1台分減少するため、設備の投資コストが削減される。
図21の「After」を適用することにより、最低限需要量を満たした場合の、投資コストと改善効果の合計値(前述の合計累積コストグラフ776(図16)にある合算値と同様の値、つまり改善効果と投資コストの差)は以下のように変化する。
設備数が減少することによって、労務コストが削減される。また、高性能設備の導入で生産が安定化することによって、不良品の減少による製造単価が低減される効果によって、材料コストが削減される。
更に、長期的な視点で見ると、高性能設備の導入によって、設備の維持費が以前よりかからなくなるという効果がある。また、トラブル原因の特定が容易になることによって、作業員の非作業時間に要していた労務コストが削減する。
設備数が減少することによって、労務コストが削減される。また、高性能設備の導入で生産が安定化することによって、不良品の減少による製造単価が低減される効果によって、材料コストが削減される。
更に、長期的な視点で見ると、高性能設備の導入によって、設備の維持費が以前よりかからなくなるという効果がある。また、トラブル原因の特定が容易になることによって、作業員の非作業時間に要していた労務コストが削減する。
関係性導出部743は、異常のような計算を行って、改善案の順序関係を判定する。
図22は、包含関係判定グラフ767の具体例を示している。
包含関係判定グラフ767は、ロードマップグラフ775及び順序関係判定グラフ766と同様に、縦軸の正の領域が、改善案を適用することによる改善効果を表している。また、縦軸の負の領域が、改善案を適用するために要する投資コストを表している。また、横軸は時系列である。
包含関係判定グラフ767は、ロードマップグラフ775及び順序関係判定グラフ766と同様に、縦軸の正の領域が、改善案を適用することによる改善効果を表している。また、縦軸の負の領域が、改善案を適用するために要する投資コストを表している。また、横軸は時系列である。
図22では、包含関係判定グラフ767を、改善案を適用順に並べた積み上げ棒グラフとして表現している。
図22では、改善案No.4の「段取り替え作業の合理化」と、改善案No.1の「段取り替えワンタッチ設備の導入」という2つの改善案を適用する例を想定している。
図22の左側の「Before」は、包含関係を考慮せず、改善案No.4の後に改善案No.1を適用した例を示す。
図22の右側の「After」は、包含関係を考慮し、改善案No.1を適用した後に改善案No.4を適用する例を示す。
また、図22では、段取り替えの改善の短縮時間の最大値(上限値)は、30分/(設備、日)であることを前提条件としている。段取り替えの作業時間を短縮しすぎると製品の品質担保が困難になるとの想定のもと、短縮時間の最大値(上限値)を設定している。
図10の改善案詳細情報テーブル764では、作業短縮割合が50%である。作業短縮割合:50%が、短縮時間の最大値(上限値):30分/(設備、日)に相当する。
図22では、改善案No.4の「段取り替え作業の合理化」と、改善案No.1の「段取り替えワンタッチ設備の導入」という2つの改善案を適用する例を想定している。
図22の左側の「Before」は、包含関係を考慮せず、改善案No.4の後に改善案No.1を適用した例を示す。
図22の右側の「After」は、包含関係を考慮し、改善案No.1を適用した後に改善案No.4を適用する例を示す。
また、図22では、段取り替えの改善の短縮時間の最大値(上限値)は、30分/(設備、日)であることを前提条件としている。段取り替えの作業時間を短縮しすぎると製品の品質担保が困難になるとの想定のもと、短縮時間の最大値(上限値)を設定している。
図10の改善案詳細情報テーブル764では、作業短縮割合が50%である。作業短縮割合:50%が、短縮時間の最大値(上限値):30分/(設備、日)に相当する。
図22の「Before」を適用した場合は、改善案No.4の「段取り替え作業の合理化」の実施により、15分/(設備、日)(=25%)の作業時間が短縮される。また、その後の改善案No.1の「段取り替えワンタッチ設備の導入」によって、さらに上限に達するまでの15分/(設備、日)(=25%)の作業時間が短縮されている。
また、図22の「After」を適用した場合は、改善案No.1の「段取り替えワンタッチ設備の導入」が先に実施される。改善案No.1の「段取り替えワンタッチ設備の導入」により、30分/(設備、日)(=50%)の作業時間が短縮される。このように、改善案No.1のみで短縮時間の最大値(上限値)に達することになる。つまり、改善案No.1を実施すれば、改善案No.4を実施する必要が無くなる。
このように、図22の「After」では、改善案No.4の「段取り替え作業の合理化」の実施に要する投資コストが不要になるため、必要経費が削減される。
また、図22の「After」を適用した場合は、改善案No.1の「段取り替えワンタッチ設備の導入」が先に実施される。改善案No.1の「段取り替えワンタッチ設備の導入」により、30分/(設備、日)(=50%)の作業時間が短縮される。このように、改善案No.1のみで短縮時間の最大値(上限値)に達することになる。つまり、改善案No.1を実施すれば、改善案No.4を実施する必要が無くなる。
このように、図22の「After」では、改善案No.4の「段取り替え作業の合理化」の実施に要する投資コストが不要になるため、必要経費が削減される。
関係性導出部743は、異常のような計算を行って、改善案の包含関係を判定する。
***動作の説明***
図23及び図24は、実施の形態2における改善実施支援装置7の動作の一例を示すフローチャートである。
以下では、図17及び図18と重複する処理の説明は割愛する。
図23及び図24は、実施の形態2における改善実施支援装置7の動作の一例を示すフローチャートである。
以下では、図17及び図18と重複する処理の説明は割愛する。
(ステップS204:改善案間の関係性の計算処理)
関係性導出部743は、改善案の包含関係や順序関係、つまり改善案間の関係性を年単位需給数量実績テーブル762と、工程別需給数量実績テーブル763と、改善案詳細情報テーブル764と、生産時間内訳テーブル765とを用いてアルゴリズムによって判定する。
そして、関係性導出部743は、図20の改善案テーブル761に包含関係、順序関係前、順序関係後の値を追加し、図11の改善案関係性テーブル768を生成する。
更に、関係性導出部743は、生成した改善案関係性テーブル768を改善案/コストデータベース732に格納する。
関係性導出部743は、改善案の包含関係や順序関係、つまり改善案間の関係性を年単位需給数量実績テーブル762と、工程別需給数量実績テーブル763と、改善案詳細情報テーブル764と、生産時間内訳テーブル765とを用いてアルゴリズムによって判定する。
そして、関係性導出部743は、図20の改善案テーブル761に包含関係、順序関係前、順序関係後の値を追加し、図11の改善案関係性テーブル768を生成する。
更に、関係性導出部743は、生成した改善案関係性テーブル768を改善案/コストデータベース732に格納する。
***実施の形態2の効果の説明***
以上のように、本実施の形態では、改善実施支援装置7が改善案間の関係性をアルゴリズムにより判定する。
このため、本実施の形態によれば、製造スタッフが改善案間の関係性を予め判断する必要がない。
以上のように、本実施の形態では、改善実施支援装置7が改善案間の関係性をアルゴリズムにより判定する。
このため、本実施の形態によれば、製造スタッフが改善案間の関係性を予め判断する必要がない。
実施の形態3.
以下、本実施の形態について、図面を参照しながら詳細に説明する。
特に、実施の形態2との差異について、重点的に説明する。
以下で説明していない事項は、実施の形態1及び実施の形態2と同様である。
以下、本実施の形態について、図面を参照しながら詳細に説明する。
特に、実施の形態2との差異について、重点的に説明する。
以下で説明していない事項は、実施の形態1及び実施の形態2と同様である。
実施の形態1及び実施の形態2では、ロードマップグラフ775及び合計累積コストグラフ776を出力することで、製造スタッフの改善の意思決定支援をすることとしている。
これに対して、実施の形態3では、ロードマップグラフ775及び合計累積コストグラフ776の出力に加えて、製造スタッフに対して改善効果の修正値を提示する。
これに対して、実施の形態3では、ロードマップグラフ775及び合計累積コストグラフ776の出力に加えて、製造スタッフに対して改善効果の修正値を提示する。
***構成の説明***
図25は、本実施の形態に係る改善実施支援装置7の構成例を示す。
図25は、本実施の形態に係る改善実施支援装置7の構成例を示す。
入力部72は、図25に示すように、生産実績データ測定部721と、設備コスト取得部722と、SWコスト取得部723と、材料/労務コスト取得部724と、改善案取得部725と、需要データ取得部727と、計画取得部728とを備える。
図19と比較して、図25の入力部72では、計画取得部728が追加されている。
計画取得部728以外の要素は、図19に示したものと同様である。このため、これらの詳細な説明は省略する。
図19と比較して、図25の入力部72では、計画取得部728が追加されている。
計画取得部728以外の要素は、図19に示したものと同様である。このため、これらの詳細な説明は省略する。
計画取得部728は、設備稼働計画を設備稼働計画導出装置6より入力するインタフェースである。
メモリ73は、図25に示すように、資源消費量/生産数量データベース731と、改善案/コストデータベース732と、需要予測データベース733と、計画データベース734を記憶している。
図19と比較して、図25のメモリ73では、計画データベース734が追加されている。
計画データベース734以外の要素は、図19に示したものと同様である。このため、これらの詳細な説明は省略する。
図19と比較して、図25のメモリ73では、計画データベース734が追加されている。
計画データベース734以外の要素は、図19に示したものと同様である。このため、これらの詳細な説明は省略する。
計画データベース734は、設備稼働計画を生成及び修正するのに必要な情報を格納しているデータベースである。
計画データベース734は、詳細コスト換算レートテーブル777と、実施の形態3に係る生産計画テーブル778と、単位資源消費量テーブル779と、工程別生産能力テーブル780と、改善前の初期設備稼働計画781と、改善後設備稼働計画782と、改善後設備稼働計画783と、改善後設備稼働計画784と、改善前コストテーブル785と、改善後コストテーブル786とを格納する。
計画データベース734は、詳細コスト換算レートテーブル777と、実施の形態3に係る生産計画テーブル778と、単位資源消費量テーブル779と、工程別生産能力テーブル780と、改善前の初期設備稼働計画781と、改善後設備稼働計画782と、改善後設備稼働計画783と、改善後設備稼働計画784と、改善前コストテーブル785と、改善後コストテーブル786とを格納する。
図26は、詳細コスト換算レートテーブル777の具体例を示している。
詳細コスト換算レートテーブル777は、資源種別と、コスト換算レートと、単位とを含む。
詳細コスト換算レートテーブル777におけるコスト換算レートは、コスト換算レートテーブル770(図8)のコスト換算レートをより詳細化したものである。コスト換算レートテーブル770のコスト換算レートは、コスト換算レートテーブル777のコスト換算レートの平均値となっている。
詳細コスト換算レートテーブル777は、資源種別と、コスト換算レートと、単位とを含む。
詳細コスト換算レートテーブル777におけるコスト換算レートは、コスト換算レートテーブル770(図8)のコスト換算レートをより詳細化したものである。コスト換算レートテーブル770のコスト換算レートは、コスト換算レートテーブル777のコスト換算レートの平均値となっている。
図27は、設備稼働計画における、生産計画テーブル778の具体例を示している。
生産計画テーブル778は、製品名と、開始(日付)と、終了(日付)と、設備名と、生産数量とを含む。
本実施の形態では、改善前は、加工装置A⇒組立装置A⇒塗装装置Aの設備稼働計画が生成される。一方、改善後は、加工装置A’⇒組立装置A⇒塗装装置Aの設備稼働計画が生成する。また、納期は、2023年9月28日とする。
図27の例では、加工装置Aが400個の製品を加工する。そして、組立装置Aが、2つの製品を組み合わせて、1つの製品に組み立てる。つまり、組立装置Aは、200個の製品を生産する。最終的に、塗装装置Aが200個の製品を塗装する。
生産計画テーブル778は、製品名と、開始(日付)と、終了(日付)と、設備名と、生産数量とを含む。
本実施の形態では、改善前は、加工装置A⇒組立装置A⇒塗装装置Aの設備稼働計画が生成される。一方、改善後は、加工装置A’⇒組立装置A⇒塗装装置Aの設備稼働計画が生成する。また、納期は、2023年9月28日とする。
図27の例では、加工装置Aが400個の製品を加工する。そして、組立装置Aが、2つの製品を組み合わせて、1つの製品に組み立てる。つまり、組立装置Aは、200個の製品を生産する。最終的に、塗装装置Aが200個の製品を塗装する。
図28は、単位資源消費量テーブル779の具体例を示している。
単位資源消費量テーブル779は、単位生産量あたりの資源消費量を示す。
単位資源消費量テーブル779は、資源種別と、資源消費量換算レートと、単位とを含む。
図28では、説明の簡明化のために、資源種別として電力のみを示す。
単位資源消費量テーブル779は、単位生産量あたりの資源消費量を示す。
単位資源消費量テーブル779は、資源種別と、資源消費量換算レートと、単位とを含む。
図28では、説明の簡明化のために、資源種別として電力のみを示す。
図29は、工程別生産能力テーブル780の具体例を示している。
工程別生産能力テーブル780は、工程名と、装置名と、生産能力とを含む。
工程別生産能力テーブル780は、工程名と、装置名と、生産能力とを含む。
図30は、改善前の初期設備稼働計画781の具体例を示している。
改善前の初期設備稼働計画781は、各種改善案を適用する前の初期設備稼働計画を表す。
図30の改善前の初期設備稼働計画781は、生産開始時刻を8時30分で固定とした場合の設備稼働計画である。また、図30の改善前の初期設備稼働計画781は、2023年9月28日と同年9月29日の二日間の設備稼働計画を表している。横軸1グリッドは1時間を表している。
更に、図30の改善前の初期設備稼働計画781は、加工装置Aと、組立装置Aと、塗装装置Aに関する設備稼働計画である。
図30において、網掛けされている時間帯が、各装置が稼働する時間帯である。つまり、加工装置Aは9月28日の8時30分から13時30分の間稼動する。組立装置Aは9月28日の13時30分から9月29日の1時30分の間稼動する。また、塗装装置Aは、9月29日の9時30分から9月29日の23時30分の間稼動する。
改善前の初期設備稼働計画781は、各種改善案を適用する前の初期設備稼働計画を表す。
図30の改善前の初期設備稼働計画781は、生産開始時刻を8時30分で固定とした場合の設備稼働計画である。また、図30の改善前の初期設備稼働計画781は、2023年9月28日と同年9月29日の二日間の設備稼働計画を表している。横軸1グリッドは1時間を表している。
更に、図30の改善前の初期設備稼働計画781は、加工装置Aと、組立装置Aと、塗装装置Aに関する設備稼働計画である。
図30において、網掛けされている時間帯が、各装置が稼働する時間帯である。つまり、加工装置Aは9月28日の8時30分から13時30分の間稼動する。組立装置Aは9月28日の13時30分から9月29日の1時30分の間稼動する。また、塗装装置Aは、9月29日の9時30分から9月29日の23時30分の間稼動する。
図31は、改善後設備稼働計画782の具体例を示している。
改善後設備稼働計画782は、各種改善案を適用した後の設備稼働計画を表している。
図31の改善後設備稼働計画782は、生産開始時刻を8時30分で固定とした場合の設備稼働計画である。
また、図31の改善後設備稼働計画782は、加工装置A’と、組立装置Aと、塗装装置Aに関する設備稼働計画である。
更に、図31の改善後設備稼働計画782は、改善案No.1から改善案No.6まで、改善案間の関係性が考慮されている。より具体的には、図31の改善後設備稼働計画782は、改善案No.1、3、5、6をそれぞれ適用した場合の設備稼働計画を提示している。
それ以外の要素は、図30の改善前の初期設備稼働計画781と同様である。
改善後設備稼働計画782は、各種改善案を適用した後の設備稼働計画を表している。
図31の改善後設備稼働計画782は、生産開始時刻を8時30分で固定とした場合の設備稼働計画である。
また、図31の改善後設備稼働計画782は、加工装置A’と、組立装置Aと、塗装装置Aに関する設備稼働計画である。
更に、図31の改善後設備稼働計画782は、改善案No.1から改善案No.6まで、改善案間の関係性が考慮されている。より具体的には、図31の改善後設備稼働計画782は、改善案No.1、3、5、6をそれぞれ適用した場合の設備稼働計画を提示している。
それ以外の要素は、図30の改善前の初期設備稼働計画781と同様である。
図32は、改善後設備稼働計画783の具体例を示している。
改善後設備稼働計画783は、各種改善案を適用した後の設備稼働計画を表している。
図32の改善後設備稼働計画783は、生産開始時刻を6時00分で固定とした場合の設備稼働計画である。
それ以外の要素は、図31の改善後設備稼働計画782と同様である。
改善後設備稼働計画783は、各種改善案を適用した後の設備稼働計画を表している。
図32の改善後設備稼働計画783は、生産開始時刻を6時00分で固定とした場合の設備稼働計画である。
それ以外の要素は、図31の改善後設備稼働計画782と同様である。
図33は、改善後設備稼働計画784の具体例を示している。
改善後設備稼働計画784は、各種改善案を適用した後の設備稼働計画を表している。
図33の改善後設備稼働計画783は、生産開始時刻を0時00分で固定し、組立装置Aと塗装装置Aとを連続稼働させた場合の設備稼働計画である。
それ以外の要素は、図31の改善後設備稼働計画782と同様である。
改善後設備稼働計画784は、各種改善案を適用した後の設備稼働計画を表している。
図33の改善後設備稼働計画783は、生産開始時刻を0時00分で固定し、組立装置Aと塗装装置Aとを連続稼働させた場合の設備稼働計画である。
それ以外の要素は、図31の改善後設備稼働計画782と同様である。
図34は、改善前コストテーブル785の具体例を示している。
改善前コストテーブル785は、改善前の初期設備稼働計画781(図30)における、労務コスト及び資源消費量コスト等を表している。
改善前コストテーブル785は、通し番号(#)と、労務コストと、資源消費コストと、合計コストとを含む。
改善前コストテーブル785は、改善前の初期設備稼働計画781(図30)における、労務コスト及び資源消費量コスト等を表している。
改善前コストテーブル785は、通し番号(#)と、労務コストと、資源消費コストと、合計コストとを含む。
図35は、改善後コストテーブル786の具体例を示している。
改善後コストテーブル786は、改善後設備稼働計画782(図31)と、改善後設備稼働計画783(図32)と、改善後設備稼働計画784(図33)とにおける、労務コスト及び資源消費量コスト等を表している。
改善後コストテーブル786は、通し番号(#)と、改善後労務コストと、改善後資源消費コストと、改善後合計コストと、削減割合とを含む。
改善後コストテーブル786は、改善後設備稼働計画782(図31)と、改善後設備稼働計画783(図32)と、改善後設備稼働計画784(図33)とにおける、労務コスト及び資源消費量コスト等を表している。
改善後コストテーブル786は、通し番号(#)と、改善後労務コストと、改善後資源消費コストと、改善後合計コストと、削減割合とを含む。
計算部74は、図25に示すように、投資コスト計算部741と、改善案テーブル生成部742と、関係性導出部743と、評価部744と、情報生成部745と、計画適正化部746と、改善効果修正部747とを備える。
図19と比較すると、図25では、計画適正化部746と、改善効果修正部747とが追加されている。
これら以外の要素は、図19に示したものと同様である。このため、これら以外の要素の詳細な説明は省略する。
以下では、計画適正化部746と、改善効果修正部747とを説明する。
図19と比較すると、図25では、計画適正化部746と、改善効果修正部747とが追加されている。
これら以外の要素は、図19に示したものと同様である。このため、これら以外の要素の詳細な説明は省略する。
以下では、計画適正化部746と、改善効果修正部747とを説明する。
計画適正化部746は、出力部75の改善案選択部753から、ユーザが選択した改善案(以下、選択改善案という)を通知される。そして、計画適正化部746は、改善案選択部753から通知された選択改善案に基づき、労務コストと資源消費コストの合計コストが最小になるように設備稼働計画を適正化する。
本実施の形態では、計画適正化部746は、30分刻みの1日48通りの生産開始時刻を設定する。また、計画適正化部746は、後工程の開始時刻の適用可能組合せの総当たりの判定を行う。本実施の形態では、このようにして、計画適正化部746は、設備稼働計画を適正化することとする。なお、このような組み合わせは人手でできるものではない。
本実施の形態では、計画適正化部746は、30分刻みの1日48通りの生産開始時刻を設定する。また、計画適正化部746は、後工程の開始時刻の適用可能組合せの総当たりの判定を行う。本実施の形態では、このようにして、計画適正化部746は、設備稼働計画を適正化することとする。なお、このような組み合わせは人手でできるものではない。
計画適正化部746は、生産する製品の順序など、パラメータを増やして最適化計算をしてもよい。
改善後コストテーブル786(図35)では、通し番号#2の削減割合が最大である。通し番号#2の設備稼働計画は、図32の改善後設備稼働計画783である。このため、本実施の形態では、改善後設備稼働計画783が最適事例である。
改善後コストテーブル786(図35)では、通し番号#2の削減割合が最大である。通し番号#2の設備稼働計画は、図32の改善後設備稼働計画783である。このため、本実施の形態では、改善後設備稼働計画783が最適事例である。
また、本実施の形態では、組合せ数が少ないので、計画適正化部746は、総当たりの判定を行うこととしたが、他の方法で設備稼働計画を適正化してもよい。例えば、計画適正化部746は、遺伝的アルゴリズム又はラグランジュ緩和法による解探索手法を用いて、設備稼働計画を適正化してもよい。
このようにすることによって、計画適正化部746は、有限時間で合計コストが最小となるような設備稼働計画情報を生成することができる。
このようにすることによって、計画適正化部746は、有限時間で合計コストが最小となるような設備稼働計画情報を生成することができる。
改善効果修正部747は、選択改善案の改善効果を、評価部744により選択改善案について計算された改善効果から、修正する。より具体的には期には、評価部744は、情報生成部745により改善効果として出力された値を、計画適正化部746により適正化された設備稼働計画に基づき時間分解能を細かくする。このようにすることで、改善効果修正部747は、実際の製造現場の運用に即した、より精度の高い改善効果を提示することできる。
例えば、年間スケジュールがある場合は、改善効果修正部747は、改善後コストテーブル786(図35)を用いて、改善効果を修正する。また、年間スケジュールがない場合は、改善効果修正部747は、設備稼働計画が生成された期間をもとに、設備稼働計画を年データに換算することによって、改善効果を修正する。
本実施の形態では、改善効果修正部747は、最終的に改善効果を修正している。改善効果修正部747は、改善効果を修正せずに、ロードマップとして出力した改善効果とともに、設備稼働計画をもとにした改善効果を提示するのみでもよい。
例えば、年間スケジュールがある場合は、改善効果修正部747は、改善後コストテーブル786(図35)を用いて、改善効果を修正する。また、年間スケジュールがない場合は、改善効果修正部747は、設備稼働計画が生成された期間をもとに、設備稼働計画を年データに換算することによって、改善効果を修正する。
本実施の形態では、改善効果修正部747は、最終的に改善効果を修正している。改善効果修正部747は、改善効果を修正せずに、ロードマップとして出力した改善効果とともに、設備稼働計画をもとにした改善効果を提示するのみでもよい。
出力部75は、図25に示すように、優先順位提示部751と、可視化情報提示部752と、改善案選択部753と、計画提示部754と、修正効果提示部755とを備える。
図19と比較して、図25では、改善案選択部753と、計画提示部754と、修正効果提示部755とが追加されている。
これら以外の要素は、図19に示したものと同様である。このため、これら以外の要素の詳細な説明は省略する。
以下では、改善案選択部753と、計画提示部754と、修正効果提示部755とを説明する。
なお、本実施の形態では、計画提示部754と修正効果提示部755も提示部として機能する。
図19と比較して、図25では、改善案選択部753と、計画提示部754と、修正効果提示部755とが追加されている。
これら以外の要素は、図19に示したものと同様である。このため、これら以外の要素の詳細な説明は省略する。
以下では、改善案選択部753と、計画提示部754と、修正効果提示部755とを説明する。
なお、本実施の形態では、計画提示部754と修正効果提示部755も提示部として機能する。
改善案選択部753は、ユーザの選択改善案を判定するインタフェースである。より具体的には、改善案選択部753は、可視化情報提示部752により提示されたロードマップグラフ775の複合改善案に含まれる複数の改善案の中からユーザの選択改善案を判定する。
そして、改善案選択部753は、選択改善案を計画適正化部746に通知する。
そして、改善案選択部753は、選択改善案を計画適正化部746に通知する。
計画提示部754は、計画適正化部746により適正化された設備稼働計画を表示装置8に出力する。
修正効果提示部755は、改善効果修正部747により修正された改善効果を表示装置8に出力する。
***動作の説明***
図36は、実施の形態3における改善実施支援装置7の動作の一例を示すフローチャートである。
図36を用いて、改善実施支援装置7の動作を説明する。
以下では、図23と重複する処理の説明は割愛する。
図36は、実施の形態3における改善実施支援装置7の動作の一例を示すフローチャートである。
図36を用いて、改善実施支援装置7の動作を説明する。
以下では、図23と重複する処理の説明は割愛する。
(ステップS211:ユーザが改善案を選択したかどうかの判定)
改善案選択部753は、可視化情報提示部752により提示されたロードマップグラフ775の複合改善案に含まれる複数の改善案の中からユーザが改善案を選択したか否かを判定する。
ユーザが改善案を選択した場合は、改善案選択部753は、ユーザが選択した改善案である選択改善案を計画適正化部746に通知する。そして、処理がS211に進む。
ユーザが改善案を選択しない場合は、処理がS214に進む。
改善案選択部753は、可視化情報提示部752により提示されたロードマップグラフ775の複合改善案に含まれる複数の改善案の中からユーザが改善案を選択したか否かを判定する。
ユーザが改善案を選択した場合は、改善案選択部753は、ユーザが選択した改善案である選択改善案を計画適正化部746に通知する。そして、処理がS211に進む。
ユーザが改善案を選択しない場合は、処理がS214に進む。
(ステップS212:設備稼働計画への改善案の自動適用処理)
計画適正化部746は、改善案選択部753から通知された選択改善案をもとに、設備稼働計画での労務コストと資源消費コストとの合計コストが最小になるように、設備稼働計画を適正化する。
また、計画適正化部746は、計画適正化部746により適正化された設備稼働計画を、計画提示部754を介して、表示装置8に出力する。
計画適正化部746は、改善案選択部753から通知された選択改善案をもとに、設備稼働計画での労務コストと資源消費コストとの合計コストが最小になるように、設備稼働計画を適正化する。
また、計画適正化部746は、計画適正化部746により適正化された設備稼働計画を、計画提示部754を介して、表示装置8に出力する。
(ステップS213:改善効果の修正値の算出)
改善効果修正部747は、評価部744は、情報生成部745により改善効果として出力された値の修正値を、計画適正化部746により適正化された設備稼働計画に基づき算出する。
更に、評価部744は、改善効果の修正値が示される改善後コストテーブル786(図35)を生成する。
そして、評価部744は、改善効果の修正値が示される改善後コストテーブル786を、修正効果提示部755を介して、表示装置8に提示する。
改善効果修正部747は、評価部744は、情報生成部745により改善効果として出力された値の修正値を、計画適正化部746により適正化された設備稼働計画に基づき算出する。
更に、評価部744は、改善効果の修正値が示される改善後コストテーブル786(図35)を生成する。
そして、評価部744は、改善効果の修正値が示される改善後コストテーブル786を、修正効果提示部755を介して、表示装置8に提示する。
***実施の形態3の効果の説明***
以上のように、本実施の形態では、改善実施支援装置7が、ユーザが選択した改善案に基づきコストが最小になるように設備稼働計画を適正化する。
このため、本実施の形態によれば、製造スタッフは事前に算出した複数の改善案を適用した場合における改善額を補正して見積もることができ、現実的な改善額を容易に確認することができる。
以上のように、本実施の形態では、改善実施支援装置7が、ユーザが選択した改善案に基づきコストが最小になるように設備稼働計画を適正化する。
このため、本実施の形態によれば、製造スタッフは事前に算出した複数の改善案を適用した場合における改善額を補正して見積もることができ、現実的な改善額を容易に確認することができる。
以上、実施の形態1~3を説明したが、これらの実施の形態のうち、2つ以上を組み合わせて実施しても構わない。
あるいは、これらの実施の形態のうち、1つを部分的に実施しても構わない。
あるいは、これらの実施の形態のうち、2つ以上を部分的に組み合わせて実施しても構わない。
また、これらの実施の形態に記載された構成及び手順を必要に応じて変更してもよい。
あるいは、これらの実施の形態のうち、1つを部分的に実施しても構わない。
あるいは、これらの実施の形態のうち、2つ以上を部分的に組み合わせて実施しても構わない。
また、これらの実施の形態に記載された構成及び手順を必要に応じて変更してもよい。
***ハードウェア構成の補足説明***
最後に、改善実施支援装置7のハードウェア構成の補足説明を行う。
制御部71と入力部72と計算部74と出力部75を実現するプロセッサは、プロセッシングを行うIC(Integrated Circuit)である。
プロセッサは、CPU(Central Processing Unit)、DSP(Digital Signal Processor)等である。
また、メモリ73は、RAM(Random Access Memory)である。
また、図示していない補助記憶装置は、ROM(Read Only Memory)、フラッシュメモリ、HDD(Hard Disk Drive)等である。
最後に、改善実施支援装置7のハードウェア構成の補足説明を行う。
制御部71と入力部72と計算部74と出力部75を実現するプロセッサは、プロセッシングを行うIC(Integrated Circuit)である。
プロセッサは、CPU(Central Processing Unit)、DSP(Digital Signal Processor)等である。
また、メモリ73は、RAM(Random Access Memory)である。
また、図示していない補助記憶装置は、ROM(Read Only Memory)、フラッシュメモリ、HDD(Hard Disk Drive)等である。
また、補助記憶装置には、OS(Operating System)も記憶されている。
そして、OSの少なくとも一部がプロセッサにより実行される。
プロセッサはOSの少なくとも一部を実行しながら、制御部71と入力部72と計算部74と出力部75の機能を実現するプログラムを実行する。
プロセッサがOSを実行することで、タスク管理、メモリ管理、ファイル管理、通信制御等が行われる。
また、制御部71と入力部72と計算部74と出力部75の処理の結果を示す情報、データ、信号値及び変数値の少なくともいずれかが、メモリ73、補助記憶装置、プロセッサ内のレジスタ及びキャッシュメモリの少なくともいずれかに記憶される。
また、制御部71と入力部72と計算部74と出力部75の機能を実現するプログラムは、磁気ディスク、フレキシブルディスク、光ディスク、コンパクトディスク、ブルーレイ(登録商標)ディスク、DVD等の可搬記録媒体に格納されていてもよい。そして、制御部71と入力部72と計算部74と出力部75の機能を実現するプログラムが格納された可搬記録媒体を流通させてもよい。
そして、OSの少なくとも一部がプロセッサにより実行される。
プロセッサはOSの少なくとも一部を実行しながら、制御部71と入力部72と計算部74と出力部75の機能を実現するプログラムを実行する。
プロセッサがOSを実行することで、タスク管理、メモリ管理、ファイル管理、通信制御等が行われる。
また、制御部71と入力部72と計算部74と出力部75の処理の結果を示す情報、データ、信号値及び変数値の少なくともいずれかが、メモリ73、補助記憶装置、プロセッサ内のレジスタ及びキャッシュメモリの少なくともいずれかに記憶される。
また、制御部71と入力部72と計算部74と出力部75の機能を実現するプログラムは、磁気ディスク、フレキシブルディスク、光ディスク、コンパクトディスク、ブルーレイ(登録商標)ディスク、DVD等の可搬記録媒体に格納されていてもよい。そして、制御部71と入力部72と計算部74と出力部75の機能を実現するプログラムが格納された可搬記録媒体を流通させてもよい。
また、制御部71と入力部72と計算部74と出力部75の少なくともいずれかの「部」を、「回路」又は「工程」又は「手順」又は「処理」又は「サーキットリー」に読み替えてもよい。
また、改善実施支援装置7は、処理回路により実現されてもよい。処理回路は、例えば、ロジックIC(Integrated Circuit)、GA(Gate Array)、ASIC(Application Specific Integrated Circuit)、FPGA(Field-Programmable Gate Array)である。
この場合は、制御部71と入力部72と計算部74と出力部75は、それぞれ処理回路の一部として実現される。
なお、本明細書では、プロセッサと処理回路との上位概念を、「プロセッシングサーキットリー」という。
つまり、プロセッサと処理回路とは、それぞれ「プロセッシングサーキットリー」の具体例である。
また、改善実施支援装置7は、処理回路により実現されてもよい。処理回路は、例えば、ロジックIC(Integrated Circuit)、GA(Gate Array)、ASIC(Application Specific Integrated Circuit)、FPGA(Field-Programmable Gate Array)である。
この場合は、制御部71と入力部72と計算部74と出力部75は、それぞれ処理回路の一部として実現される。
なお、本明細書では、プロセッサと処理回路との上位概念を、「プロセッシングサーキットリー」という。
つまり、プロセッサと処理回路とは、それぞれ「プロセッシングサーキットリー」の具体例である。
1 生産設備、2 生産制御装置、3 コスト入力装置、4 改善案入力装置、5 需要予測装置、6 設備稼働計画導出装置、7 改善実施支援装置、8 表示装置、71 制御部、72 入力部、73 メモリ、74 計算部、75 出力装置、721 生産実績データ測定部、722 設備コスト取得部、723 SWコスト取得部、724 材料/労務コスト取得部、725 改善案取得部、726 改善関係性取得部、727 需要データ取得部、728 計画取得部、731 資源消費量/生産数量データベース、732 改善案/コストデータベース、733 需要予測データベース、734 計画データベース、741 投資コスト計算部、742 改善案テーブル生成部、743 関係性導出部、744 評価部、745 情報生成部、746 計画適正化部、747 改善効果修正部、751 優先順位提示部、752 可視化情報提示部、753 改善案選択部、754 計画提示部、755 修正効果提示部、761 改善案テーブル、762 年単位需給数量実績テーブル、763 工程別需給数量実績テーブル、764 改善案詳細情報テーブル、765 生産時間内訳テーブル、766 順序関係判定グラフ、767 包含関係判定グラフ、768 改善案関係性テーブル、769 資源消費量テーブル、770 コスト換算レートテーブル、資源消費コストテーブル、771 資源消費コストテーブル、772 複合改善案別効果テーブル、773 優先度評価テーブル、774 年単位需要予測テーブル、775 ロードマップグラフ、776 合計累積コストグラフ、777 詳細コスト換算レートテーブル、778 生産計画テーブル、779 単位資源消費量テーブル、780 工程別生産能力テーブル、781 初期設備稼働計画、782 改善後設備稼働計画、783 改善後設備稼働計画、784 改善後設備稼働計画、785 改善前コストテーブル、786 改善前コストテーブル。
Claims (16)
- 生産活動を改善するための複数の改善案の各々を実施するのに要する設備コストと前記設備コスト以外のコストとを投資コストとして計算する投資コスト計算部と、
前記複数の改善案の各々の実施による前記生産活動への改善効果を計算する改善効果計算部と、
改善案ごとの前記投資コストと前記改善効果とを用いて、前記複数の改善案に優先順位を設定する優先順位設定部と、
前記優先順位設定部により設定された、前記複数の改善案の優先順位を提示する提示部とを有する情報処理装置。 - 前記投資コスト及び前記改善効果は数値であり、
前記優先順位設定部は、
改善案ごとに、前記投資コストと前記改善効果とを用いて優先度評価値を計算し、
前記優先度評価値が大きい順に、前記複数の改善案に優先順位を設定する請求項1に記載の情報処理装置。 - 前記優先順位設定部は、
改善案ごとに、前記改善効果の二乗値を前記投資コストで除算して前記優先度評価値を計算する請求項2に記載の情報処理装置。 - 前記情報処理装置は、更に、
改善案ごとに、前記投資コストと前記改善効果とを用いて、前記投資コストを回収するのに要する期間である回収期間を計算する回収期間計算部を有し、
前記提示部は、
改善案ごとに、前記回収期間を提示する請求項1に記載の情報処理装置。 - 前記複数の改善案には、2以上の改善案で構成される複合改善案が含まれており、
前記改善効果計算部は、
前記複合改善案を構成する2以上の改善案間の関係性を用いて、前記複合改善案の前記改善効果を計算する請求項1に記載の情報処理装置。 - 前記改善効果計算部は、
前記複合改善案を構成する前記2以上の改善案間の関係性として、前記2以上の改善案間の包含関係及び前記2以上の改善案間の順序関係の少なくともいずれかを用いる請求項5に記載の情報処理装置。 - 前記情報処理装置は、更に、
前記複合改善案を構成する前記2以上の改善案間の関係性を導出する関係性導出部を有し、
前記改善効果計算部は、
前記関係性導出部により導出された前記複合改善案を構成する前記2以上の改善案間の関係性を用いて、前記複合改善案の前記改善効果を計算する請求項5に記載の情報処理装置。 - 前記関係性導出部は、
前記複合改善案を構成する前記2以上の改善案間の関係性として、前記2以上の改善案間の包含関係及び前記2以上の改善案間の順序関係の少なくともいずれかを導出する請求項7に記載の情報処理装置。 - 前記情報処理装置は、更に、
前記複数の改善案の任意の改善案について、前記投資コストの計上スケジュール及び前記改善効果の実現スケジュールを可視化する可視化情報を生成する情報生成部を有する請求項1に記載の情報処理装置。 - 前記投資コスト及び前記改善効果は数値であり、
前記情報処理装置は、更に、
前記複数の改善案の任意の改善案について、前記投資コスト及び前記改善効果の合算の累積推移を可視化する可視化情報を生成する情報生成部を有する請求項1に記載の情報処理装置。 - 前記複数の改善案の少なくともいずれかの改善案が更新された場合に、
前記投資コスト計算部は、
更新された改善案である更新改善案の前記投資コストを計算し、
前記改善効果計算部は、
前記更新改善案の前記改善効果を計算する請求項1に記載の情報処理装置。 - 前記情報処理装置は、更に、
前記生産活動に用いられる設備の稼働計画である設備稼働計画を、前記複数の改善案から選択された改善案である選択改善案を用いて適正化する計画適正化部を有する請求項1に記載の情報処理装置。 - 前記投資コストに含まれる前記設備コスト以外のコストには労務コストと資源消費コストとが含まれており、
前記計画適正化部は、
前記設備稼働計画での前記労務コストと前記資源消費コストとの合計が最小になるように前記設備稼働計画を適正化する請求項12に記載の情報処理装置。 - 前記情報処理装置は、更に、
前記計画適正化部により適正化された後の前記設備稼働計画を用いて、前記選択改善案の改善効果を、前記改善効果計算部により前記選択改善案について計算された改善効果から修正する改善効果修正部を有する請求項13に記載の情報処理装置。 - コンピュータが、生産活動を改善するための複数の改善案の各々を実施するのに要する設備コストと前記設備コスト以外のコストとを投資コストとして計算し、
前記コンピュータが、前記複数の改善案の各々の実施による前記生産活動への改善効果を計算し、
前記コンピュータが、改善案ごとの前記投資コストと前記改善効果とを用いて、前記複数の改善案に優先順位を設定し、
前記前記コンピュータが、前記複数の改善案の優先順位を提示する情報処理方法。 - 生産活動を改善するための複数の改善案の各々を実施するのに要する設備コストと前記設備コスト以外のコストとを投資コストとして計算する投資コスト計算処理と、
前記複数の改善案の各々の実施による前記生産活動への改善効果を計算する改善効果計算処理と、
改善案ごとの前記投資コストと前記改善効果とを用いて、前記複数の改善案に優先順位を設定する優先順位設定処理と、
前記優先順位設定処理により設定された、前記複数の改善案の優先順位を提示する提示処理とをコンピュータに実行させる情報処理プログラム。
Priority Applications (2)
| Application Number | Priority Date | Filing Date | Title |
|---|---|---|---|
| PCT/JP2023/021302 WO2024252604A1 (ja) | 2023-06-08 | 2023-06-08 | 情報処理装置、情報処理方法及び情報処理プログラム |
| TW113102555A TW202449674A (zh) | 2023-06-08 | 2024-01-23 | 資訊處理裝置、資訊處理方法、資訊處理程式產品 |
Applications Claiming Priority (1)
| Application Number | Priority Date | Filing Date | Title |
|---|---|---|---|
| PCT/JP2023/021302 WO2024252604A1 (ja) | 2023-06-08 | 2023-06-08 | 情報処理装置、情報処理方法及び情報処理プログラム |
Publications (1)
| Publication Number | Publication Date |
|---|---|
| WO2024252604A1 true WO2024252604A1 (ja) | 2024-12-12 |
Family
ID=93795630
Family Applications (1)
| Application Number | Title | Priority Date | Filing Date |
|---|---|---|---|
| PCT/JP2023/021302 Ceased WO2024252604A1 (ja) | 2023-06-08 | 2023-06-08 | 情報処理装置、情報処理方法及び情報処理プログラム |
Country Status (2)
| Country | Link |
|---|---|
| TW (1) | TW202449674A (ja) |
| WO (1) | WO2024252604A1 (ja) |
Citations (3)
| Publication number | Priority date | Publication date | Assignee | Title |
|---|---|---|---|---|
| JP2006202255A (ja) * | 2004-12-24 | 2006-08-03 | Omron Corp | 工程改善支援システム |
| JP2019028586A (ja) * | 2017-07-27 | 2019-02-21 | 株式会社日立パワーソリューションズ | 生産シミュレーション装置 |
| JP2019145166A (ja) * | 2019-05-13 | 2019-08-29 | 株式会社東芝 | 投資支援装置、投資支援方法及びコンピュータプログラム |
-
2023
- 2023-06-08 WO PCT/JP2023/021302 patent/WO2024252604A1/ja not_active Ceased
-
2024
- 2024-01-23 TW TW113102555A patent/TW202449674A/zh unknown
Patent Citations (3)
| Publication number | Priority date | Publication date | Assignee | Title |
|---|---|---|---|---|
| JP2006202255A (ja) * | 2004-12-24 | 2006-08-03 | Omron Corp | 工程改善支援システム |
| JP2019028586A (ja) * | 2017-07-27 | 2019-02-21 | 株式会社日立パワーソリューションズ | 生産シミュレーション装置 |
| JP2019145166A (ja) * | 2019-05-13 | 2019-08-29 | 株式会社東芝 | 投資支援装置、投資支援方法及びコンピュータプログラム |
Also Published As
| Publication number | Publication date |
|---|---|
| TW202449674A (zh) | 2024-12-16 |
Similar Documents
| Publication | Publication Date | Title |
|---|---|---|
| JP4369189B2 (ja) | スケジューリングシステムおよびスケジューリングをコンピュータに実行させるためのプログラム | |
| JP6975073B2 (ja) | 予測システム、予測方法、およびプログラム | |
| JP5388713B2 (ja) | 電力流通設備保守支援装置、電力流通設備保守支援方法および電力流通設備保守支援プログラム | |
| JP2007279876A (ja) | 生産計画方法及び生産計画システム | |
| JP2010073121A (ja) | プラント機器の補修工事スケジュール作成方法、および、補修工事スケジュール作成システム | |
| JP2022145237A (ja) | 設備対策時期判定システム及び方法 | |
| JP5398271B2 (ja) | 受変電設備システムの設計評価支援システム及びその設計評価支援方法 | |
| JP7359193B2 (ja) | エネルギーシステム運用計画作成装置 | |
| JP6711074B2 (ja) | 発電計画の自動生成プログラム、発電計画の自動生成方法および発電計画生成装置 | |
| JP2018206000A (ja) | 生産計画システム、生産計画方法及び人員能力計算方法 | |
| JP2007065954A (ja) | 電力市場分析支援システムと方法、プログラム | |
| JP2003346070A (ja) | 需要量予測方法及び需要量予測システム | |
| JP2009289056A (ja) | 人員配置計画支援装置 | |
| JP7828827B2 (ja) | 社会指標定量化方法および装置 | |
| JP3910948B2 (ja) | 電源計画についての情報処理方法及びコンピュータ・システム | |
| JP6695673B2 (ja) | 計画生成装置および計画生成方法 | |
| WO2024252604A1 (ja) | 情報処理装置、情報処理方法及び情報処理プログラム | |
| KR20030047279A (ko) | 실적데이타를 이용한 건설프로젝트용 사업비 견적 방법,이를 수행하는 자동견적시스템 및 기록매체 | |
| JP2008021170A (ja) | 発電所の価値評価システムおよびそのプログラム | |
| JP2017168052A (ja) | 予測支援システム、予測支援方法及びプログラム | |
| JP4902616B2 (ja) | ロスコスト最適化システム、ロスコスト最適化方法、およびロスコスト最適化プログラム | |
| JP2007242063A (ja) | 経営改革のための対策案立案支援方法およびそのためのシステム | |
| JP2005242816A (ja) | コンピュータによる受注交渉支援方法 | |
| JP4400324B2 (ja) | 電力取引決定装置,電力取引方法回答システム,プログラム及び記憶媒体 | |
| JP7412673B2 (ja) | 水力発電所の工事計画の最適化支援サーバ、水力発電所の工事計画の最適化支援システムおよび水力発電所の工事計画の最適化支援方法 |
Legal Events
| Date | Code | Title | Description |
|---|---|---|---|
| 121 | Ep: the epo has been informed by wipo that ep was designated in this application |
Ref document number: 23940705 Country of ref document: EP Kind code of ref document: A1 |
|
| NENP | Non-entry into the national phase |
Ref country code: DE |