WO2024204729A1 - 自動分析方法、光検量線の作成方法及び自動分析装置 - Google Patents
自動分析方法、光検量線の作成方法及び自動分析装置 Download PDFInfo
- Publication number
- WO2024204729A1 WO2024204729A1 PCT/JP2024/013078 JP2024013078W WO2024204729A1 WO 2024204729 A1 WO2024204729 A1 WO 2024204729A1 JP 2024013078 W JP2024013078 W JP 2024013078W WO 2024204729 A1 WO2024204729 A1 WO 2024204729A1
- Authority
- WO
- WIPO (PCT)
- Prior art keywords
- digital
- measurement
- value
- measurement value
- calibration curve
- Prior art date
- Legal status (The legal status is an assumption and is not a legal conclusion. Google has not performed a legal analysis and makes no representation as to the accuracy of the status listed.)
- Ceased
Links
Images



Classifications
-
- G—PHYSICS
- G01—MEASURING; TESTING
- G01N—INVESTIGATING OR ANALYSING MATERIALS BY DETERMINING THEIR CHEMICAL OR PHYSICAL PROPERTIES
- G01N21/00—Investigating or analysing materials by the use of optical means, i.e. using sub-millimetre waves, infrared, visible or ultraviolet light
- G01N21/75—Systems in which material is subjected to a chemical reaction, the progress or the result of the reaction being investigated
- G01N21/76—Chemiluminescence; Bioluminescence
-
- G—PHYSICS
- G01—MEASURING; TESTING
- G01N—INVESTIGATING OR ANALYSING MATERIALS BY DETERMINING THEIR CHEMICAL OR PHYSICAL PROPERTIES
- G01N35/00—Automatic analysis not limited to methods or materials provided for in any single one of groups G01N1/00 - G01N33/00; Handling materials therefor
Definitions
- the present invention relates to an automatic analysis method and an automatic analysis device that can obtain measurement information for various test items by reacting test objects (specimens and samples) such as blood and urine with various reagents and measuring the reaction process, reaction progress, reaction results, etc., and in particular to an automatic analysis method and an automatic analysis device that can contribute to improving the accuracy of measurements using electrochemiluminescence.
- Automatic analyzers such as blood coagulation analyzers and analyzers using immunoassays, are known in various forms that can obtain measurement information for various test items by reacting test objects containing components to be measured, such as blood and urine, with various reagents and measuring the reaction process and reaction results.
- test objects containing components to be measured such as blood and urine
- reagents such as glucose, glucose, and glucose.
- Such automatic analyzers dispense a specimen as the test object from a specimen container into a reaction container, and then dispense and mix the dispensed specimen with a reagent according to the test item to perform various measurements and analyses.
- an automatic analyzer for clinical testing dispenses a fixed amount of the test object and a reagent to react with each other, and then measures the amount of luminescence or absorbance of this reaction liquid within or after a fixed time, and obtains test values such as the concentration and activity value of the substance to be measured based on the measurement results (photometric results).
- Measurement using electrochemiluminescence is known as a method for measuring the amount of luminescence from a reaction solution (containing the object to be measured).
- a reagent containing a labeling substance is reacted with the object to be tested, a complex containing the object to be measured and the labeling substance is captured, and the number of photons is measured by generating electrochemiluminescence from the labeling substance.
- a reaction liquid (therefore a liquid containing a complex formed by binding the measurement target, solid phase carrier, and labeling substance) containing a reagent containing magnetic particles (magnetic solid phase carrier) and a reagent containing a labeling substance is first poured into the flow path of the flow cell constituting the measurement section, and the complex is captured in a part of the flow path by the magnetic field.
- the magnetic field is generated by contacting a magnet with the outer wall of the flow path at the electrode section consisting of a working electrode and a counter electrode facing each other across the flow path of the flow cell.
- the magnetic field is removed by, for example, removing the magnet in this captured state, and then a voltage is applied to the electrode section to measure the number of photons generated by the electrochemiluminescence of the labeling substance, thereby qualitatively or quantitatively measuring the measurement target (measurement target component).
- the above-mentioned correction method which assumes pulse overlap probabilistically, is a correction method that only assumes pulse overlap, and therefore cannot deal with photometric errors that cannot be corrected by probabilistic methods alone. In this case, if there is a decrease in sensitivity that cannot be explained by pulse overlap alone, the accuracy of the measurement value will decrease as the amount of light increases.
- the present invention was made with a focus on the above-mentioned problems, and aims to provide an automatic analysis method and automatic analysis device that can improve the accuracy of measurement data.
- the automatic analysis method is an automatic analysis method that accepts a test object and a reagent containing a labeled substance, digitally measures the amount of light obtained from the labeled substance, and qualitatively or quantitatively measures the measurement object contained in the test object, characterized in that the digital measurement value of the amount of light of the test object is converted into a digital estimated value using an optical calibration curve obtained from analog measurement values obtained by analog measurement of a plurality of sample specimens containing different concentrations of the measurement object and digital measurement values obtained by digital measurement, and the converted digital estimated value is used to measure the measurement object of the test object.
- the invention creates an optical calibration curve for each automatic analyzer based on data obtained by digitally measuring a plurality of sample specimens using each automatic analyzer and data obtained by separate analog measurement, converts the digital measurement value obtained by measuring the test object to be analyzed using the optical calibration curve into a digital estimated value, and measures the test object based on the digital estimated value, thereby improving measurement accuracy.
- the measurement value of the light amount is converted into a digital estimated value using the optical calibration curve, and by constructing a calibration curve taking into account factors that cannot be explained (imagined) by probability theory alone, it is possible to suppress the increase in photometric value error that occurs with an increase in the light amount, and to improve the accuracy of the measurement results obtained digitally for the test object (the accuracy of measurement data in the photon counting method can be improved).
- the optical calibration curve can be generated by determining the digital estimated value from a regression line between the analog measurement values obtained by analog measurement and the digital measurement values obtained by digital measurement of a plurality of sample specimens containing different concentrations of the object to be measured, and then using the regression line between the digital estimated value and the digital measurement values.
- the regression line can be determined, for example, from the analog measurement values and the digital measurement values by the least squares method, etc.
- the process of generating an optical calibration curve includes the steps of preparing a plurality of types of sample specimens (sample specimens with known contents of the substance to be measured, hereinafter simply referred to as "sample specimens") with known amounts of light and different brightnesses, acquiring analog measurement values obtained by an analog method for each of the sample specimens, acquiring digital measurement values obtained by a digital method for each of the sample specimens, plotting the analog measurement values and the digital measurement values on a two-dimensional coordinate plane, one of which is the X coordinate and the other is the Y coordinate, and converting the plotted data on the two-dimensional coordinate plane into data.
- the method includes a step of calculating a linear equation using the least squares method with the analog measurement value and the digital measurement value as two variables within the range of the digital measurement values where linearity is recognized in the data, a step of acquiring a digital estimated value by substituting the analog measurement value into the linear equation, including the range of the digital measurement values where linearity is not recognized in the plot on the two-dimensional coordinate plane, and a step of calculating, as the optical calibration curve, a conversion equation that converts the digital measurement value into a corrected digital estimated value using the least squares method using the digital measurement value and the digital estimated value.
- the optical calibration curve By constructing the optical calibration curve in this way, it is possible to expand the range of digital measurement values where linearity is observed in a plot of analog measurement values and digital measurement values on a two-dimensional coordinate plane to the range of digital measurement values where linearity is not observed (the linear range of the photon counting method can be expanded), and differences due to individual differences in the measurement system can be corrected using only the information on the coefficients of the optical calibration curve conversion formula, thereby saving on the amount of information to be attached to each unit. In other words, simply by storing coefficient information for each device in advance, it is possible to correct for differences due to individual differences in circuits, etc., and as a result, the amount of information to be stored in the device can be reduced.
- the present invention also provides a method for creating an optical calibration curve that converts digitally measured values into digital estimated values in an automatic analyzer, using a method similar to that used for creating the optical calibration curve in the above-mentioned automatic analysis method.
- the automatic analyzer includes a mixture introduction section for receiving a test object and a reagent containing a labeled substance, and a measurement section and measurement control section for qualitatively or quantitatively measuring a measurement object contained in the test object from a digital measurement value obtained by measuring the amount of light obtained from the labeled substance, the measurement control section storing an optical calibration curve created according to any one of claims 5 to 7, converting the digital measurement value into a digital estimated value using the optical calibration curve, and qualitatively or quantitatively measuring the measurement object based on the digital estimated value.
- the digital measurement value of the test object can be converted into a digital estimated value using the optical calibration curve, thereby providing an automatic analyzer that can accurately measure the test object.
- the automated analysis method and automated analysis device of the present invention can improve the accuracy of measurement data in the photon counting method by using digital estimates that correct various measurement errors, including measurement errors caused by individual differences in the automated analysis device.
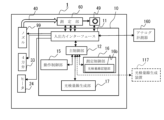
- FIG. 1 is a schematic diagram of a main configuration of an automatic analyzer according to one embodiment of the present invention.
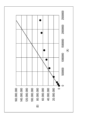
- 1 is a diagram in which analog measurement values (X coordinate) and digital measurement values (Y coordinate) of light quantities are plotted on a two-dimensional coordinate plane.
- FIG. 3 is a diagram showing a linear line calculated by the least squares method using analog measurement values and digital measurement values as two variables within the range of digital measurement values where linearity is recognized in the plot on the two-dimensional coordinate plane in FIG. 2 .
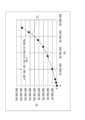
- FIG. 4 is a diagram showing an optical calibration curve obtained by the least squares method as a conversion formula for converting digital measurement values into digital estimated values obtained by substituting analog measurement values into the linear line in FIG. 3 .
- 13 is a table showing an example of measurement value data regarding 14 samples with different luminance values. 13 is a flowchart of process steps for obtaining a light calibration curve that converts measured values of light quantities into digital estimates.
- 2 is a functional block diagram showing an example of a control unit of the automatic analyzer 1 and a configuration for generating an optical calibration curve. FIG.
- the automatic analyzer 1 of the present embodiment shown in Fig. 1 is not shown in its entirety, but includes a reaction unit that holds a reaction vessel into which a specimen such as blood or urine collected from a person is dispensed, and a reagent supply unit that supplies the reagent in the reagent vessel to the reaction vessel.
- the automatic analyzer 1 obtains measurement information for a predetermined test item by reacting the reagent supplied from the reagent supply unit to the reaction vessel with the specimen and measuring the reaction process (measuring the reaction liquid obtained by mixing the reagent and the specimen).
- the automatic analyzer 1 of the present embodiment digitally measures the amount of luminescence of the measurement object obtained from the reaction liquid after a certain time, converts the measurement information (side light value of the amount of luminescence) into a digital estimated value corrected based on a predetermined optical calibration curve, and obtains test values such as the concentration and activity value of the measurement object based on the converted digital estimated value.
- the electrochemiluminescence method is used to measure the amount of luminescence of the object to be measured.
- a reaction liquid (hence a liquid containing a complex containing the labeling substance, the object to be measured, and the solid phase carrier) in which a reagent containing a magnetic solid phase carrier (magnetic particles in this embodiment) and a sample containing the object to be measured and a reagent containing a labeling substance are mixed is poured into the flow path of the flow cell constituting the measurement section.
- the complex is then captured in a part of the flow path by a magnetic field.
- the magnetic field is generated by contacting a magnet with the outer wall of the flow path at the electrode section consisting of a working electrode and a counter electrode facing each other across the flow path of the flow cell. Then, the magnetic particles that have captured the object to be measured are captured and remain on the electrode section due to the magnetic attraction force of this magnet. Then, in this captured state, for example, the magnet is removed to remove the magnetic field, and then a voltage is applied to the electrode section to generate electrochemiluminescence of the labeling substance (the labeling substance that forms a complex with the magnetic particles and the object to be measured emits light), and the number of photons is measured.
- a digital estimate is calculated by correcting the digitally measured number of photons (photometric value), and this digital estimate is used to qualitatively or quantitatively measure the object to be measured (the component to be measured).
- the automatic analyzer 1 includes a heating unit 50 for heating the liquid required for measurement to a desired temperature using a heater 24, an introduction nozzle (a complex liquid introduction unit that receives a complex liquid containing a test object (specimen or sample) and a reagent containing a labeling substance) 99 as an introduction tube for injecting the above-mentioned reaction liquid into the liquid required for measurement heated by the heating unit 50 to produce a liquid containing the object to be measured, and a measurement unit 60 that magnetically captures a complex formed by the object to be measured and the labeling substance bound to magnetic particles from the liquid containing the object to be measured using an electrode unit 70 and measures the complex using an electrochemiluminescence method.
- the measurement unit 60 constitutes a flow cell and is kept at a constant temperature by a heater (not shown), and obtains measurement information related to a specified analysis item of the object to be measured.
- liquid containing the object to be measured refers to any physical form that should be supplied to the measurement unit 60 in a state necessary for measuring the object for a specific analysis item, such as a mixture (reaction liquid) of a sample (specimen) and a reagent (calibration liquid).
- object to be measured refers to a substance to be measured by the measurement unit 60, and refers to the specimen itself, a substance contained in the specimen, or a component to be measured contained in the test object.
- test object refers to a liquid containing a component to be measured, and refers to a biological sample (specimen) such as blood or urine, or a liquid (sample specimen) adjusted to show a known concentration or brightness, such as a control reagent or calibration reagent.
- the liquids required for measurement are a cleaning liquid (CC liquid) that cleans the introduction nozzle 99 and washes away substances not required for measurement and substances after measurement, and a luminescent electrolyte (EB liquid) used in measurement by electrochemiluminescence method. Therefore, the automatic analyzer 1 of this embodiment has a liquid supply unit 20 for supplying CC liquid and a liquid supply unit 22 for supplying EB liquid.
- the heating unit 50 is made up of a temperature control block equipped with a coiled tube 35 through which the liquid required for the measurement flows, and the liquid required for the measurement in the coiled tube 35 is heated by heating the coiled tube 35 with a heater 24.
- the liquid supply units 20 and 22 are connected to the coiled tube 35 of the heating unit 50 via the supply flow paths 26 and 27.
- a connecting trough 34 with a four-way solenoid valve 33 is interposed between the heating section 50 and the introduction nozzle 99.
- the four-way solenoid valve 33 has a first port 33a connected to an air intake pipe (not shown) that communicates with the outside air, a second port 33b connected to a communication pipe 31 that communicates with the liquid supply section 20 for the CC liquid via a serpentine 35, and a third port 33c connected to a communication pipe 32 that communicates with the liquid supply section 22 for the EB liquid via a serpentine 35.
- the introduction nozzle 99 is joined to the combination trough 34 except when it is moved to the installation location of the reaction liquid containing the measurement target to aspirate the reaction liquid.
- a flow path is formed that flows the liquid necessary for measurement from the heating unit 50 and the reaction liquid (liquid containing the measurement target) introduced by the introduction nozzle 99 into the flow path 60a of the measurement unit 60 via the connection flow path 40.
- the "liquid necessary for measurement” moves inside the introduction nozzle 99 and mixes with the reaction liquid to become the "liquid containing the measurement target.”
- the measurement unit 60 constituting the flow cell is constructed by protecting the periphery of a metal box with a thermal insulating material, and includes a flow path 60a through which a liquid containing the object to be measured flows, an optical sensor 60b (an optical device including a light receiving element: for example, a photomultiplier tube) that measures the amount of light emitted, and an electrode unit 70 that magnetically captures a complex formed by binding the object to be measured and the labeling substance to the magnetic particles.
- an optical sensor 60b an optical device including a light receiving element: for example, a photomultiplier tube
- the electrode unit 70 is composed of a working electrode 71 and a counter electrode 72 that face each other across the flow path 60a, and has a magnet 73 that generates a magnetic field when brought close to (or in contact with) the outer wall of the flow path 60a on the working electrode 71 side.
- the magnetic attraction force of this magnet 73 causes the magnetic particles containing the object to be measured (i.e., the complex) to be captured and remain on the working electrode 71.
- the magnetic field is removed, for example by removing the magnet 73, and a voltage is applied to the electrode section 70 to generate electrochemiluminescence of the labeled substance that forms a complex (the labeled substance that forms a complex with the magnetic particles and the object to be measured emits light), thereby digitally measuring the number of photons.
- This measured digital value is converted into a digital estimate (corrected photometric value) using an "optical calibration curve".
- the converted digital estimate is then used to qualitatively or quantitatively measure the object to be measured (the component to be measured) based on the calibration curve "which shows the relationship between the amount of light and the concentration or activity value, etc.”
- the measuring unit 60 is provided with a temperature sensor 75 that detects the temperature of the liquid containing the object to be measured.
- a pump (e.g., a peristaltic pump) 49 is inserted downstream of the flow path extending from the measuring unit 60, and is driven to supply the liquid required for measurement from the liquid supply units 20, 22 to the measuring unit 60 via the heating unit 50.
- a tank 74 is provided to collect the liquid containing the object to be measured after it has been measured as waste liquid.
- the automated analyzer 1 of this embodiment also includes a control unit 10 that controls the operation of the introduction nozzle 99, the electrode unit 70, the optical sensor 60b, and the pump 49.
- the electrical connection lines between the control unit 10 and each unit are indicated by dashed arrows. Note that the electrodes 71 and 72 of the measurement unit 60, the temperature sensor 75, the magnet drive unit (not shown) that drives the magnet 73, and the like are also electrically connected to the control unit 10, but the connection lines have been omitted from FIG. 1 for simplification.
- the automated analyzer 1 of this embodiment having the above configuration is configured to measure the amount of light emitted by the labeled substance using a photon counting method (digital method) in cooperation with the measurement unit 60 having a light receiving sensor (light receiving device) 60b and the measurement control unit 16 (see Figure 7) of the control unit 10, and to convert the measured value of the amount of light into a digital estimated value using an optical calibration curve.
- the optical calibration curve specific to the automated analyzer 1 is created before installing (carrying in) the automated analyzer 1, and is stored in the optical calibration curve storage unit 16b.
- the optical calibration curve is generated from digital measurement values obtained by digitally measuring multiple sample specimens whose luminance changes according to the concentration of the substance to be measured using the automatic analyzer 1 and analog measurement values obtained using an analog measuring device.
- FIG. 7 shows an example of a functional block diagram of the control unit of the automatic analyzer 1 and the configuration required to generate the optical calibration curve.
- the control unit 10 of the automatic analyzer 1 includes an input/output interface 11 for inputting and outputting data to and from each unit of the automatic analyzer, a main control unit 12 for controlling the entire device, an operation control unit 15 for controlling the operation of the nozzle, valve, heater, and other units, a measurement control unit 16 for controlling digital measurement by the measurement unit 60, and an optical calibration curve generation unit 17 for generating the optical calibration curve.
- an external optical calibration curve generation device 117 can also be used, and in this case, it is not necessary to provide the optical calibration curve generation unit 17 within the automatic analyzer 1.
- the same sample specimens as those digitally measured by the automatic analyzer 1 are measured by the analog measuring device 160, and both the digital and analog measurement values of multiple sample specimens with different concentrations are input to the optical calibration curve generating unit 17 or the optical calibration curve generating device 117.
- the multiple sample specimens used for measurement do not need to be kept in the automatic analyzer 1 at all times, and it is sufficient if they can be dispensed using the introduction nozzle 99 and digitally measured when creating the optical calibration curve (before the device 1 is brought in).
- Analog measurements can be made using an analog measuring device if the automatic analyzer 1 is equipped with one, but typically measurements are made using an external analog measuring device 160.
- FIG. 6 An example of the process for generating an optical calibration curve is shown in FIG. 6.
- the optical calibration curve can be generated, for example, by the process steps shown in FIG. 6.
- a description will be given of a case where a photomultiplier tube is used as the light receiving sensor 60b for measurement.
- the formula for calculating the digital estimate is created in the following procedure and stored in the automatic analyzer 1 before the automatic analyzer 1 is shipped from the factory or before the automatic analyzer 1 is installed.
- the "analog method” refers to a signal processing method in which the electronic output of the photomultiplier tube is treated as a current
- the “digital method” refers to a signal processing method in which the pulsed output is converted to a binary value and counted.
- the analog method is used for measurements that require a wide measurement range, while the digital method is used to measure weak light.
- sample specimens sample specimens of the test object
- step S1 in FIG. 6 multiple types of sample specimens (sample specimens of the test object) with known light quantities and different brightnesses depending on the concentration, etc. are prepared (step S1 in FIG. 6).
- 14 levels of Ru-labeled antibody-bound magnetic particle samples showing brightnesses (count values) within the range of light intensity to be measured are prepared.
- FIG. 5 shows an example of measurement value data for each of 14 Ru-labeled antibody-bound magnetic particle samples S1 to S14 with different brightnesses.
- A indicates the analog measurement value (count value) of the light quantity
- B indicates the digital measurement value of the light quantity
- C indicates the digital estimate obtained from the linear equation described later
- D indicates the conversion value (corrected digital estimate) of the digital estimate using the conversion equation (optical calibration curve) described later.
- FIG. 5 also shows the percentage of error after correction of the digital estimate (corrected coefficient error).
- sample specimens S1 to S14 with different luminances are prepared, and analog measurement values obtained by an analog method are obtained for each sample specimen S1 to S14 (step S2).
- analog measurement value A A1 to A14 of the light intensity shown in Figure 5 is obtained for each sample specimen S1 to S14 using an apparatus equipped with a photoreceiver with good linearity (an analog measurement apparatus capable of analog measurement).
- step S3 digital measurement values obtained by a digital method for each of the same 14 sample specimens S1 to S14 are obtained.
- the same 14 sample specimens S1 to S14 are measured on a digital measuring device for which optical calibration is to be performed, and digital measurement values (digital actual measurements) B (B1 to B14) are obtained.
- the 14 acquired analog measurement values A1 to A14 and the 14 acquired digital measurement values B1 to B14 are treated as data to be plotted on a two-dimensional coordinate plane, one of which is the x coordinate and the other is the y coordinate.
- the analog measurement value (analog measurement value) A is plotted as the x coordinate
- the digital measurement value (digital photometric value) B is plotted as the y coordinate on the two-dimensional coordinate plane (step S4).
- Such a plot is shown in Figure 2.
- a linear equation is calculated by the least squares method with analog measurement value A and digital measurement value B as two variables within the range of digital measurement values where linearity is recognized in the plot (plot data) on the two-dimensional coordinate plane in Figure 2 (step S5).
- the least squares method is used for the digital measurement values (e.g. B3 to B7) within the linearity range of the digital measuring device and the analog measurement values (e.g. A3 to A7) within the corresponding range obtained by the analog measuring device to calculate a linear equation with analog measurement value A as the x-coordinate (e.g. by linear fitting using the least squares method with Excel (registered trademark)).
- digital estimate values C1 to C14 are obtained, including the range of digital measurement values B where no linearity was observed in the plot on the two-dimensional coordinate plane shown in Figure 2 (step S6).
- the digital measurement values B1 to B14 are plotted on a two-dimensional coordinate plane as the x coordinates and the digital estimate values C1 to C14 obtained from the linear equation in Fig. 3 are plotted as the y coordinates, and a conversion equation for converting the digital measurement values (digital actual measurements) B into corrected digital estimate values (linear digital estimate values) D is calculated as an optical calibration curve by the least squares method (step S7).
- "E” is an exponential notation (E notation) in a computer, and for example, (8E-24) in the equation represents "8 x 10 to the power of -24".
- the digital estimated value may also be calculated using a comparison table or graph, etc.
- the conversion formula is considered to be a composite function that includes pulse reduction due to overlapping of output pulses from the light receiving sensor, as well as other photometric errors.
- the automated analyzer 1 of this embodiment uses the optical calibration curve obtained as described above to convert the digital measurement value of the light quantity into a corrected digital estimate, so that not only can the increase in photometric value error that accompanies an increase in the light quantity be suppressed and the accuracy of the measurement results obtained digitally for the sample be improved (the accuracy of the measurement data in the photon counting method can be improved), but also the range of digital measurement values in which linearity is recognized in a plot of analog measurement values and digital measurement values on a two-dimensional coordinate plane can be expanded to the range of digital measurement values in which linearity is not recognized (the linear range of the photon counting method can be expanded), and differences due to individual differences in the measurement system can be corrected using only the information on the coefficients of the conversion formula for the optical calibration curve, thereby reducing the amount of information to be attached to each unit.
- the present invention is not limited to the above-described embodiment and can be modified in various ways without departing from the gist of the invention.
- the configuration of the measurement unit, etc. is not limited to the above-described configuration.
- numerical processing may be performed, for example, as data in a memory, without actually plotting the measured values.
- some or all of the above-described embodiments may be combined, or part of the configuration may be omitted from one of the above-described embodiments, without departing from the gist of the present invention.
Landscapes
- Physics & Mathematics (AREA)
- Chemical & Material Sciences (AREA)
- General Health & Medical Sciences (AREA)
- Health & Medical Sciences (AREA)
- Life Sciences & Earth Sciences (AREA)
- Analytical Chemistry (AREA)
- Biochemistry (AREA)
- General Physics & Mathematics (AREA)
- Immunology (AREA)
- Pathology (AREA)
- Chemical Kinetics & Catalysis (AREA)
- Plasma & Fusion (AREA)
- Engineering & Computer Science (AREA)
- Investigating Or Analysing Materials By The Use Of Chemical Reactions (AREA)
Priority Applications (1)
| Application Number | Priority Date | Filing Date | Title |
|---|---|---|---|
| JP2025511277A JPWO2024204729A1 (https=) | 2023-03-30 | 2024-03-29 |
Applications Claiming Priority (2)
| Application Number | Priority Date | Filing Date | Title |
|---|---|---|---|
| JP2023055406 | 2023-03-30 | ||
| JP2023-055406 | 2023-03-30 |
Publications (1)
| Publication Number | Publication Date |
|---|---|
| WO2024204729A1 true WO2024204729A1 (ja) | 2024-10-03 |
Family
ID=92905904
Family Applications (1)
| Application Number | Title | Priority Date | Filing Date |
|---|---|---|---|
| PCT/JP2024/013078 Ceased WO2024204729A1 (ja) | 2023-03-30 | 2024-03-29 | 自動分析方法、光検量線の作成方法及び自動分析装置 |
Country Status (2)
| Country | Link |
|---|---|
| JP (1) | JPWO2024204729A1 (https=) |
| WO (1) | WO2024204729A1 (https=) |
Citations (5)
| Publication number | Priority date | Publication date | Assignee | Title |
|---|---|---|---|---|
| JPH0718757B2 (ja) * | 1989-12-11 | 1995-03-06 | アロカ株式会社 | 光子計数測光装置 |
| JP2005207955A (ja) * | 2004-01-23 | 2005-08-04 | Hamamatsu Photonics Kk | 光検出用回路及び光検出器 |
| WO2010087108A1 (ja) * | 2009-01-30 | 2010-08-05 | 株式会社 日立ハイテクノロジーズ | 自動分析装置 |
| JP2013521500A (ja) * | 2010-03-01 | 2013-06-10 | クワンテリクス コーポレーション | 分子または粒子を検出するアッセイにおけるダイナミックレンジを拡張するための方法またはシステム |
| JP2014119282A (ja) * | 2012-12-13 | 2014-06-30 | Fuji Electric Co Ltd | 直線性補償用ブリーダ回路および放射線検出器 |
-
2024
- 2024-03-29 JP JP2025511277A patent/JPWO2024204729A1/ja active Pending
- 2024-03-29 WO PCT/JP2024/013078 patent/WO2024204729A1/ja not_active Ceased
Patent Citations (5)
| Publication number | Priority date | Publication date | Assignee | Title |
|---|---|---|---|---|
| JPH0718757B2 (ja) * | 1989-12-11 | 1995-03-06 | アロカ株式会社 | 光子計数測光装置 |
| JP2005207955A (ja) * | 2004-01-23 | 2005-08-04 | Hamamatsu Photonics Kk | 光検出用回路及び光検出器 |
| WO2010087108A1 (ja) * | 2009-01-30 | 2010-08-05 | 株式会社 日立ハイテクノロジーズ | 自動分析装置 |
| JP2013521500A (ja) * | 2010-03-01 | 2013-06-10 | クワンテリクス コーポレーション | 分子または粒子を検出するアッセイにおけるダイナミックレンジを拡張するための方法またはシステム |
| JP2014119282A (ja) * | 2012-12-13 | 2014-06-30 | Fuji Electric Co Ltd | 直線性補償用ブリーダ回路および放射線検出器 |
Also Published As
| Publication number | Publication date |
|---|---|
| JPWO2024204729A1 (https=) | 2024-10-03 |
Similar Documents
| Publication | Publication Date | Title |
|---|---|---|
| JP5124498B2 (ja) | 自動分析装置 | |
| JP7041623B2 (ja) | 液体試料中の分析物を検出するための電気化学発光方法および装置 | |
| US8257664B2 (en) | Dispensing apparatus and automatic analyzer | |
| CN106170702B (zh) | 自动分析装置及分析方法 | |
| JP5924950B2 (ja) | 試料分析装置 | |
| US10690688B2 (en) | Automatic analyzer | |
| CN112639455B (zh) | 电解质测定装置 | |
| KR20100009645A (ko) | 이상 특정 방법 및 분석 장치 | |
| JP5977654B2 (ja) | 液体試料中の分析物を検出する発光法及び分析システム | |
| WO2017163613A1 (ja) | 自動分析装置 | |
| CN101501483A (zh) | 电解质分析装置及其测量数据处理方法 | |
| JP5028350B2 (ja) | 自動分析装置 | |
| WO2024204729A1 (ja) | 自動分析方法、光検量線の作成方法及び自動分析装置 | |
| CN112304880A (zh) | 测试、验证、校准或调整自动分析设备的方法 | |
| CN116183040A (zh) | 测光系统、样本分析仪以及样本检测方法 | |
| US20060240540A1 (en) | Biosensor, biosensor chip, and biosensor device | |
| CN111727366B (zh) | 信号处理装置和信号处理方法 | |
| JPH06308131A (ja) | データ処理装置 | |
| CN116183039A (zh) | 测光系统、样本分析仪以及样本检测方法 | |
| JP2001004586A (ja) | 電解質分析装置 | |
| CN111373267A (zh) | 自动分析装置和自动分析装置的控制方法 | |
| CN115004038A (zh) | 流通池以及自动分析装置 | |
| WO2024204825A1 (ja) | 自動分析装置の分析方法及び自動分析装置 | |
| US20250044311A1 (en) | Automatic analyzer | |
| Berthold | Instrumentation for chemiluminescence immunoassays |
Legal Events
| Date | Code | Title | Description |
|---|---|---|---|
| 121 | Ep: the epo has been informed by wipo that ep was designated in this application |
Ref document number: 24780824 Country of ref document: EP Kind code of ref document: A1 |
|
| WWE | Wipo information: entry into national phase |
Ref document number: 2025511277 Country of ref document: JP |
|
| NENP | Non-entry into the national phase |
Ref country code: DE |
|
| 122 | Ep: pct application non-entry in european phase |
Ref document number: 24780824 Country of ref document: EP Kind code of ref document: A1 |