WO2023157697A1 - 生産管理システム、生産管理方法、及びプログラム - Google Patents
生産管理システム、生産管理方法、及びプログラム Download PDFInfo
- Publication number
- WO2023157697A1 WO2023157697A1 PCT/JP2023/003840 JP2023003840W WO2023157697A1 WO 2023157697 A1 WO2023157697 A1 WO 2023157697A1 JP 2023003840 W JP2023003840 W JP 2023003840W WO 2023157697 A1 WO2023157697 A1 WO 2023157697A1
- Authority
- WO
- WIPO (PCT)
- Prior art keywords
- production
- value
- actual
- product
- data
- Prior art date
- Legal status (The legal status is an assumption and is not a legal conclusion. Google has not performed a legal analysis and makes no representation as to the accuracy of the status listed.)
- Ceased
Links
Images






Classifications
-
- G—PHYSICS
- G05—CONTROLLING; REGULATING
- G05B—CONTROL OR REGULATING SYSTEMS IN GENERAL; FUNCTIONAL ELEMENTS OF SUCH SYSTEMS; MONITORING OR TESTING ARRANGEMENTS FOR SUCH SYSTEMS OR ELEMENTS
- G05B19/00—Program-control systems
- G05B19/02—Program-control systems electric
- G05B19/418—Total factory control, i.e. centrally controlling a plurality of machines, e.g. direct or distributed numerical control [DNC], flexible manufacturing systems [FMS], integrated manufacturing systems [IMS] or computer integrated manufacturing [CIM]
- G05B19/41875—Total factory control, i.e. centrally controlling a plurality of machines, e.g. direct or distributed numerical control [DNC], flexible manufacturing systems [FMS], integrated manufacturing systems [IMS] or computer integrated manufacturing [CIM] characterised by quality surveillance of production
-
- G—PHYSICS
- G06—COMPUTING OR CALCULATING; COUNTING
- G06Q—INFORMATION AND COMMUNICATION TECHNOLOGY [ICT] SPECIALLY ADAPTED FOR ADMINISTRATIVE, COMMERCIAL, FINANCIAL, MANAGERIAL OR SUPERVISORY PURPOSES; SYSTEMS OR METHODS SPECIALLY ADAPTED FOR ADMINISTRATIVE, COMMERCIAL, FINANCIAL, MANAGERIAL OR SUPERVISORY PURPOSES, NOT OTHERWISE PROVIDED FOR
- G06Q10/00—Administration; Management
- G06Q10/06—Resources, workflows, human or project management; Enterprise or organisation planning; Enterprise or organisation modelling
- G06Q10/063—Operations research, analysis or management
- G06Q10/0639—Performance analysis of employees; Performance analysis of enterprise or organisation operations
- G06Q10/06393—Score-carding, benchmarking or key performance indicator [KPI] analysis
-
- G—PHYSICS
- G06—COMPUTING OR CALCULATING; COUNTING
- G06Q—INFORMATION AND COMMUNICATION TECHNOLOGY [ICT] SPECIALLY ADAPTED FOR ADMINISTRATIVE, COMMERCIAL, FINANCIAL, MANAGERIAL OR SUPERVISORY PURPOSES; SYSTEMS OR METHODS SPECIALLY ADAPTED FOR ADMINISTRATIVE, COMMERCIAL, FINANCIAL, MANAGERIAL OR SUPERVISORY PURPOSES, NOT OTHERWISE PROVIDED FOR
- G06Q10/00—Administration; Management
- G06Q10/06—Resources, workflows, human or project management; Enterprise or organisation planning; Enterprise or organisation modelling
- G06Q10/063—Operations research, analysis or management
- G06Q10/0639—Performance analysis of employees; Performance analysis of enterprise or organisation operations
- G06Q10/06395—Quality analysis or management
-
- G—PHYSICS
- G06—COMPUTING OR CALCULATING; COUNTING
- G06Q—INFORMATION AND COMMUNICATION TECHNOLOGY [ICT] SPECIALLY ADAPTED FOR ADMINISTRATIVE, COMMERCIAL, FINANCIAL, MANAGERIAL OR SUPERVISORY PURPOSES; SYSTEMS OR METHODS SPECIALLY ADAPTED FOR ADMINISTRATIVE, COMMERCIAL, FINANCIAL, MANAGERIAL OR SUPERVISORY PURPOSES, NOT OTHERWISE PROVIDED FOR
- G06Q50/00—Information and communication technology [ICT] specially adapted for implementation of business processes of specific business sectors, e.g. utilities or tourism
- G06Q50/04—Manufacturing
-
- G—PHYSICS
- G05—CONTROLLING; REGULATING
- G05B—CONTROL OR REGULATING SYSTEMS IN GENERAL; FUNCTIONAL ELEMENTS OF SUCH SYSTEMS; MONITORING OR TESTING ARRANGEMENTS FOR SUCH SYSTEMS OR ELEMENTS
- G05B2219/00—Program-control systems
- G05B2219/30—Nc systems
- G05B2219/32—Operator till task planning
- G05B2219/32179—Quality control, monitor production tool with multiple sensors
-
- Y—GENERAL TAGGING OF NEW TECHNOLOGICAL DEVELOPMENTS; GENERAL TAGGING OF CROSS-SECTIONAL TECHNOLOGIES SPANNING OVER SEVERAL SECTIONS OF THE IPC; TECHNICAL SUBJECTS COVERED BY FORMER USPC CROSS-REFERENCE ART COLLECTIONS [XRACs] AND DIGESTS
- Y02—TECHNOLOGIES OR APPLICATIONS FOR MITIGATION OR ADAPTATION AGAINST CLIMATE CHANGE
- Y02P—CLIMATE CHANGE MITIGATION TECHNOLOGIES IN THE PRODUCTION OR PROCESSING OF GOODS
- Y02P90/00—Enabling technologies with a potential contribution to greenhouse gas [GHG] emissions mitigation
- Y02P90/02—Total factory control, e.g. smart factories, flexible manufacturing systems [FMS] or integrated manufacturing systems [IMS]
-
- Y—GENERAL TAGGING OF NEW TECHNOLOGICAL DEVELOPMENTS; GENERAL TAGGING OF CROSS-SECTIONAL TECHNOLOGIES SPANNING OVER SEVERAL SECTIONS OF THE IPC; TECHNICAL SUBJECTS COVERED BY FORMER USPC CROSS-REFERENCE ART COLLECTIONS [XRACs] AND DIGESTS
- Y02—TECHNOLOGIES OR APPLICATIONS FOR MITIGATION OR ADAPTATION AGAINST CLIMATE CHANGE
- Y02P—CLIMATE CHANGE MITIGATION TECHNOLOGIES IN THE PRODUCTION OR PROCESSING OF GOODS
- Y02P90/00—Enabling technologies with a potential contribution to greenhouse gas [GHG] emissions mitigation
- Y02P90/30—Computing systems specially adapted for manufacturing
Definitions
- the present invention relates to a production control system, a production control method, and a program for managing production on a product production line.
- product inspection devices are installed in the intermediate and final processes of the line to detect defects and sort out defective products.
- product inspection devices there are generally equipment that prints cream solder on the printed wiring board (printing equipment), equipment that mounts components on the board on which cream solder is printed (mounting equipment), and after component mounting It includes a device (reflow device) that heats the substrate and solders the components to the substrate. Then, an inspection device arranged after each production device inspects whether or not the work in each device is performed correctly as planned.
- a production management system is in operation that collects information from each manufacturing and inspection device and comprehensively manages the defect rate, production volume, etc., and improves the productivity of the entire production line. contributing to improvement.
- JP 2003-187069 A Japanese Patent Application Laid-Open No. 2003-122420
- the present invention has been made in view of the above-mentioned circumstances, and its purpose is to provide a technique that enables more clearly recognizing priority points for improvement in the production line.
- the actual production value is the data of the index corresponding to a statistical outlier in the distribution of the actual production value from the data of the index relating to the productivity or quality of the product in the production line and/or the production line.
- the actual production value which is the actual value of the index related to the productivity or quality of the product in the production line
- Data on indicators related to productivity or quality of products on the production line data on indicators corresponding to statistical outliers in the distribution of actual production values and/or indicators affected by prescribed changes in conditions on the production line
- the actual production value which is an index related to the productivity or quality of the product, calculated by excluding the data of .
- the predetermined condition change in the production line may include a change corresponding to a so-called 4M change.
- the target it is possible to obtain the actual value of the production line that becomes Furthermore, by eliminating or improving the predetermined condition changes in the production line that have affected the data of the excluded index in the calculation of the actual value, the actual value can be brought closer to the actual value.
- the predetermined condition change includes a planned condition change planned in advance for the production line and an accidental condition change that occurs accidentally in the production line
- the actual value calculation unit determines, from the data of the index related to the productivity or quality of the product in the production line, that the actual production value corresponds to a statistical outlier in the distribution of the actual production value, and the planned condition in the production line calculating the actual production value by excluding the data of the indicator affected by the change;
- the actual value calculation unit determines, from the data of the index related to the productivity or quality of the product used to calculate the actual production value, that it corresponds to a statistical outlier in the distribution of the actual production value, and
- the production capacity value may be calculated by excluding data of the index affected by an accidental change of conditions in the production line.
- the index related to the productivity or quality of the product in the production line is at least one of the production volume per predetermined time of the product, the manufacturing takt time of the product, and the error rate of the product. may include one.
- the present disclosure may further include a result reporting unit that creates a result report that enables comparison between the actual production value and the actual production value in a predetermined period. By doing so, it becomes possible to more clearly present priority measures for increasing the production volume to the manager or the like who has the right to make decisions related to the production line.
- the result reporting unit may report including the content of the accidental condition change related to the index data excluded when the actual production value calculation unit calculates the production performance value. It is possible to clarify the cause of the difference between the actual production value and the actual production value, and to clearly grasp the measures for bringing the actual production value closer to the target production value.
- the present disclosure is a production control method in a production line having a single or a plurality of manufacturing apparatuses and inspection apparatuses, in which a product manufacturing process and an inspection process are executed by the manufacturing apparatuses and inspection apparatuses, an actual value calculation step of calculating an actual production value, which is an actual value of an index related to the productivity or quality of the product in the production line; a performance value calculation step of calculating a production performance value, which is a performance value of an index related to the productivity or quality of the product in the production line, based on the performance value; has The actual production value is the data of the index corresponding to a statistical outlier in the distribution of the actual production value from the data of the index relating to the productivity or quality of the product in the production line and/or the production line.
- the production control method may be characterized in that it is an index related to the productivity or quality of the product, which is calculated by excluding data of the index affected by a predetermined condition change in the above.
- the predetermined condition change includes a planned condition change planned in advance for the production line and an accidental condition change that occurs accidentally in the production line
- the actual value calculation step from the data of the index related to the productivity or quality of the product in the production line, it corresponds to a statistical outlier in the distribution of the actual production value and is planned in the production line calculating the actual production value by excluding the data of the indicator affected by the condition change
- the production control method may be characterized in that the production capacity value is calculated by excluding data of the index affected by an accidental change of conditions in the production line.
- the index related to the productivity or quality of the product in the production line is at least one of the production volume per predetermined time of the product, the manufacturing takt time of the product, and the error rate of the product.
- the above production control method may be characterized by including
- the present disclosure may be the production management method described above, further comprising a result reporting step of creating a result report that enables comparison between the actual production value and the actual production value.
- the present disclosure further includes a result reporting step of creating a result report capable of comparing the actual production value and the actual production value,
- the report in the actual value calculation step, the report includes the content of the accidental condition change related to the data of the index excluded when calculating the production value,
- the above production control method may be used. As a result, it is possible to clarify countermeasures for bringing actual values closer to actual values.
- the present disclosure provides a production line having a single or a plurality of manufacturing apparatuses and inspection apparatuses, in which a product manufacturing process and an inspection process are executed by the manufacturing apparatus and the inspection apparatus, to a computer, a performance value calculation step of calculating a performance performance value, which is a performance value of an index related to the productivity or quality of the product on the production line; a performance value calculation step of calculating a production performance value that is the performance value of the index; and
- the actual production value is the data of the index corresponding to a statistical outlier in the distribution of the actual production value from the data of the index relating to the productivity or quality of the product in the production line and/or the production line.
- the predetermined condition change includes a planned condition change planned in advance for the production line and an accidental condition change that occurs accidentally in the production line
- the actual value calculation step from the data of the index related to the productivity or quality of the product in the production line, it corresponds to a statistical outlier in the distribution of the actual production value, and calculating the actual production value by excluding the data of the indicator affected by the condition change
- the actual value calculation step from the data of the index related to the productivity or quality of the product used to calculate the actual production value, it further corresponds to a statistical outlier in the distribution of the actual production value
- the above-described program may be characterized in that the production capacity value is calculated by excluding data of the index affected by an accidental change of conditions in the production line.
- FIG. 1 is a schematic configuration diagram of a production management system according to an embodiment of the present invention
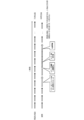
- FIG. FIG. 5 is a diagram for explaining the difference between the best value of the production amount and the actual value in the production line according to the embodiment of the present invention
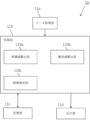
- 1 is a functional block diagram of a production management device according to an embodiment of the present invention
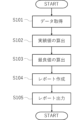
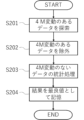
- FIG. 4 is a flow chart of processing in the production management system according to the embodiment of the present invention
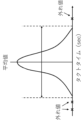
- It is a figure explaining the example of the calculation method of the best value which concerns on Example 1 of this invention.
- It is a figure explaining the 2nd example of the calculation method of the best value based on Example 1 of this invention.
- FIG. 5 is a diagram showing an example of a message posted in a report according to Example 1 of the present invention
- FIG. 10 is a diagram showing a second example of a graph included in a report according to Example 1 of the present invention
- FIG. 5 is a diagram showing an example of contents when a report is provided by email according to the first embodiment of the present invention
- FIG. 5 is a diagram showing an example of contents when a report is downloaded by a web browser according to the first embodiment of the present invention
- FIG. 5 is a diagram showing an example of contents when a report according to the first embodiment of the present invention is provided by a WEB browser; It is a best value calculation flow chart according to Example 2 of the present invention.
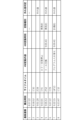
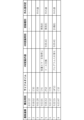
- FIG. 10 is a diagram showing an example of data relating to manufacturing of a substrate according to Example 5 of the present invention. It is a figure which shows another example of the data regarding manufacture of the board
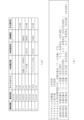
- FIG. 11 is a diagram showing an example of presentation of an improvement target according to Example 5 of the present invention.
- FIG. 21 is a diagram showing another example of presenting an improvement target according to Example 5 of the present invention;
- a production line 10 to which the present invention is applied includes, as shown in FIG. 1, a solder printing device 10a, a post-solder printing inspection device 10b, a mounter 10c, a post-mounting inspection device 10d, a reflow furnace 10e, and a post-reflow inspection device 10f. .
- Each device in the production line 10 is connected to the production control device 1a via a network such as LAN.
- the production control device 1a is composed of a general-purpose computer system.
- Fig. 2 shows the best production volume and the actual production volume in the production line 10.
- the arrows in the upper row indicate the case where the production was carried out smoothly, and the arrows in the lower row indicate the actual case.
- This best value corresponds to the actual production value in the present disclosure.
- the waiting time of each manufacturing device or each inspection device, etc. 4M fluctuations scheduled in advance, equipment troubles, etc., accidental 4M fluctuations due to unforeseen causes, and other causes cannot be specified. This includes variations in process conditions, etc.
- the production volume in this case is the actual value. Actual values correspond to actual production values in this disclosure.
- the present application example has a function of clarifying the actual state of the decrease in production volume, which should be preferentially eliminated, and reporting it.
- FIG. 3 shows a block diagram of the production control device 1a according to this application example.
- the production management device 1a has a data acquisition unit 11a that receives data from each device on the production line 10, and a control unit 11b that calculates and reports the best value and the actual value of the production line 10.
- the production control device 1a can output the data acquired by the data acquisition unit 11a, the best value calculated by the control unit 11b, the actual value, the contents of the report, and the contents of the report. It has an output section 11d.
- the control unit 11b further includes, as functional modules, a performance value calculation unit 110a, a best value calculation unit 110b, and a result reporting unit 110c.
- the best value calculator 110b corresponds to the actual value calculator in the present disclosure.
- the best value calculation unit 110b calculates the best value from the actual production volume, for example, as shown in FIG. outliers are excluded by the Smirnov-Grubbs test. All the data are tested until there is no outlier, and the frequency distribution when there are no outliers is taken as the frequency distribution of the best values.
- the production control device 1a outputs a report including the actual and actual values of the production volume and takt time calculated for the production line 10.
- FIG. 7 shows an example of a graph that is published when creating a description example of a report.
- a histogram of the production cycle time (takt time) before exclusion of outliers may be described as actual values.
- a histogram after exclusion of outliers such as that shown in FIG. 7B, may be described as an actual value.
- the report may also include a message such as that shown in FIG.
- the best cycle time takt time
- the actual value the ratio of the two values, and the ratio of outliers are described.
- the difference between the best value and the ideal value is described.
- the number of production may be described. More specifically, the best value and the actual value of production numbers are displayed, and the difference between the best value and the actual value and the difference between the ideal value and the best value may also be described.
- a production management system 1 includes, for example, a production line 10 as shown in FIG.
- a production line 10 in FIG. 1 is a surface mounting line for printed circuit boards.
- the production line 10 according to the present embodiment includes, in order from the upstream side, a solder printing device 10a, a post-solder printing inspection device 10b, a mounter 10c, a post-mounting inspection device 10d, a reflow furnace 10e, a post-reflow An inspection device 10f is provided.
- the solder printing device 10a is a device that prints solder paste on the electrode portion on the printed circuit board.
- the mounter 10c is a device for placing a large number of electronic components to be mounted on a printed circuit board on solder paste.
- the reflow furnace 10e is a heating device for soldering the electronic components placed on the printed circuit board to the printed wiring on the circuit board.
- Each of the inspection devices 10b, 10d, and 10f inspects the state of the printed circuit board at the exit of each process, and automatically detects defects or possible defects.
- the solder printing apparatus 10a, the mounter 10c, the reflow furnace 10e (hereinafter collectively referred to as a manufacturing apparatus), the solder printing apparatus 10b, the post-mounting inspection apparatus 10d, and the reflow inspection apparatus 10f (hereinafter referred to as these are collectively referred to as an inspection device) is connected to the production control device 1a via a network such as a LAN.
- the production control device 1a includes a CPU (processor), a main storage device (memory), an auxiliary storage device (hard disk, etc.), an input device (keyboard, mouse, controller, touch panel, etc.), an output device (display, printer, speaker, etc.), and the like. It is composed of a general-purpose computer system with
- FIG. 2 shows the production amount of printed circuit boards in two cases.
- the horizontal axis of the figure is time, which indicates a time range of, for example, one hour.
- each arrow represents the time to manufacture one substrate.
- the arrows in the upper row indicate that production is proceeding smoothly, while the arrows in the lower row indicate various troubles (including known and unknown causes) and delays caused by the so-called 4M fluctuations. A practical case is shown.
- the production volume in the case where the production is smooth as described in the upper row can be said to be the actual value of the target production line, and this production volume is called the best value in this embodiment.
- the average tact time T is 50 seconds
- FIG. 3 shows a schematic block diagram of the production control device 1a according to this embodiment.
- the production control device 1a includes a data acquisition unit 11a that receives data from each manufacturing device and each inspection device on the production line 10, and the production line 10 based on the data acquired by the data acquisition unit 11a. It has a control unit 11b that calculates and reports the best value and the actual value. It also has a storage unit 11c for storing the data acquired by the data acquisition unit 11a, the best values and performance values calculated by the control unit 11b, and the contents of reports, and an output unit 11d capable of outputting various data and report contents.
- the control unit 11b further includes, as functional modules, a performance value calculation unit 110a, a best value calculation unit 110b, and a result reporting unit 110c.
- Each functional module is implemented by, for example, a CPU (not shown) reading and executing a program stored in the storage unit 11c.
- the data acquisition unit 11a also receives information related to inspection conditions from the user, a performance value calculation command for the performance value calculation unit 110a, a best value calculation command for the best value calculation unit 110b, a report creation command for the result reporting unit 110c, and the like. is entered.
- the actual value calculation unit 110a calculates the actual value of the production amount of the production line 10 in the specified period based on the data from each manufacturing device and each inspection device acquired by the data acquisition unit 11a.
- the best value calculation unit 110b calculates the best value of the production volume of the production line 10 based on the actual values calculated by the actual value calculation unit 110a.
- the result reporting unit 110c generates a report based on the actual value of the production amount of the production line 10 calculated by the actual value calculating unit 110a and the best value of the production amount of the production line 10 calculated by the best value calculating unit 110b. created.
- FIG. 4 shows a flow chart of processing in the production control device 1a.
- step S101 data on manufacturing results and inspection results are acquired from each manufacturing apparatus and each inspection apparatus on the production line 10.
- FIG. This production record data includes log data such as the time and content of the error that occurred, and countermeasures that were taken.
- the inspection result data includes log data such as the number of occurrences of each defect item and the time of occurrence.
- the acquired data is stored in the storage unit 11c.
- step S102 the actual value of the production quantity is calculated by the actual value calculating unit 110a and stored in the storage unit 11c. In this embodiment, as the actual value, as shown in FIG.
- step S102 the number of production for each hour is calculated.
- the actual value may be stored for each hour as the production number for each hour, or may be stored as an average value of the operating time of the production line 10, for example.
- step S103 the best value of the production quantity is calculated by the best value calculator 110b and stored in the storage unit 11c.
- a general method such as the Smirnoff-Grubbs test may be used.
- a specific example of the best value calculation method will be described below.
- ⁇ Best Value Calculation Example 1> When calculating the best value, for example, as shown in FIG. 5, normal distribution and test the value to be tested-mean/standard deviation ⁇ with a significance level of 5%. Then, test only the most outlier data, and if it is determined to be an outlier, test the second outlier sample using n-1 samples excluding it, and then detect the outlier Repeat until no more. The average value of the remaining takt time is the best takt time, and the value obtained by dividing 1 hour by the best takt time is the best production volume per hour.
- FIG. 6 shows a second calculation example of the best value in this embodiment.
- the best value of the pick-up error rate when picking up a component with a pick-up nozzle (not shown) in the mounter 10c is calculated.
- the ideal value in this case error rate 0%.
- the error rate is tallied every hour, and the error rate at each hour is used as data for the test, and the test is performed. Then, the average value of the remaining adsorption error rates (%) is taken as the best value.
- FIG. 6A is a graphical representation of the method of calculating the adsorption error rate in this example.
- the horizontal axis represents time.
- the horizontal length of the quadrilaterals arranged in chronological order represents the time during which the component mounting process is performed on one substrate.
- hatched rectangles represent substrates with zero pick-up error during operation.
- the open rectangles represent substrates with pick-up errors during operation.
- the number of x's written at the bottom of the outline quadrilateral corresponds to the number of adsorption errors. In this figure, it is assumed that, for example, 20 components are mounted on one substrate, and the number of times of picking up is increased by that amount because a retry is performed when a picking error occurs once.
- FIG. 6B is a table showing the number of substrates produced (number of production), the total number of pickups, the number of errors, and the error rate at each time.
- the mounting process was performed on six substrates at 0 o'clock, and one adsorption error occurred in one substrate among them. The error rate for this time is 0.83%.
- the mounting process was performed for five substrates, and no adsorption error occurred. The error rate for this time is 0.00%.
- the mounting process was performed for 4 substrates, of which 1 substrate had 2 adsorption errors and the other 1 substrate had 3 adsorption errors, for a total of 5 adsorption errors. Occurred.
- step S104 the process proceeds to step S104.
- step S104 a report is created in a form that allows comparison between the actual values and the best values.
- the report created in step S104 will be described below.
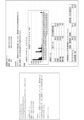
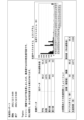
- FIG. 7 shows an example of a graph published when creating a report.
- the report includes, for example, a histogram before exclusion of outliers, in which the horizontal axis indicates the production cycle time (takt time) and the vertical axis indicates the frequency. Data analysis results are also displayed along with the histogram.
- the average tact time is 80.2 seconds
- the maximum value is 3445 seconds
- the minimum value is 43 seconds
- the number of samples is 1075. It can be seen that the actual tact time value is 80.2 seconds.
- the report also includes a histogram after outlier exclusion, as shown in FIG. 6B. From this graph, the average takt time after excluding outliers is 55.4 seconds, the maximum value is 76 seconds, the minimum value is 43 seconds, the number of samples is 923, and the best takt time is 55.4 seconds. seconds.
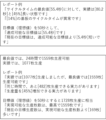
- Fig. 8 shows an example of the message described in the report.
- the upper part shows the description of the production cycle time (takt time).
- the best value and the actual value of the production cycle time (takt time), the ratio of the two values, and the ratio of outliers are described.
- the difference between the best value and the ideal value is described.
- the ideal value is a target value of the production cycle time (takt time) determined in advance for other reasons such as a business plan, regardless of the actual value of the production line 10 .
- This ideal value corresponds to the production target value in this disclosure.
- the lower part the number of manufactured products is described.
- the best value and the actual value of the number of products produced are displayed, and the difference between the best value and the actual value is described as the difference between the actual performance and the actual performance.
- the difference between the ideal value and the best value of the leading number is also described.
- step S105 the report created in step S104 is output and provided to a predetermined report destination. The method of outputting (providing) a report will be described below.
- ⁇ Report output method> As a method of outputting a report, the following methods are conceivable.
- (1) E-mail In this case, the summary of the collection period, collection target, and topics may be written in the body of the e-mail, and the report file may be attached to the e-mail (Excel file, etc.).
- FIG. 10 shows an example of report contents in the mail and an attached report file.
- the report may be viewed on a specific WEB page using a WEB browser.
- the report may be provided by embedding the report in a linkable manner in a specific web page.
- FIG. 12 shows the screen of the WEB browser.
- step S105 When the process of step S105 ends, this routine is temporarily terminated.
- Example 2 In the first embodiment described above, an example in which the best value, which is the actual value in the production line, is calculated by excluding data corresponding to statistical outliers from the data related to the actual value in the production line has been described. In this embodiment, an example will be described in which data affected by 4M fluctuation is excluded instead of excluding statistical outliers.
- FIG. 13 shows a best value calculation flowchart relating to the calculation of the best value in this embodiment.
- This flowchart is a flowchart for explaining in more detail the process corresponding to step S103 in FIG.
- step S201 data affected by 4M variation is searched for in the production of the target product. That is, from the timing at which the 4M fluctuation is implemented, data on products affected by the 4M fluctuation are searched. In this embodiment, no distinction is made as to whether the 4M fluctuation is planned in advance or accidental.
- step S202 for example, the data affected by the 4M fluctuation searched in S201 is excluded from the data for calculating the number of products produced during a predetermined period of time and the takt time.
- step S203 only the data not affected by the 4M variation obtained in step S202 are used to calculate the average values of the production quantity and the takt time.
- the number of products affected by the 4M fluctuation is subtracted from the number of products produced during the predetermined time, and the manufacturing time of the product affected by the 4M fluctuation is also subtracted from the predetermined time.
- the number of products produced per hour may be calculated by proportional calculation.
- step S204 the result calculated in step S203 is stored in the storage unit 11c as the best value.
- this flow is once terminated.
- all the 4M fluctuations related to the data excluded in step S202 may be listed when outputting a report corresponding to step S105 in FIG.
- the influence of 4M fluctuations can be excluded from the actual values, and the accuracy of the best values can be improved, and which 4M fluctuations affect the performance of the process. can be clarified.
- Example 3 In the second embodiment described above, an example is described in which the best value, which is the actual value in the production line, is calculated by excluding the data affected by the 4M fluctuation from the data related to the actual value in the production line. In this embodiment, when calculating the actual value in the production line, data that is a statistical outlier and is affected by the planned 4M fluctuation planned in advance is excluded, and then in the production line An example will be described in which data that are statistical outliers and are affected by accidental 4M fluctuations are excluded when calculating the best value.
- FIG. 14 shows a flow chart for calculating actual values and best values according to the present embodiment.
- This flowchart is a flowchart explaining in more detail the processing corresponding to steps S102 and S103 in FIG.
- step S301 data corresponding to an outlier is searched for in index data relating to the productivity or quality of the target product.
- step S302 data affected by planned 4M fluctuations scheduled in advance are searched for in the data. It should be noted that this planned 4M change corresponds to the planned condition change in this embodiment.
- step S303 out of the index data relating to the productivity or quality of the target product, the data corresponding to the outliers and having the influence of the planned 4M fluctuation planned in advance, for example, for a predetermined period of time Exclude from the data used to calculate the number of production and takt time.
- step S304 the data obtained in step S303, excluding the outliers and the data affected by the planned 4M fluctuation, is used to calculate the average values of the production quantity and the takt time.
- step S305 the calculated value is stored in the storage unit 11c as the actual value.
- step S306 the data used to calculate the actual values are further searched for data influenced by accidental 4M fluctuations that occur accidentally in the product manufacturing and inspection processes.
- this accidental 4M variation corresponds to the accidental condition change in this embodiment.
- step S307 data corresponding to outliers and affected by accidental 4M fluctuations are further excluded from the data used to calculate the actual values.
- step S308 the data obtained in step S307, excluding outliers and data affected by accidental 4M fluctuations, are used to calculate the average values of the number of production and the takt time.
- step S309 the calculated value is stored in the storage unit 11c as the best value.
- the effects of the planned 4M fluctuation and the accidental 4M fluctuation can be excluded from the actual value, and the accuracy of the best value can be improved. It is possible to clarify whether the occasional 4M variation of is affecting the best value of the process.
- planned 4M changes include model switching of products, planned maintenance, condition changes, etc.
- accidental 4M fluctuations include reel replacement of the mounter, emergency stop due to frequent mounting errors, adjustment determined by the operator, condition change determined by the operator, and the like.
- Example 4 a specific example of linking 4M fluctuation information and evaluation data will be described.
- the 4M fluctuation information and the data of each product may be linked as follows. (1) In the case of 4M fluctuation that occurred during mounting and inspection of the specified board (after the board was carried in and before it was taken out) For the production cycle time (difference between the carry-out time of the specified board and the carry-out time of the next board) , tied to the next board. In this case, the effect of 4M variation is reflected in the production cycle time of the next substrate. Also, the error rate is tied to the board.
- the influence of the 4M variation is reflected in the samples of the board (the number of mounted/tested parts and the number of error parts).
- the production cycle time (the difference between the unloading time of a given board and the unloading time of the next board) is tied to the next board.
- the effect of 4M variation is reflected in the production cycle time of the next substrate.
- the error rate the samples of the board (the number of mounted/tested parts and the number of error parts) are excluded.
- the influence of the 4M variation is reflected in the sample of the board (the number of mounted/tested parts and the number of error parts). From the above, the 4M fluctuation that occurs after a predetermined board is carried out and before the next board is carried out is linked to the next board.
- Planned equipment work maintenance, condition change, etc.
- a work plan for a device is registered in advance, the fact that some change has been made to the planned device is output from the device to the production control device 1a, and the work plan for the device is issued in the vicinity (within 30 minutes before or after). If there is, it is linked to the board immediately after that time in that device.
- the worker registers in the production control device 1a that the planned work has been carried out through the terminal, and links it to the board of the device immediately after that time.
- a work plan for a device is registered in advance, the fact that some change has been made to the planned device is output from the device to the production control device 1a, and the work plan for the device is issued in the vicinity (within 30 minutes before or after). If not, it is linked to the board immediately after that time in that device.
- the worker registers in the production control device 1a that he/she has performed an unplanned work, and associates it with the board of the device immediately after that time. Note that the board immediately after is not specified as within a certain number of minutes, but may refer to the oldest board after that time.
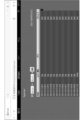
- FIG. 15 shows the data for substrate serial numbers 1-8.
- the data for board serial number 3 is an outlier but does not have 4M variation, so it is not excluded from the sample.
- the data for board serial number 5 is an occasional variation and an outlier, but is not excluded from the sample.
- the data for board serial number 7 is excluded from the sample because it is both a planned variation and an outlier. Then, the actual value is calculated based on the data of the remaining substrates.
- substrate serial number 3 is an outlier, but it is not excluded because there is no 4M fluctuation (this may be excluded to calculate the best value. In this case, , the details of improvement are unknown and cannot be presented.
- the best value is defined as a target value that can be achieved if the room for improvement is eliminated, although the points to be improved are unknown at this time.
- substrate serial number 4 is an accidental variation, but is not an outlier, so it is not excluded from the sample.
- Substrate serial number 5 is a random variation and an outlier, so it is excluded from the sample. Then, the actual value is calculated with the remaining substrate.
- the definition of the best value is a target value that can be achieved if improvement points are known and resolved.
- the actual value is calculated by excluding the sample that was affected by the planned 4M fluctuation and became an outlier, and furthermore, it was affected by the accidental 4M fluctuation and was an outlier. Calculate the best value by excluding samples that do not match. As a result, the best value is calculated by excluding outlier samples affected by 4M variation.
- substrate serial number 1 in FIG. 15 does not have a previous substrate, so it is excluded from the samples.
- Substrate serial numbers 3, 5, and 7 are outliers and are excluded from the sample. Then, the actual value is calculated with the remaining substrate.
- the best value is defined as a target value that can be achieved if there is no room for improvement, although the areas for improvement are unknown at this point.
- the best value is calculated by excluding outlier samples from the process data.
- substrate serial number 1 in FIG. 16 does not have a previous substrate, so it is excluded from the samples.
- Substrate serial number 3 is an outlier, but it is not excluded because there is no 4M variation. (Although the details of improvement cannot be shown, the performance value can be calculated by excluding it.)
- Board serial number 4 has 4M fluctuation, but it is not an outlier, so it is not excluded from the sample.
- Substrate serial number 5 has 4M variation and is an outlier, so it is excluded from the sample.
- Substrate serial number 7 has 4M variation and is an outlier, so it is excluded from the sample. Then, the best value is calculated for the remaining substrates.
- planned (understood) 4M fluctuation factors are also listed as improvement targets.
- FIG. 16 shows the data for substrate serial numbers 1-8. This is an aspect that does not use outliers.
- substrate serial number 1 does not have a previous substrate, so it is excluded from the sample.
- Board serial number 5 is an accidental variation and is not excluded from the sample.
- Substrate serial number 7 is an intentional variation, so it is excluded from the sample.
- the actual values are calculated using the remaining substrates.
- board serial numbers 4 and 5 are random variations and are therefore excluded from the sample.
- the best value is calculated for the remaining substrates. In this case, the best value is defined as the target value that could be achieved if the known 4M variations were eliminated (the target value that could be achieved if the things that were better off were eliminated).
- FIG. 17A again shows the data for substrate serial numbers 1-8. Also, an example of presented sentences is shown in FIG. 17B.
- the actual value of the production cycle time is 1 minute 42 seconds
- the best value of the production cycle time is 1 minute 35 seconds
- the production cycle time can be shortened by 7 seconds
- the improvement target is " The point that it is "reel replacement" is described.
- the improvement targets are “reel replacement (total 12 times)” and “frequent error stoppage (total 4 times)” along with the number of times.
- the improvement target may be presented together with the total time, such as “reel replacement (total 22 minutes 32 seconds)” and “error-prone stop (total 5 minutes 16 seconds)".
- the total time is the sum of "values of excluded samples minus best value” (longer due to 4M variation).
- the improvement target may be presented together with the number of times and the total time, such as “reel replacement (total 12 times, 22 minutes and 32 seconds)” and “error-prone stop (total 4 times, 5 minutes and 16 seconds)”.
- FIG. 18A An example of presented text is shown in FIG. 18A.
- the actual value of the production cycle time is 1 minute 42 seconds
- the best value of the production cycle time is 1 minute 35 seconds
- the production cycle time can be shortened by 7 seconds
- the improvement target is "reel The point that it is "exchange” is presented.
- the improvement target as shown in FIG. 18B, specific work may be registered in the system in advance and additionally presented as an example.
- a production control method characterized in that it is an index related to the productivity or quality of the product, which is calculated by excluding data of the index affected by a predetermined condition change in the above.
- the actual production value is the data of the index corresponding to a statistical outlier in the distribution of the actual production value from the data of the index relating to the productivity or quality of the product in the production line and/or the production line. is an index related to
- Production control system 1a Production control device 10 Production line 10a Solder printing device 10b Post-solder printing inspection device 10c Mounter 10d Post-mounting inspection device 10e Reflow furnace 10f Post-reflow inspection device 11a Data acquisition unit 11b Control unit 11c Storage unit 11d Output unit 110a Actual value calculation unit 110b Best value calculation unit 110c Result reporting unit
Landscapes
- Business, Economics & Management (AREA)
- Engineering & Computer Science (AREA)
- Human Resources & Organizations (AREA)
- Economics (AREA)
- Strategic Management (AREA)
- Physics & Mathematics (AREA)
- General Physics & Mathematics (AREA)
- Entrepreneurship & Innovation (AREA)
- Educational Administration (AREA)
- Development Economics (AREA)
- General Business, Economics & Management (AREA)
- Quality & Reliability (AREA)
- Marketing (AREA)
- Theoretical Computer Science (AREA)
- Tourism & Hospitality (AREA)
- Manufacturing & Machinery (AREA)
- Game Theory and Decision Science (AREA)
- Operations Research (AREA)
- General Health & Medical Sciences (AREA)
- Health & Medical Sciences (AREA)
- Primary Health Care (AREA)
- General Engineering & Computer Science (AREA)
- Automation & Control Theory (AREA)
- Management, Administration, Business Operations System, And Electronic Commerce (AREA)
- General Factory Administration (AREA)
- Testing And Monitoring For Control Systems (AREA)
- Supply And Installment Of Electrical Components (AREA)
Abstract
Description
単一または複数の製造装置及び検査装置を有し、前記製造装置及び検査装置による製品の製造工程及び検査工程が実行される生産ラインに係る生産管理システムであって、
前記生産ラインにおける前記製品の生産性または品質に係る指標の実績値である生産実績値を算出する実績値算出部と、
前記実績値に基づいて、前記生産ラインにおける前記製品の生産性または品質に係る指標の実力値である生産実力値を算出する実力値算出部と、
を備え、
前記生産実力値は、前記生産ラインにおける前記製品の生産性または品質に係る指標のデータから、該生産実績値の分布における統計上の外れ値に相当する前記指標のデータおよび/または、前記生産ラインにおける所定の条件変更の影響を受けた前記指標のデータを除外して算出された、前記製品の生産性または品質に係る指標であることを特徴とする。
生産ラインにおける製品の生産性または品質に係る指標のデータから、生産実績値の分布における統計上の外れ値に相当する指標のデータおよび/または、生産ラインにおける所定の条件変更の影響を受けた指標のデータを除外して算出された、製品の生産性または品質に係る指標である生産実力値を取得することができる。
前記実績値算出部は、前記生産ラインにおける前記製品の生産性または品質に係る指標のデータから、該生産実績値の分布における統計上の外れ値に相当し、且つ、前記生産ラインにおける計画的条件変更の影響を受けた前記指標のデータを除外して、前記生産実績値を算出し、
前記実力値算出部は、前記生産実績値の算出に使用した前記製品の生産性または品質に係る指標のデータから、さらに、該生産実績値の分布における統計上の外れ値に相当し、且つ、前記生産ラインにおける偶発的条件変更の影響を受けた前記指標のデータを除外して、前記生産実力値を算出することにしてもよい。予め予定された計画的条件変更の影響を除外して生産実績値を算出することができるとともに、さらに、偶発的条件変更の影響を除外して生産実力値を算出することができる。これによれば、要因分析をし易い形で、生産実績値と生産実力値を算出することが可能である。
前記結果報告部は、前記実力値算出部が、前記生産実力値を算出する際に除外した前記指標のデータに係る、前記偶発的条件変更の内容を含んで報告するようにしてもよい。生産実績値と生産実力値の差が生じる原因を明確にすることができ、生産実績値を生産目標値に近づけるための対策を明確に把握することが可能となる。
前記生産ラインにおける前記製品の生産性または品質に係る指標の実績値である生産実績値を算出する実績値算出工程と、
前記実績値に基づいて、前記生産ラインにおける前記製品の生産性または品質に係る指標の実力値である生産実力値を算出する実力値算出工程と、
を有し、
前記生産実力値は、前記生産ラインにおける前記製品の生産性または品質に係る指標のデータから、該生産実績値の分布における統計上の外れ値に相当する前記指標のデータおよび/または、前記生産ラインにおける所定の条件変更の影響を受けた前記指標のデータを除外して算出された、前記製品の生産性または品質に係る指標であることを特徴とする、生産管理方法であってもよい。
前記実績値算出工程においては、前記生産ラインにおける前記製品の生産性または品質に係る指標のデータから、該生産実績値の分布における統計上の外れ値に相当し、且つ、前記生産ラインにおける計画的条件変更の影響を受けた前記指標のデータを除外して、前記生産実績値を算出し、
前記実力値算出工程においては、前記生産実績値の算出に使用した前記製品の生産性または品質に係る指標のデータから、さらに、該生産実績値の分布における統計上の外れ値に相当し、且つ、前記生産ラインにおける偶発的条件変更の影響を受けた前記指標のデータを除外して、前記生産実力値を算出することを特徴とする、上記の生産管理方法であってもよい。
前記結果報告工程においては、前記実力値算出工程において、前記生産実力値を算出する際に除外した前記指標のデータに係る、前記偶発的条件変更の内容を含んで報告することを特徴とする、上記の生産管理方法であってもよい。これにより、実績値を実力値に近づけるための対策箇所を明確にすることが可能である。
前記生産ラインにおける前記製品の生産性または品質に係る指標の実績値である生産実績値を算出する実績値算出ステップと、 前記実績値に基づいて、前記生産ラインにおける前記製品の生産性または品質に係る指標の実力値である生産実力値を算出する実力値算出ステップと、
を実行させ、
前記生産実力値は、前記生産ラインにおける前記製品の生産性または品質に係る指標のデータから、該生産実績値の分布における統計上の外れ値に相当する前記指標のデータおよび/または、前記生産ラインにおける所定の条件変更の影響を受けた前記指標のデータを除外して算出された、前記製品の生産性または品質に係る指標であることを特徴とする、プログラムであってもよい。
前記実績値算出ステップにおいては、前記生産ラインにおける前記製品の生産性または品質に係る指標のデータから、該生産実績値の分布における統計上の外れ値に相当し、且つ、前記生産ラインにおける計画的条件変更の影響を受けた前記指標のデータを除外して、前記生産実績値を算出し、
前記実力値算出ステップにおいては、前記生産実績値の算出に使用した前記製品の生産性または品質に係る指標のデータから、さらに、該生産実績値の分布における統計上の外れ値に相当し、且つ、前記生産ラインにおける偶発的条件変更の影響を受けた前記指標のデータを除外して、前記生産実力値を算出することを特徴とする、上記のプログラムであってもよい。
本発明が適用される生産ライン10は、図1に示すように、はんだ印刷装置10a、はんだ印刷後検査装置10b、マウンタ10c、マウント後検査装置10d、リフロー炉10e、リフロー後検査装置10fを含む。生産ライン10における各装置は、LANなどのネットワークを介して生産管理装置1aに接続されている。生産管理装置1aは、汎用的なコンピュータシステムにより構成される。
本発明に係る生産管理システム1は例えば、図1に示すような生産ライン10を含み、この生産ライン10の生産管理を行う。図1における生産ライン10は、プリント基板の表面実装ラインである。図1に示すように、本実施例に係る生産ライン10には、上流側から順に、はんだ印刷装置10a、はんだ印刷後検査装置10b、マウンタ10c、マウント後検査装置10d、リフロー炉10e、リフロー後検査装置10fが設けられている。
最良値を算出する際には、例えば、図5に示したように、ステップS102で算出される生産数の実績値に係る、各製造物(基板)のタクトタイムのヒストグラムに対して、正規分布を仮定し、検定対象の値-平均値/標準偏差σを、優位水準を5%として検定する。そして、最も外れた1データのみを検定し、それが外れ値と判定されたら、それを除外したn-1個の標本を用いて2番目に外れた標本を検定し、以下、外れ値が検出されなくなるまで繰り返す。その結果残ったタクトタイムの平均値が、タクトタイムの最良値であり、1時間をタクトタイムの最良値で除した値が、1時間あたりの生産数の最良値となる。
図6には、本実施形態における最良値の2番目の算出例について示す。この例においては、例えばマウンタ10cにおける吸着ノズル(不図示)によって部品を吸着する際の吸着エラー率の最良値を算出する。この場合の理想値=エラー率0%である。実績値は例えば1時間毎の吸着エラー率(%)=(エラー数/吸着回数)とする。そして、1時間毎にエラー率集計を行い、各時間におけるエラー率を検定に係るデータとして検定を行う。そして、最終的に残った吸着エラー率(%)の平均値を最良値とする。
図7には、レポートの作成時に掲載されるグラフの例を示す。レポートには、図7あに示すように、例えば横軸に生産サイクルタイム(タクトタイム)、縦軸に度数を記載した、外れ値の除外前のヒストグラムが記載される。また、ヒストグラムとともにデータの解析結果が表示される。この例では、タクトタイムの平均値が80.2秒、最大値が3445秒、最小値が43秒、サンプル数1075となっており、タクトタイムの実績値が80.2秒であることが分かる。また、レポートには、図6Bに示されるような、外れ値除外後のヒストグラムも記載される。このグラフからは、タクトタイムの外れ値除外後の平均値が55.4秒、最大値が76秒、最小値が43秒、サンプル数923となっており、タクトタイムの最良値が55.4秒であることが分かる。
レポート出力の方法としては、以下のものが考えられる。
(1)電子メール
この場合には、メール本文に、集計期間・集計対象とトピックスの概要を記載し、レポートファイルはメールに添付(Excelファイル等)してもよい。図10には、メールにおけるレポート内容と、添付されるレポートファイルの例を示す。
この場合には、特定のURLにおいて作成日毎のレポートをダウンロード可能にしておく。これにより、レポートの提供先のユーザが何時でも、当該URLにアクセスすることでレポートを取得可能にすることができる。図11には、ダウンロード画面の例を示す。この例では全稼働日毎にエクセルファイルによるレポートがダウンロード可能となっている。
また、レポートについて、WEBブラウザを用いて特定のWEBページで閲覧可能としてもよい。また、特定のWEBページにリンク可能にレポートをリンク可能に埋め込んでおくことで提供しても構わない。図12では、WEBブラウザの画面を示す。
上記の実施例1においては、生産ラインにおける実力値である最良値を、生産ラインにおける実績値に係るデータから、統計上の外れ値に相当するデータを除外することによって算出する例について説明した。本実施例においては、統計上の外れ値を除外するのではなく、4M変動の影響するデータを除外する例について説明する。
上記の実施例2においては、生産ラインにおける実力値である最良値を、生産ラインにおける実績値に係るデータから、4M変動の影響を受けたデータを除外することによって算出する例について説明した。本実施例においては、生産ラインにおける実績値を算出する際に、統計上の外れ値で且つ、予め予定された計画的な4M変動の影響を受けたデータを除外し、次に、生産ラインにおける最良値を算出する際には、統計上の外れ値で且つ、偶発的な4M変動の影響を受けたデータを除外する例について説明する。
次に、実施例4として、4M変動情報と評価データの紐付けの具体例について説明する。
(4M変動情報と評価データの紐付け)
4M変動の情報と各製品のデータとは、具体的には、以下のように紐づけても良い。
(1)所定の基板の実装・検査中(基板搬入後、搬出までの間)に発生した4M変動の場合
生産サイクルタイム(所定の基板の搬出時刻と次の基板の搬出時刻の差分)については、次の基板に紐付ける。この場合には、4M変動の影響は次の基板の生産サイクルタイムに反映される。また、エラー率については、当該基板に紐づける。この場合には、4M変動の影響は当該基板のサンプル(実装・検査数部品数とエラー部品数)に反映される。
(2)上記以外(実装・検査中以外)に発生した4M変動の場合
生産サイクルタイム(所定の基板の搬出時刻と次の基板の搬出時刻の差分)については、次の基板に紐付ける。この場合には、4M変動の影響は次の基板の生産サイクルタイムに反映される。また、エラー率については、当該基板のサンプル(実装・検査数部品数とエラー部品数)を除外する。この場合には、4M変動の影響はその基板のサンプル(実装・検査数部品数とエラー部品数)に反映される。
上記より、所定の基板の搬出後、次の基板の搬出までに発生した4M変動は、次の基板に紐付けるようにする。
次に、4M変動情報の分類と、4M変動の種類毎の取得方法の例について説明する。
(1)計画的な4M変動
(1-1)製品の機種切り替え(段取り替え)
実装・検査データからプログラム名を取得し(装置ごとに、古いものから処理していく前提)、1つ前の基板からプログラム名が変わった時、当該基板に紐付ける。また、実装
機・検査機のプログラムが入れ替えられたという情報(入れ替え後のプログラム名と時刻)については、当該情報を装置から生産管理装置1aに出力し、その装置の、その時刻の直後の基板に紐付ける。
(1-2)計画的な装置への作業(メンテナンス、条件変更など)
装置に対する作業計画をあらかじめ登録しておき、計画装置に対して何らかの変更が行われたことを装置から生産管理装置1aに出力し、その装置に対する作業計画がその近傍(前後30分以内など)にあれば、その装置の、その時刻の直後の基板に紐付ける。また、計画的な作業を行ったことを作業者が端末で生産管理装置1aに登録し、その装置の、その時刻の直後の基板に紐付ける。
(2)偶発的な4M変動
(2-1)マウンタのリール交換
実装データからフィーダに装着されたリールIDを取得し(装置ごとに、古いものから処理していく前提)、1つ前の基板、または今の基板の途中からリールIDが変わった時、当該基板に紐付ける。また、実装機でフィーダの付け外しが行われたという情報をリールIDと共に装置から生産管理装置1aに出力し、リールIDが変わっていた時、その装置の、その時刻の直後の基板に紐付ける。
(2-2)実装エラー多発による緊急停止
実装機が停止したという情報を装置から生産管理装置1aに出力し、その装置の、その時刻の直後の基板に紐付ける。
(2-3)計画にない装置への作業(作業者の判断による調整、条件変更等)
装置に対する作業計画をあらかじめ登録しておき、計画装置に対して何らかの変更が行われたことを装置から生産管理装置1aに出力し、その装置に対する作業計画がその近傍(前後30分以内など)になければ、その装置の、その時刻の直後の基板に紐付ける。また、計画にない作業を行ったことを作業者が端末で生産管理装置1aに登録し、その装置の、その時刻の直後の基板に紐付ける。なお、直後の基板とは何分以内という特定ではなく、その時刻より後で最も古いものを指してもよい。
以下、より具体的な例として、生産サイクルタイムを製品の生産性または品質に係る指標とし、(実績値および)最良値を算出する場合の、各基板についてのデータの扱いの態様について説明する。
〔第1の態様〕
図15には、基板連番1~8のデータについて示す。この場合、最良値を算出する場合には、基板連番1のデータは前の基板がないので、統計上のサンプルから除外する。基板連番3のデータは、外れ値だが4M変動がないので、サンプルから除外しない。基板連番5のデータは、偶発的変動かつ外れ値だが、サンプルから除外しない。基板連番7のデータは、計画的変動かつ外れ値なので、サンプルから除外する。そして、残った基板のデータにより、実績値を算出する。
次に、生産サイクルタイムを指標とし、最良値を算出する場合の、データの扱いの第2の態様について説明する。これは外れ値を除外する態様である。ここでは、図15における基板連番1は前の基板がないので、サンプルから除外する。基板連番3、5、7は外れ値なので、サンプルから除外する。そして、残った基板で、実力値を算出する。この場合には、最良値は、改善個所は現時点では不明だが、改善の余地をつぶしたら達成できるであろう目標値という定義になる。
次に、生産サイクルタイムを指標とし、最良値を算出する場合の、データの扱いの第3の態様について説明する。これは4M変動を計画的か偶発的かで区別しない態様である。ここでは、図16における、基板連番1は前の基板がないので、サンプルから除外する。基板連番3は外れ値だが4M変動がないので除外しない。(改善内容は示せないが、除外して実力値を計算してもよい。)基板連番4は4M変動ありだが、外れ値でないので、サンプルから除外しない。基板連番5は4M変動あり且つ外れ値なので、サンプルから除外する。基板連番7は4M変動ありかつ外れ値なので、サンプルから除外する。そして、残った基板で、最良値を算出する。この態様では、計画的(把握済)の4M変動要因も改善対象として列挙する。
次に、生産サイクルタイムを指標とし、最良値を算出する場合の、データの扱いの第4の態様について説明する。図16には、基板連番1~8のデータについて示す。これは外れ値を使用しない態様である。ここでは、基板連番1は前の基板がないので、サンプルから除外する。基板連番5は偶発的変動なので、サンプルから除外しない。基板連番7は計画的変動なので、サンプルから除外する。そして、残った基板で、実績値を算出する。さらに、(上に加えて)基板連番4、5は偶発的変動なので、サンプルから除外する。そして、残った基板で、最良値を算出する。この場合、最良値は、わかっている4M変動をなくしたら達成できるであろう目標値(ない方が良いものをなくした場合に達成できる目標値)という定義となる。
次に、改善対象の提示について説明する。ここでは、生産サイクルタイムを指標とし、最良値を算出する場合の、データの扱いの第1の態様において最良値を算出する際に除外したサンプルの4M変動(リール交換)を改善対象として提示する。図17Aには、基板連番1~8のデータについて改めて示す。また、提示される文章の例を図17Bに示す。掲示文としては、生産サイクルタイムの実績値が1分42秒である点、生産サイクルタイムの最良値が1分35秒である点、生産サイクルタイムを7秒短縮可能であり、改善対象は「リール交換」である点、が記載されている。また、改善対象は「リール交換(合計12回)」で「エラー多発停止(合計4回)」である点を回数とともに提示してもよい。また、改善対象は「リール交換(合計22分32秒)」「エラー多発停止(合計5分16秒)」というように、合計時間とともに提示してもよい。ここで合計時間は、「除外したサンプルの値-最良値」の合計(4M変動によって長くなった分)である。さらに、改善対象は「リール交換(合計12回・22分32秒)」「エラー多発停止(合計4回・5分16秒)」というように、回数と合計時間とともに提示してもよい。
次に、改善対象の提示に関する別の態様について説明する。提示される文章の例を図18Aに示す。ここでは、生産サイクルタイムの実績値が1分42秒である点、生産サイクルタイムの最良値が1分35秒である点、生産サイクルタイムを7秒短縮可能である点、改善対象は「リール交換」である点が提示されている。ここで、改善対象については、図18Bに示すように、予め具体的な作業をシステムに登録しておき、それを例として追加で提示してもよい。
<付記1>
単一または複数の製造装置及び検査装置を有し、前記製造装置及び検査装置による製品の製造工程及び検査工程が実行される生産ライン(10)に係る生産管理システム(1)であって、
前記生産ライン(10)における前記製品の生産性または品質に係る指標の実績値である生産実績値を算出する実績値算出部(110a)と、
前記実績値に基づいて、前記生産ラインにおける前記製品の生産性または品質に係る指標の実力値である生産実力値を算出する実力値算出部(110a)と、
を備え、
前記生産実力値は、前記生産ラインにおける前記製品の生産性または品質に係る指標のデータから、該生産実績値の分布における統計上の外れ値に相当する前記指標のデータおよび/または、前記生産ラインにおける所定の条件変更の影響を受けた前記指標のデータを除外して算出された、前記製品の生産性または品質に係る指標であることを特徴とする、生産管理システム(1)。
<付記6>
単一または複数の製造装置及び検査装置を有し、前記製造装置及び検査装置による製品の製造工程及び検査工程が実行される生産ライン(10)における生産管理方法であって、
前記生産ライン(10)における前記製品の生産性または品質に係る指標の実績値である生産実績値を算出する実績値算出工程(S102)と、
前記実績値に基づいて、前記生産ラインにおける前記製品の生産性または品質に係る指標の実力値である生産実力値を算出する実力値算出工程(S103)と、
を有し、
前記生産実力値は、前記生産ラインにおける前記製品の生産性または品質に係る指標のデータから、該生産実績値の分布における統計上の外れ値に相当する前記指標のデータおよび/または、前記生産ラインにおける所定の条件変更の影響を受けた前記指標のデータを除外して算出された、前記製品の生産性または品質に係る指標であることを特徴とする、生産管理方法。
<付記11>
単一または複数の製造装置及び検査装置を有し、前記製造装置及び検査装置による製品の製造工程及び検査工程が実行される生産ライン(10)に対して、コンピュータ(1a)に、
前記生産ラインにおける前記製品の生産性または品質に係る指標の実績値である生産実績値を算出する実績値算出ステップ(S102)と、
前記実績値に基づいて、前記生産ラインにおける前記製品の生産性または品質に係る指標の実力値である生産実力値を算出する実力値算出ステップ(S103)と、
を実行させ、
前記生産実力値は、前記生産ラインにおける前記製品の生産性または品質に係る指標のデータから、該生産実績値の分布における統計上の外れ値に相当する前記指標のデータおよび/または、前記生産ラインにおける所定の条件変更の影響を受けた前記指標のデータを除外して算出された、前記製品の生産性または品質に係る指標であることを特徴とする、プログラム。
1a・・・生産管理装置
10・・・生産ライン
10a・・・はんだ印刷装置
10b・・・はんだ印刷後検査装置
10c・・・マウンタ
10d・・・マウント後検査装置
10e・・・リフロー炉
10f・・・リフロー後検査装置
11a・・・データ取得部
11b・・・制御部
11c・・・記憶部
11d・・・出力部
110a・・・実績値算出部
110b・・・最良値算出部
110c・・・結果報告部
Claims (12)
- 単一または複数の製造装置及び検査装置を有し、前記製造装置及び検査装置による製品の製造工程及び検査工程が実行される生産ラインに係る生産管理システムであって、
前記生産ラインにおける前記製品の生産性または品質に係る指標の実績値である生産実績値を算出する実績値算出部と、
前記実績値に基づいて、前記生産ラインにおける前記製品の生産性または品質に係る指標の実力値である生産実力値を算出する実力値算出部と、
を備え、
前記生産実力値は、前記生産ラインにおける前記製品の生産性または品質に係る指標のデータから、該生産実績値の分布における統計上の外れ値に相当する前記指標のデータおよび/または、前記生産ラインにおける所定の条件変更の影響を受けた前記指標のデータを除外して算出された、前記製品の生産性または品質に係る指標であることを特徴とする、生産管理システム。 - 前記所定の条件変更は、前記生産ラインに対して予め計画された計画的条件変更と、前記生産ラインにおいて偶発的に発生する偶発的条件変更とを含み、
前記実績値算出部は、前記生産ラインにおける前記製品の生産性または品質に係る指標のデータから、該生産実績値の分布における統計上の外れ値に相当し、且つ、前記生産ラインにおける計画的条件変更の影響を受けた前記指標のデータを除外して、前記生産実績値を算出し、
前記実力値算出部は、前記生産実績値の算出に使用した前記製品の生産性または品質に係る指標のデータから、さらに、該生産実績値の分布における統計上の外れ値に相当し、且つ、前記生産ラインにおける偶発的条件変更の影響を受けた前記指標のデータを除外して、前記生産実力値を算出することを特徴とする、請求項1に記載の生産管理システム。 - 前記生産ラインにおける前記製品の生産性または品質に係る指標は、前記製品の所定時間あたりの生産量、前記製品の製造タクトタイム、および前記製品のエラー率のうち少なくとも一つを含むことを特徴とする、請求項1または2に記載の生産管理システム。
- 所定期間における前記生産実績値と前記生産実力値とを比較可能な結果報告を作成する結果報告部を、さらに備えることを特徴とする、請求項1から3のいずれか一項に記載の生産管理システム。
- 所定期間における前記生産実績値と前記生産実力値とを比較可能な結果報告を作成する結果報告部を、さらに備え、
前記結果報告部は、前記実力値算出部が、前記生産実力値を算出する際に除外した前記指標のデータに係る、前記偶発的条件変更の内容を含んで報告することを特徴とする、請求項2に記載の生産管理システム。 - 単一または複数の製造装置及び検査装置を有し、前記製造装置及び検査装置による製品の製造工程及び検査工程が実行される生産ラインにおける生産管理方法であって、
前記生産ラインにおける前記製品の生産性または品質に係る指標の実績値である生産実績値を算出する実績値算出工程と、
前記実績値に基づいて、前記生産ラインにおける前記製品の生産性または品質に係る指標の実力値である生産実力値を算出する実力値算出工程と、
を有し、
前記生産実力値は、前記生産ラインにおける前記製品の生産性または品質に係る指標のデータから、該生産実績値の分布における統計上の外れ値に相当する前記指標のデータおよび/または、前記生産ラインにおける所定の条件変更の影響を受けた前記指標のデータを除外して算出された、前記製品の生産性または品質に係る指標であることを特徴とする、生産管理方法。 - 前記所定の条件変更は、前記生産ラインに対して予め計画された計画的条件変更と、前記生産ラインにおいて偶発的に発生する偶発的条件変更とを含み、
前記実績値算出工程においては、前記生産ラインにおける前記製品の生産性または品質に係る指標のデータから、該生産実績値の分布における統計上の外れ値に相当し、且つ、前記生産ラインにおける計画的条件変更の影響を受けた前記指標のデータを除外して、前記生産実績値を算出し、
前記実力値算出工程においては、前記生産実績値の算出に使用した前記製品の生産性または品質に係る指標のデータから、さらに、該生産実績値の分布における統計上の外れ値に相当し、且つ、前記生産ラインにおける偶発的条件変更の影響を受けた前記指標のデータを除外して、前記生産実力値を算出することを特徴とする、請求項6に記載の生産管理方法。 - 前記生産ラインにおける前記製品の生産性または品質に係る指標は、前記製品の所定時間あたりの生産量、前記製品の製造タクトタイム、および前記製品のエラー率のうち少なくとも一つを含むことを特徴とする、請求項6または7に記載の生産管理方法。
- 前記生産実績値と前記生産実力値とを比較可能な結果報告を作成する結果報告工程を、さらに有することを特徴とする、請求項6から8のいずれか一項に記載の生産管理方法。
- 前記生産実績値と前記生産実力値とを比較可能な結果報告を作成する結果報告工程を、さらに有し、
前記結果報告工程においては、前記実力値算出工程において、前記生産実力値を算出する際に除外した前記指標のデータに係る、前記偶発的条件変更の内容を含んで報告することを特徴とする、請求項7に記載の生産管理方法。 - 単一または複数の製造装置及び検査装置を有し、前記製造装置及び検査装置による製品の製造工程及び検査工程が実行される生産ラインに対して、コンピュータに、
前記生産ラインにおける前記製品の生産性または品質に係る指標の実績値である生産実績値を算出する実績値算出ステップと、
前記実績値に基づいて、前記生産ラインにおける前記製品の生産性または品質に係る指標の実力値である生産実力値を算出する実力値算出ステップと、
を実行させ、
前記生産実力値は、前記生産ラインにおける前記製品の生産性または品質に係る指標のデータから、該生産実績値の分布における統計上の外れ値に相当する前記指標のデータおよび/または、前記生産ラインにおける所定の条件変更の影響を受けた前記指標のデータを除外して算出された、前記製品の生産性または品質に係る指標であることを特徴とする、プログラム。 - 前記所定の条件変更は、前記生産ラインに対して予め計画された計画的条件変更と、前記生産ラインにおいて偶発的に発生する偶発的条件変更とを含み、
前記実績値算出ステップにおいては、前記生産ラインにおける前記製品の生産性または品質に係る指標のデータから、該生産実績値の分布における統計上の外れ値に相当し、且つ、前記生産ラインにおける計画的条件変更の影響を受けた前記指標のデータを除外して、前記生産実績値を算出し、
前記実力値算出ステップにおいては、前記生産実績値の算出に使用した前記製品の生産性または品質に係る指標のデータから、さらに、該生産実績値の分布における統計上の外れ値に相当し、且つ、前記生産ラインにおける偶発的条件変更の影響を受けた前記指標のデータを除外して、前記生産実力値を算出することを特徴とする、請求項11に記載のプログラム。
Priority Applications (3)
| Application Number | Priority Date | Filing Date | Title |
|---|---|---|---|
| DE112023001000.5T DE112023001000T5 (de) | 2022-02-18 | 2023-02-06 | Produktionsmanagementsystem, produktionsmanagementverfahren und -programm |
| CN202380019242.2A CN118647950A (zh) | 2022-02-18 | 2023-02-06 | 生产管理系统、生产管理方法以及程序 |
| US18/834,281 US20250155881A1 (en) | 2022-02-18 | 2023-02-06 | Production management system, production management method, and program |
Applications Claiming Priority (2)
| Application Number | Priority Date | Filing Date | Title |
|---|---|---|---|
| JP2022-024111 | 2022-02-18 | ||
| JP2022024111A JP7803160B2 (ja) | 2022-02-18 | 2022-02-18 | 生産管理システム、生産管理方法、及びプログラム |
Publications (1)
| Publication Number | Publication Date |
|---|---|
| WO2023157697A1 true WO2023157697A1 (ja) | 2023-08-24 |
Family
ID=87578586
Family Applications (1)
| Application Number | Title | Priority Date | Filing Date |
|---|---|---|---|
| PCT/JP2023/003840 Ceased WO2023157697A1 (ja) | 2022-02-18 | 2023-02-06 | 生産管理システム、生産管理方法、及びプログラム |
Country Status (5)
| Country | Link |
|---|---|
| US (1) | US20250155881A1 (ja) |
| JP (1) | JP7803160B2 (ja) |
| CN (1) | CN118647950A (ja) |
| DE (1) | DE112023001000T5 (ja) |
| WO (1) | WO2023157697A1 (ja) |
Families Citing this family (3)
| Publication number | Priority date | Publication date | Assignee | Title |
|---|---|---|---|---|
| JP2020054702A (ja) * | 2018-10-03 | 2020-04-09 | 株式会社三洋物産 | 遊技機 |
| JP7358731B2 (ja) * | 2018-10-03 | 2023-10-11 | 株式会社三洋物産 | 遊技機 |
| CN120408040A (zh) * | 2025-06-30 | 2025-08-01 | 广东翔晟箱配科技有限公司 | 一种生产进度数据采集方法及系统 |
Citations (6)
| Publication number | Priority date | Publication date | Assignee | Title |
|---|---|---|---|---|
| JP2008027150A (ja) * | 2006-07-20 | 2008-02-07 | Nippon Steel Corp | 製造負荷予測装置、製造負荷予測方法、コンピュータプログラム、及びコンピュータ読み取り可能な記憶媒体 |
| JP2009265699A (ja) * | 2008-04-21 | 2009-11-12 | Nippon Steel Corp | 処理時間予測装置、方法、プログラム、及びコンピュータ読み取り可能な記憶媒体 |
| JP2014085815A (ja) * | 2012-10-23 | 2014-05-12 | Omron Corp | 常態監視装置、常態監視システム、常態監視方法、プログラムおよび記憶媒体 |
| JP2019075163A (ja) * | 2019-01-08 | 2019-05-16 | ヤフー株式会社 | 推定装置、推定方法、及び推定プログラム |
| JP2020119491A (ja) * | 2019-01-24 | 2020-08-06 | 三菱電機株式会社 | 納期予測装置、納期予測方法及びプログラム |
| JP2020160638A (ja) * | 2019-03-26 | 2020-10-01 | パナソニックIpマネジメント株式会社 | 生産管理装置および生産計画作成方法 |
Family Cites Families (6)
| Publication number | Priority date | Publication date | Assignee | Title |
|---|---|---|---|---|
| JP2002333919A (ja) * | 2001-05-11 | 2002-11-22 | Sony Corp | 生産管理システムの判定値算出装置、方法及び記録媒体 |
| JP2003122420A (ja) | 2001-10-11 | 2003-04-25 | Ricoh Elemex Corp | 生産管理システムおよびコンピュータが実行するためのプログラム |
| JP2003187069A (ja) | 2001-12-21 | 2003-07-04 | Fujitsu Ten Ltd | 品質問題フォロー方法およびシステム |
| JP7214417B2 (ja) * | 2018-09-20 | 2023-01-30 | 株式会社Screenホールディングス | データ処理方法およびデータ処理プログラム |
| JP2021033729A (ja) * | 2019-08-27 | 2021-03-01 | 株式会社日立製作所 | 情報処理装置、情報処理方法、および情報処理プログラム |
| JP2021192137A (ja) * | 2020-06-05 | 2021-12-16 | アズビル株式会社 | 品質影響因子特定支援装置および方法 |
-
2022
- 2022-02-18 JP JP2022024111A patent/JP7803160B2/ja active Active
-
2023
- 2023-02-06 US US18/834,281 patent/US20250155881A1/en active Pending
- 2023-02-06 CN CN202380019242.2A patent/CN118647950A/zh active Pending
- 2023-02-06 DE DE112023001000.5T patent/DE112023001000T5/de active Pending
- 2023-02-06 WO PCT/JP2023/003840 patent/WO2023157697A1/ja not_active Ceased
Patent Citations (6)
| Publication number | Priority date | Publication date | Assignee | Title |
|---|---|---|---|---|
| JP2008027150A (ja) * | 2006-07-20 | 2008-02-07 | Nippon Steel Corp | 製造負荷予測装置、製造負荷予測方法、コンピュータプログラム、及びコンピュータ読み取り可能な記憶媒体 |
| JP2009265699A (ja) * | 2008-04-21 | 2009-11-12 | Nippon Steel Corp | 処理時間予測装置、方法、プログラム、及びコンピュータ読み取り可能な記憶媒体 |
| JP2014085815A (ja) * | 2012-10-23 | 2014-05-12 | Omron Corp | 常態監視装置、常態監視システム、常態監視方法、プログラムおよび記憶媒体 |
| JP2019075163A (ja) * | 2019-01-08 | 2019-05-16 | ヤフー株式会社 | 推定装置、推定方法、及び推定プログラム |
| JP2020119491A (ja) * | 2019-01-24 | 2020-08-06 | 三菱電機株式会社 | 納期予測装置、納期予測方法及びプログラム |
| JP2020160638A (ja) * | 2019-03-26 | 2020-10-01 | パナソニックIpマネジメント株式会社 | 生産管理装置および生産計画作成方法 |
Also Published As
| Publication number | Publication date |
|---|---|
| CN118647950A (zh) | 2024-09-13 |
| DE112023001000T5 (de) | 2025-01-02 |
| JP2023120950A (ja) | 2023-08-30 |
| JP7803160B2 (ja) | 2026-01-21 |
| US20250155881A1 (en) | 2025-05-15 |
Similar Documents
| Publication | Publication Date | Title |
|---|---|---|
| JP7803160B2 (ja) | 生産管理システム、生産管理方法、及びプログラム | |
| CN105404243B (zh) | 工业生产线中的流程控制及制造执行系统 | |
| CN101266494B (zh) | 质量改善系统 | |
| CN106079892A (zh) | 一种pcb锡膏印刷过程质量智能监控系统及方法 | |
| CN110073396B (zh) | 数据处理装置及数据处理方法 | |
| JP7035857B2 (ja) | 検査方法、検査システム及びプログラム | |
| JP4805475B2 (ja) | 品質評価装置、品質評価方法、品質表示装置、品質表示方法および品質評価システム | |
| CN101266484A (zh) | 工序管理方法、数据登记程序以及电子装置的制造方法 | |
| JP2004214394A (ja) | 実装品質分析方法 | |
| JP3511632B2 (ja) | 実装工程不良要因分析方法 | |
| WO2023171197A1 (ja) | 生産管理システム、生産管理方法、及び生産管理プログラム | |
| US6807453B1 (en) | Method and system for evaluating a defective ratio of products | |
| CN113012097A (zh) | 图像复检方法、计算机装置及存储介质 | |
| CN116629447A (zh) | 应用于pcba产品的智能检测系统 | |
| JP2023133160A (ja) | 検査システム、aiモデルデータの管理方法及び、aiモデルデータセット | |
| JP2002251212A (ja) | 品質管理方法、同システム、および同プログラムを記録した記録媒体 | |
| CN119576748A (zh) | 程序调试方法、系统、计算机设备、存储介质及程序产品 | |
| JPH04287274A (ja) | プリント板搭載電子機器の品質情報管理システム | |
| CN116963492A (zh) | 贴片生产状况可视化展示方法、装置、设备及介质 | |
| JP2005135954A (ja) | プリント基板検査装置 | |
| JP2024129999A (ja) | 検査基準作成装置、検査管理システムおよびプログラム | |
| Silva et al. | A systematic analysis of an industrial pickup and placement production system | |
| JPH05225202A (ja) | 部品実装の品質管理方法 | |
| CN121614510A (zh) | 印刷方法及电子设备 | |
| XIN | The implementation of plan-do-check-act cycle to improve the production line productivity in surface mounted technology area of industry |
Legal Events
| Date | Code | Title | Description |
|---|---|---|---|
| 121 | Ep: the epo has been informed by wipo that ep was designated in this application |
Ref document number: 23756224 Country of ref document: EP Kind code of ref document: A1 |
|
| WWE | Wipo information: entry into national phase |
Ref document number: 202380019242.2 Country of ref document: CN |
|
| WWE | Wipo information: entry into national phase |
Ref document number: 18834281 Country of ref document: US |
|
| WWE | Wipo information: entry into national phase |
Ref document number: 112023001000 Country of ref document: DE |
|
| 122 | Ep: pct application non-entry in european phase |
Ref document number: 23756224 Country of ref document: EP Kind code of ref document: A1 |
|
| WWP | Wipo information: published in national office |
Ref document number: 18834281 Country of ref document: US |