WO2020110820A1 - 物理量測定装置 - Google Patents
物理量測定装置 Download PDFInfo
- Publication number
- WO2020110820A1 WO2020110820A1 PCT/JP2019/045178 JP2019045178W WO2020110820A1 WO 2020110820 A1 WO2020110820 A1 WO 2020110820A1 JP 2019045178 W JP2019045178 W JP 2019045178W WO 2020110820 A1 WO2020110820 A1 WO 2020110820A1
- Authority
- WO
- WIPO (PCT)
- Prior art keywords
- flow rate
- unit
- physical quantity
- waveform
- measuring device
- Prior art date
- Legal status (The legal status is an assumption and is not a legal conclusion. Google has not performed a legal analysis and makes no representation as to the accuracy of the status listed.)
- Ceased
Links
Images



Classifications
-
- G—PHYSICS
- G01—MEASURING; TESTING
- G01F—MEASURING VOLUME, VOLUME FLOW, MASS FLOW OR LIQUID LEVEL; METERING BY VOLUME
- G01F1/00—Measuring the volume flow or mass flow of fluid or fluent solid material wherein the fluid passes through a meter in a continuous flow
- G01F1/68—Measuring the volume flow or mass flow of fluid or fluent solid material wherein the fluid passes through a meter in a continuous flow by using thermal effects
- G01F1/696—Circuits therefor, e.g. constant-current flow meters
- G01F1/6965—Circuits therefor, e.g. constant-current flow meters comprising means to store calibration data for flow signal calculation or correction
-
- G—PHYSICS
- G01—MEASURING; TESTING
- G01F—MEASURING VOLUME, VOLUME FLOW, MASS FLOW OR LIQUID LEVEL; METERING BY VOLUME
- G01F25/00—Testing or calibration of apparatus for measuring volume, volume flow or liquid level or for metering by volume
- G01F25/10—Testing or calibration of apparatus for measuring volume, volume flow or liquid level or for metering by volume of flowmeters
- G01F25/15—Testing or calibration of apparatus for measuring volume, volume flow or liquid level or for metering by volume of flowmeters specially adapted for gas meters
-
- G—PHYSICS
- G01—MEASURING; TESTING
- G01R—MEASURING ELECTRIC VARIABLES; MEASURING MAGNETIC VARIABLES
- G01R23/00—Arrangements for measuring frequencies; Arrangements for analysing frequency spectra
-
- G—PHYSICS
- G01—MEASURING; TESTING
- G01M—TESTING STATIC OR DYNAMIC BALANCE OF MACHINES OR STRUCTURES; TESTING OF STRUCTURES OR APPARATUS, NOT OTHERWISE PROVIDED FOR
- G01M15/00—Testing of engines
- G01M15/04—Testing internal-combustion engines
- G01M15/10—Testing internal-combustion engines by monitoring exhaust gases or combustion flame
- G01M15/102—Testing internal-combustion engines by monitoring exhaust gases or combustion flame by monitoring exhaust gases
Definitions
- the present disclosure relates to a physical quantity measuring device.
- Patent Document 1 an invention relating to a waveform measuring method and a flow rate calculating method of an electronic device that measures a waveform output from a frequency output type air flow meter and calculates a flow rate is known (see Patent Document 1 below).
- the invention described in Patent Document 1 aims to reduce a flow rate detection error due to a non-linear relationship between a response delay in a transient region, a cycle, and a flow rate (see the same document, paragraph 0007, etc.). ..
- the invention described in Patent Document 1 calculates the average period of all waveforms within a predetermined time interval with respect to the frequency output signal of the air flow meter, and determines the flow rate based on the average period. Convert. As a result, the flow rate detection error due to the influence of aliasing is reduced, and the differential correction is performed in the transient region to reduce the response delay. Further, instead of calculating the flow rate by calculating the average cycle after calculating the average cycle, the signal of the air flow meter is converted into the flow rate every cycle, and the averaging process is performed in units of the flow rate. This reduces the flow rate detection error due to the nonlinearity of the cycle and the flow rate (see the same document, paragraph 0008, etc.).
- the process of calculating the average period of all waveforms within a predetermined time interval and converting to the flow rate based on the average period is performed uniformly without depending on the increase or decrease of the air flow rate.
- uniform processing for example, when the amplitude of the air flow rate is small, the frequency analysis error of the air flow rate may increase under certain conditions.
- the present disclosure provides a physical quantity measuring device capable of reducing a frequency analysis error of gas flow rate as compared with the related art.
- One aspect of the present disclosure is a physical quantity measurement device including a flow rate sensor that outputs a signal according to the flow rate of gas, and a signal processing unit that processes an output signal of the flow rate sensor, wherein the signal processing unit is a predetermined
- a buffer that stores flow rate data of the gas based on the output signal of the period, an offset adjustment unit that adjusts a zero point of a flow rate waveform based on the flow rate data stored in the buffer, and the zero point is adjusted.
- a gain calculation unit that calculates a correction gain by which the flow rate waveform is multiplied, a correction calculation unit that corrects the flow rate waveform with the zero point adjusted by the correction gain, and a frequency analysis calculation of the corrected flow rate waveform are performed.
- a frequency analysis unit for storing data obtained by calculation in the buffer, wherein the gain calculation unit calculates the correction gain that does not cause an overflow in the frequency analysis unit. It is a device.
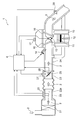
- FIG. 1 is a system diagram showing an example of an electronic fuel injection type internal combustion engine control system.
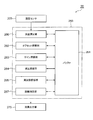
- FIG. 2 is a block diagram of a physical quantity measuring device used in the internal combustion engine control system shown in FIG. 1.
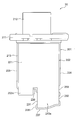
- FIG. 2 is a front view of a physical quantity measuring device used in the internal combustion engine control system shown in FIG. 1.
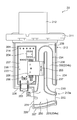
- FIG. 4 is a front view of the physical quantity measuring device shown in FIG. 3 with a cover removed.
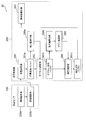
- FIG. 3 is a block diagram showing a partial configuration of the physical quantity measuring device according to the first embodiment.
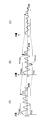
- 6 is a graph illustrating processing by the signal processing unit of the physical quantity measurement device shown in FIG. 5.
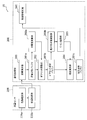
- FIG. 6 is a block diagram showing a partial configuration of a physical quantity measurement device according to a second embodiment.
- FIG. 8 is a graph illustrating an example of processing by the signal processing unit of the physical quantity measurement device shown in FIG. 7.
- 8 is a graph illustrating an example of processing by the signal processing unit of the physical quantity measurement device shown in FIG. 7.
- FIG. 6 is a block diagram showing a partial configuration of a physical quantity measurement device according to a third embodiment.
- FIG. 1 is a system diagram of an electronic fuel injection type internal combustion engine control system 1 using a physical quantity measuring device 20 according to a first embodiment of the present disclosure.
- intake air is taken in as the measured gas 2 from the air cleaner 21 based on the operation of the internal combustion engine 10 including the engine cylinder 11 and the engine piston 12.
- the intake air is introduced into the combustion chamber of the engine cylinder 11 via the intake body, which is the main passage 22, the throttle body 23, and the intake manifold 24.
- the physical quantity of the measured gas 2, which is the intake air introduced into the combustion chamber is measured by the physical quantity measuring device 20. Further, based on the physical quantity measured by the physical quantity measuring device 20, fuel is supplied from the fuel injection valve 14 and is introduced into the combustion chamber in the state of air-fuel mixture together with the intake air.
- the fuel injection valve 14 is provided in the intake port of the internal combustion engine 10, the fuel injected into the intake port is mixed with the intake air, and the mixture of the fuel and the intake air becomes the intake valve 15. Is guided to the combustion chamber via the and is burned to generate mechanical energy.
- the air-fuel mixture introduced into the combustion chamber is a state in which fuel and air are mixed, and explosively burns by spark ignition of the spark plug 13 to generate mechanical energy.
- the gas after combustion is guided to the exhaust pipe from the exhaust valve 16 and is exhausted outside the vehicle as the exhaust gas 3 from the exhaust pipe.
- the flow rate of the measured gas 2, which is the intake air introduced into the combustion chamber, is controlled by the throttle valve 25 whose opening changes according to the operation of the accelerator pedal. Further, the fuel supply amount is controlled based on the flow rate of the intake air introduced into the combustion chamber.
- the mechanical energy generated by the internal combustion engine 10 can be controlled by controlling the opening degree of the throttle valve 25 and controlling the flow rate of the intake air introduced into the combustion chamber.
- the physical quantity measuring device 20 measures the physical quantity such as the flow rate, temperature, humidity, and pressure of the measured gas 2 which is the intake air taken in through the air cleaner 21 and flowing through the main passage 22.
- the physical quantity measuring device 20 outputs an electric signal according to the physical quantity of the intake air.
- the output signal of the physical quantity measuring device 20 is input to the control device 4.
- the output of the throttle angle sensor 26 that measures the opening of the throttle valve 25 is input to the control device 4, and the positions and states of the engine piston 12, the intake valve 15, and the exhaust valve 16 of the internal combustion engine 10, and the internal combustion engine 10
- the output of the rotation angle sensor 17 is input to the control device 4 in order to measure the rotation speed of the.
- the output of the oxygen sensor 28 is input to the control device 4 in order to measure the state of the mixture ratio of the fuel amount and the air amount from the state of the exhaust gas 3.
- the control device 4 calculates the fuel injection amount and the ignition timing based on the physical quantity of the intake air which is the output of the physical quantity measuring device 20 and the rotation speed of the internal combustion engine 10 which is measured based on the output of the rotation angle sensor 17. .. Based on the results of these calculations, the amount of fuel supplied from the fuel injection valve 14 and the ignition timing at which the spark plug 13 ignites are controlled. The fuel supply amount and the ignition timing are actually based on the temperature measured by the physical quantity measuring device 20, the change state of the throttle angle, the change state of the engine rotation speed, and the state of the air-fuel ratio measured by the oxygen sensor 28. It is controlled in detail.
- the control device 4 further controls the amount of air bypassing the throttle valve 25 by the idle air control valve 27 in the idle operation state of the internal combustion engine 10 to control the rotation speed of the internal combustion engine 10 in the idle operation state.
- the fuel supply amount and the ignition timing, which are the main control amounts of the internal combustion engine 10, are calculated using the output of the physical quantity measuring device 20 as a main parameter. Therefore, it is important to improve the measurement accuracy of the physical quantity measuring device 20, suppress the change over time, and improve the reliability in order to improve the control accuracy of the vehicle and ensure the reliability.
- the physical quantity measuring device 20 maintains high reliability.
- the vehicle equipped with the physical quantity measuring device 20 is used in an environment where there are large changes in temperature and humidity. It is desirable that the physical quantity measuring device 20 also takes into consideration changes in temperature and humidity in its use environment and measures against dust and contaminants. Further, the physical quantity measuring device 20 is attached to an intake pipe that is affected by heat generation from the internal combustion engine 10. Therefore, the heat generation of the internal combustion engine 10 is transmitted to the physical quantity measuring device 20 via the intake pipe which is the main passage 22. Since the physical quantity measuring device 20 measures the flow rate of the measurement gas by performing heat transfer with the measurement gas, it is important to suppress the influence of heat from the outside as much as possible.
- the physical quantity measuring device 20 mounted on the vehicle merely solves the problem described in the column of the problem to be solved by the invention and has the effect described in the column of the effect of the invention, as described below. is not.
- the physical quantity measuring device 20 fully considers the various problems described above, solves various problems required as a product, and exerts various effects. Specific problems to be solved by the physical quantity measuring device 20 and specific effects to be achieved will be described in the description of the embodiments below.
- FIG. 2 is a block diagram illustrating the configuration of the characteristic part of the physical quantity measuring device 20 shown in FIG. Although details will be described later, the physical quantity measuring device 20 of the present embodiment is characterized by the following configuration.
- the physical quantity measuring device 20 includes a flow rate sensor 205 that outputs a signal according to the flow rate of the measured gas 2, and a signal processing unit 260 that processes the output signal of the flow rate sensor 205.
- the signal processing unit 260 has a buffer 261, an offset adjustment unit 262, a gain calculation unit 263, a correction calculation unit 264, and a frequency analysis unit 265.
- the buffer 261 stores the flow rate data of the measured gas 2 based on the output signal of the flow rate sensor 205 for a predetermined period.
- the offset adjustment unit 262 adjusts the zero point of the flow rate waveform based on the flow rate data stored in the buffer 261.
- the gain calculator 263 calculates a correction gain by which the zero point-adjusted flow rate waveform is multiplied.
- the correction calculation unit 264 multiplies the flow rate waveform whose zero point has been adjusted by a correction gain to perform correction.
- the frequency analysis unit 265 performs a frequency analysis calculation of the corrected flow rate waveform and stores the data obtained by the calculation in the buffer 261. Then, the gain calculation unit 263 calculates, as the correction gain, a gain that does not cause an overflow in the frequency analysis unit 265.
- the signal processing unit 260 further includes a flow rate measurement unit 266 and a pulsation correction unit 267.
- the physical quantity measuring device 20 includes a flow rate output unit 270.
- the flow rate measurement unit 266 includes, for example, a conversion table that records the relationship between the output signal of the flow rate sensor 205 and the flow rate of the measurement target gas 2, and converts the output signal of the flow rate sensor 205 into flow rate data of the measurement target gas 2.
- the pulsation correction unit 267 performs pulsation correction of the flow rate waveform of the measurement target gas 2 based on the flow rate data of the measurement target gas 2 converted by the flow rate measurement unit 266 and the result of the frequency analysis by the frequency analysis unit 265, and corrects it.
- the flow rate data of the measured gas 2 thus obtained is input to the flow rate output unit 270.
- the flow rate output unit 270 outputs the pulsation-corrected flow rate data of the measured gas 2 input from the signal processing unit 260 to the outside of the physical quantity measurement device 20 via an external terminal.
- FIG. 3 is a front view of the physical quantity measuring device 20 shown in FIG.
- FIG. 4 is a front view of the physical quantity measuring device 20 of FIG. 3 with the cover 202 removed.
- a sealing material that seals the circuit board 207 is omitted.
- the physical quantity measuring device 20 is used by being inserted into the main passage 22 through a mounting hole provided in the passage wall of the main passage 22.
- the physical quantity measuring device 20 includes a housing 201 and a cover 202 attached to the housing 201.
- the housing 201 is configured by injection molding a synthetic resin material
- the cover 202 is configured by a plate-shaped member made of a conductive material such as an aluminum alloy.
- the cover 202 is formed in a thin plate shape and has a wide flat cooling surface.
- the housing 201 includes a flange 211 fixed to the intake body, which is the main passage 22, a connector 212 protruding from the flange 211 and exposed to the outside from the intake body for electrical connection with an external device. It has a measuring portion 213 that extends so as to project toward the center of the main passage 22.
- the flange 211 has, for example, a substantially rectangular shape in plan view having a predetermined plate thickness, and has a through hole at a corner.
- the flange 211 is fixed to the main passage 22 by, for example, inserting a fixing screw into a through hole at a corner and screwing the fixing screw into a screw hole of the main passage 22.
- the connector 212 has, for example, four external terminals and a correction terminal provided therein.
- the external terminal is a terminal for outputting a physical quantity such as a flow rate and a temperature, which is a measurement result of the physical quantity measuring device 20, and a power supply terminal for supplying DC power for operating the physical quantity measuring device 20.
- the correction terminal is a terminal used for measuring the produced physical quantity measuring device 20, obtaining a correction value for each physical quantity measuring device 20, and storing the correction value in a memory inside the physical quantity measuring device 20. ..
- the measuring unit 213 has a thin and long shape extending from the flange 211 toward the center of the main passage 22, and has a wide front surface 221 and a rear surface, and a pair of narrow side surfaces such as an upstream end surface 223 and a downstream end surface 224.
- the measuring unit 213 is inserted, for example, through a mounting hole provided in the main passage 22, and the flange 211 is brought into contact with the main passage 22 and is fixed to the main passage 22 with a screw, so that the main portion 22 can be connected via the flange 211. It is fixed to the passage 22.
- the measurement unit 213 projects from the inner wall of the main passage 22 toward the central axis 22 a of the main passage 22 with the physical quantity measuring device 20 attached to the main passage 22.
- the front surface 221 and the back surface are arranged parallel to each other along the central axis 22a of the main passage 22, and the narrow upstream end surface 223 and the downstream end surface 224 of the measuring portion 213 are located at one upstream side of the measuring portion 213 in the lateral direction.
- 223 is arranged so as to face the upstream side of the main passage 22, and the downstream end surface 224 on the other short side of the measuring unit 213 is arranged so as to face the downstream side of the main passage 22.
- the front surface 221 of the measuring unit 213 is flat from the upstream end surface 223 to the downstream end surface 224 along the lateral direction.
- the back surface of the measurement unit 213 is chamfered at the corner on the downstream end face 224 side, and is inclined in a direction that gradually approaches the front face as it moves from the intermediate position in the lateral direction to the downstream end face 224.
- the cross-sectional shape of the measuring unit 213 is so-called streamlined. Therefore, the measured gas 2 flowing from the upstream of the main passage 22 can be smoothly guided to the downstream along the front surface 221 and the rear surface of the measurement unit 213, and the fluid resistance of the measurement unit 213 with respect to the measured gas 2 is reduced. be able to.
- the measuring portion 213 has a stepped end portion in the protruding direction, and with the physical quantity measuring device 20 attached to the main passage 22, the lower surface 226 on the upstream side of the main passage 22 and the downstream side of the main passage 22. And a lower surface 227 thereof.
- the lower surface 227 on the downstream side projects in the projecting direction than the lower surface 226 on the upstream side, and the step surface 228 connecting the lower surface 226 on the upstream side and the lower surface 227 on the downstream side is located upstream of the main passage 22. Arranged to face side.
- the measurement unit 213 has a stepped surface 228 of the tip end portion 213a protruding from the lower surface 226 on the upstream side on the side opposite to the flange 211, and a part of the measured gas 2 such as intake air is supplied to the auxiliary passage in the measurement unit 213.
- An inlet 231 for taking in is opened.
- a first outlet 232 and a second outlet 233 for returning the measured gas 2 taken into the auxiliary passage in the measuring portion 213 to the main passage 22 are opened at the downstream end surface 224 of the tip portion 213a of the measuring portion 213.
- the measurement part 213 has the upstream end face 223 as the first wall part arranged toward the upstream side in the flow direction of the measured gas 2 in the main passage 22.
- the measurement unit 213 is arranged toward the upstream side in the flow direction of the measurement target gas 2 at a position downstream of the upstream end face 223 as the first wall section in the flow direction of the measurement target gas 2 in the main passage 22.
- the stepped surface 228 of the tip portion 213a is provided as the second wall portion.
- An inlet 231 of the sub passage is opened on the step surface 228 of the tip portion 213a.
- the physical quantity measuring device 20 since the inlet 231 of the sub passage is provided at the tip end portion 213a of the measuring portion 213 extending from the flange 211 toward the center of the main passage 22, it is not near the inner wall surface of the main passage 22. It is possible to take in a gas in a portion close to the central portion apart from the inner wall surface into the sub passage. Therefore, the physical quantity measuring device 20 can measure the flow rate of the gas in the portion away from the inner wall surface of the main passage 22, and can suppress the decrease in measurement accuracy due to the influence of heat or the like.
- the temperature of the main passage 22 is easily affected, and the temperature of the measured gas 2 is different from the original temperature of the gas. It will be different from the state. Particularly when the main passage 22 is an intake body of the engine, it is often maintained at a high temperature due to the influence of heat from the engine. For this reason, the gas in the vicinity of the inner wall surface of the main passage 22 is often higher than the original temperature of the main passage 22, which causes a decrease in measurement accuracy. Further, the fluid resistance is large near the inner wall surface of the main passage 22, and the flow velocity is lower than the average flow velocity of the main passage 22. Therefore, if the gas in the vicinity of the inner wall surface of the main passage 22 is taken into the sub passage as the measured gas 2, the decrease in the flow velocity with respect to the average flow velocity of the main passage 22 may lead to a measurement error.
- the physical quantity measuring device 20 is provided with the inlet 231 at the distal end portion 213a of the thin and long measuring portion 213 extending from the flange 211 toward the center of the main passage 22, the physical quantity measuring device 20 is related to the decrease in the flow velocity near the inner wall surface of the main passage 22. It is possible to reduce the measurement error. Further, in the physical quantity measuring device 20, not only is the inlet 231 provided at the tip portion 213a of the measuring portion 213 extending from the flange 211 toward the center of the main passage 22, but also the first outlet 232 and the second outlet of the sub passage. Since 233 is also provided at the tip portion 213a of the measuring unit 213, the measurement error can be further reduced.
- the physical quantity measuring device 20 has a shape in which the measuring unit 213 extends long along the axis extending from the outer wall of the main passage 22 toward the center, but the widths of the upstream end face 223 and the downstream end face 224 are larger than the width of the front face 221. It is narrow and the measurement unit 213 has a plate-like shape. Accordingly, the physical quantity measuring device 20 can suppress the fluid resistance of the measured gas 2 to a small value.
- the measurement unit 213 is provided with a sub-passage groove 250 for forming the sub-passage 234 and a circuit chamber 235 for accommodating the circuit board 207.
- the circuit chamber 235 and the auxiliary passage groove 250 are recessed in the front surface of the measuring unit 213, and are separately arranged on one side and the other side in the lateral direction of the measuring unit 213.
- the circuit chamber 235 is arranged at a position upstream in the flow direction of the measured gas 2 in the main passage 22, and the auxiliary passage 234 is located downstream of the circuit chamber 235 in the main passage 22 in the flow direction of the measured gas 2. Placed in position. In the flow direction of the gas to be measured 2 in the main passage 22, the upstream surface of the upstream wall of the circuit chamber 235 is made the upstream end surface 223 of the measurement unit 213, which enables space saving.
- the sub passage groove 250 forms the sub passage 234 in cooperation with the cover 202.
- the sub passage 234 is provided so as to extend along the longitudinal direction of the measuring unit 213, which is the projecting direction of the measuring unit 213.
- the sub-passage groove 250 forming the sub-passage 234 has a first sub-passage groove 251 and a second sub-passage groove 252 branched in the middle of the first sub-passage groove 251.
- the first sub passage groove 251 extends between an inlet 231 that opens to the step surface 228 of the tip 213 a of the measuring unit 213 and a first outlet 232 that opens to the downstream end face 224 of the tip 213 a of the measuring unit 213.
- the measuring portion 213 is formed so as to extend along the lateral direction.
- the inlet 231 is opened so as to face the upstream side in the flow direction of the measured gas 2 in the main passage 22.
- the first auxiliary passage groove 251 forms a first auxiliary passage 234a between the cover 202 and the inlet 231 along the central axis 22a of the main passage 22 to reach the first outlet 232.
- the first sub passage 234a takes in the measured gas 2 flowing in the main passage 22 from the inlet 231, and returns the taken measured gas 2 to the main passage 22 from the first outlet 232.
- the first sub passage 234 a extends from the inlet 231 along the flow direction of the measured gas 2 in the main passage 22, and is connected to the first outlet 232.
- the first sub passage 234a has a branch portion 236 between the inlet 231 and the first outlet 232.
- the branch portion 236 is provided near the inlet 231 on the upstream side of the measured gas 2 in the forward flow in the first sub passage 234a extending along the central axis 22a of the main passage 22.
- the measured gas 2 flows along the central axis 22a of the main passage 22 from the air cleaner 21 toward the internal combustion engine 10 during forward flow, as shown in FIG.
- the measured gas 2 flowing through the main passage 22 is taken into the first sub passage 234a from the inlet 231 at the time of forward flow, flows through the first sub passage 234a toward the first outlet 232, and from the branch portion 236 to the second portion. It flows into the sub passage 234b.
- the second sub passage groove 252 branches toward the base end portion of the measuring portion 213, that is, the flange 211 at an intermediate position of the first sub passage groove 251, and extends in the longitudinal direction of the measuring portion 213, that is, the central axis 22 a of the main passage 22. They extend in a direction intersecting with each other, for example, a direction substantially orthogonal to the central axis 22a. Further, the second sub passage groove 252 is bent back toward the tip portion 213a in the vicinity of the flange 211 of the measuring portion 213, for example, curved in a U shape or an arc shape, and the second sub passage groove 252 extends in the longitudinal direction of the measuring portion 213, that is, in the main passage 22. It extends in a direction intersecting with the central axis 22a, for example, in a direction substantially orthogonal to the central axis 22a.
- the second sub passage groove 252 is finally bent toward the downstream end surface 224 of the measuring unit 213 so as to be curved in an arc shape, for example, and is connected to the second outlet 233.
- the second outlet 233 is opened so as to face the downstream side in the flow direction of the measured gas 2 in the main passage 22.
- the second outlet 233 has an opening area that is substantially the same as or slightly larger than that of the first outlet 232, and is formed at a position adjacent to the first outlet 232 on the proximal end side in the longitudinal direction of the measuring unit 213.
- the second sub-passage groove 252 forms a second sub-passage 234b between the cover 202 and the first sub-passage 234a, which branches toward the flange 211 and reaches the second outlet 233.
- the second auxiliary passage 234b allows the measured gas 2 branched and flown from the first auxiliary passage 234a to pass therethrough and returns from the second outlet 233 to the main passage 22.
- the second sub passage 234b has a path that reciprocates along the longitudinal direction of the measuring unit 213. More specifically, the second auxiliary passage 234b has, for example, a straight upstream portion 237, an arcuate or U-shaped curved portion 238, and a straight downstream portion 239.
- the upstream portion 237 is branched from, for example, the branch portion 236 of the first sub passage 234a, and extends straight in a straight line in a direction intersecting with the central axis 22a of the main passage 22.
- the upstream portion 237 extends, for example, in a direction substantially orthogonal to the central axis 22a of the main passage 22, that is, in a direction from the branch portion 236 of the first auxiliary passage 234a toward the flange 211.
- the curved portion 238 is connected to the downstream end of the upstream portion 237 near the flange 211, for example, and is curved so as to be folded back toward the central axis 22a of the main passage 22.
- the curved portion 238 has, for example, an arc shape or a U shape, and is curved so that the second sub passage 234b is folded back 180 degrees in the opposite direction.
- the downstream portion 239 is connected to, for example, the downstream end of the curved portion 238 near the flange 211, and extends substantially straight in a straight line toward the central axis 22a of the main passage 22.
- the downstream portion 239 extends, for example, substantially parallel to the upstream portion 237 toward the tip portion 213a of the measurement portion 213, and extends toward the downstream side of the branch portion 236 in the first auxiliary passage 234a.
- the downstream portion 239 is curved near the second outlet 233 of the tip portion 213a in the direction along the central axis 22a of the main passage 22 and is connected to the second outlet 233.
- the second auxiliary passage 234b has a curved shape. More specifically, the upstream portion 237 of the second sub passage 234b is branched from the branch portion 236 of the first sub passage 234a and extends in a direction intersecting the central axis 22a of the main passage 22.
- the curved portion 238 of the second auxiliary passage 234b is curved so as to be folded back from the upstream portion 237 toward the central axis 22a of the main passage 22.
- the downstream portion 239 of the second auxiliary passage 234b extends from the curved portion 238 toward the central axis 22a of the main passage 22.
- the curved shape of the second sub passage 234b is formed by the upstream portion 237, the curved portion 238, and the downstream portion 239.
- the second outlet 233 is omitted, and the downstream portion 239 of the second auxiliary passage 234b is connected to the downstream side of the branch portion 236 of the first auxiliary passage 234a so as to connect the second auxiliary passage 234b. May be joined to the first sub passage 234a.
- the flow sensor 205 is disposed in the upstream portion 237 of the second sub passage 234b, for example. More specifically, in the upstream portion 237 of the second auxiliary passage 234b, the flow rate sensor 205 is arranged in the intermediate portion between the first auxiliary passage 234a and the curved portion 238. Since the second sub passage 234b has the curved shape as described above, a longer passage length can be secured, and when the measured gas 2 in the main passage 22 pulsates, the flow rate sensor 205 Can be reduced.
- the sub passage 234 can be formed along the longitudinal direction that is the projecting direction of the measurement unit 213, and the length of the sub passage 234 can be sufficiently long.
- the physical quantity measuring device 20 can include the auxiliary passage 234 having a sufficient length. Therefore, the physical quantity measuring device 20 can suppress the fluid resistance to a small value and can measure the physical quantity of the measurement target gas 2 with high accuracy.
- the first sub passage 234a extends from the inlet 231 in the lateral direction of the measuring unit 213, that is, along the central axis 22a of the main passage 22 to reach the first outlet 232, it enters the first sub passage 234a from the inlet 231. Foreign matter such as dust can be directly discharged from the first outlet 232. As a result, it is possible to prevent foreign matter from entering the second auxiliary passage 234b and prevent the flow sensor 205 arranged in the second auxiliary passage 234b from being affected.
- the inlet 231 and the first outlet 232 of the first auxiliary passage 234a have a larger opening area at the inlet 231 than at the first outlet 232.
- the measured gas 2 that has flowed into the first sub passage 234a also flows into the second sub passage 234b that is branched in the middle of the first sub passage 234a. You can be surely guided.
- a protrusion 253 is provided in the vicinity of the inlet 231 of the first auxiliary passage groove 251 at the center position of the inlet 231 in the longitudinal direction of the measuring unit 213.
- the protrusion 253 divides the size of the inlet 231 into two equal parts in the longitudinal direction of the measuring part 213, and divides the respective opening areas of the two divided inlets 231 from the opening areas of the first outlet 232 and the second outlet 233. I'm making it small.
- the protrusion 253 restricts the size of the foreign matter that can enter the first sub passage 234a from the inlet 231 to be smaller than the first outlet 232 and the second outlet 233, and the foreign matter can cause the first outlet 232 and the second outlet 232 to enter. It is possible to prevent the 233 from being blocked.
- the circuit board 207 is housed in a circuit room 235 provided on one side in the lateral direction of the measuring unit 213.
- the circuit board 207 has a rectangular shape extending along the longitudinal direction of the measurement unit 213, and has a chip package 208, a pressure sensor 204, a temperature/humidity sensor 206, and an intake air temperature sensor on its surface. And 203 are implemented.
- the circuit board 207 has a mounting portion common to all the sensors and can be commonly used for mounting patterns of various sensors.
- the surface of the circuit board 207 is arranged, for example, substantially parallel to the measured gas 2 flowing through the main passage 22. As a result, the measuring unit 213 can be made thinner, and the pressure loss of the measured gas 2 flowing through the main passage 22 can be reduced.
- the chip package 208 is mounted on the circuit board 207.
- the flow rate sensor 205 and an LSI that is an electronic component that drives the flow rate sensor 205 are mounted and sealed by transfer molding.
- the electronic components mounted on the chip package 208 form a signal processing unit 260 that processes the output signal of the flow rate sensor 205.
- a part of the chip package 208 is inserted from the circuit board 207 into the second sub passage 234b at a central position in the longitudinal direction of the circuit board 207 so that the flow sensor 205 is arranged in the second sub passage 234b. It is mounted in a protruding state.
- the chip package 208 is arranged between the sub passage 234 and the circuit room 235.
- the circuit chamber 235 and the sub passage 234 are separated, and the flow to the flow rate sensor 205 arranged in the chip package 208 is rate-controlled by the shape of the sub passage 234. Therefore, there is no barrier in the sub-passage 234 that obstructs the flow of the gas to be measured 2, and the stable flow of the gas to be measured 2 can be supplied to the flow rate sensor 205. Therefore, the measuring unit 213 can be downsized while maintaining the flow velocity sensitivity, noise performance, and pulsation characteristics of the flow rate sensor.
- the flow rate sensor 205 does not necessarily have to be provided in the chip package 208.
- a part of the circuit board 207 may be projected to arrange the flow sensor 205 in the sub passage 234, or the flow sensor 205 mounted on the circuit board 207 may be arranged in the sub passage 234 by a plate-shaped support. Good.
- the flow rate sensor 205 and the LSI may be integrally formed on the same semiconductor element or may be formed as separate semiconductor elements.
- the flow rate sensor 205 is sealed with resin so that at least the flow rate measuring portion on the surface is exposed.
- the structure in which the LSI is provided on the chip package 208 has been described, the structure may be such that the LSI is mounted on the circuit board 207.
- An advantage of providing the LSI on the chip package 208 is that the LSI does not have to be mounted on the circuit board 207, which contributes to downsizing of the circuit board 207.
- the chip package 208 has a concave groove extending along the flow direction of the measured gas 2 in the upstream portion of the second auxiliary passage 234b, and the flow sensor 205 is provided at the bottom of the concave groove.
- the concave groove of the chip package 208 has a narrowed shape in which the width gradually narrows from both ends in the flow direction of the measured gas 2 flowing in the upstream portion of the second auxiliary passage 234b toward the central portion, and the narrowest central portion.
- a flow sensor 205 is arranged in the section. With this throttle shape, the measured gas 2 flowing through the auxiliary passage 234 is rectified, and the influence of noise can be reduced.
- the pressure sensor 204 is mounted on the longitudinal direction proximal end side of the circuit board 207 with respect to the chip package 208, and the temperature/humidity sensor 206 is mounted on the longitudinal direction distal end side of the circuit board 207 with respect to the chip package 208. ..
- the leads of the intake air temperature sensor 203 are connected to the surface of the circuit board 207.
- the intake air temperature sensor 203 has a lead connected to a position on the distal end side of the circuit board 207 in the longitudinal direction with respect to the temperature/humidity sensor 206, and a position where the sensor body 203b protrudes from the circuit board 207 in the longitudinal direction and is exposed to the outside of the measurement unit 213. It is implemented to be placed in.
- the intake air temperature sensor 203 is arranged between the upstream end surface 223 of the measuring portion 213 on the flange 211 side and the step surface 228 of the tip portion 213a.
- the intake air temperature sensor 203 is mounted on the circuit board 207 and is exposed outside the measuring unit 213.
- the intake air temperature sensor 203 is composed of an axial lead component having a cylindrical sensor body and a pair of leads projecting from both axial ends of the sensor body in a direction away from each other.
- the measuring unit 213 is provided with a protector 202a for protecting the intake air temperature sensor 203.
- the pressure sensor 204 measures the pressure of the measurement target gas 2
- the flow rate sensor 205 measures the flow rate of the measurement target gas 2.
- the temperature/humidity sensor 206 measures the humidity of the measured gas 2
- the intake air temperature sensor measures the temperature of the measured gas 2.
- FIG. 5 is a block diagram showing a partial configuration of the physical quantity measurement device 20 according to the first embodiment of the present disclosure.
- the physical quantity measuring device 20 includes the flow rate sensor 205 that outputs a signal according to the flow rate of gas, and the signal processing unit 260 that processes the output signal of the flow rate sensor 205.
- the signal processing unit 260 includes the buffer 261, the offset adjustment unit 262, the gain calculation unit 263, the correction calculation unit 264, and the frequency analysis unit 265, as described above.
- the buffer 261 has a flow rate waveform buffer 261a, an offset waveform buffer 261b, and a correction waveform buffer 261c.
- the flow rate sensor 205 has a heat generating resistor 205a and a temperature sensitive resistor 205b
- the signal processing unit 260 has a flow rate measuring unit 266 as in the example shown in FIG. is doing.
- the signal processing unit 260 has a minimum value detection unit 268a and a maximum value detection unit 268b.
- the pulsation correction unit 267 and the flow rate output unit 270 shown in FIG. 2 are omitted.
- the flow rate sensor 205 is mounted on the chip package 208 shown in FIG. 4, and is disposed, for example, in the upstream portion 237 of the auxiliary passage 234 provided in the measuring portion 213 of the housing 201 that constitutes the physical quantity measuring device 20. There is.
- the flow rate sensor 205 has, for example, a pair of temperature-sensitive resistors 205b on both sides of the heating resistor 205a in the flow direction of the measured gas 2.
- the flow rate sensor 205 measures the flow rate of the gas based on the temperature difference between the pair of temperature sensitive resistors 205b arranged on the upstream side and the downstream side of the heating resistor 205a in the flow direction of the measured gas 2. It is a thermal type flow meter. Further, the flow rate sensor 205 includes, in addition to the heating resistor 205a and the temperature sensitive resistor 205b, for example, a plurality of fixed resistors (not shown), electrode pads for electrical connection with the outside, and the like. ing.
- the flow rate measuring unit 266 includes a voltage-flow rate conversion table based on the relationship between the voltage that is the output signal of the flow rate sensor 205 and the flow rate of the gas to be measured 2, and the output signal of the flow rate sensor 205 is measured. Convert to flow data of gas 2.
- the flow rate measuring unit 266 is configured by, for example, electronic components such as an arithmetic unit and a storage device mounted on the chip package 208, and a program stored in the storage device.
- the flow rate waveform buffer 261a stores, for example, the flow rate data of the measured gas 2 for a predetermined period output from the flow rate measuring unit 266 based on the output signal of the flow rate sensor 205 for the predetermined period.
- the flow rate waveform buffer 261a is configured by a storage device such as a memory mounted on the chip package 208, for example.
- the flow rate data stored in the flow rate waveform buffer 261a is sequentially overwritten with new flow rate data output from the flow rate measuring unit 266, for example, as time passes.
- the minimum value detection unit 268a calculates the minimum value of the flow rate waveform in the graph with the flow rate on the vertical axis and the time on the horizontal axis based on the flow rate data stored in the flow rate waveform buffer 261a for a predetermined period.
- the minimum value detection unit 268a includes, for example, electronic components such as an arithmetic unit and a storage device mounted on the chip package 208, and a program stored in the storage device.
- the offset adjusting unit 262 adjusts the zero point of the flow rate waveform based on the flow rate data stored in the buffer 261. In the example shown in FIG. 5, the offset adjustment unit 262 sets the minimum value of the flow rate waveform output from the minimum value detection unit 268a as the zero point of the flow rate waveform, and adjusts the zero point of the flow rate waveform.
- the offset adjusting unit 262 is configured by, for example, electronic components such as an arithmetic unit and a storage device mounted on the chip package 208, and a program stored in the storage device.
- the offset waveform buffer 261b stores the flow rate data of the flow rate waveform whose zero point is adjusted by the offset adjusting unit 262.
- the offset waveform buffer 261b is configured by a storage device such as a memory mounted on the chip package 208, for example.
- the maximum value detection unit 268b detects the maximum value of the flow rate waveform after the zero point adjustment (offset) stored in the offset waveform buffer 261b after the zero point is adjusted by the offset adjustment unit 262.
- the maximum value of the flow rate waveform is, for example, the maximum maximum value of the plurality of maximum values of the flow rate waveform after the offset.
- the maximum value detection unit 268b is configured by, for example, electronic components such as an arithmetic unit and a storage device mounted on the chip package 208, and a program stored in the storage device.
- the gain calculator 263 calculates a correction gain by which the zero point-adjusted flow rate waveform is multiplied.
- the gain calculation unit 263 calculates a gain at which the frequency analysis unit 265 does not overflow as the correction gain.
- the overflow is an arithmetic overflow, and means that the numerical type exceeds the upper limit of the representable value in the operation of the computer and the error caused thereby. Overflow is sometimes referred to as "overflow".
- the gain calculation unit 263 is configured by, for example, an electronic device such as a calculation device and a storage device mounted on the chip package 208, and a program stored in the storage device.
- the gain calculation unit 263 stores, as a limit value, for example, the maximum numerical value that does not cause an overflow in the frequency analysis unit 265 that stores transient data of frequency analysis calculation and calculation results. That is, when the maximum value of the flow rate waveform for performing the frequency analysis calculation exceeds this limit value, the frequency analysis unit 265 overflows.
- the gain calculation unit 263 compares, for example, this limit value with the maximum value of the flow rate waveform after offset. Then, the gain calculation unit 263 calculates the correction gain so that the maximum value of the corrected flow waveform obtained by multiplying the corrected flow waveform by the correction gain is equal to or less than the limit value.
- the gain calculation unit 263 calculates the correction gain, for example, so that the maximum value of the flow rate waveform after the offset flow rate waveform is multiplied by the correction gain is equal to the limit value at which the frequency analysis unit 265 does not overflow. May be.
- the correction calculation unit 264 multiplies the flow rate waveform whose zero point has been adjusted by the offset adjustment unit 262 by the correction gain calculated by the gain calculation unit 263 and corrects it. More specifically, the correction calculation unit 264 reads the offset flow rate waveform from the offset waveform buffer 261b, and multiplies the corrected flow rate waveform by the correction gain output from the gain calculation unit 263 to obtain the corrected flow rate. Calculate waveform data.
- the correction calculation unit 264 is configured by, for example, an electronic device such as a calculation device and a storage device mounted on the chip package 208, and a program stored in the storage device.
- the correction waveform buffer 261c stores the flow rate data of the corrected flow rate waveform obtained by multiplying the flow rate waveform after the zero point adjustment by the offset adjustment unit 262, that is, the offset, by the correction gain by the correction calculation unit 264.
- the maximum value of the flow rate of the corrected flow rate waveform is equal to or lower than the limit value at which the frequency analysis unit 265 does not overflow in the frequency analysis calculation of the frequency analysis unit 265.
- the frequency analysis unit 265 reads the corrected flow rate waveform from the correction waveform buffer 261c and performs frequency analysis calculation of the flow rate waveform after the correction. Further, the frequency analysis unit 265 stores data obtained by calculation, such as transient data in the middle of calculation and calculation result, as shown in FIG. 2, for example. The frequency analysis unit 265 also stores the calculation result of the frequency analysis calculation in the buffer 261.
- the frequency analysis unit 265 includes, for example, electronic components such as an arithmetic unit and a storage device mounted on the chip package 208, and a program stored in the storage device.
- the pulsation correction unit 267 reads the result of the frequency analysis calculation by the frequency analysis unit 265 from the buffer 261 as shown in FIG. 2, for example. Further, the pulsation correction unit 267 reads, for example, the flow rate waveform output from the flow rate measurement unit 266 and stored in the flow rate waveform buffer 261a of the buffer 261. Then, the flow rate waveform based on the output signal of the flow rate sensor 205 is corrected based on the result of the frequency analysis calculation by the frequency analysis unit 265.
- the flow rate output unit 270 outputs the flow rate data of the measured gas 2 after pulsation correction output from the pulsation correction unit 267 via the external terminal of the connector 212, as described above. And outputs it to the outside of the physical quantity measuring device 20.
- the flow rate output unit 270 is composed of, for example, electronic components such as an arithmetic unit and a storage device mounted on the chip package 208, a program stored in the storage device, and an output terminal.
- FIG. 6 is graphs (A) to (C) for explaining the processing by the signal processing unit 260 of the physical quantity measuring device 20 shown in FIG.
- the vertical axis of each graph is the flow rate, and the horizontal axis is the time.
- Graphs (A) to (C) are a graph of a flow rate waveform before zero point adjustment, a graph of a flow rate waveform after zero point adjustment, and a graph of a flow rate waveform after being multiplied by a correction gain, respectively.
- the physical quantity measuring device 20 is arranged in the intake body which is the main passage 22 through which the measured gas 2 which is the intake air sucked from the air cleaner 21 of the electronic fuel injection type internal combustion engine control system 1 flows. ..
- the physical quantity measuring device 20 measures a physical quantity including the flow rate of the measured gas 2 flowing through the main passage 22 and outputs it to the control device 4.
- the physical quantity measuring device 20 includes the flow rate sensor 205 that outputs a signal according to the flow rate of the measurement target gas 2 and the signal processing unit 260 that processes the output signal of the flow rate sensor 205.
- the signal processing unit 260 has a buffer 261, an offset adjustment unit 262, a gain calculation unit 263, a correction calculation unit 264, and a frequency analysis unit 265.
- the buffer 261 stores the flow rate data of the measured gas 2 based on the output signal of the flow rate sensor 205 for a predetermined period.
- the offset adjustment unit 262 adjusts the zero point of the flow rate waveform based on the flow rate data stored in the buffer 261.
- the gain calculator 263 calculates the correction gain of the flow rate waveform with the zero point adjusted.
- the correction calculation unit 264 multiplies the flow rate waveform whose zero point has been adjusted by a correction gain to perform correction.
- the frequency analysis unit 265 performs a frequency analysis calculation of the corrected flow rate waveform and stores the data obtained by the calculation in the buffer 261. Then, the gain calculation unit 263 calculates, as the correction gain, a gain that does not cause an overflow in the frequency analysis unit 265.
- the zero point adjustment of the flow rate waveform is performed by the offset adjustment unit 262, so that the flow rate waveform after the offset as shown in the graph (B) of FIG. 6 can be obtained.
- the gain calculation unit 263 can calculate a correction gain that does not cause an overflow during the frequency analysis calculation by the frequency analysis unit 265. Further, the correction gain is multiplied by the corrected flow rate waveform by the correction calculation unit 264 to obtain a corrected flow rate waveform as shown in the graph (C) of FIG. 6. Further, the frequency analysis unit 265 performs a frequency analysis calculation on the corrected flow rate waveform, so that overflow in the frequency analysis unit 265 can be prevented.
- the physical quantity measuring device capable of improving the accuracy of the frequency analysis result of the flow rate waveform and reducing the frequency analysis error of the gas flow rate regardless of the pulsation state of the flow rate waveform. 20 can be provided.
- the signal processing unit 260 stores the flow rate data of gas based on the output signal of the flow rate sensor 205 for a predetermined period in the buffer 261 including the flow rate waveform buffer 261a as described above. To do.
- the signal processing unit 260 can obtain a flow rate waveform as shown in the graph (A), for example, based on this flow rate data.
- the signal processing unit 260 has a minimum value detection unit 268a that detects the minimum value Fmin of this flow rate waveform.
- the offset adjusting unit 262 is configured to set the minimum value Fmin to the zero point of the flow rate waveform, as shown in the graph (B).
- the zero point adjustment with the minimum value Fmin of the flow rate waveform as shown in the graph (A) as the zero point can be performed to obtain the offset flow rate waveform shown in the graph (B). Accordingly, the frequency analysis by the frequency analysis unit 265 can be performed on the flow rate data without a code.
- the signal processing unit 260 has a maximum value detection unit 268b that detects the maximum value Fmax of the flow rate waveform after offset in which the zero point shown in the graph (B) is adjusted. ing. Further, the gain calculation unit 263 calculates the correction gain so that the maximum value Fmax of the flow rate waveform after the offset becomes equal to or less than the limit value at which the frequency analysis unit 265 does not cause an overflow in the frequency analysis unit 265.
- the minimum value Fmin is set to the zero point, and the maximum value Fmax of the flow rate waveform having the zero point adjusted, and the frequency analysis unit 265 at the time of the frequency analysis calculation by the frequency analysis unit 265. It can be compared with a limit value at which overflow does not occur.
- the maximum value Fmax of the flow rate waveform after offset shown in the graph (B) having the highest risk of causing the frequency analysis unit 265 to overflow can be set to be equal to or less than the above limit value. Therefore, during the frequency analysis calculation by the frequency analysis unit 265, overflow in the frequency analysis unit 265 can be prevented more reliably. Further, with the above configuration, the accuracy of the frequency analysis result of the flow rate waveform can be improved regardless of the pulsation state of the flow rate waveform.
- the maximum value Fmax of the flow rate waveform after the offset before being multiplied by the correction gain is equal to or larger than the limit value at which the frequency analysis unit 265 does not overflow.
- the maximum value Fmax of the flow rate waveform after being multiplied by the correction gain becomes a value as large as possible, which is equal to or less than the limit value at which the frequency analysis unit 265 does not overflow.
- the gain calculator 263 can calculate the correction gain. As a result, the flow rate waveform after being multiplied by the correction gain is prevented from being extremely reduced, and deterioration of amplitude information can be suppressed.
- the maximum value Fmax of the flow rate waveform after the offset before being multiplied by the correction gain is smaller than the limit value at which the frequency analysis unit 265 does not overflow. ..
- the correction gain is calculated by the gain calculation unit 263 so that the maximum value Fmax of the flow rate waveform after being multiplied by the correction gain becomes a value as large as possible, which is equal to or less than a limit value at which the overflow does not occur in the frequency analysis unit 265.
- the buffer 261 has a flow rate waveform buffer 261a, an offset waveform buffer 261b, and a correction waveform buffer 261c.
- the flow rate waveform buffer 261a stores gas flow rate data based on the output signal of the flow rate sensor 205 for a predetermined period.
- the offset waveform buffer 261b stores the flow rate data of the flow rate waveform with the zero point adjusted.
- the correction waveform buffer 261c stores the flow rate data of the corrected flow rate waveform multiplied by the correction gain.
- the risk of losing the data stored in each of the flow rate waveform buffer 261a, the offset waveform buffer 261b, and the correction waveform buffer 261c can be reduced compared to the case where a single buffer 261 is used. More specifically, when the frequency analysis process is performed in a shorter time than the time corresponding to the buffer length of the frequency analysis, it is possible to prevent the initial data from being lost, and to analyze a part of the analysis data multiple times. It is possible to prevent the processing from being executed.
- the physical quantity measuring device 20 capable of reducing the frequency analysis error of the gas flow rate.
- FIG. 7 is a block diagram showing a partial configuration of the physical quantity measuring device 20 according to the second embodiment.
- FIG. 8 is a graph illustrating an example of processing by the signal processing unit 260 of the physical quantity measuring device 20 shown in FIG. 7.
- FIG. 9 is a graph illustrating another example of processing by the signal processing unit 260 of the physical quantity measuring device 20 shown in FIG. 7.
- the physical quantity measuring device 20 of the present embodiment has the intermediate value calculation unit 269a and the maximum absolute value calculation unit 269b in place of the minimum value detection unit 268a and the maximum value detection unit 268b. It is different from the physical quantity measuring device 20.
- the other points of the physical quantity measuring device 20 of the present embodiment are the same as those of the physical quantity measuring device 20 according to the first embodiment described above, and therefore, the same parts are denoted by the same reference numerals and the description thereof is omitted.
- the signal processing unit 260 has the zero-point correction value Z between the maximum value Fmax and the minimum value Fmin of the flow rate waveform. It has an intermediate value calculation unit 269a for calculating Further, in the physical quantity measuring device 20 of the present embodiment, the offset adjusting unit 262 sets the zero point correction value Z to the zero point of the flow rate waveform as shown in the graphs (B) of FIGS. 8 and 9.
- the intermediate value calculation unit 269a and the maximum absolute value calculation unit 269b are configured by, for example, an electronic device such as a calculation device and a storage device mounted on the chip package 208, and a program stored in the storage device.
- the frequency analysis of the flow rate waveform by the frequency analysis unit 265 can be performed on the signed flow rate data, and the same effect as that of the physical quantity measuring device 20 according to the first embodiment can be obtained.
- the signal processing unit 260 calculates the maximum absolute value FAmax of the flow rate waveform with the zero point adjusted as shown in the graphs (B) of FIGS. 8 and 9. It has a value calculator 269b. Further, in the physical quantity measuring device 20 of the present embodiment, the gain calculation unit 263 causes the maximum absolute value FAmax of the flow rate waveform with the zero point adjusted as shown in the graphs (B) of FIGS. 8 and 9 to be the frequency analysis unit. By the frequency analysis calculation of H.265, the correction gain is calculated so as to be equal to or less than the limit value at which the overflow does not occur in the frequency analysis unit 265.
- the maximum absolute value FAmax of the flow rate waveform after offset with the zero point adjusted shown in the graphs (B) of FIGS. 8 and 9 is the absolute value of the flow rate corresponding to each flow rate data of the flow rate waveform after offset.
- the value FA is the absolute value FA of the maximum flow rate within the predetermined period.
- the maximum value detection unit 268b detects, for example, a plurality of maximum values and a plurality of minimum values of the flow waveform after offset, and detects the maximum value and the absolute value FA of the flow rate of the minimum value among the detected absolute values FA.
- the maximum value is calculated as the maximum absolute value FAmax.
- the frequency analysis of the flow rate waveform by the frequency analysis unit 265 can be performed on the signed flow rate data to prevent the overflow in the frequency analysis unit 265, and the physical quantity according to the first embodiment described above.
- the same effect as the measuring device 20 can be obtained.
- the intermediate value calculation unit 269a sets the maximum value Fmax of the flow rate waveform as the zero point correction value Z of the flow rate waveform of the graph (A), as shown in FIG.
- the average value of the minimum value Fmin is calculated.
- the correction gain calculated by the gain calculation unit 263 can be calculated based on the maximum absolute value FAmax of the maximum value Fmax and the minimum value Fmin of the flow rate waveform that has a high risk of causing an overflow in the frequency analysis unit 265. .. Therefore, the frequency analysis of the flow rate waveform by the frequency analysis unit 265 can be performed on the signed flow rate data, and the overflow in the frequency analysis unit 265 can be more reliably prevented.
- the intermediate value calculation unit 269a calculates the average value of the flow rate waveform as the zero point correction value Z of the flow rate waveform of the graph (A) as shown in FIG. 9, for example. To do.
- the correction gain calculated by the gain calculation unit 263 can be calculated based on the maximum absolute value FAmax of the maximum value Fmax or the minimum value Fmin of the flow rate waveform that has a high risk of causing an overflow in the frequency analysis unit 265. .. Therefore, the frequency analysis of the flow rate waveform by the frequency analysis unit 265 can be performed on the signed flow rate data, and the overflow in the frequency analysis unit 265 can be more reliably prevented.
- the physical quantity measuring device 20 capable of reducing the frequency analysis error of the gas flow rate, as in the first embodiment.
- FIG. 10 is a block diagram showing the configuration of part of the physical quantity measurement device 20 according to the third embodiment.
- the physical quantity measuring device 20 of the present embodiment is different from the physical quantity measuring device 20 according to the second embodiment shown in FIG. 7 in that it has a common buffer 261d instead of the offset waveform buffer 261b and the correction waveform buffer 261c.
- the other points of the physical quantity measuring device 20 of the present embodiment are the same as those of the physical quantity measuring device 20 according to the second embodiment described above, and therefore, the same parts are denoted by the same reference numerals and the description thereof is omitted.
- the buffer 261 has a flow rate waveform buffer 261a and a common buffer 261d.
- the flow rate waveform buffer 261a stores the flow rate data of gas based on the output signal of the flow rate sensor 205 for a predetermined period, as described above.
- the common buffer 261d stores the flow rate data of the flow rate waveform after the offset whose zero point is adjusted by the offset adjusting unit 262. Further, the common buffer 261d overwrites and stores the flow rate data after the offset with the flow rate data of the flow rate waveform obtained by multiplying the correction gain by the correction calculation unit 264.
Landscapes
- Physics & Mathematics (AREA)
- General Physics & Mathematics (AREA)
- Fluid Mechanics (AREA)
- Measuring Volume Flow (AREA)
Abstract
Description
図1は、本開示の実施形態1に係る物理量測定装置20を使用した電子燃料噴射方式の内燃機関制御システム1のシステム図である。
物理量測定装置20が解決する具体的な課題や奏する具体的な効果は、以下の実施形態に関する記載の中で説明する。
流量出力部270は、信号処理部260から入力された脈動補正後の被計測気体2の流量データを、外部端子を介して物理量測定装置20の外部へ出力する。
さらに、第2副通路溝252は、計測部213のフランジ211の近傍で先端部213aへ向けて、たとえばU字状または円弧状に湾曲して折り返し、計測部213の長手方向すなわち主通路22の中心軸22aに交差する方向、たとえば中心軸22aにおおむね直交する方向に延びている。
第2副通路溝252は、カバー202との間に、第1副通路234aからフランジ211へ向けて分岐して第2出口233に至る第2副通路234bを形成する。
より詳細には、第2副通路234bの上流部237において、流量センサ205は、第1副通路234aと湾曲部238の中間部に配置されている。第2副通路234bは、上記のような湾曲形状を有することで、通路長さをより長く確保することができ、主通路22内の被計測気体2に脈動が生じた場合に、流量センサ205への影響を小さくすることができる。
ゲイン演算部263は、周波数解析部265でオーバーフローが生じないゲインを、上記補正ゲインとして算出する。ここで、オーバーフローとは、算術オーバーフローであり、コンピュータの演算において数値型が表現可能な値の上限を超えること、およびそれによって発生したエラーを意味する。オーバーフローは、「桁あふれ」と呼ばれることもある。ゲイン演算部263は、たとえば、チップパッケージ208に実装された演算装置や記憶装置などの電子部品、および記憶装置に記憶されたプログラムなどによって構成される。
オフセット調整部262は、バッファ261に記憶された上記流量データに基づく流量波形のゼロ点を調整する。ゲイン演算部263は、ゼロ点が調整された流量波形の補正ゲインを算出する。補正演算部264は、ゼロ点が調整された流量波形に補正ゲインを乗じて補正する。周波数解析部265は、補正された流量波形の周波数解析演算を行うとともに演算で得られたデータをバッファ261に記憶させる。そして、ゲイン演算部263は、周波数解析部265でオーバーフローが生じないゲインを上記補正ゲインとして算出する。
図7は、実施形態2に係る物理量測定装置20の一部の構成を示すブロック図である。
図8は、図7に示す物理量測定装置20の信号処理部260による処理の一例を説明するグラフである。図9は、図7に示す物理量測定装置20の信号処理部260による処理の他の一例を説明するグラフである。
図10は、実施形態3に係る物理量測定装置20の一部の構成を示すブロック図である。本実施形態の物理量測定装置20は、オフセット波形バッファ261bおよび補正波形バッファ261cに代えて、共通バッファ261dを有する点で、図7に示す実施形態2に係る物理量測定装置20と異なっている。本実施形態の物理量測定装置20のその他の点は、前述の実施形態2に係る物理量測定装置20と同様であるので、同様の部分には同一の符号を付して説明を省略する。
20 物理量測定装置
205 流量センサ
260 信号処理部
261 バッファ
261a 流量波形バッファ
261b オフセット波形バッファ
261c 補正波形バッファ
261d 共通バッファ
262 オフセット調整部
263 ゲイン演算部
264 補正演算部
265 周波数解析部
268a 最小値検出部
268b 最大値検出部
269a 中間値演算部
269b 最大絶対値演算部
FAmax 最大絶対値
Fmin 最小値
Fmax 最大値
Z ゼロ点補正値
Claims (9)
- 気体の流量に応じた信号を出力する流量センサと、該流量センサの出力信号を処理する信号処理部とを備える物理量測定装置であって、
前記信号処理部は、所定期間の前記出力信号に基づく前記気体の流量データを記憶するバッファと、前記バッファに記憶された前記流量データに基づく流量波形のゼロ点を調整するオフセット調整部と、前記ゼロ点が調整された前記流量波形に乗じる補正ゲインを算出するゲイン演算部と、前記ゼロ点が調整された前記流量波形に前記補正ゲインを乗じて補正する補正演算部と、補正された前記流量波形の周波数解析演算を行うとともに演算で得られたデータを前記バッファに記憶させる周波数解析部と、を有し、
前記ゲイン演算部は、前記周波数解析部でオーバーフローが生じない前記補正ゲインを算出することを特徴とする物理量測定装置。 - 前記信号処理部は、前記流量波形の最小値を検出する最小値検出部を有し、
前記オフセット調整部は、前記最小値を前記流量波形のゼロ点に設定することを特徴とする請求項1に記載の物理量測定装置。 - 前記信号処理部は、前記流量波形の最大値と最小値との間のゼロ点補正値を演算する中間値演算部を有し、
前記オフセット調整部は、前記ゼロ点補正値を前記流量波形のゼロ点に設定することを特徴とする請求項1に記載の物理量測定装置。 - 前記中間値演算部は、前記ゼロ点補正値として、前記流量波形の平均値を演算することを特徴とする請求項3に記載の物理量測定装置。
- 前記中間値演算部は、前記ゼロ点補正値として、前記流量波形の最大値と最小値の平均値を演算することを特徴とする請求項3に記載の物理量測定装置。
- 前記信号処理部は、前記ゼロ点が調整された前記流量波形の最大値を検出する最大値検出部を有し、
前記ゲイン演算部は、前記最大値が、前記周波数解析演算によって前記周波数解析部でオーバーフローが生じない限界値以下になるように、前記補正ゲインを算出することを特徴とする請求項2に記載の物理量測定装置。 - 前記信号処理部は、前記ゼロ点が調整された前記流量波形の最大絶対値を演算する最大絶対値演算部を有し、
前記ゲイン演算部は、前記ゼロ点が調整された前記流量波形の最大絶対値が、前記周波数解析演算によって前記周波数解析部でオーバーフローが生じない限界値以下になるように、前記補正ゲインを算出することを特徴とする請求項3から請求項5のいずれか一項に記載の物理量測定装置。 - 前記バッファは、流量波形バッファと、前記ゼロ点が調整された前記流量波形の流量データを記憶するオフセット波形バッファと、前記補正ゲインを乗じた前記流量波形の流量データを記憶する補正波形バッファと、を有することを特徴とする請求項1に記載の物理量測定装置。
- 前記バッファは、前記ゼロ点が調整された前記流量波形の流量データを記憶するとともに、該流量データに前記補正ゲインを乗じた前記流量波形の流量データを上書きして記憶する共通バッファを有することを特徴とする請求項1に記載の物理量測定装置。
Priority Applications (4)
| Application Number | Priority Date | Filing Date | Title |
|---|---|---|---|
| JP2020558406A JP7091476B2 (ja) | 2018-11-30 | 2019-11-19 | 物理量測定装置 |
| US17/287,871 US11467015B2 (en) | 2018-11-30 | 2019-11-19 | Physical quantity measurement device |
| CN201980064667.9A CN113039412B (zh) | 2018-11-30 | 2019-11-19 | 物理量测定装置 |
| DE112019004912.7T DE112019004912B4 (de) | 2018-11-30 | 2019-11-19 | Messvorrichtung für physikalische Größen |
Applications Claiming Priority (2)
| Application Number | Priority Date | Filing Date | Title |
|---|---|---|---|
| JP2018-225913 | 2018-11-30 | ||
| JP2018225913 | 2018-11-30 |
Publications (1)
| Publication Number | Publication Date |
|---|---|
| WO2020110820A1 true WO2020110820A1 (ja) | 2020-06-04 |
Family
ID=70851985
Family Applications (1)
| Application Number | Title | Priority Date | Filing Date |
|---|---|---|---|
| PCT/JP2019/045178 Ceased WO2020110820A1 (ja) | 2018-11-30 | 2019-11-19 | 物理量測定装置 |
Country Status (5)
| Country | Link |
|---|---|
| US (1) | US11467015B2 (ja) |
| JP (1) | JP7091476B2 (ja) |
| CN (1) | CN113039412B (ja) |
| DE (1) | DE112019004912B4 (ja) |
| WO (1) | WO2020110820A1 (ja) |
Families Citing this family (2)
| Publication number | Priority date | Publication date | Assignee | Title |
|---|---|---|---|---|
| JP7504773B2 (ja) * | 2020-11-06 | 2024-06-24 | 日立Astemo株式会社 | 信号伝送装置、信号伝送システム、情報提供方法 |
| CN117705218B (zh) * | 2024-02-06 | 2024-04-16 | 江苏省计量科学研究院(江苏省能源计量数据中心) | 一种加油机计量数据在线测量的系统及方法 |
Citations (3)
| Publication number | Priority date | Publication date | Assignee | Title |
|---|---|---|---|---|
| JPS58132672A (ja) * | 1982-02-03 | 1983-08-08 | Fuji Photo Film Co Ltd | 周波数分析器のレンジ自動設定装置 |
| JPH01197667A (ja) * | 1988-02-03 | 1989-08-09 | Hitachi Ltd | 周波数計測方式 |
| JPH0526921A (ja) * | 1991-07-24 | 1993-02-05 | Advantest Corp | スペクトラム・アナライザ |
Family Cites Families (18)
| Publication number | Priority date | Publication date | Assignee | Title |
|---|---|---|---|---|
| JP2875919B2 (ja) * | 1991-11-20 | 1999-03-31 | シーケーディ株式会社 | 質量流量計 |
| JPH07295653A (ja) * | 1994-04-26 | 1995-11-10 | Yokogawa Electric Corp | マスフローコントローラ |
| JPH1114418A (ja) * | 1997-06-23 | 1999-01-22 | Hitachi Ltd | 発熱抵抗体式空気流量測定装置の測定誤差補正方法 |
| JP3707610B2 (ja) * | 2001-05-18 | 2005-10-19 | 三菱電機株式会社 | 流量検出装置 |
| JP2005121439A (ja) * | 2003-10-15 | 2005-05-12 | Horiba Ltd | 排ガス流量計測方法およびその装置 |
| CN101057126B (zh) * | 2004-11-11 | 2010-10-06 | 株式会社日立制作所 | 热式流量测定装置 |
| JP5073949B2 (ja) * | 2006-02-02 | 2012-11-14 | 日立オートモティブシステムズ株式会社 | 流量測定装置 |
| WO2007143786A1 (en) * | 2006-06-16 | 2007-12-21 | Inphaze Pty Ltd | A system for complex impedance measurement |
| JP5111180B2 (ja) * | 2008-03-19 | 2012-12-26 | アズビル株式会社 | 熱式流量計 |
| JP2009229092A (ja) * | 2008-03-19 | 2009-10-08 | Yamatake Corp | 熱式流量計およびその初期調整方法 |
| JP2011012593A (ja) * | 2009-07-01 | 2011-01-20 | Hitachi Automotive Systems Ltd | 内燃機関の制御装置 |
| JP5350144B2 (ja) * | 2009-08-31 | 2013-11-27 | 日立オートモティブシステムズ株式会社 | 空気流量演算装置 |
| JP5663447B2 (ja) * | 2011-09-30 | 2015-02-04 | 日立オートモティブシステムズ株式会社 | 気体流量測定装置 |
| DE102012219290A1 (de) * | 2012-10-23 | 2014-04-24 | Continental Automotive Gmbh | Verfahren zum Betreiben eines Luftmassenmessers |
| JP6106559B2 (ja) * | 2013-09-02 | 2017-04-05 | 日立オートモティブシステムズ株式会社 | 熱式流量センサ |
| JP6506681B2 (ja) * | 2015-11-13 | 2019-04-24 | 日立オートモティブシステムズ株式会社 | 空気流量測定装置 |
| WO2019131050A1 (ja) * | 2017-12-27 | 2019-07-04 | 日立オートモティブシステムズ株式会社 | 物理量検出装置 |
| WO2020066548A1 (ja) * | 2018-09-26 | 2020-04-02 | 日立オートモティブシステムズ株式会社 | 内燃機関制御装置 |
-
2019
- 2019-11-19 CN CN201980064667.9A patent/CN113039412B/zh active Active
- 2019-11-19 US US17/287,871 patent/US11467015B2/en active Active
- 2019-11-19 DE DE112019004912.7T patent/DE112019004912B4/de active Active
- 2019-11-19 JP JP2020558406A patent/JP7091476B2/ja active Active
- 2019-11-19 WO PCT/JP2019/045178 patent/WO2020110820A1/ja not_active Ceased
Patent Citations (3)
| Publication number | Priority date | Publication date | Assignee | Title |
|---|---|---|---|---|
| JPS58132672A (ja) * | 1982-02-03 | 1983-08-08 | Fuji Photo Film Co Ltd | 周波数分析器のレンジ自動設定装置 |
| JPH01197667A (ja) * | 1988-02-03 | 1989-08-09 | Hitachi Ltd | 周波数計測方式 |
| JPH0526921A (ja) * | 1991-07-24 | 1993-02-05 | Advantest Corp | スペクトラム・アナライザ |
Also Published As
| Publication number | Publication date |
|---|---|
| CN113039412B (zh) | 2023-09-22 |
| JPWO2020110820A1 (ja) | 2021-09-27 |
| JP7091476B2 (ja) | 2022-06-27 |
| US20210396563A1 (en) | 2021-12-23 |
| DE112019004912T5 (de) | 2021-06-24 |
| US11467015B2 (en) | 2022-10-11 |
| DE112019004912B4 (de) | 2025-09-11 |
| CN113039412A (zh) | 2021-06-25 |
Similar Documents
| Publication | Publication Date | Title |
|---|---|---|
| US9851234B2 (en) | Physical quantity measuring device | |
| JP6247774B2 (ja) | 熱式流量計 | |
| JP7074928B2 (ja) | 物理量検出装置 | |
| JP6995020B2 (ja) | 物理量検出装置 | |
| JP7091476B2 (ja) | 物理量測定装置 | |
| JP7511685B2 (ja) | 物理量検出装置 | |
| CN113597538B (zh) | 物理量检测装置 | |
| JP6198697B2 (ja) | 熱式流量計 | |
| JP7062135B2 (ja) | 物理量検出装置 | |
| EP4060294B1 (en) | Flow rate measurement device | |
| CN113167620B (zh) | 物理量测定装置 | |
| WO2018147004A1 (ja) | 絶対湿度センサ | |
| WO2020003809A1 (ja) | 物理量検出装置 | |
| US20250093188A1 (en) | Air flow meter | |
| US12188799B2 (en) | Physical quantity detection device | |
| US20200340839A1 (en) | Air flow rate measurement device | |
| WO2024224644A1 (ja) | 物理量検出装置 | |
| WO2024247196A1 (ja) | 流量測定装置 | |
| CN117157507A (zh) | 物理量检测装置、信号处理装置和信号处理方法 |
Legal Events
| Date | Code | Title | Description |
|---|---|---|---|
| 121 | Ep: the epo has been informed by wipo that ep was designated in this application |
Ref document number: 19891211 Country of ref document: EP Kind code of ref document: A1 |
|
| ENP | Entry into the national phase |
Ref document number: 2020558406 Country of ref document: JP Kind code of ref document: A |
|
| 122 | Ep: pct application non-entry in european phase |
Ref document number: 19891211 Country of ref document: EP Kind code of ref document: A1 |
|
| WWG | Wipo information: grant in national office |
Ref document number: 112019004912 Country of ref document: DE |