WO2019054254A1 - 表示制御装置およびプログラム - Google Patents
表示制御装置およびプログラム Download PDFInfo
- Publication number
- WO2019054254A1 WO2019054254A1 PCT/JP2018/032903 JP2018032903W WO2019054254A1 WO 2019054254 A1 WO2019054254 A1 WO 2019054254A1 JP 2018032903 W JP2018032903 W JP 2018032903W WO 2019054254 A1 WO2019054254 A1 WO 2019054254A1
- Authority
- WO
- WIPO (PCT)
- Prior art keywords
- pulse wave
- information
- magnitude
- display
- sensor
- Prior art date
- Legal status (The legal status is an assumption and is not a legal conclusion. Google has not performed a legal analysis and makes no representation as to the accuracy of the status listed.)
- Ceased
Links
Images


Classifications
-
- A—HUMAN NECESSITIES
- A61—MEDICAL OR VETERINARY SCIENCE; HYGIENE
- A61B—DIAGNOSIS; SURGERY; IDENTIFICATION
- A61B5/00—Measuring for diagnostic purposes; Identification of persons
- A61B5/68—Arrangements of detecting, measuring or recording means, e.g. sensors, in relation to patient
- A61B5/6801—Arrangements of detecting, measuring or recording means, e.g. sensors, in relation to patient specially adapted to be attached to or worn on the body surface
- A61B5/6802—Sensor mounted on worn items
- A61B5/681—Wristwatch-type devices
-
- A—HUMAN NECESSITIES
- A61—MEDICAL OR VETERINARY SCIENCE; HYGIENE
- A61B—DIAGNOSIS; SURGERY; IDENTIFICATION
- A61B5/00—Measuring for diagnostic purposes; Identification of persons
- A61B5/02—Detecting, measuring or recording for evaluating the cardiovascular system, e.g. pulse, heart rate, blood pressure or blood flow
- A61B5/021—Measuring pressure in heart or blood vessels
- A61B5/022—Measuring pressure in heart or blood vessels by applying pressure to close blood vessels, e.g. against the skin; Ophthalmodynamometers
- A61B5/02225—Measuring pressure in heart or blood vessels by applying pressure to close blood vessels, e.g. against the skin; Ophthalmodynamometers using the oscillometric method
-
- A—HUMAN NECESSITIES
- A61—MEDICAL OR VETERINARY SCIENCE; HYGIENE
- A61B—DIAGNOSIS; SURGERY; IDENTIFICATION
- A61B5/00—Measuring for diagnostic purposes; Identification of persons
- A61B5/05—Detecting, measuring or recording for diagnosis by means of electric currents or magnetic fields; Measuring using microwaves or radio waves
- A61B5/053—Measuring electrical impedance or conductance of a portion of the body
-
- A—HUMAN NECESSITIES
- A61—MEDICAL OR VETERINARY SCIENCE; HYGIENE
- A61B—DIAGNOSIS; SURGERY; IDENTIFICATION
- A61B5/00—Measuring for diagnostic purposes; Identification of persons
- A61B5/68—Arrangements of detecting, measuring or recording means, e.g. sensors, in relation to patient
- A61B5/6801—Arrangements of detecting, measuring or recording means, e.g. sensors, in relation to patient specially adapted to be attached to or worn on the body surface
- A61B5/684—Indicating the position of the sensor on the body
-
- A—HUMAN NECESSITIES
- A61—MEDICAL OR VETERINARY SCIENCE; HYGIENE
- A61B—DIAGNOSIS; SURGERY; IDENTIFICATION
- A61B5/00—Measuring for diagnostic purposes; Identification of persons
- A61B5/70—Means for positioning the patient in relation to the detecting, measuring or recording means
-
- A—HUMAN NECESSITIES
- A61—MEDICAL OR VETERINARY SCIENCE; HYGIENE
- A61B—DIAGNOSIS; SURGERY; IDENTIFICATION
- A61B5/00—Measuring for diagnostic purposes; Identification of persons
- A61B5/74—Details of notification to user or communication with user or patient; User input means
- A61B5/742—Details of notification to user or communication with user or patient; User input means using visual displays
- A61B5/743—Displaying an image simultaneously with additional graphical information, e.g. symbols, charts, function plots
-
- A—HUMAN NECESSITIES
- A61—MEDICAL OR VETERINARY SCIENCE; HYGIENE
- A61B—DIAGNOSIS; SURGERY; IDENTIFICATION
- A61B2562/00—Details of sensors; Constructional details of sensor housings or probes; Accessories for sensors
- A61B2562/04—Arrangements of multiple sensors of the same type
- A61B2562/043—Arrangements of multiple sensors of the same type in a linear array
-
- A—HUMAN NECESSITIES
- A61—MEDICAL OR VETERINARY SCIENCE; HYGIENE
- A61B—DIAGNOSIS; SURGERY; IDENTIFICATION
- A61B5/00—Measuring for diagnostic purposes; Identification of persons
- A61B5/02—Detecting, measuring or recording for evaluating the cardiovascular system, e.g. pulse, heart rate, blood pressure or blood flow
- A61B5/021—Measuring pressure in heart or blood vessels
- A61B5/02108—Measuring pressure in heart or blood vessels from analysis of pulse wave characteristics
- A61B5/02116—Measuring pressure in heart or blood vessels from analysis of pulse wave characteristics of pulse wave amplitude
-
- A—HUMAN NECESSITIES
- A61—MEDICAL OR VETERINARY SCIENCE; HYGIENE
- A61B—DIAGNOSIS; SURGERY; IDENTIFICATION
- A61B5/00—Measuring for diagnostic purposes; Identification of persons
- A61B5/02—Detecting, measuring or recording for evaluating the cardiovascular system, e.g. pulse, heart rate, blood pressure or blood flow
- A61B5/021—Measuring pressure in heart or blood vessels
- A61B5/02108—Measuring pressure in heart or blood vessels from analysis of pulse wave characteristics
- A61B5/02125—Measuring pressure in heart or blood vessels from analysis of pulse wave characteristics of pulse wave propagation time
Definitions
- the present disclosure relates to a display control device and program, and more particularly to a display control device and program of pulse wave information.
- Patent Document 1 Japanese Patent Application Laid-Open No. 2004-222814 discloses that the magnitude of a pressure pulse wave detected by pressure detection elements arranged in a line is displayed on a display.
- Patent Document 2 discloses a configuration for adjusting the position of a pulse wave detection circuit while viewing the display of the amplitude value of a detected pulse wave.
- An object in one aspect of the present disclosure is to provide a display control device and a program that present information for aligning a pulse wave sensor with respect to a measurement site when measuring a pulse wave propagation time.
- a display control device provided in a measurement device.
- the measuring device includes a belt wound around and mounted at a measurement site of pulse wave propagation time, a sensor section provided on an inner circumferential surface which is a surface on the side of the measurement site of the belt when the belt is mounted, and And a display provided on an outer peripheral surface which is a surface opposite to the peripheral surface.
- the display is provided on the outer peripheral surface at a portion that can face the portion where the sensor unit is located when the belt is mounted, and the sensor unit is provided at a position apart from each other in the width direction of the belt And a second pulse wave sensor.
- the display control device is configured such that, in the display, the magnitude of the first pulse wave amplitude indicated by the output of the first pulse wave sensor at a position corresponding to each of the first pulse wave sensor and the second pulse wave sensor disposed apart from each other. And second indicator information representing the magnitude of the second pulse wave amplitude indicated by the output of the second pulse wave sensor.
- the display control device is guide information according to the magnitude of the first pulse wave amplitude and the magnitude of the second pulse wave amplitude, and is for adjusting the relative positional relationship between the sensor unit and the measurement site. Display guide information on the display.
- the display control device displays the guide information on the same screen as the first indicator information and the second indicator information on the display.
- the guide information includes information for guiding a direction in which the position of the sensor unit with respect to the measurement site is moved.
- the guide information displays information for guiding the moving direction.
- the guide information includes information for guiding fixing of the position of the sensor unit.
- the guide information replaces the information for guiding the direction of movement, and It contains information to guide fixing the position.
- the information indicating the magnitude of the first pulse wave amplitude and the information indicating the magnitude of the second pulse wave amplitude each have a display mode in the case where the magnitude of the pulse wave amplitude indicates a predetermined magnitude. And the display mode in the case where the predetermined size is not indicated.
- the guide information includes information for evaluating the state of attachment to the measurement site, and the information to be evaluated predetermines the magnitude of the first pulse wave amplitude and the magnitude of the second pulse wave amplitude during attachment.
- the information to be evaluated predetermines the magnitude of the first pulse wave amplitude and the magnitude of the second pulse wave amplitude during attachment.
- different evaluations are indicated.
- the guide information includes information prompting re-rolling of the winding.
- the measurement apparatus further includes a communication unit that communicates with an external information processing apparatus including a display unit, and transmits guide information to the information processing apparatus via the communication unit in order to cause the display unit to display the guide information.
- a communication unit that communicates with an external information processing apparatus including a display unit, and transmits guide information to the information processing apparatus via the communication unit in order to cause the display unit to display the guide information.
- the pulse wave propagation time is calculated from the magnitude of the first pulse wave amplitude and the magnitude of the second pulse wave amplitude, and the measurement device calculates the blood pressure based on the pulse wave transit time.
- the guide information includes information for evaluating the state of attachment to the measurement site, and the display control device displays the information for evaluating the state of attachment in association with the information for evaluating the calculated blood pressure.
- the display control device when the display control device further displays guide information, when the magnitude of the first pulse wave amplitude or the magnitude of the second pulse wave amplitude changes, information for notifying the change in the guide information is displayed.
- a program for causing a computer to execute a display control method in an apparatus comprises a belt wound around and mounted at a measurement site of pulse wave propagation time, a sensor section provided on an inner peripheral surface which is a surface on the side of the measurement site of the belt when the belt is mounted, and A display provided on an outer circumferential surface which is a surface opposite to the circumferential surface, the display being provided on the outer circumferential surface at a portion which can face a portion where the sensor unit is located when the belt is attached,
- the sensor unit includes a first pulse wave sensor and a second pulse wave sensor provided at mutually spaced positions in the width direction of the belt.
- the display control method causes the display to display the first indicator information and the second indicator information respectively at positions corresponding to the first pulse wave sensor and the second pulse wave sensor disposed apart from each other.
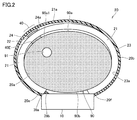
- FIG. 1 is an external perspective view of a sphygmomanometer 1 according to a first embodiment.
- FIG. 5 is a diagram showing a state in which the blood pressure monitor 1 according to Embodiment 1 is attached to the left wrist 90. It is a figure which shows the planar layout of the electrode group for impedance measurement in the state with which the sphygmomanometer 1 of FIG. 1 was mounted
- FIG. FIG. 2 is a block diagram showing a control system of the sphygmomanometer 1 according to the first embodiment.
- FIG. 5 is a schematic diagram for illustrating blood pressure measurement based on pulse wave propagation time according to the first embodiment.
- FIG. 10 is a schematic cross-sectional view along the longitudinal direction of the wrist in a state where the sphygmomanometer 1 is attached to the wrist 90 when performing blood pressure measurement by the oscillometric method according to the first embodiment.
- FIG. 7 is a diagram for explaining the determination of the mounting state of the sensor unit according to the first embodiment.
- FIG. 5 is a diagram schematically showing the configuration of a function for outputting guide information according to Embodiment 1, in association with a blood pressure measurement function. It is a flowchart which shows the process of the blood pressure measurement based on the output of the guide information which concerns on Embodiment 1, and pulse wave propagation time. 5 is a view showing another display example of guide information according to Embodiment 1.
- FIG. 1 is a schematic cross-sectional view along the longitudinal direction of the wrist in a state where the sphygmomanometer 1 is attached to the wrist 90 when performing blood pressure measurement by the oscillometric method according to the first embodiment.
- FIG. 7 is a diagram for
- FIG. 5 is a view showing another display example of guide information according to Embodiment 1.
- FIG. 5 is a view showing another display example of guide information according to Embodiment 1.
- FIG. 5 is a diagram showing an example of storage of measurement results according to the first embodiment.
- 5 is a view showing another display example according to Embodiment 1.
- FIG. 10 is a diagram showing still another display example according to Embodiment 1;
- FIG. 10 is a diagram showing still another display example according to Embodiment 1;
- FIG. 10 is a diagram showing still another display example according to Embodiment 1;
- FIG. 8 is a diagram showing a schematic configuration of a system according to a second embodiment.
- the sphygmomanometer which is a wearable terminal is illustrated as an apparatus which measures a pulse wave propagation time (it is hereafter called PTT), and the case where a "display control apparatus" is mounted in a sphygmomanometer is demonstrated.
- the device mounting the “display control device” may be any device including a sensor that detects a pulse wave signal and a processing device that processes a signal detected by the sensor, and is not limited to the sphygmomanometer.
- the sphygmomanometer is not limited to a wearable terminal.
- FIG. 1 is an external perspective view of the sphygmomanometer 1 according to the first embodiment.
- FIG. 2 schematically shows a cross section perpendicular to the longitudinal direction of the wrist 90 in a state in which the sphygmomanometer 1 according to the first embodiment is attached to the left wrist 90 (hereinafter also referred to as “mounted state”).
- the left wrist 90 is the measurement site.
- the “measurement site” may be a site through which an artery passes, and is not limited to the wrist.
- the measurement site may be, for example, the lower limbs such as the right wrist, the upper arm, the ankle, and the thigh.
- belt 20 is a belt-like member.
- the belt 20 is slidably wound and mounted in the mounted state so that the longitudinal direction of the belt 20 corresponds to the circumferential direction of the wrist 90.
- the dimension (width dimension) in the width direction Y of the belt 20 is, for example, about 30 mm.
- Belt 20 includes a band 23 and a compression cuff 21.
- the strip 23 has an inner circumferential surface 23a which is a surface on the measurement site side and an outer circumferential surface 20b which is a surface opposite to the inner circumferential surface 23a.
- the compression cuff 21 is attached along the inner circumferential surface 23 a of the strip 23 and has an inner circumferential surface 20 a in contact with the wrist 90 (see FIG. 2).
- the compression cuff 21 is configured as a fluid bag by facing two stretchable polyurethane sheets in the thickness direction and welding their peripheral portions.
- the fluid bag of the compression cuff 21 may be a bag-like member capable of containing a fluid.
- the compression cuff 21 is inflated when the fluid is supplied, and the measurement site is pressurized as the compression cuff 21 is inflated. In addition, when the fluid is discharged, the compression cuff 21 contracts and the pressurization state of the measurement site is released.
- the main body 10 is provided integrally with one end 20 e of the belt 20.
- the belt 20 and the main body 10 may be separately formed, and the main body 10 may be integrally attached to the belt 20 via an engaging member (for example, a hinge).
- the portion where the main body 10 is disposed corresponds to the back side surface (surface on the back side of the hand) 90b of the wrist 90 in the mounted state (see FIG. 2).
- FIG. 2 a radial artery 91 passing near the palmar side (palm side) 90a in the wrist 90 is shown.
- the main body 10 has a three-dimensional shape having a thickness in a direction perpendicular to the outer circumferential surface 20 b of the belt 20.
- the main body 10 is small and thin so as not to interfere with the daily activities of the user.
- the main body 10 has a quadrangular frustum-shaped contour protruding outward from the belt 20.
- a display 50 is provided on the top surface (the surface farthest from the measurement site) 10 a of the main body 10.
- An operation unit 52 for inputting an instruction from the user is provided along the side surface 10f of the main body 10 (the left side front side surface in FIG. 1) 10f.
- a sensor section 40 is provided on the inner peripheral surface 20a of the belt 20 (that is, the inner peripheral surface 20a of the compression cuff 21) at a portion between the one end 20e and the other end 20f of the belt 20.
- the sensor unit 40 has a function of detecting a pulse wave using an impedance measurement function.
- An electrode group 40E is disposed on the inner circumferential surface 20a of the portion where the sensor unit 40 is disposed.
- the electrode group 40E has six plate-like (or sheet-like) electrodes 41 to arranged in a state of being separated from each other in the width direction Y of the belt 20.
- the part where the electrode group 40E is disposed corresponds to the radial artery 91 of the wrist 90 in the mounted state.
- the solid 22 may be disposed at a position corresponding to the electrode group 40E on the outer circumferential surface 21a.
- a pressure cuff 24 is disposed on the outer peripheral side of the solid 22.
- the pressing cuff 24 is an expanding member that locally suppresses a region corresponding to the electrode group 40E in the circumferential direction of the compression cuff 21.
- the pressure cuff 24 is disposed on the inner circumferential surface 23 a of the strip 23 that constitutes the belt 20 (see FIG. 2).
- the strip 23 is made of a plastic material that is flexible in the thickness direction and inelastic in the circumferential direction (longitudinal direction).
- the pressing cuff 24 is a fluid bag that expands and contracts in the thickness direction of the belt 20, and is pressurized by the supply of fluid and is not pressurized by discharging the fluid.
- the pressure cuff 24 is configured as, for example, a fluid bag by facing two stretchable polyurethane sheets in the thickness direction and welding their peripheral portions.
- the solid 22 is disposed at a position corresponding to the electrode group 40 ⁇ / b> E on the inner circumferential surface 24 a of the pressing cuff 24.
- the solid 22 is made of, for example, a plate-like resin (for example, polypropylene) having a thickness of about 1 to 2 mm.
- the belt 20, the pressing cuff 24, and the solid 22 are used as the pressing portion.
- the bottom surface 10b (the surface closest to the measurement site) 10b of the main body 10 and the end 20f of the belt 20 are three-fold buckles 15 (hereinafter, also simply referred to as "buckles 15"). Connected by.
- the buckle 15 includes a plate-like member 25 disposed on the outer circumferential side and a plate-like member 26 disposed on the inner circumferential side.
- One end 25 e of the plate member 25 is rotatably attached to the main body 10 via a connecting rod 27 extending along the width direction Y.
- the other end 25 f of the plate 25 is rotatably attached to one end 26 e of the plate 26 via a connecting rod 28 extending in the width direction Y.
- the other end 26 f of the plate member 26 is fixed by the fixing portion 29 in the vicinity of the end 20 f of the belt 20.
- the mounting position of the fixing portion 29 is variably set in advance in accordance with the circumferential length of the wrist 90 of the user.
- the sphygmomanometer 1 (belt 20) is generally formed in a substantially annular shape, and the bottom surface 10b of the main body 10 and the end 20f of the belt 20 can be opened and closed in the arrow B direction in FIG. Configured
- the user When mounting the sphygmomanometer 1 on the wrist 90, the user passes the left hand through the belt 20 from the direction indicated by the arrow A in FIG. 1 with the buckle 15 opened and the diameter of the ring of the belt 20 increased.
- the user adjusts the angular position of the belt 20 around the wrist 90 by sliding or the like, and moves the sensor unit 40 so as to be positioned on the radial artery 91.
- the electrode group 40E of the sensor unit 40 abuts on a portion 90a1 of the palm lateral surface 90a of the wrist 90 corresponding to the radial artery 91.
- the user closes and fixes the buckle 15.
- the user winds and wears the sphygmomanometer 1 (belt 20) around the wrist 90.
- FIG. 3 is a diagram showing a planar layout of the electrode group for impedance measurement in a state where the sphygmomanometer 1 according to the first embodiment is attached to the wrist 90.
- the electrode group 40E of the sensor unit 40 in the worn state, is aligned along the longitudinal direction of the wrist corresponding to the radial artery 91 of the left wrist 90.
- Electrode group 40E includes current electrode pairs 41 and 46 for current conduction disposed on both sides in the width direction Y, and detection electrode pairs 42 and 43 and detection electrode pair 44 disposed between the current electrode pairs 41 and 46. , 45 and so on.
- the first pulse wave sensor 40-1 includes detection electrode pairs 42 and 43
- the second pulse wave sensor 40-2 includes detection electrode pairs 44 and 45.
- Detection electrode pairs 44 and 45 are arranged corresponding to the downstream side of the blood flow of the radial artery 91 with respect to the detection electrode pairs 42 and 43.
- a distance D (see FIG. 5A described later) between the center of the detection electrode pair 42, 43 and the center of the detection electrode pair 44, 45 is set to, for example, 20 mm.
- the interval D corresponds to the interval between the first pulse wave sensor 40-1 and the second pulse wave sensor 40-2.
- the distance between the detection electrode pair 42, 43 and the distance between the detection electrode pair 44, 45 are both set to, for example, 2 mm.
- the sphygmomanometer 1 can configure the belt 20 to be thin as a whole.
- the electrode group 40E can be flexibly configured, the electrode group 40E does not prevent the compression of the left wrist 90 by the compression cuff 21, and does not impair the accuracy of blood pressure measurement by the oscillometric method described later.
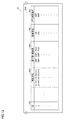
- FIG. 4 is a block diagram of a control system of the sphygmomanometer 1 according to the first embodiment.
- the sphygmomanometer 1 has an oscillometric blood pressure measurement function and a blood pressure measurement function based on PTT.
- the sphygmomanometer 1 of FIG. 4 exemplifies a configuration using air as a fluid.
- the main unit 10 includes a central processing unit (CPU) 100 functioning as a control unit, a display 50, a memory 51 functioning as a storage unit, an operation unit 52, a battery 53, and a communication unit 59. And. Further, the main body 10 includes a first pressure sensor 31, a pump 32, a valve 33, a second pressure sensor 34, and a switching valve 35. The switching valve 35 switches the connection destination of the pump 32 and the valve 33 to the compression cuff 21 or the pressing cuff 24.
- CPU central processing unit
- the main body 10 includes a first pressure sensor 31, a pump 32, a valve 33, a second pressure sensor 34, and a switching valve 35.
- the switching valve 35 switches the connection destination of the pump 32 and the valve 33 to the compression cuff 21 or the pressing cuff 24.
- the main body 10 includes an oscillation circuit 310 and an oscillation circuit 340 that convert outputs from the first pressure sensor 31 and the second pressure sensor 34 into frequencies, and a pump drive circuit 320 that drives the pump 32.
- the sensor unit 40 includes an electrode group 40E and a conduction and voltage detection circuit 49.
- the display 50 is configured of, for example, an organic EL (Electro Luminescence) display, and displays information in accordance with a control signal from the CPU 100. This information includes the measurement results.
- the display 50 is not limited to the organic EL display, and may be configured of another type of display such as, for example, an LCD (Liquid Cristal Display).
- the operation unit 52 is, for example, a push-type switch, and inputs an operation signal to the CPU 100 in accordance with an instruction to start or stop blood pressure measurement by the user.
- the operation unit 52 is not limited to the push-type switch, and may be, for example, a pressure-sensitive (resistive) or proximity-type (electrostatic capacitive) touch panel switch.
- the main body 10 may include a microphone (not shown), and may receive an instruction to start blood pressure measurement by the user's voice.
- the memory 51 is data of a program for controlling the sphygmomanometer 1, data used to control the sphygmomanometer 1, setting data for setting various functions of the sphygmomanometer 1, data of measurement results of blood pressure values, etc. Is stored temporarily.
- the memory 51 is also used as a work memory or the like when a program is executed.
- the CPU 100 executes various functions as a control unit in accordance with a program for controlling the sphygmomanometer 1 stored in the memory 51. For example, when performing blood pressure measurement by the oscillometric method, when the CPU 100 receives an instruction to start blood pressure measurement from the operation unit 52, the pump 32 (and the valve 33) is received based on the signal from the first pressure sensor 31. Drive). Further, the CPU 100 calculates the blood pressure value (systolic blood pressure (systolic blood pressure) and diastolic blood pressure (Diastolic blood pressure)) based on the signal from the first pressure sensor 31 and the pulse. Calculate the number.
- systolic blood pressure systolic blood pressure
- Diastolic blood pressure diastolic blood pressure
- the CPU 100 When performing blood pressure measurement based on PTT, the CPU 100 performs control to drive the valve 33 in order to discharge air in the compression cuff 21 in accordance with an instruction to start blood pressure measurement from the operation unit 52. Further, the CPU 100 controls the switching valve 35 to switch the connection destination of the pump 32 (and the valve 33) to the pressure cuff 24. Furthermore, based on the signal from the second pressure sensor 34, the CPU 100 performs control to calculate the blood pressure value.
- Communication unit 59 is controlled by CPU 100 to communicate with an external information processing apparatus via network 900.
- the external information processing apparatus may include a portable terminal 10B and a server 30, which will be described later, but is not limited to these apparatuses.
- Communication via network 900 may include wireless or wired.
- the network 900 may include the Internet and a LAN (Local Area Network). Alternatively, it may include one-to-one communication using a USB cable.
- the communication unit 59 may include a micro USB connector.
- the pump 32 and the valve 33 are connected to the compression cuff 21 and the pressure cuff 24 via the switching valve 35 and the air pipes 39a and 39b.
- the first pressure sensor 31 is connected to the compression force cuff 21 and the pressing cuff 24 via the air pipe 38a and the second pressure sensor 34 via the air pipe 38b.
- the first pressure sensor 31 detects the pressure in the compression cuff 21 via the air pipe 38a.
- the switching valve 35 is driven based on a control signal supplied from the CPU 100 and switches the connection destination of the pump 32 and the valve 33 to the compression cuff 21 or the pressing cuff 24.
- the pump 32 is configured of, for example, a piezoelectric pump.
- the pump 32 passes the air pipe 39a to pressurize the pressure (cuff pressure) in the compression cuff 21.
- the compression cuff 21 is supplied with air as a fluid for pressurization.
- the pump 32 passes the air pipe 39 b to pressurize the pressure (cuff pressure) in the pressure cuff 24. Air is supplied to the pressure cuff 24.
- the valve 33 is mounted on the pump 32, and is configured to be controlled in opening / closing as the pump 32 is turned on / off. Specifically, when the connection destination of the pump 32 and the valve 33 is switched to the compression cuff 21 by the switching valve 35, the valve 33 is closed when the pump 32 is turned on, and the pressure cuff 21 is While the air is enclosed, it is opened when the pump 32 is turned off, and the air of the compression cuff 21 is exhausted to the atmosphere through the air pipe 39a.
- Pump drive circuit 320 drives pump 32 based on a control signal supplied from CPU 100.
- the first pressure sensor 31 is, for example, a piezoresistive pressure sensor, and is connected to the pump 32, the valve 33, and the compression cuff 21 via an air pipe 38a.
- the first pressure sensor 31 detects the pressure of the belt 20 (the compression cuff 21), for example, the pressure based on the atmospheric pressure (zero) via the air pipe 38a, and outputs it as a time-series signal.
- the oscillation circuit 310 outputs, to the CPU 100, a frequency signal having a frequency corresponding to an electrical signal value based on a change in electrical resistance due to the piezoresistive effect from the first pressure sensor 31.
- the output of the first pressure sensor 31 is used to control the pressure of the compression force 21 and to calculate the blood pressure value by oscillometric method.
- the second pressure sensor 34 is, for example, a piezoresistive pressure sensor, and is connected to the pump 32, the valve 33, and the pressing cuff 24 via an air pipe 38b.
- the second pressure sensor 34 detects the pressure of the pressure cuff 24, for example, the pressure with the atmospheric pressure as a reference (zero) through the air pipe 38b, and outputs it as a time-series signal.
- the oscillation circuit 340 oscillates according to the electrical signal value based on the change in electrical resistance due to the piezoresistive effect from the second pressure sensor 34, and the CPU 100 generates a frequency signal having a frequency according to the electrical signal value of the second pressure sensor 34.
- Output to The output of the second pressure sensor 34 is used to control the pressure of the pressure cuff 24 and to calculate the PTT-based blood pressure.
- the CPU 100 controls the pump 32 and the valve 33 to pressurize and depressurize the cuff pressure according to various conditions.
- the battery 53 supplies power to various elements mounted on the main body 10.
- the battery 53 also supplies power to the energization of the sensor unit 40 and the voltage detection circuit 49 through the wiring 71.
- the wire 71 extends between the main body 10 and the sensor portion 40 along the circumferential direction of the belt 20 in a state of being sandwiched between the strip 23 of the belt 20 and the compression cuff 21 together with the wire 72 for signal. It is provided.
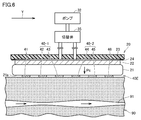
- FIG. 5 is a schematic view for explaining blood pressure measurement based on pulse wave propagation time according to the first embodiment.
- FIG. 5A is a schematic cross-sectional view along the longitudinal direction of the wrist when blood pressure measurement based on pulse wave propagation time is performed in a state where the sphygmomanometer 1 is attached to the wrist 90.
- FIG. 5B is a diagram showing the waveforms of pulse wave signals PS1 and PS2.
- the sensor unit 40 is located above the radial artery 91 at the measurement site.
- voltage detection circuit 49 applies a predetermined voltage between current electrode pairs 41 and 46 using a booster circuit, a voltage adjustment circuit, etc.
- a high frequency constant current i of 1 mA is applied.
- the voltage detection circuit 49 is configured such that the voltage signal v1 between the detection electrode pair 42, 43 constituting the first pulse wave sensor 40-1 and the detection electrode pair 44, 45 constituting the second pulse wave sensor 40-2 And the voltage signal v2 of the
- the voltage signals v1 and v2 are pulses of the blood flow of the radial artery 91 in portions of the palm side 90a of the left wrist 90, which are opposed to the first pulse wave sensor 40-1 and the second pulse wave sensor 40-2, respectively. Represents the change in electrical impedance due to waves.
- the amplifier 401 of the voltage detection circuit 49 is configured to include, for example, an operational amplifier, and amplifies the voltage signals v1 and v2.
- the analog filter 403 performs a filtering process on the amplified voltage signals v1 and v2. Specifically, the analog filter 403 removes noise other than the frequency that characterizes the voltage signals v1 and v2 (pulse wave signal), and performs a filtering process to improve the S / N.
- the A / D converter 405 converts the voltage signals v1 and v2 subjected to the filtering process from analog data to digital data, and outputs the data to the CPU 100 through the wiring 72.
- the CPU 100 performs predetermined signal processing on the input voltage signals v1 and v2 (digital data) to generate pulse wave signals PS1 and PS2 having a mountain-like waveform as shown in FIG. 5 (B).
- the voltage signals v1 and v2 are, for example, about 1 mv. Moreover, each peak A1, A2 of pulse wave signal PS1, PS2 is about 1V, for example.
- PWV Pulse Wave Velocity
- the pressure cuff 24 is in a pressurized state, and the pressure cuff 21 is in a non-pressurized state by discharging the internal air.
- the pressure cuff 24 and the solid 22 are disposed across the first pulse wave sensor 40-1, the second pulse wave sensor 40-2, and the current electrode pair 41, 46 in the arterial direction of the radial artery 91. Therefore, when the pressure cuff 24 is pressurized by the pump 32, the first pulse wave sensor 40-1, the second pulse wave sensor 40-2, and the current electrode pair 41, 46 are wrist-linked via the solid material 22.
- the palm side 90 a of 90 is pressed.
- the pressing force of each of the current electrode pairs 41 and 46, the first pulse wave sensor 40-1, and the second pulse wave sensor 40-2 on the palm side 90a of the wrist 90 can be set to an appropriate value.
- the pressure cuff 24 of the fluid bag is used as the pressing portion, the pump 32 and the valve 33 can be used in common with the compression cuff 21, and the configuration can be simplified.
- the first pulse wave sensor 40-1, the second pulse wave sensor 40-2, and the current electrode pair 41, 46 can be pressed through the solid 22, the pressing force on the measurement site becomes uniform, and the accuracy is high. Blood pressure measurement based on pulse wave transit time can be performed.
- the CPU 100 drives the switching valve 35 according to the instruction to switch the connection destination of the pump 32 and the valve 33 to the pressure cuff 24. Thereafter, the CPU 100 closes the valve 33 and drives the pump 32 through the pump drive circuit 320 to send air to the pressure cuff 24 to increase the cuff pressure Pc which is the pressure in the pressure cuff 24 at a constant speed.
- the CPU 100 outputs first and second pulse wave signals PS1 and PS2 output in time series by the first and second pulse wave sensors 40-1 and 40-2, respectively.
- PS2 is acquired, and the cross-correlation coefficient r between the waveforms of the first and second pulse wave signals PS1 and PS2 is calculated in real time.
- the time difference ⁇ t between the peaks A1 and A2 of the amplitudes of the first and second pulse wave signals PS1 and PS2 is calculated as PTT (pulse wave propagation time).
- the CPU 100 repeatedly executes calculation of PTT and calculation of the blood pressure EBP while an instruction to stop measurement is not issued via the operation unit 52.
- the CPU 100 displays the blood pressure EBP on the display 50 and stores it in the memory 51.
- the CPU 100 controls each unit to end the measurement operation.
- the sensor part 40 utilized the electrode for impedance measurement in order to measure a pulse wave signal, it is not limited to this.
- the sensor unit 40 may include a pressure sensor or a light sensor to measure pulse wave signals.
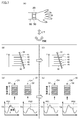
- FIG. 6 is a schematic cross-sectional view along the longitudinal direction of the wrist in a state where the sphygmomanometer 1 is attached to the wrist 90 when blood pressure measurement by the oscillometric method according to the first embodiment is performed.
- the pressure cuff 24 is in a non-pressurized state by discharging the air therein, and the compression cuff 21 is in a pressurized state in which the air is supplied.
- the compression cuff 21 extends in the circumferential direction of the wrist 90, and when pressed by the pump 32, uniformly compresses the circumferential direction of the left wrist 90. Since only the electrode group 40E exists between the inner peripheral surface of the compression cuff 21 and the left wrist 90, the compression by the compression cuff 21 is not blocked by other members, and the blood vessel is sufficiently closed. be able to.
- the CPU 100 calculates (estimates blood pressure according to the output waveform from the first pressure sensor 31 via the oscillation circuit 310 detected in the pressurization process or decompression process of the compression cuff 21 to the measurement site. ).
- the method of calculating blood pressure by the oscillometric method according to the present embodiment follows a known method, and therefore the description will not be repeated here.
- CPU 100 determines whether sphygmomanometer 1 is in the attached state. Specifically, when the belt 20 is wound around and attached to the measurement site, the belt 20 (compression cuff 21) is pressed against the measurement site. The first pressure sensor 31 detects this pressing force via the air pipe 38a.
- the CPU 100 detects a pressing force from the output of the first pressure sensor 31 via the oscillation circuit 310.
- the CPU 100 compares the pressing force detected via the first pressure sensor 31 with a predetermined threshold P.
- the comparison result satisfies the condition of (pressure magnitude> threshold value P)
- the CPU 100 determines that the sphygmomanometer 1 is in the mounted state, and the comparison result is (pressure magnitude ⁇ threshold value P).
- the condition of) is satisfied, the CPU 100 determines that the sphygmomanometer 1 is not in the worn state. Therefore, while the sphygmomanometer 1 is continuously determined to be in the wearing state, the CPU 100 determines that the sphygmomanometer 1 is being worn.
- the threshold value P is obtained in advance by experiment or the like.
- the determination method of the mounting state described above is a method using the pressing force detected by the first pressure sensor 31, it may be a method using the pressing force detected by the second pressure sensor 34. Alternatively, the determination may be made based on the pressing force detected by both the first pressure sensor 31 and the second pressure sensor 34.
- the determination of the mounting state is not limited to the determination based on the magnitude of the pressing force described above.
- the CPU 100 may determine whether or not it is in the mounted state (or in the mounting state).
- the accuracy of the PTT-based measured blood pressure is a feature of the waveform of the pulse wave signal output from the pulse wave sensor (cross correlation coefficient r and peak of amplitude) It depends on the detection accuracy of A1, A2). Therefore, accurate detection of the pulse wave signal is required. That is, it is necessary to arrange the first pulse wave sensor 40-1 and the second pulse wave sensor 40-2 of the sensor unit 40 on the measurement site (more specifically, the radial artery 91).
- guide information for position adjustment is provided. Is displayed on the display 50.
- the guide information includes a predetermined amplitude A1 of the amplitude of the first pulse wave signal PS1 of the first pulse wave sensor 40-1 and a peak A2 of the amplitude of the second pulse wave signal PS2 of the second pulse wave sensor. As such, it includes information for assisting in adjusting the relative positional relationship between the sensor unit 40 and the measurement site.
- the user adjusts the position of the sensor unit 40 in the mounted state, supported by the guide information.
- the user pushes and shifts (slides) the housing of the display 50 in the width direction Y in the mounted state to move the position of the sensor unit 40 up and down with respect to the measurement site (direction in which the left arm extends) Can be moved to
- the user pushes and shifts (slides) the housing of the display 50 in the direction intersecting the width direction Y in the mounted state to move the position of the sensor unit 40 in the left-right direction (the direction in which the left arm extends) Can be moved in a direction substantially crossing the
- the guide information includes information for evaluating the mounting state. Specifically, when the magnitudes of the amplitudes of the first pulse wave signal PS1 and the second pulse wave signal PS2 exceed the threshold value TA, the CPU 100 evaluates the wearing state as "OK". On the other hand, when the magnitude of the amplitude of at least one of the first pulse wave signal PS1 and the second pulse wave signal PS2 is less than or equal to the threshold value TA, the CPU 100 evaluates the mounting state as "NG".
- the threshold value TA is a value corresponding to a predetermined accuracy of the measured blood pressure based on the PTT, and indicates a value acquired in an experiment.
- the user can confirm that the position adjustment has succeeded by confirming "OK", and it is determined that the position adjustment has not succeeded by continuing the adjustment by confirming "NG”. can do.
- the wearing state is determined as “NG”
- the CPU 100 does not start the blood pressure measurement process, and when “OK” is determined, the CPU 100 can start the blood pressure measurement process (step S8 in FIG. 9 described later). reference). Therefore, the evaluation result of the wearing state can be used to determine the start of the blood pressure measurement process.
- the evaluation that the mounting state is "OK” indicates that the relative positional relationship between the sensor unit 40 and the measurement site is a relationship that can obtain the accuracy of PTT-based blood pressure measurement. More specifically, it shows a state in which the first pulse wave sensor 40-1 and the second pulse wave sensor 40-2 are located directly above the radial artery 91.
- the evaluation of the mounting state "NG” indicates that the relative positional relationship between the sensor unit 40 and the measurement site is a relationship in which the accuracy of the blood pressure measurement based on PTT can not be obtained. More specifically, it shows a state in which one or both of the first pulse wave sensor 40-1 and the second pulse wave sensor 40-2 are not positioned directly above the radial artery 91.
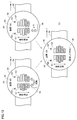
- FIG. 7 is a diagram for explaining the determination of the mounting state of the sensor unit 40 according to the first embodiment.
- the user visually recognizes the guide information of the display 50 from above in a state in which the extending direction of the left arm is parallel to the front of the body.
- the first pulse wave sensor 40-1 is located on the left side of the user, and the second pulse wave sensor 40-2 on the right side similarly. Will be located.
- the CPU 100 displays the first indicator information G1 representing the magnitude of the amplitude of the first pulse wave signal PS1 on the screen of the display 50 on the left side of the user, and the magnitude of the amplitude of the second pulse wave signal PS2
- the second indicator information G2 representing the distance is displayed on the screen of the display 50 on the right side of the user (see FIG. 7 (D) and FIG. 7 (E) described later).
- the CPU 100 causes the first pulse wave sensor 40-1 and the second pulse wave to transmit the first and second indicator information G1 and G2 in accordance with the direction in which the user of FIG. 7A views the information on the display 50.
- the first pulse wave sensor 40-1 is positioned directly above the radial artery 91
- the second pulse wave sensor 40-2 is positioned directly above the radial artery 91.
- the amplitude of the first pulse wave signal PS1 shows a magnitude exceeding the threshold TA
- the magnitude of the amplitude of the second pulse wave signal PS2 exceeds the threshold TA Absent. Therefore, the CPU 100 evaluates the mounting state of FIG. 7B as “NG”.
- the CPU 100 causes the display 50 to display the first pulse wave signal PS1 and the second pulse wave signal PS2 as shown in the upper part of FIG. 7D.
- the first indicator information G1 and the second indicator information G2 corresponding to each are displayed as a pictogram group.
- the pictogram group is a row of a plurality of rectangular pictograms, and the CPU 100 displays the pictogram group so as to extend in the direction intersecting the Y direction.
- the CPU 100 detects the amplitude magnitudes of the first pulse wave signal PS1 and the second pulse wave signal PS2, and lights one or more pictograms corresponding to the amplitude magnitude of the pulse wave signal among the corresponding pictogram groups.
- the number of lit pictograms in a row of pictograms indicates the magnitude of the amplitude of the corresponding pulse wave signal.
- the display mode As a lighting mode of the pictogram group, it is desirable to make the display mode different between a pictogram showing that the amplitude exceeds the threshold TA and a pictogram showing the threshold TA or less.
- the pictogram indicating that the amplitude exceeds the threshold TA continues lighting, and the pictogram indicating the threshold TA or less blinks.
- the display mode may change the display color in addition to lighting / flashing.
- the shape of the pictogram is not limited to a rectangle.
- the CPU 100 displays the character CH indicating the "left" or "right” side of the user as the position of the corresponding pulse wave sensor in association with the first indicator information G1 and the second indicator information G2 of each pictogram group. .
- the CPU 100 indicates that the pulse wave amplitude values detected by the first pulse wave sensor 40-1 and the second pulse wave sensor 40-2 are unbalanced with respect to the user. Or, it can be guided that the pulse wave amplitude value is relatively high / low, and the user can be motivated to move the position of the sensor unit 40. The motivated user pushes the housing of the display 50 in the right direction so as to increase the amplitude of the pulse wave signal indicated by the indicator information G2 associated with the "right" character CH.
- the position of the sensor unit 40 moves to the left of the user.
- the position of the sensor unit 40 (the first pulse wave sensor 40-1 and the second pulse wave sensor 40-2) interlocks with this movement, as shown in FIG. 7 (B) to FIG. 7 (C). It moves directly above the artery 91.
- the amplitudes of the first pulse wave signal PS1 and the second pulse wave signal PS2 become sufficiently large, and the first indicator information G1 and the second indicator information G2 are as shown in FIG.
- the threshold value TA shown in the lower part of (E) is exceeded.
- the first indicator information G1 and the second indicator information G2 indicate that the amplitudes of the first pulse wave signal PS1 and the second pulse wave signal PS2 have become sufficiently large. indicate.
- the CPU 100 determines that the mounting state of FIG. 7C is “OK”. By confirming the first indicator information G1 and the second indicator information G2 at the top of FIG. 7E, the user is guided that the mounting state has become good.
- the CPU 110 uses the PTT-based blood pressure according to the well-known equation described above and the characteristics of the waveforms of the first pulse wave signal PS1 and the second pulse wave signal PS2 detected when the wearing state is determined as “OK”. Perform measurement (estimate).
- the user is motivated to adjust the relative positional relationship between the sensor unit 40 and the measurement site from the first indicator information G1 and the second indicator information G2, and the first indicator information G1 .
- Guidance for adjustment is given from the second indicator information G2 and the character CH.
- the character CH is displayed on the same screen in association with the indicator information, the user can confirm guide information for position adjustment without switching the screen.
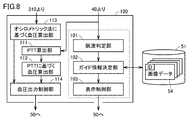
- FIG. 8 is a diagram schematically showing a configuration of a function for outputting guide information according to the first embodiment in association with a blood pressure measurement function.
- CPU 100 determines pulse information using pulse wave determination unit 101, image data 54 of memory 51, guide information determination unit 102 and display control unit 103.
- the CPU 100 calculates a PTT according to the above-described process
- the PTT calculation unit 111 calculates (estimates) a blood pressure based on PTT according to the above known equation
- a blood pressure output control unit 114 according to the oscillometric method for calculating (estimating) the blood pressure based on the oscillometric method described above.
- image data 54 is stored corresponding to each of the sets of (the amplitude of the first pulse wave signal PS1 and the amplitude of the second pulse wave signal PS2) that can be detected.
- the corresponding set of image data 54 is indicated by an identification (ID) assigned to the image data 54.
- the image data 54 includes a pictogram group indicating magnitudes of amplitudes of the first pulse wave signal PS1 and the second pulse wave signal PS2, and an image of the characters "left” and "right”.
- Image data 54 corresponding to a set of (the magnitude of the amplitude of the first pulse wave signal PS1 and the magnitude of the amplitude of the second pulse wave signal PS2) is generated based on an experiment or the like, and stored in the memory 51. It is stored in association with it.
- the pulse wave determination unit 101 compares the magnitudes of the amplitudes of the first pulse wave signal PS1 and the second pulse wave signal PS2 with the threshold value TA, and based on the comparison result, the condition of (amplitude size> threshold value TA) is satisfied. It is determined whether or not.
- the wearing condition is the desired wearing condition for blood pressure measurement based on PTT, ie measurement It is the wearing state which can maintain accuracy.
- the guide information determination unit 102 determines guide information to be output. Specifically, the guide information determination unit 102 detects the amplitudes of the first pulse wave signal PS1 and the second pulse wave signal PS2, and detects (the magnitude of the amplitude of the first pulse wave signal PS1, the second pulse The memory 51 is searched based on the combination of the wave signal PS2 and the amplitude). The guide information determination unit 102 reads from the memory 51 the image data 54 to which an ID matching the combination is assigned.
- the display control unit 103 generates a control signal to be displayed on the display 50 based on the image data 54 from the guide information determination unit 102.
- the display 50 displays first indicator information G1 and second indicator information G2 based on magnitudes of amplitudes of the first pulse wave signal PS1 and the second pulse wave signal PS2 detected. Is displayed.
- the functions of the units in FIG. 8 are stored in the memory 51 as a program.
- the CPU 100 realizes the functions of the respective units by reading and executing a program from the memory 51.
- the function of each part is not limited to the method realized by the program.
- it may be realized by a circuit including an application specific integrated circuit (ASIC) or a field-programmable gate array (FPGA).
- ASIC application specific integrated circuit
- FPGA field-programmable gate array
- it may be realized by a combination of a program and a circuit.
- the guide information is not limited to the image data 54 stored in the memory 51.
- image data for display control may be generated by executing an image generation program including a script program.
- the combination (the magnitude of the amplitude of the first pulse wave signal PS1 and the magnitude of the amplitude of the second pulse wave signal PS2) described above becomes a parameter (such as an argument) of the script program.
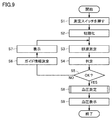
- FIG. 9 is a flowchart showing the process of blood pressure measurement based on the output of guide information and PTT according to the first embodiment.
- a program according to this flowchart is stored in the memory 51, read by the CPU 100, and executed.
- CPU 100 receives a start instruction when the user performs a switch operation to start blood pressure measurement of PTT at operation unit 52 in the wearing state (step S1).
- the CPU 100 performs an initialization process when starting blood pressure measurement (step S2). For example, exhaust air from the cuff.
- the CPU 100 starts processing of pulse wave measurement for PTT (step S3).
- the pulse wave determination unit 101 acquires the first pulse wave signal PS1 and the second pulse wave signal PS2 measured from the sensor unit 40, and the magnitudes of the amplitudes of the acquired first and second pulse wave signals PS1 and PS2 It is determined whether the condition of (amplitude> threshold value TA) is satisfied (step S4).
- the CPU 100 determines, based on the output of the pulse wave determination unit 101, whether the above condition is satisfied (step S5). If it is determined that the condition is satisfied (YES in step S5), the CPU 100 evaluates the mounting state as "OK" and performs blood pressure measurement based on PTT in step S8 described later.
- step S5 when it is determined that the condition is not satisfied (NO in step S5), CPU 100 evaluates that the mounting state is "NG". Further, the guide information determination unit 102 determines guide information (step S6), and the display control unit 103 controls the display of the display 50 according to the guide information (step S7). Then, it transfers to step S3 and implements the following processes similarly to the above.
- step S8 When the PTT-based blood pressure measurement is performed (step S8), the measured blood pressure is displayed on the display 50 (step S9). Also, the measurement result is stored in the memory 51.
- step S8 PTT is calculated by the PTT calculation unit 111, and the blood pressure calculation unit 112 based on PTT calculates (estimates) the blood pressure based on the calculated PTT.
- step S 8 blood pressure measurement based on PTT (step S 8) is not performed while the wearing state is evaluated as “NG”, but PTT calculation is performed even when the wearing state is evaluated as “NG”
- the calculation of PTT by the unit 111 and the calculation (estimate) of blood pressure based on the PTT by the blood pressure calculation unit 112 based on the PTT may be performed.
- the wearing state "NG” is continuously evaluated a predetermined number of times, or when the time when the wearing state "NG” is evaluated continuously exceeds a predetermined time (for example, start When receiving the instruction (when a predetermined time has elapsed since step S1), the blood pressure measurement based on PPT (step S8) may be performed in the evaluation of the wearing state “NG”.
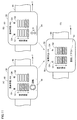
- FIGS. 10A and 10B are display examples when the mounting state is “NG”, and on the screen of the display 50, information 93 indicating the evaluation of the mounting state (“NG”), and measurement Information 94 for guiding the direction in which the position of the sensor unit 40 with respect to the part is moved is displayed on the same screen as the other information (the indicator information G1, G2 and the character CH).
- Information 94 in FIG. 10A is information for guiding the circular casing of the display 50 to rotate concentrically at the center of the circle, and is indicated by an arrow mark indicating the rotation direction.
- information 94 in FIG. 10B is information for guiding moving the housing of the display 50 in the vertical direction, and is indicated by an arrow mark indicating the vertical direction.
- FIG. 10C is a display example in the case where the mounting state is evaluated as “OK”, and the display 50 displays information 93 indicating the evaluation of the mounting state (“OK”) and the information 94 of the moving direction described above.
- information 95 for guiding fixing of the position of the sensor unit 40 is displayed on the same screen together with other information (the indicator information G1, G2 and the character CH).
- the fixed guide information 95 is, for example, a message "Please fix", but is not limited to this.
- the information 95 guiding the fixing of the position of the sensor unit 40 is replaced with the information 93 and the information 94 when the mounting state is evaluated as "NG”. , And displayed on the display 50.
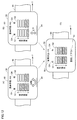
- FIG. 11 shows a case where the housing (screen) of the display 50 is rectangular.
- FIG. 11A and FIG. 11B are display examples when the mounting state is evaluated as “NG”.
- Information 94 in FIG. 11A is information for guiding the rectangular casing of the display 50 to rotate concentrically at the center of the rectangle, and is an arrow mark indicating the rotation direction (the two arrows having different directions. Shown in the figure).
- FIG. 11C is a display example in the case where the mounting state is evaluated as “OK”.
- FIG. 12 is a modification of FIG. In FIG. 12A, the information 94 is indicated not by a set of two arrow marks different in the direction of the information 94 of FIG. 11A, but by a single arrow in both directions.
- the movement is vertical movement or rotational movement according to the information 94 on the same screen. You will be guided as to which to do. Therefore, the user operates the housing of the display 50 in accordance with the moving direction of the information 94 to efficiently adjust the relative positional relationship between the sensor unit 40 and the measurement site so that the mounting state is "OK". can do.
- the guide information (corresponding to the icon of the arrow mark) as to whether the movement should be performed in the vertical direction or the rotational movement (the magnitude of the amplitude of the first pulse wave signal PS1 and the amplitude of the second pulse wave signal PS2)
- the information is determined based on the combination of (size) and is included in advance in the image data 54 described above in association with the set.
- the above-mentioned display was a case where the sphygmomanometer 1 was attached to the left wrist 90, it can be implemented similarly, also when attaching to the right wrist.
- the arrangement of the first pulse wave sensor 40-1 and the second pulse wave sensor 40-2 with respect to the measurement site is the reverse of the case of mounting on the left wrist 90.
- the display positions of the corresponding first indicator information G1 and second indicator information G2 on the display 50 are also reversed.
- the CPU 100 can determine whether the site on which the sphygmomanometer 1 is attached is the left wrist or the right wrist, based on user input from the operation unit 52.
- the sphygmomanometer 1 may be equipped with an acceleration sensor, and the CPU 100 may determine, from the output of the acceleration sensor, which side it is attached to on the left or right.
- FIG. 13 is a diagram showing an example of storage of measurement results according to the first embodiment.
- memory 51 stores a table 394 for recording the measurement results of blood pressure monitor 1.
- table 394 stores measurement data in record units.
- Each record includes ID (identification) data 39E for uniquely identifying the record, measurement date and time data 39G, blood pressure values calculated (estimated) by the blood pressure calculation unit 113 according to the oscillometric method (systolic blood pressure SBP and Data 39H including diastolic blood pressure DBP) and pulse rate PLS, data 39I representing "OK” or "NG” which is an evaluation of the wearing condition at the time of blood pressure measurement based on PTT, and calculated by blood pressure calculation unit 112 based on PTT Data 39J indicating the estimated blood pressure value is associated and included.
- the blood pressure output control unit 114 stores in the memory 51 the blood pressure and pulse rate data 39H according to the oscillometric method measured according to the measurement date and time, and the data 39J of the blood pressure value based on the PTT in association with the measurement date data 39G.
- the manner of storing measurement data in the table 394 is not limited to the record unit as shown in FIG. Any mode may be used as long as the detected data 39E to 39J are associated (linked) each time the blood pressure is measured.
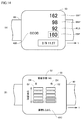
- FIG. 14 is a diagram showing another display example according to the first embodiment.
- evaluation 40B of the wearing state on the screen of display 50, evaluation 40B of the wearing state, systolic blood pressure SBP, diastolic blood pressure DBP and pulse rate PLS, and measured blood pressure EBP based on PTT are shown as measurement results.
- Data of measurement date and time are displayed.
- FIG. 14 (A) it is displayed by the character of "GOOD" that evaluation of the mounting state was "OK" by evaluation 40B of the mounting state.
- the user can also obtain an indication of the reliability as to whether the displayed blood pressure EBP is a reliable value from the information of the evaluation 40B of the wearing state.
- the display example shown in FIG. 14A corresponds to, for example, a display example when the blood pressure measurement ends (step S9) or a display example of data read from the table 394 in FIG.
- the blood pressure output control unit 114 controls the display 50 to display the information on the blood pressure in FIG. Specifically, the blood pressure output control unit 114 generates display data based on the blood pressure calculated by the blood pressure calculation unit 112 based on PTT or the blood pressure value calculated by the blood pressure calculation unit 113 based on oscillometric method, The display 50 is driven based on the display data. Alternatively, the blood pressure output control unit 114 generates display data based on the associated data 39H and data 39J of the table 394 of FIG. 13 and drives the display 50 based on the generated display data. Thereby, the blood pressure output control unit 114 can display the measured blood pressure data or the blood pressure data stored in the table 394 on the display 50.
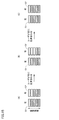
- FIG. 15 is a diagram showing still another display example according to the first embodiment.
- the guide information in FIG. 15 includes not only the amplitude value (signal strength) of the first pulse wave signal PS1 or the second pulse wave signal PS2 from the first pulse wave sensor 40-1 or the second pulse wave sensor 40-2. It also presents the change in amplitude value.
- the guide information based on the amplitude value is from FIG. 15 (A) ⁇ FIG. 15 (B) ⁇ FIG. And changing cases are shown.
- the amplitude value (signal strength) of the first pulse wave signal PS1 exceeds the threshold value TA (here, it corresponds to four pictograms)
- the second The amplitude value of the pulse wave signal PS2 is less than the threshold value TA.
- the user adjusts the position of the sensor unit 40 by pushing the display 50 in the right direction in accordance with the guide information of FIG.
- the CPU 100 determines that the amplitude value of the second pulse wave signal PS2 has changed from the amplitude value before movement shown in FIG. 15A and has become smaller, the CPU 100 performs processing as shown in FIG. , The color of the pictogram of the second indicator information G2 is changed. This change in display color can guide the user that the position adjustment is not appropriate.
- the user adjusts the position of the sensor unit 40 by pushing the display 50 in the left direction according to the change of the color of the second indicator information G2 in FIG.
- the position of the sensor unit 40 (the first pulse wave sensor 40-1 and the second pulse wave sensor 40-2) moves directly above the radial artery 91.
- the CPU 100 determines that the amplitude value of the second pulse wave signal PS2 has changed and become larger than the amplitude value before the movement of FIG. 15 (B), and based on the determination, as shown in FIG. Then, the pictogram of the second indicator information G2 is changed to the original color.
- the guide information in FIG. 15C can guide the user that the position adjustment was appropriate.
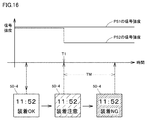
- FIG. 16 is a diagram showing still another display example according to the first embodiment.
- the change of the signal intensity (pulse wave amplitude value) of the first pulse wave signal PS1 and the second pulse wave signal PS2 according to the passage of time, and the display of the icon 50-4 showing the evaluation of the wearing state A change of aspect is shown.
- the signal intensity (pulse wave amplitude value) of the first pulse wave signal PS1 and the second pulse wave signal PS2 exceeds the threshold value TA from the start of mounting to time T1. Therefore, from the mounting start to the time T1, the CPU 100 displays the icon 50-4 of the display 50 with characters and colors representing the mounting state "OK".
- the CPU 100 changes the icon 50-4 of the display 50 to a character and color representing the wearing state "attention".
- CPU 100 determines that the state in which the pulse wave amplitude value is equal to or less than threshold value TA continues from time T1 for a predetermined time (for example, time TM)
- CPU 100 displays icon 50-4 on display 50. , Change the character and color representing the mounting state "NG”.
- the guide information when the guide information is displayed, the magnitude of the amplitude of the pulse wave signal of the first pulse wave signal PS1 or the magnitude of the amplitude of the pulse wave signal of the second pulse wave signal PS2 has changed.
- the guide information may include information for notifying the change. Therefore, it is possible to guide the change of the evaluation of the wearing state to the user by the change of the character and the color by the icon 50-4.
- the device blood pressure monitor 1 or the portable terminal 10B described later
- the strength or period of the vibration is changed in conjunction with the change of the guide information by the icon 50-4. It is also good.
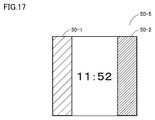
- FIG. 17 is a diagram showing still another display example according to the first embodiment.
- the icon 50-5 displayed on the display 50 has a portion 50-1 indicating the evaluation of the wearing state and a portion 50-2 indicating the evaluation of the blood pressure EBP measured based on the PTT.
- the CPU 100 changes the color of the portion 50-1 of the evaluation of the wearing state of the icon 50-5 and the color of the portion 50-2 of the evaluation of the blood pressure EBP in accordance with the contents of the corresponding evaluation. In this way, the user is guided while relating the evaluation of the wearing state (“OK”, “NG”, “reseating”, etc.) and the evaluation of the measured blood pressure EBP (normal blood pressure, hypertension, etc.) Can.
- the time to carry out the determination of the mounting state of the sphygmomanometer 1 is not limited to the time of blood pressure measurement according to the PTT described above (see FIG. 9).
- the CPU 100 may periodically determine the wearing state, and may display the above-described guide information based on the determination result.
- the pulse wave determination unit 101 of the CPU 100 determines that the sphygmomanometer 1 is being worn, the condition of (magnitude of amplitude> threshold value TA) is always (for example, at regular fixed intervals) To determine if Then, the guide information determination unit 102 sets guide information including the evaluation (OK or NG) of the mounting state, and the display control unit 103 displays the guide information on the display 50.
- This display mode is shown, for example, in FIG. 10 (A), FIG. 10 (B), FIG. 11 (A), FIG. 11 (B), or FIG. 12 (A), FIG. 12 (B).
- CPU 100 determines that peak A1 of pulse wave signal PS1 or peak A2 of pulse wave signal PS2 detected in the attached state of sphygmomanometer 1 is less than threshold value TA, or is less than threshold value TA.
- an alarm 40C or an error prompting the user to reattach is displayed on the display 50 (see FIG. 14B).
- the peak A1 of the pulse wave signal PS1 or the peak A2 of the pulse wave signal PS2 is less than the threshold value TA1 ( ⁇ TA)
- the peak A1 of the pulse wave signal PS1 or the peak A2 of the pulse wave signal PS2 is the threshold value TA1.
- the CPU 100 displays an alarm 40C (or an error) on the display 50 (see FIG. 14B).
- the text message of 'reinserted' is shown as the alarm 40C, but it is not limited to the text message, and may be other information including a predetermined image (moving image, still image). Good.
- the user can always check whether or not the wearing state is appropriate or not, by checking the screen of the display 50.
- the output mode of the information 93 or the alarm 40C representing the evaluation ("OK" or "NG") of the wearing state during wearing is not limited to the display of the display 50, but is another mode including audio output or vibration. It may be.
- FIG. 18 is a diagram showing a schematic configuration of a system according to a second embodiment.
- the sphygmomanometer 1 described above communicates with the server 30 or the portable terminal 10 B, which is an external information processing device, via the network 900.
- the sphygmomanometer 1 communicates with the portable terminal 10B via the LAN, and the portable terminal 10B communicates with the server 30 via the Internet.
- the sphygmomanometer 1 can communicate with the server 30 via the portable terminal 10B.
- the sphygmomanometer 1 may communicate with the server 30 without passing through the portable terminal 10B.
- the CPU 100 evaluates the wearing state
- the information 93 or the alarm 40C may be transmitted to the portable terminal 10B and displayed on the display unit 158.
- the sphygmomanometer 1 can output the evaluation of the wearing state from the display of the display unit 158 of the portable terminal 10B.
- the portable terminal 10B may notify the information 93 of the evaluation of the wearing state or the alarm 40C in another output mode including vibration or voice of the portable terminal 10B.
- the measurement result (FIG. 14A) is displayed on the display 50 of the sphygmomanometer 1, but the display destination may be the display unit 158 of the portable terminal 10B. And the display unit 158 may be used.
- the storage destination of the measurement results shown in the table 394 of FIG. 13 is not limited to the memory 51 of the sphygmomanometer 1.
- the storage unit of the portable terminal 10B or the storage unit 32A of the server 30 may be used. Alternatively, it may be stored in two or more of the memory 51, the storage unit of the portable terminal 10B, and the storage unit 32A of the server 30.
- a program that causes a computer to function to execute control as described in the above-described flowchart.
- a program is recorded on a non-temporary computer readable recording medium such as a CD (Compact Disk Read Only Memory) attached to the computer of the blood pressure monitor 1, a secondary storage device, a main storage device and a memory card. It can also be provided.
- the program can be provided by being recorded in a recording medium such as a hard disk built in the computer.
- the program can be provided by downloading via the network 900.
Landscapes
- Health & Medical Sciences (AREA)
- Life Sciences & Earth Sciences (AREA)
- Surgery (AREA)
- Public Health (AREA)
- Pathology (AREA)
- Engineering & Computer Science (AREA)
- Biomedical Technology (AREA)
- Heart & Thoracic Surgery (AREA)
- Medical Informatics (AREA)
- Molecular Biology (AREA)
- Physics & Mathematics (AREA)
- Animal Behavior & Ethology (AREA)
- General Health & Medical Sciences (AREA)
- Biophysics (AREA)
- Veterinary Medicine (AREA)
- Cardiology (AREA)
- Vascular Medicine (AREA)
- Physiology (AREA)
- Nuclear Medicine, Radiotherapy & Molecular Imaging (AREA)
- Radiology & Medical Imaging (AREA)
- Ophthalmology & Optometry (AREA)
- Measuring Pulse, Heart Rate, Blood Pressure Or Blood Flow (AREA)
- Measurement And Recording Of Electrical Phenomena And Electrical Characteristics Of The Living Body (AREA)
Priority Applications (3)
| Application Number | Priority Date | Filing Date | Title |
|---|---|---|---|
| CN201880058384.9A CN111225606A (zh) | 2017-09-12 | 2018-09-05 | 显示控制装置及程序 |
| DE112018004117.4T DE112018004117T5 (de) | 2017-09-12 | 2018-09-05 | Anzeigesteuervorrichtung und programm |
| US16/812,464 US20200221961A1 (en) | 2017-09-12 | 2020-03-09 | Display control device and recording medium of program |
Applications Claiming Priority (2)
| Application Number | Priority Date | Filing Date | Title |
|---|---|---|---|
| JP2017-175113 | 2017-09-12 | ||
| JP2017175113A JP6991022B2 (ja) | 2017-09-12 | 2017-09-12 | 表示制御装置およびプログラム |
Related Child Applications (1)
| Application Number | Title | Priority Date | Filing Date |
|---|---|---|---|
| US16/812,464 Continuation US20200221961A1 (en) | 2017-09-12 | 2020-03-09 | Display control device and recording medium of program |
Publications (1)
| Publication Number | Publication Date |
|---|---|
| WO2019054254A1 true WO2019054254A1 (ja) | 2019-03-21 |
Family
ID=65723590
Family Applications (1)
| Application Number | Title | Priority Date | Filing Date |
|---|---|---|---|
| PCT/JP2018/032903 Ceased WO2019054254A1 (ja) | 2017-09-12 | 2018-09-05 | 表示制御装置およびプログラム |
Country Status (5)
| Country | Link |
|---|---|
| US (1) | US20200221961A1 (enExample) |
| JP (1) | JP6991022B2 (enExample) |
| CN (1) | CN111225606A (enExample) |
| DE (1) | DE112018004117T5 (enExample) |
| WO (1) | WO2019054254A1 (enExample) |
Families Citing this family (8)
| Publication number | Priority date | Publication date | Assignee | Title |
|---|---|---|---|---|
| JP6900432B2 (ja) * | 2019-08-08 | 2021-07-07 | 京セラ株式会社 | 電子機器、制御方法、及び制御プログラム |
| CN112274126B (zh) * | 2020-10-28 | 2022-11-29 | 河北工业大学 | 一种基于多路脉搏波的无创连续血压检测方法、装置 |
| JP7576240B2 (ja) * | 2021-03-31 | 2024-10-31 | 株式会社アイシン | 血圧測定装置、及び血圧測定プログラム |
| JP7721986B2 (ja) * | 2021-06-29 | 2025-08-13 | オムロンヘルスケア株式会社 | 血圧測定用駆動回路及び血圧測定装置 |
| KR102911156B1 (ko) * | 2021-09-03 | 2026-01-09 | 삼성전자주식회사 | 혈압 추정 장치 및 방법 |
| JP7409360B2 (ja) * | 2021-09-07 | 2024-01-09 | カシオ計算機株式会社 | 情報処理装置、プログラム及び装着状態判定方法 |
| JP2024002185A (ja) * | 2022-06-23 | 2024-01-11 | オムロンヘルスケア株式会社 | 生体情報測定装置、生体情報処理システム、生体情報測定装置及び情報処理端末の制御方法 |
| JP2024014477A (ja) * | 2022-07-22 | 2024-02-01 | オムロンヘルスケア株式会社 | 生体情報測定装置 |
Citations (5)
| Publication number | Priority date | Publication date | Assignee | Title |
|---|---|---|---|---|
| JPH01249036A (ja) * | 1988-03-29 | 1989-10-04 | Citizen Watch Co Ltd | 脈拍計付電子時計 |
| JP2004222814A (ja) * | 2003-01-21 | 2004-08-12 | Colin Medical Technology Corp | 圧脈波検出プローブ |
| JP2009297235A (ja) * | 2008-06-12 | 2009-12-24 | Fujitsu Ltd | ガイダンス方法、その装置、そのプログラム及び機器 |
| JP2014171513A (ja) * | 2013-03-06 | 2014-09-22 | Seiko Epson Corp | 生体情報検出装置及びプログラム |
| JP2017063884A (ja) * | 2015-09-28 | 2017-04-06 | 京セラ株式会社 | 測定装置および測定システム |
Family Cites Families (10)
| Publication number | Priority date | Publication date | Assignee | Title |
|---|---|---|---|---|
| US6999685B1 (en) | 1997-01-31 | 2006-02-14 | Seiko Epson Corporation | Polarized light communication device, transmitter, laser, polarized light communication device for physiological use, reflected light detector and pulse wave detecting device |
| JP3972141B2 (ja) * | 2002-05-09 | 2007-09-05 | オムロンヘルスケア株式会社 | 脈波計 |
| CN101912259B (zh) * | 2010-08-06 | 2012-10-10 | 深圳瑞光康泰科技有限公司 | 一种无创血压测量装置 |
| RU2480150C2 (ru) * | 2010-09-09 | 2013-04-27 | Общество С Ограниченной Ответственностью "Эмдея" | Устройство для измерения артериального давления |
| JP5821658B2 (ja) * | 2012-01-25 | 2015-11-24 | オムロンヘルスケア株式会社 | 測定装置および測定方法 |
| JP5821657B2 (ja) * | 2012-01-25 | 2015-11-24 | オムロンヘルスケア株式会社 | 測定装置および測定方法 |
| KR102065687B1 (ko) * | 2012-11-01 | 2020-02-11 | 아이캠, 엘엘씨 | 무선 손목 컴퓨팅과 3d 영상화, 매핑, 네트워킹 및 인터페이스를 위한 제어 장치 및 방법 |
| WO2015126095A1 (ko) * | 2014-02-21 | 2015-08-27 | 삼성전자 주식회사 | 전자 장치 |
| CN105595979A (zh) * | 2016-01-21 | 2016-05-25 | 中山大学 | 一种基于脉搏波传播时间的无创连续血压监测方法及装置 |
| US11589758B2 (en) * | 2016-01-25 | 2023-02-28 | Fitbit, Inc. | Calibration of pulse-transit-time to blood pressure model using multiple physiological sensors and various methods for blood pressure variation |
-
2017
- 2017-09-12 JP JP2017175113A patent/JP6991022B2/ja active Active
-
2018
- 2018-09-05 WO PCT/JP2018/032903 patent/WO2019054254A1/ja not_active Ceased
- 2018-09-05 DE DE112018004117.4T patent/DE112018004117T5/de active Pending
- 2018-09-05 CN CN201880058384.9A patent/CN111225606A/zh active Pending
-
2020
- 2020-03-09 US US16/812,464 patent/US20200221961A1/en not_active Abandoned
Patent Citations (5)
| Publication number | Priority date | Publication date | Assignee | Title |
|---|---|---|---|---|
| JPH01249036A (ja) * | 1988-03-29 | 1989-10-04 | Citizen Watch Co Ltd | 脈拍計付電子時計 |
| JP2004222814A (ja) * | 2003-01-21 | 2004-08-12 | Colin Medical Technology Corp | 圧脈波検出プローブ |
| JP2009297235A (ja) * | 2008-06-12 | 2009-12-24 | Fujitsu Ltd | ガイダンス方法、その装置、そのプログラム及び機器 |
| JP2014171513A (ja) * | 2013-03-06 | 2014-09-22 | Seiko Epson Corp | 生体情報検出装置及びプログラム |
| JP2017063884A (ja) * | 2015-09-28 | 2017-04-06 | 京セラ株式会社 | 測定装置および測定システム |
Also Published As
| Publication number | Publication date |
|---|---|
| JP6991022B2 (ja) | 2022-02-03 |
| DE112018004117T5 (de) | 2020-04-30 |
| CN111225606A (zh) | 2020-06-02 |
| JP2019050853A (ja) | 2019-04-04 |
| US20200221961A1 (en) | 2020-07-16 |
Similar Documents
| Publication | Publication Date | Title |
|---|---|---|
| WO2019054254A1 (ja) | 表示制御装置およびプログラム | |
| US20190307336A1 (en) | Pulse wave measurement device, pulse wave measurement method, and blood pressure measurement device | |
| WO2019124025A1 (ja) | 測定装置およびプログラム | |
| JP7124552B2 (ja) | 測定装置 | |
| US11589757B2 (en) | Blood pressure estimation device | |
| WO2018123374A1 (ja) | 血圧計および血圧測定方法並びに機器 | |
| JP2018102867A (ja) | 血圧計および血圧測定方法並びに機器 | |
| KR101273619B1 (ko) | 블루투스를 이용한 전자 혈압계 | |
| JP6950722B2 (ja) | 時計型血圧測定装置 | |
| JP2019050853A5 (enExample) | ||
| WO2018123275A1 (ja) | 血圧計および血圧測定方法並びに機器 | |
| JP6741570B2 (ja) | 脈波測定装置および脈波測定方法、並びに血圧測定装置 | |
| JP6734770B2 (ja) | 血圧測定装置および血圧測定方法 | |
| CN111405867B (zh) | 信息处理装置、信息处理方法、以及存储介质 | |
| CN111511273B (zh) | 信息处理装置、信息处理方法和存储介质 | |
| JP2012152372A (ja) | 血圧測定装置および血圧測定方法 | |
| KR101520929B1 (ko) | 혈압 및 맥박 측정 훈련용 팔모형 | |
| WO2019021649A1 (ja) | 測定装置、および測定方法 | |
| JP2000254104A (ja) | 動脈硬化度測定装置 | |
| CN108354595A (zh) | 测量装置及测量方法 |
Legal Events
| Date | Code | Title | Description |
|---|---|---|---|
| 121 | Ep: the epo has been informed by wipo that ep was designated in this application |
Ref document number: 18857134 Country of ref document: EP Kind code of ref document: A1 |
|
| 122 | Ep: pct application non-entry in european phase |
Ref document number: 18857134 Country of ref document: EP Kind code of ref document: A1 |