WO2019124025A1 - 測定装置およびプログラム - Google Patents
測定装置およびプログラム Download PDFInfo
- Publication number
- WO2019124025A1 WO2019124025A1 PCT/JP2018/044217 JP2018044217W WO2019124025A1 WO 2019124025 A1 WO2019124025 A1 WO 2019124025A1 JP 2018044217 W JP2018044217 W JP 2018044217W WO 2019124025 A1 WO2019124025 A1 WO 2019124025A1
- Authority
- WO
- WIPO (PCT)
- Prior art keywords
- pulse wave
- blood pressure
- unit
- frequency
- sensor unit
- Prior art date
Links
Images


Classifications
-
- A—HUMAN NECESSITIES
- A61—MEDICAL OR VETERINARY SCIENCE; HYGIENE
- A61B—DIAGNOSIS; SURGERY; IDENTIFICATION
- A61B5/00—Measuring for diagnostic purposes; Identification of persons
- A61B5/02—Detecting, measuring or recording pulse, heart rate, blood pressure or blood flow; Combined pulse/heart-rate/blood pressure determination; Evaluating a cardiovascular condition not otherwise provided for, e.g. using combinations of techniques provided for in this group with electrocardiography or electroauscultation; Heart catheters for measuring blood pressure
- A61B5/021—Measuring pressure in heart or blood vessels
- A61B5/02108—Measuring pressure in heart or blood vessels from analysis of pulse wave characteristics
-
- A—HUMAN NECESSITIES
- A61—MEDICAL OR VETERINARY SCIENCE; HYGIENE
- A61B—DIAGNOSIS; SURGERY; IDENTIFICATION
- A61B5/00—Measuring for diagnostic purposes; Identification of persons
- A61B5/0002—Remote monitoring of patients using telemetry, e.g. transmission of vital signals via a communication network
- A61B5/0015—Remote monitoring of patients using telemetry, e.g. transmission of vital signals via a communication network characterised by features of the telemetry system
- A61B5/0022—Monitoring a patient using a global network, e.g. telephone networks, internet
-
- A—HUMAN NECESSITIES
- A61—MEDICAL OR VETERINARY SCIENCE; HYGIENE
- A61B—DIAGNOSIS; SURGERY; IDENTIFICATION
- A61B5/00—Measuring for diagnostic purposes; Identification of persons
- A61B5/02—Detecting, measuring or recording pulse, heart rate, blood pressure or blood flow; Combined pulse/heart-rate/blood pressure determination; Evaluating a cardiovascular condition not otherwise provided for, e.g. using combinations of techniques provided for in this group with electrocardiography or electroauscultation; Heart catheters for measuring blood pressure
- A61B5/021—Measuring pressure in heart or blood vessels
- A61B5/02141—Details of apparatus construction, e.g. pump units or housings therefor, cuff pressurising systems, arrangements of fluid conduits or circuits
-
- A—HUMAN NECESSITIES
- A61—MEDICAL OR VETERINARY SCIENCE; HYGIENE
- A61B—DIAGNOSIS; SURGERY; IDENTIFICATION
- A61B5/00—Measuring for diagnostic purposes; Identification of persons
- A61B5/02—Detecting, measuring or recording pulse, heart rate, blood pressure or blood flow; Combined pulse/heart-rate/blood pressure determination; Evaluating a cardiovascular condition not otherwise provided for, e.g. using combinations of techniques provided for in this group with electrocardiography or electroauscultation; Heart catheters for measuring blood pressure
- A61B5/021—Measuring pressure in heart or blood vessels
- A61B5/022—Measuring pressure in heart or blood vessels by applying pressure to close blood vessels, e.g. against the skin; Ophthalmodynamometers
- A61B5/0235—Valves specially adapted therefor
-
- A—HUMAN NECESSITIES
- A61—MEDICAL OR VETERINARY SCIENCE; HYGIENE
- A61B—DIAGNOSIS; SURGERY; IDENTIFICATION
- A61B5/00—Measuring for diagnostic purposes; Identification of persons
- A61B5/05—Detecting, measuring or recording for diagnosis by means of electric currents or magnetic fields; Measuring using microwaves or radio waves
- A61B5/053—Measuring electrical impedance or conductance of a portion of the body
-
- A—HUMAN NECESSITIES
- A61—MEDICAL OR VETERINARY SCIENCE; HYGIENE
- A61B—DIAGNOSIS; SURGERY; IDENTIFICATION
- A61B5/00—Measuring for diagnostic purposes; Identification of persons
- A61B5/68—Arrangements of detecting, measuring or recording means, e.g. sensors, in relation to patient
- A61B5/6801—Arrangements of detecting, measuring or recording means, e.g. sensors, in relation to patient specially adapted to be attached to or worn on the body surface
- A61B5/6802—Sensor mounted on worn items
- A61B5/681—Wristwatch-type devices
-
- A—HUMAN NECESSITIES
- A61—MEDICAL OR VETERINARY SCIENCE; HYGIENE
- A61B—DIAGNOSIS; SURGERY; IDENTIFICATION
- A61B5/00—Measuring for diagnostic purposes; Identification of persons
- A61B5/72—Signal processing specially adapted for physiological signals or for diagnostic purposes
- A61B5/7225—Details of analog processing, e.g. isolation amplifier, gain or sensitivity adjustment, filtering, baseline or drift compensation
-
- A—HUMAN NECESSITIES
- A61—MEDICAL OR VETERINARY SCIENCE; HYGIENE
- A61B—DIAGNOSIS; SURGERY; IDENTIFICATION
- A61B5/00—Measuring for diagnostic purposes; Identification of persons
- A61B5/74—Details of notification to user or communication with user or patient ; user input means
- A61B5/742—Details of notification to user or communication with user or patient ; user input means using visual displays
Definitions
- the present disclosure relates to a measuring device and program, and more particularly to a measuring device and program of information related to pulse waves.
- Patent Document 1 Japanese Patent Laid-Open No. 2017-070739 discloses a configuration for measuring a biosignal including pulse wave information of one or both of a radial artery and an ulnar artery. Do.
- Patent Document 2 Japanese Patent Application Laid-Open No. 2016-135261 irradiates light on the surface of a living body from a sensor having light emitting elements arranged in a first direction in order to detect a pulse wave, and A configuration is disclosed in which light is received by a light receiving element and detected as a pulse wave signal. Moreover, patent document 2 discloses the structure which distinguishes the signals by the light which originates in each sensor by shifting the light emission period of the sensors arrange
- An object in one aspect of the present disclosure is to provide a measurement device and a program for acquiring information on pulse waves more accurately.
- a device for measuring a pulse wave includes a first pulse wave sensor unit and a second pulse wave sensor unit that can be disposed corresponding to each of measurement sites separated from each other.
- the first pulse wave sensor unit outputs a first current signal having a first frequency to a corresponding measurement site, and a first output unit for detecting a voltage signal representing a pulse wave from the corresponding measurement site. And a detection unit.
- the second pulse wave sensor unit outputs a second output unit that outputs a second current signal having a second frequency different from the first frequency to the corresponding measurement site, and a voltage signal representing a pulse wave from the corresponding measurement site. And a second detection unit for detecting.
- the first detection unit processes the voltage signal representing the pulse wave to be detected based on the filter characteristic corresponding to the first frequency
- the second detection unit processes the voltage signal representing the pulse wave to be detected to the second frequency Process based on the corresponding filter characteristics.
- an apparatus for measuring a pulse wave includes a first pulse wave sensor unit and a second pulse wave sensor unit that can be disposed corresponding to each of measurement sites separated from each other.
- the first pulse wave sensor unit outputs a first current signal having a first frequency to a corresponding measurement site, and a first output unit for detecting a voltage signal representing a pulse wave from the corresponding measurement site. And a second output unit that outputs a second current signal having a second frequency to a corresponding measurement site, and a voltage signal representing a pulse wave from the corresponding measurement site. And a second detection unit for detecting The measuring device alternately drives the first pulse wave sensor unit and the second pulse wave sensor unit at predetermined intervals.
- the first frequency and the second frequency indicate the same frequency.
- the first frequency is different from the second frequency.
- the first frequency represents 50 kHz or 60 kHz
- the second frequency represents 50 kHz or 60 kHz.
- the measurement apparatus further detects a pulse wave propagation velocity from at least one of a pulse wave indicated by the voltage signal detected by the first detection unit and a pulse wave indicated by the voltage signal detected by the second detection unit.
- the measuring apparatus further comprises a first blood pressure based on a pulse wave propagation velocity calculated from a pulse wave indicated by the voltage signal detected by the first detection unit, and a pulse wave indicated by the voltage signal detected by the second detection unit.
- the blood pressure calculation unit is further provided to calculate at least one of the second blood pressure based on the calculated pulse wave velocity.
- the measuring device further detects an S / N ratio for each of the voltage signals representing pulse waves detected by the first detection unit and the second detection unit.
- the blood pressure calculation unit calculates pulse wave propagation calculated from a pulse wave indicated by a voltage signal having a higher S / N ratio among voltage signals representing pulse waves detected by the first detection unit and the second detection unit. Calculate blood pressure based on velocity.
- the blood pressure calculation unit calculates a representative blood pressure of the first blood pressure and the second blood pressure.
- the representative blood pressure includes the mean blood pressure of the first blood pressure and the second blood pressure.
- the mean blood pressure is an average calculated by weighting each of the first blood pressure and the second blood pressure, wherein the weight of the first blood pressure is based on the corresponding S / N ratio, and the weight of the second blood pressure is It is based on the corresponding S / N ratio.
- the measurement apparatus further includes a display, and further includes a communication unit for communicating with an external information processing apparatus having a display unit, and the measurement apparatus displays the blood pressure value calculated by the blood pressure calculation unit on the display unit. To the information processing apparatus via the communication unit.
- a program for causing a computer to execute a control method of a device wherein the device may be disposed corresponding to each of measurement sites separated from each other, and a first pulse wave sensor unit A second output step of controlling the first pulse wave sensor unit to output a first current signal having a first frequency to a corresponding measurement site;
- the first pulse wave sensor unit is controlled to detect a voltage signal representing the pulse wave from the measurement site corresponding to the first pulse wave sensor unit, and the second pulse wave sensor unit has a second frequency.
- a program for causing a computer to execute a control method of an apparatus.
- the device includes a first pulse wave sensor unit and a second pulse wave sensor unit that can be disposed corresponding to each of the measurement sites separated from each other.
- the control method comprises: controlling a first pulse wave sensor unit to output a first current signal having a first frequency to a corresponding measurement region; and controlling the first pulse wave sensor unit as a corresponding measurement region A second detection step of controlling to detect a voltage signal representing a pulse wave from the second output, and a second output controlling a second current signal having a second frequency to a corresponding measurement site Step, a second detection step of controlling the second pulse wave sensor unit to detect a voltage signal representing a pulse wave from the corresponding measurement site, and a first pulse wave sensor unit and a second pulse wave sensor unit in advance Alternately driving at predetermined intervals.
- FIG. 1 is an external perspective view of a sphygmomanometer 1 according to a first embodiment.
- FIG. 7 schematically shows a cross section perpendicular to the longitudinal direction of the wrist 90 in a state where the sphygmomanometer 1 according to Embodiment 1 is attached to the left wrist 90.
- FIG. 5 is a diagram showing a planar layout of an electrode group for impedance measurement in a state where the sphygmomanometer 1 according to Embodiment 1 is attached to a wrist 90.
- FIG. 2 is a block diagram of a control system of the sphygmomanometer 1 according to the first embodiment.
- FIG. 2 is a diagram showing a configuration of a sensor unit according to Embodiment 1;
- FIG. 5 is a schematic view for explaining blood pressure measurement based on pulse wave propagation time according to the first embodiment.
- FIG. 7 is a schematic cross-sectional view along the longitudinal direction of the wrist in a state where the sphygmomanometer 1 is attached to the wrist 90 when performing blood pressure measurement by the oscillometric method according to the first embodiment.
- FIG. 2 is a view schematically showing a configuration of a function related to measurement provided in the CPU 100 according to the first embodiment.
- 7 is a flowchart showing a process of blood pressure measurement based on PTT according to the first embodiment.
- FIG. 5 is a diagram showing an example of storage of measurement results according to the first embodiment.
- FIG. 7 is a view showing a display example of measurement results according to the first embodiment.
- FIG. 1 is a diagram showing a schematic configuration of a system according to a first embodiment.
- FIG. 2 is a diagram for explaining the background of the first embodiment.
- FIG. 1 is a diagram showing a configuration of a first embodiment.
- FIG. 16 schematically shows a configuration of a function related to measurement provided in CPU 100A according to the second embodiment.
- FIG. 10 schematically shows a cycle CR according to the second embodiment.
- FIG. 10 is a diagram schematically showing a waveform of a current signal output to a measurement site according to Embodiment 2.
- 15 is a flowchart showing a control method of the sphygmomanometer 1 according to the fourth embodiment.
- 15 is a flowchart showing another control method of the sphygmomanometer 1 according to the fourth embodiment.
- pulse wave propagation time (hereinafter referred to as PTT) is illustrated as information on pulse waves, but information on pulse waves is not limited to PTT.
- the measurement apparatus for acquiring the information regarding a pulse wave demonstrates the case mounted in the sphygmomanometer which is a wearable terminal.
- the device equipped with the “measurement device” is not limited to the sphygmomanometer.
- the sphygmomanometer is not limited to a wearable terminal.
- FIG. 1 is an external perspective view of the sphygmomanometer 1 according to the first embodiment.
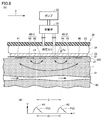
- FIG. 2 schematically shows a cross section perpendicular to the longitudinal direction of the wrist 90 in a state in which the sphygmomanometer 1 according to the first embodiment is attached to the left wrist 90 (hereinafter also referred to as “mounted state”).
- the left wrist 90 is the measurement site.
- the “measurement site” may be a site through which an artery passes, and is not limited to the wrist.
- the measurement site may be, for example, the lower limbs such as the right wrist, the upper arm, the ankle, and the thigh.
- belt 20 is a belt-like member.
- the belt 20 is slidably wound and mounted in the mounted state so that the longitudinal direction of the belt 20 corresponds to the circumferential direction of the wrist 90.
- the dimension (width dimension) in the width direction Y of the belt 20 is, for example, about 30 mm.
- Belt 20 includes a band 23 and a compression cuff 21.
- the strip 23 has an inner circumferential surface 23a which is a surface on the measurement site side and an outer circumferential surface 20b which is a surface opposite to the inner circumferential surface 23a.
- the compression cuff 21 is attached along the inner circumferential surface 23 a of the strip 23 and has an inner circumferential surface 20 a in contact with the wrist 90 (see FIG. 2).
- the compression cuff 21 is configured as a fluid bag by facing two stretchable polyurethane sheets in the thickness direction and welding their peripheral portions.
- the fluid bag of the compression cuff 21 may be a bag-like member capable of containing a fluid.
- the compression cuff 21 is inflated when the fluid is supplied, and the measurement site is pressurized as the compression cuff 21 is inflated. In addition, when the fluid is discharged, the compression cuff 21 contracts and the pressurization state of the measurement site is released.
- the main body 10 is provided integrally with one end 20 e of the belt 20.
- the belt 20 and the main body 10 may be separately formed, and the main body 10 may be integrally attached to the belt 20 via an engaging member (for example, a hinge).
- the portion where the main body 10 is disposed corresponds to the back side surface (surface on the back side of the hand) 90b of the wrist 90 in the mounted state (see FIG. 2).
- FIG. 2 a radial artery 91 and an ulnar artery 91A which pass near the palmar side (palm side) 90a in the wrist 90 are shown.
- the main body 10 has a three-dimensional shape having a thickness in a direction perpendicular to the outer circumferential surface 20 b of the belt 20.
- the main body 10 is small and thin so as not to interfere with the daily activities of the user.
- the main body 10 has a quadrangular frustum-shaped contour protruding outward from the belt 20.
- a display 50 is provided on the top surface (the surface farthest from the measurement site) 10 a of the main body 10.
- An operation unit 52 for inputting an instruction from the user is provided along the side surface 10f of the main body 10 (the left side front side surface in FIG. 1) 10f.
- a sensor portion 40 and a portion between the one end 20 e of the belt 20 and the other end 20 f on the inner peripheral surface 20 a of the belt 20 (that is, the inner peripheral surface 20 a of the compression cuff 21) 40A is provided.
- the sensor units 40 and 40A have a function of detecting a pulse wave using an impedance measurement function.
- An electrode group 40E is disposed on the inner circumferential surface 20a of the portion where the sensor unit 40 is disposed.
- the electrode group 40E has six plate-like (or sheet-like) electrodes 41 to 46 which are disposed in a state of being separated from each other in the width direction Y of the belt 20.
- the part where the electrode group 40E is disposed corresponds to the radial artery 91 of the wrist 90 in the mounted state.
- the solid 22 is disposed at a position corresponding to the electrode group 40E on the outer circumferential surface 21a.
- a pressure cuff 24 is disposed on the outer peripheral side of the solid 22.
- the pressing cuff 24 is an expanding member that locally suppresses a region corresponding to the electrode group 40E in the circumferential direction of the compression cuff 21.
- the pressure cuff 24 is disposed on the inner circumferential surface 23 a of the strip 23 that constitutes the belt 20 (see FIG. 2).
- the band 23 is made of a plastic material that is flexible in the thickness direction and inelastic in the circumferential direction (longitudinal direction).
- the pressing cuff 24 is a fluid bag that expands and contracts in the thickness direction of the belt 20, and is pressurized by the supply of fluid and is not pressurized by discharging the fluid.
- the pressure cuff 24 is configured as, for example, a fluid bag by facing two stretchable polyurethane sheets in the thickness direction and welding their peripheral portions.
- the solid 22 is disposed at a position corresponding to the electrode group 40 ⁇ / b> E on the inner circumferential surface 24 a of the pressing cuff 24.
- the solid 22 is made of, for example, a plate-like resin (for example, polypropylene) having a thickness of about 1 to 2 mm.
- the belt 20, the pressing cuff 24, and the solid 22 are used as a pressing unit that presses the sensor unit 40 against the measurement site (a site corresponding to the radial artery 91).
- the sensor unit 40A has an arrangement aspect and a configuration similar to the sensor unit 40. Specifically, the electrode group 40F is disposed on the inner circumferential surface 20a of the portion where the sensor unit 40A is disposed.
- the electrode group 40F has six plate-like (or sheet-like) electrodes 41A to 46A which are disposed in a state of being separated from each other in the width direction Y of the belt 20.
- the part where the electrode group 40F is disposed corresponds to the ulnar artery 91A of the wrist 90 in the mounted state.
- the solid 22A is disposed at a position corresponding to the electrode group 40F on the outer circumferential surface 21a.
- the pressing cuff 24A is disposed on the outer peripheral side of the solid 22A.
- the pressing cuff 24A is an expanding member that locally suppresses the region corresponding to the electrode group 40F in the circumferential direction of the compression cuff 21.
- the pressure cuff 24A is also disposed on the inner circumferential surface 23a of the strip 23 that constitutes the belt 20 (see FIG. 2).
- the pressing cuff 24A is a fluid bag that expands and contracts in the thickness direction of the belt 20, and is pressurized by the supply of fluid and is not pressurized by discharging the fluid.
- the pressing cuff 24A is configured as, for example, a fluid bag by facing two stretchable polyurethane sheets in the thickness direction and welding their peripheral portions.
- the solid 22A is disposed at a position corresponding to the electrode group 40F on the inner circumferential surface 24b of the pressing cuff 24A.
- the solid 22A is made of, for example, a plate-like resin (eg, polypropylene) having a thickness of about 1 to 2 mm.
- the belt 20, the pressing cuff 24A, and the solid 22A are used as a pressing unit that presses the sensor unit 40A against the measurement site (a site corresponding to the ulnar artery 91A).
- the bottom surface 10b (the surface closest to the measurement site) 10b of the main body 10 and the end 20f of the belt 20 are three-fold buckles 15 (hereinafter, also simply referred to as "buckles 15"). Connected by.
- the buckle 15 includes a plate-like member 25 disposed on the outer circumferential side and a plate-like member 26 disposed on the inner circumferential side.
- One end 25 e of the plate member 25 is rotatably attached to the main body 10 via a connecting rod 27 extending along the width direction Y.
- the other end 25 f of the plate 25 is rotatably attached to one end 26 e of the plate 26 via a connecting rod 28 extending in the width direction Y.
- the other end 26 f of the plate member 26 is fixed by the fixing portion 29 in the vicinity of the end 20 f of the belt 20.
- the attachment position of the fixing portion 29 is variably set in advance in accordance with the circumferential length of the wrist 90 of the user.
- the sphygmomanometer 1 (belt 20) is generally formed in a substantially annular shape, and the bottom surface 10b of the main body 10 and the end 20f of the belt 20 can be opened and closed in the arrow B direction in FIG. Configured
- the user When mounting the sphygmomanometer 1 on the wrist 90, the user passes the left hand through the belt 20 from the direction indicated by the arrow A in FIG. 1 with the buckle 15 opened and the diameter of the ring of the belt 20 increased.
- the user adjusts the angular position of the belt 20 around the wrist 90 by sliding or the like, and moves the sensor unit 40 so as to be positioned on the radial artery 91.
- the electrode group 40E of the sensor unit 40 abuts on a portion 90a1 of the palm lateral surface 90a of the wrist 90 corresponding to the radial artery 91.
- the electrode group 40F of the sensor unit 40A is in a state of being in contact with a portion of the palm lateral surface 90a of the wrist 90 that corresponds to the ulnar artery 91A. In this state, the user closes and fixes the buckle 15. Thus, the user winds and wears the sphygmomanometer 1 (belt 20) around the wrist 90.
- FIG. 3 is a diagram showing a planar layout of the electrode group for impedance measurement in a state where the sphygmomanometer 1 according to the first embodiment is attached to the wrist 90.
- the electrode group 40E of the sensor unit 40 in the worn state, is aligned along the longitudinal direction of the wrist corresponding to the radial artery 91 of the left wrist 90.
- the electrode group 40E includes current electrode pairs 41 and 46 for current conduction disposed on both sides in the width direction Y, and a detection electrode pair 42 and 43 and a detection electrode pair 44 disposed between the current electrode pairs 41 and 46. , 45 and so on.
- the first pulse wave sensor 40-1 includes detection electrode pairs 42 and 43
- the second pulse wave sensor 40-2 includes detection electrode pairs 44 and 45.
- Detection electrode pairs 44 and 45 are arranged corresponding to the downstream side of the blood flow of the radial artery 91 with respect to the detection electrode pairs 42 and 43.
- a distance D (see FIG. 6 described later) between the center of the detection electrode pair 42, 43 and the center of the detection electrode pair 44, 45 is set to, for example, 20 mm.
- the interval D corresponds to the interval between the first pulse wave sensor 40-1 and the second pulse wave sensor 40-2.
- the distance between the detection electrode pair 42, 43 and the distance between the detection electrode pair 44, 45 are both set to 2 mm.
- Electrode group 40F of the sensor unit 40A is aligned along the longitudinal direction of the wrist corresponding to the ulnar artery 91A of the left wrist 90.
- Electrode group 40F includes current electrode pairs 41A and 46A for current conduction disposed on both sides with respect to width direction Y, and detection electrode pairs 42A and 43A and detection electrode pair 44A disposed between the current electrode pairs 41A and 46A. , 45A.
- the first pulse wave sensor 40-1A includes a detection electrode pair 42A, 43A
- the second pulse wave sensor 40-2A includes a detection electrode pair 44A, 45A.
- the detection electrode pair 44A, 45A is disposed corresponding to the downstream side of the blood flow of the ulnar artery 91A with respect to the detection electrode pair 42A, 43A.
- the above-mentioned distance D between the center of the detection electrode pair 42A, 43A and the center of the detection electrode pair 44A, 45A is set to, for example, 20 mm.
- the interval D corresponds to the interval between the first pulse wave sensor 40-1A and the second pulse wave sensor 40-2A.
- the distance between the detection electrode pair 42A, 43A and the distance between the detection electrode pair 44A, 45A are both set to 2 mm, for example.
- the belt 20 can be configured to be thin as a whole. Also, since the electrode groups 40E and 40F can be configured flexibly, the electrode groups 40E and 40F do not prevent the compression of the left wrist 90 by the compression cuff 21 and do not impair the accuracy of blood pressure measurement by the oscillometric method described later. .
- FIG. 4 is a block diagram of a control system of the sphygmomanometer 1 according to the first embodiment.
- the sphygmomanometer 1 has an oscillometric blood pressure measurement function and a blood pressure measurement function based on PTT.
- the sphygmomanometer 1 of FIG. 4 exemplifies a configuration using air as a fluid.
- the main unit 10 includes a central processing unit (CPU) 100 functioning as a control unit, a display 50, a memory 51 functioning as a storage unit, an operation unit 52, a battery 53, and a communication unit 59. And. Also, the main body 10 includes a pressure sensor 31, a pump 32, a valve 33, a pressure sensor 34, and a switching valve 35. The switching valve 35 switches the connection destination of the pump 32 and the valve 33 to the compression cuff 21 or the pressing cuffs 24 and 24A.
- CPU central processing unit
- the main body 10 includes a pressure sensor 31, a pump 32, a valve 33, a pressure sensor 34, and a switching valve 35.
- the switching valve 35 switches the connection destination of the pump 32 and the valve 33 to the compression cuff 21 or the pressing cuffs 24 and 24A.
- main body 10 includes an oscillation circuit 310 and an oscillation circuit 340 that convert outputs from pressure sensor 31 and pressure sensor 34 into frequencies, and a pump drive circuit 320 that drives pump 32.
- the configuration of the sensor units 40 and 40A will be described later with reference to FIG.
- the display 50 is configured of, for example, an organic EL (Electro Luminescence) display, and displays information in accordance with a control signal from the CPU 100. This information includes the measurement results.
- the display 50 is not limited to the organic EL display, and may be configured of another type of display such as, for example, an LCD (Liquid Cristal Display).
- the operation unit 52 is, for example, a push-type switch, and inputs an operation signal to the CPU 100 in accordance with an instruction to start or stop blood pressure measurement by the user.
- the operation unit 52 is not limited to the push-type switch, and may be, for example, a pressure-sensitive (resistive) or proximity-type (electrostatic capacitive) touch panel switch.
- the main body 10 may include a microphone (not shown), and may receive an instruction to start blood pressure measurement by the user's voice.
- the memory 51 is data of a program for controlling the sphygmomanometer 1, data used to control the sphygmomanometer 1, setting data for setting various functions of the sphygmomanometer 1, data of measurement results of blood pressure values, etc. Is stored temporarily.
- the memory 51 is also used as a work memory or the like when a program is executed.
- the CPU 100 executes various functions as a control unit in accordance with a program for controlling the sphygmomanometer 1 stored in the memory 51. For example, when performing blood pressure measurement by the oscillometric method, the CPU 100 drives the pump 32 (and the valve 33) based on a signal from the pressure sensor 31 in response to an instruction to start blood pressure measurement from the operation unit 52. Do. Further, the CPU 100 calculates the blood pressure value (systolic blood pressure (systolic blood pressure) and diastolic blood pressure (Diastolic blood pressure)) based on the signal from the pressure sensor 31, and also measures the pulse rate. calculate.
- blood pressure value systolic blood pressure (systolic blood pressure) and diastolic blood pressure (Diastolic blood pressure)
- the CPU 100 When performing blood pressure measurement based on PTT, the CPU 100 performs control to drive the valve 33 in order to discharge air in the compression cuff 21 in accordance with an instruction to start blood pressure measurement from the operation unit 52. Further, the CPU 100 controls the switching valve 35 to switch the connection destination of the pump 32 (and the valve 33) to the pressure cuffs 24 and 24A. Further, the CPU 100 performs control to calculate the blood pressure value based on the signal from the pressure sensor 34.
- Communication unit 59 is controlled by CPU 100 to communicate with an external information processing apparatus via network 900.
- the external information processing apparatus may include a portable terminal 10B and a server 30, which will be described later, but is not limited to these apparatuses.
- Communication via network 900 may include wireless or wired.
- the network 900 may include the Internet and a LAN (Local Area Network). Alternatively, it may include one-to-one communication using a USB cable.
- the communication unit 59 may include a micro USB connector.
- the pump 32 and the valve 33 are connected to the compression cuff 21 and the pressure cuffs 24 and 24A via the switching valve 35 and the air pipes 39a and 39b.
- the pressure sensor 31 is connected to the compression force cuff 21 and the pressing cuffs 24 and 24A via the air pipe 38a and the pressure sensor 34 via the air pipe 38b.
- the pressure sensor 31 detects the pressure in the compression cuff 21 via the air pipe 38a.
- the switching valve 35 is driven based on a control signal supplied from the CPU 100, and switches the connection destination of the pump 32 and the valve 33 to the compression cuff 21 or the pressing cuffs 24 and 24A.
- the pump 32 is configured of, for example, a piezoelectric pump.
- the pump 32 passes the air pipe 39a to pressurize the pressure (cuff pressure) in the compression cuff 21.
- the compression cuff 21 is supplied with air as a fluid for pressurization.
- the pump 32 applies pressure (cuff pressure) in the cuffs of the pressing cuffs 24 and 24A.
- air is supplied to the pressure cuffs 24 and 24A through the air pipe 39b.
- the valve 33 is mounted on the pump 32, and is configured to be controlled in opening / closing as the pump 32 is turned on / off. Specifically, when the connection destination of the pump 32 and the valve 33 is switched to the compression cuff 21 by the switching valve 35, the valve 33 is closed when the pump 32 is turned on, and the pressure cuff 21 is While the air is enclosed, it is opened when the pump 32 is turned off, and the air of the compression cuff 21 is exhausted to the atmosphere through the air pipe 39a.
- Pump drive circuit 320 drives pump 32 based on a control signal supplied from CPU 100.
- the pressure sensor 31 is, for example, a piezoresistive pressure sensor, and is connected to the pump 32, the valve 33, and the compression cuff 21 via an air pipe 38a.
- the pressure sensor 31 detects the pressure of the belt 20 (the compression cuff 21), for example, the pressure based on the atmospheric pressure (zero) via the air pipe 38a, and outputs it as a time-series signal.
- the oscillation circuit 310 outputs, to the CPU 100, a frequency signal having a frequency corresponding to an electrical signal value based on a change in electrical resistance due to the piezoresistive effect from the pressure sensor 31.
- the output of the pressure sensor 31 is used to control the pressure of the compression force 21 and to calculate the blood pressure value by oscillometric method.
- the pressure sensor 34 is, for example, a piezoresistive pressure sensor, and is connected to the pump 32, the valve 33, and the pressing cuffs 24 and 24A through an air pipe 38b.
- the pressure sensor 34 detects the pressure of the pressure cuffs 24 and 24A, for example, the pressure based on the atmospheric pressure (zero) via the air pipe 38b, and outputs it as a time-series signal.
- the oscillation circuit 340 oscillates according to the electrical signal value based on the change in electrical resistance due to the piezoresistive effect from the pressure sensor 34, and outputs a frequency signal having a frequency according to the electrical signal value of the pressure sensor 34 to the CPU 100.
- the output of the pressure sensor 34 is used to control the pressure of the pressure cuffs 24 and 24A and to calculate the blood pressure based on PTT.
- the CPU 100 controls the pump 32 and the valve 33 to increase and decrease the cuff pressure according to various conditions. .
- the battery 53 supplies power to various elements mounted on the main body 10.
- the battery 53 also supplies power to the sensor unit 40 and the 40A unit 49 through the wiring 71.
- the wiring 71 is inserted between the main body 10 and the sensor units 40 and 40A along the circumferential direction of the belt 20 in a state of being sandwiched between the strip 23 of the belt 20 and the compression cuff 21 together with the wiring 72 for signal. It is provided extending to
- FIG. 5 is a diagram showing the configuration of the sensor unit according to the first embodiment.
- the sensor unit 40 includes the electrodes 41 to 46 of the above-described electrode group 40E, and a conduction and voltage detection unit 49.
- the energization and voltage detection unit 49 outputs an AC power supply unit 492 (corresponding to a first output unit) that outputs the first current signal having the first frequency to the corresponding measurement site via the current electrodes 41 and 46, and the corresponding operation.
- a voltage detection unit 491 (corresponding to a first detection unit) for detecting a voltage signal representing a pulse wave from the measurement site of (1) through the detection electrodes 42 to 45.
- AC power supply unit 492 receives a voltage from battery 53 and applies a voltage having a first frequency to current electrodes 41 and 46 in accordance with control signal CT1 from CPU 100. Thereby, current is supplied to the measurement site.
- the voltage detection unit 491 detects a voltage signal from the measurement site via the detection electrodes 42 to 45 in accordance with the control signal CT1 from the CPU 100.
- the voltage detection unit 491 includes a filter unit 493 including a band-pass filter (BPF) having a filter characteristic (cutoff frequency or the like) corresponding to the first frequency, an S / N ratio of a detected voltage signal (signal-noise). and an A / D (analog-digital) converter 495 for converting a voltage signal into digital data.
- BPF band-pass filter
- a / D analog-digital converter 495 for converting a voltage signal into digital data.
- the voltage detection unit 491 outputs the detected S / N ratio R1 and the converted digital data to the CPU 100.
- the sensor unit 40A includes the electrodes 41A to 46A of the electrode group 40F described above, and a current detection and voltage detection unit 49A.
- the AC power supply 492A (corresponding to the second output part) outputs the second current signal having the second frequency to the corresponding measurement site via the current electrodes 41A and 46A, and the corresponding current And a voltage detection unit 491A (corresponding to a second detection unit) for detecting a voltage signal representing a pulse wave from the measurement site of (1) through the detection electrodes 42A to 45A.
- AC power supply unit 492A receives the voltage from battery 53 and applies a voltage having the second frequency to current electrodes 41A and 46A in accordance with control signal CT2 from CPU 100. Thereby, current is supplied to the measurement site.
- Voltage detection unit 491A detects a voltage signal from the measurement site via detection electrodes 42A to 45A in accordance with control signal CT2 from CPU 100.
- the voltage detection unit 491A includes a filter unit 493A including a BPF having a filter characteristic (cutoff frequency) corresponding to the second frequency, and an S / N ratio (signal-noise ratio) of a voltage signal to be detected. It includes an N ratio detector 494A, and an A / D converter 495A that converts a voltage signal into digital data.
- the voltage detection unit 491A outputs the detected S / N ratio R2 and the converted digital data to the CPU 100.
- AC power supply units 492 and 492A may be configured to include a booster circuit and a voltage adjustment circuit for receiving a voltage from battery 53 and generating a voltage signal of the first frequency and the second frequency.
- FIG. 6 is a schematic view for explaining blood pressure measurement based on pulse wave propagation time according to the first embodiment.
- FIG. 6A shows a schematic cross section along the longitudinal direction of the wrist when blood pressure measurement based on pulse wave propagation time is performed in a state where the sphygmomanometer 1 is attached to the wrist 90.
- FIG. 6B shows the waveforms of pulse wave signals PS1 and PS2.
- FIG. 6 shows the sensor unit 40 positioned above the radial artery 91 at the measurement site, even if the sensor unit 40A is positioned above the ulnar artery 91A at the measurement site, FIG. Similar explanations are possible. Therefore, here, the description of blood pressure measurement based on pulse wave propagation time by the sensor unit 40A will be briefly described.
- the AC power supply unit 492 unit applies a predetermined voltage between the current electrode pair 41 and 46 to have a first frequency at the measurement site, for example, a high frequency constant current of 1 mA. flow i.
- the voltage detection unit 491 also detects the voltage signal v1 between the detection electrode pair 42, 43 constituting the first pulse wave sensor 40-1 and the detection electrode pair 44, 45 constituting the second pulse wave sensor 40-2. And the voltage signal v2 of the The voltage signals v1 and v2 are pulses of the blood flow of the radial artery 91 in portions of the palm side 90a of the left wrist 90, which are opposed to the first pulse wave sensor 40-1 and the second pulse wave sensor 40-2, respectively. Represents the change in electrical impedance due to waves.
- the voltage signals v1 and v2 are removed by the filter unit 493 from components other than the signal component corresponding to the first frequency.
- the S / N ratio detection unit 494 detects the S / N ratio of the voltage signal after passing through the filter.
- the A / D conversion unit 495 converts the voltage signals v1 and v2 after passing through the filter unit 493 from analog data to digital data, and outputs the converted data to the CPU 100 through the wiring 72.
- the CPU 100 performs predetermined signal processing on the input voltage signals v1 and v2 (digital data) to generate pulse wave signals PS1 and PS2 having a mountain-like waveform as shown in FIG. 6 (B). Generate
- the voltage signals v1 and v2 are, for example, about 1 mv. Moreover, each peak A1, A2 of pulse wave signal PS1, PS2 is about 1V, for example.
- PWV Pulse Wave Velocity
- the sensor unit 40A also has a second frequency at the measurement site by applying a predetermined voltage between the current electrode pair 41 and 46 with respect to the measurement site of the ulnar artery 91A, for example, the current having a second frequency A high frequency constant current i with a value of 1 mA is applied.
- the voltage detection unit 491A is provided between the voltage signal v1A between the detection electrode pair 42A, 43A constituting the first pulse wave sensor 40-1A and the detection electrode pair 44A, 45A constituting the second pulse wave sensor 40-2A.
- the voltage signal v2A of the The voltage signals v1A and v2A are pulses of the blood flow of the ulnar artery 91A in portions of the palm side 90a of the left wrist 90, which are opposed to the first pulse wave sensor 40-1A and the second pulse wave sensor 40-2A, respectively. Represents the change in electrical impedance due to waves.
- the filter unit 493A In the voltage detection unit 49A, components other than the signal component corresponding to the second frequency are removed from the voltage signals v1A and v2A by the filter unit 493A.
- the S / N ratio detection unit 494A detects the S / N ratio of the voltage signal after passing through the filter.
- the A / D conversion unit 495A converts the voltage signals v1 and v2 after passing through the filter unit 493A from analog data into digital data, and outputs the converted data to the CPU 100 through the wiring 72.
- the A / D conversion unit 495 and the A / D conversion unit 495A have, for example, 300 Hz as a sampling rate, it is not limited to this rate, and may be any sampling rate necessary to maintain the accuracy of PTT calculation. .
- the CPU 100 performs predetermined signal processing on the input voltage signals v1A and v2A (digital data) to generate pulse wave signals PS1A and PS2A.
- the interval D between the respective peaks A1 and A2 of the pulse wave signals PS1A and PS2A and the time difference ⁇ t are detected in the same manner as described above.
- the pressure cuff 24 is in a pressurized state, and the air inside the compression cuff 21 is discharged and is in a non-pressured state.
- the pressing cuff 24 and the solid 22 are disposed across the first pulse wave sensor 40-1, the second pulse wave sensor 40-2, and the current electrode pair 41, 46 with respect to the artery direction of the radial artery 91. Therefore, when the pressure cuff 24 is pressurized by the pump 32, the first pulse wave sensor 40-1, the second pulse wave sensor 40-2, and the current electrode pair 41, 46 are wrist-linked via the solid material 22.
- the palm side 90 a of 90 is pressed.
- the pressing force of each of the current electrode pairs 41 and 46, the first pulse wave sensor 40-1, and the second pulse wave sensor 40-2 on the palm side 90a of the wrist 90 can be set to an appropriate value.
- the pressure cuff 24 of the fluid bag is used as the pressing portion, the pump 32 and the valve 33 can be used in common with the compression cuff 21, and the configuration can be simplified.
- the first pulse wave sensor 40-1, the second pulse wave sensor 40-2, and the current electrode pair 41, 46 can be pressed through the solid 22, the pressing force on the measurement site becomes uniform, and the accuracy is high. Blood pressure measurement based on pulse wave transit time can be performed. Such a feature can be obtained similarly even in the case of measurement by the sensor unit 40A.
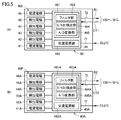
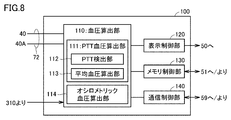
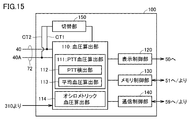
- FIG. 8 is a diagram schematically showing a configuration of functions related to measurement provided in the CPU 100 according to the first embodiment.
- CPU 100 calculates blood pressure by calculation (estimate) blood pressure calculation unit 110, display control unit 120 that controls display 50, writes data to memory 51, or reads data from memory 51.
- a communication control unit 140 that controls the communication unit 59.
- the blood pressure calculation unit 110 includes a PTT blood pressure calculation unit 111 corresponding to a blood pressure measurement function based on PTT, and an oscillometric blood pressure calculation unit 114 corresponding to a blood pressure measurement function according to the oscillometric method shown in FIG.
- the PTT blood pressure calculation unit 111 includes a PTT detection unit 112 and an average blood pressure calculation unit 113. Details of the functions of each unit will be described later.
- the blood pressure measurement function based on PTT by the PTT blood pressure calculation unit 111 will be described.
- the CPU 100 activates the PTT blood pressure calculation unit 111.
- the CPU 100 drives the switching valve 35 according to the instruction of the user, and switches the connection destination of the pump 32 and the valve 33 to the pressure cuffs 24 and 24A.
- the CPU 100 closes the valve 33 and drives the pump 32 through the pump drive circuit 320 to send air to the pressure cuffs 24 and 24A, thereby increasing the cuff pressure Pc which is the pressure in the pressure cuffs 24 and 24A at a constant speed.
- the PTT detection unit 112 of the CPU 100 outputs the first first pulse wave sensor 40-1 and the second second pulse wave sensor 40-2 of the sensor unit 40 in time series.
- the first and second pulse wave signals PS1 and PS2 are obtained, and the cross-correlation coefficient r between the waveforms of the first and second pulse wave signals PS1 and PS2 is calculated in real time.
- the time difference ⁇ t between the peaks A1 and A2 of the amplitudes of the first and second pulse wave signals PS1 and PS2 is calculated as PTT (pulse wave propagation time).
- the PTT detection unit 112 of the CPU 100 receives the first and second pulse wave signals PS1A and PS2A from the first pulse wave sensor 40-1A and the second pulse wave sensor 40-2A of the sensor unit 40A. And calculate the cross-correlation coefficient r between the waveforms of both pulse wave signals.
- the CPU 100 determines that the cross-correlation coefficient r calculated in real time in the pressurization process exceeds the threshold value Th, the first and second pulse wave signals PS1A and PS2A detected at the cuff pressure Pc at that time
- the time difference ⁇ t between the peaks of the amplitudes of the first and second pulse wave signals PS1A and PS2A is calculated as PTT (pulse wave propagation time).
- EBP blood pressure
- ⁇ and ⁇ are predetermined coefficients
- DT represents pulse wave propagation time, whereby the blood pressure EBP (hereinafter also referred to as blood pressure EBP-1) based on the PTT of the radial artery 91 and the ulnar artery 91A
- EBP-2 blood pressure based on PTT is measured
- the average blood pressure calculation unit 113 calculates the average of the blood pressure EBP-1 and the blood pressure EBP-2.
- the CPU 100 After the instruction to start measurement is instructed via the operation unit 52, the CPU 100 repeatedly executes the calculation of PTT and the calculation of the blood pressure EBP while the instruction to stop is not given. When an instruction to stop measurement is input via the operation unit 52, the CPU 100 controls each unit to end the measurement operation.
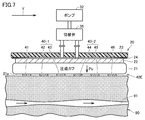
- FIG. 7 is a schematic cross-sectional view along the longitudinal direction of the wrist in a state where the sphygmomanometer 1 is attached to the wrist 90 when performing blood pressure measurement by the oscillometric method according to the first embodiment.
- the pressure cuff 24 is in a non-pressurized state by discharging the internal air, and the compression cuff 21 is in a pressurized state in which the air is supplied.
- the compression cuff 21 extends in the circumferential direction of the wrist 90, and when pressed by the pump 32, uniformly compresses the circumferential direction of the left wrist 90. Since only the electrode group 40E exists between the inner peripheral surface of the compression cuff 21 and the left wrist 90, the compression by the compression cuff 21 is not blocked by other members, and the blood vessel is sufficiently closed. be able to.
- the oscillometric blood pressure calculation unit 114 follows the output waveform from the first pressure sensor 31 through the oscillation circuit 310 detected in the pressurization process or decompression process of the compression cuff 21 to the measurement site. Calculate (estimate) blood pressure.
- the method of calculating blood pressure by the oscillometric method according to the present embodiment follows a known method, and therefore the description will not be repeated here.
- the display control unit 120 generates display data based on various types of information including the blood pressure calculated by the blood pressure calculation unit 110, and drives the display 50 according to the generated display data. Thereby, the display 50 displays information including the measured blood pressure. Further, the memory control unit 130 stores various information including the blood pressure calculated by the blood pressure calculation unit 110 in the memory 51. Thus, the memory 51 can store a history of information including the measured blood pressure. The memory control unit 130 reads various types of information including the blood pressure calculated by the blood pressure calculation unit 110 from the memory 51. The communication control unit 140 transmits various information including the blood pressure calculated by the blood pressure calculation unit 110 or read from the memory 51 to an external information processing apparatus via the communication unit 59, and the information processing apparatus Display on.
- the functions of the units in FIG. 8 are stored in the memory 51 as a program.
- the CPU 100 realizes the functions of the respective units by reading and executing a program from the memory 51.
- the function of each part is not limited to the method realized by the program.
- it may be realized by a circuit including an application specific integrated circuit (ASIC) or a field-programmable gate array (FPGA).
- ASIC application specific integrated circuit
- FPGA field-programmable gate array
- it may be realized by a combination of a program and a circuit.
- FIG. 9 is a flowchart showing a process of blood pressure measurement based on PTT according to the first embodiment.
- a program according to this flowchart is stored in the memory 51, read by the CPU 100, and executed.
- CPU 100 receives a start instruction when the user performs a switch operation to start blood pressure measurement of PTT at operation unit 52 in the wearing state (step S10).
- the CPU 100 controls the switching valve 35 so as to switch the connection destination of the pump 32 and the valve 33 to the pressure cuffs 24 and 24A (step S12).
- air is exhausted from the cuffs 24 and 24A.
- the CPU 100 drives the pump 32 to pressurize the pressure cuffs 24, 24A to a predetermined pressure, and then closes the valve 33 (step S14), and then stops the pump 32 (step SS16).
- the CPU 100 outputs a current signal to the measurement site and outputs control signals CT1 and CT2 to the sensor units 40 and 40A so as to detect a voltage signal indicating a pulse wave (step S18).
- the sensor unit 40 outputs digital data of the voltage signal (pulse wave signal) detected from the measurement site of the radial artery 91, and detects the S / N ratio R1 of the component of the first frequency in the voltage signal. Output (step S22).
- the sensor unit 40A outputs digital data of the voltage signal (pulse wave signal) detected from the measurement site of the ulnar artery 91A, and detects the S / N ratio R2 of the component of the second frequency in the voltage signal And output to the CPU 100 (step S22).
- the PTT detection unit 112 calculates PTT in accordance with the pulse wave signals from the sensor units 40 and 40A (step S24).
- the PTT blood pressure calculation unit 111 calculates blood pressure EBP-1 based on PTT corresponding to the sensor unit 40, and calculates blood pressure EBP-2 based on PTT corresponding to the sensor unit 40A (step S26).
- the CPU 100 outputs blood pressure information based on the calculated blood pressures EBP-1 and EBP-2 (step S28).
- the display control unit 120 controls the display 50 to display information on the blood pressure.
- the memory control unit 130 stores the information on the blood pressure in the memory 51.
- the communication control unit 140 transmits the information on the blood pressure to an external information processing apparatus via the communication unit 59.
- FIG. 10 is a diagram showing an example of storage of measurement results according to the first embodiment.
- the memory 51 stores a table 394 for recording the measurement results of the sphygmomanometer 1.
- table 394 stores measurement result data in record units.
- Each record is data 39E of ID (identification) for uniquely identifying the record, data 39G of measurement date and time, blood pressure value calculated (estimated) by oscillometric blood pressure calculation unit 114 (systolic blood pressure SBP and diastole Data 39H including blood pressure DBP) and pulse rate PLS, S / N ratio data 39I, and data 39J indicating blood pressure calculated (estimated) by PTT blood pressure calculation unit 111 are associated and included.
- the S / N ratio data 39I includes the S / N ratio R1 detected for the associated blood pressure EBP-1 and the S / N ratio R2 detected for the associated blood pressure EBP-2.
- Data 39J includes blood pressure EBP-1 and blood pressure EBP-2 calculated (estimated) at the time of measurement of PTT blood pressure.
- the data 39J may further include the representative blood pressure EBP-R.
- Representative blood pressure EBP-R indicates blood pressure that is representative of corresponding blood pressure EBP-1 and blood pressure EBP-2.
- the memory control unit 130 associates blood pressure and pulse rate data 39H according to the oscillometric method measured at the relevant date and time, and blood pressure value data 39J based on PTT, in association with the measurement date and time data 39G Store.
- the manner of storing measurement data in the table 394 is not limited to the record unit as shown in FIG. Any mode may be used as long as the detected data 39E to 39J are associated (linked) each time the blood pressure is measured.
- the representative blood pressure EBP-R indicates the average blood pressure calculated from the corresponding blood pressure EBP-1 and blood pressure EBP-2 by the average blood pressure calculation unit 113, but the representative blood pressure EBP-R is the average blood pressure It is not limited to.
- the CPU 100 may determine one of the blood pressure EBP-1 and the blood pressure EBP-2 which satisfies the predetermined condition as the representative blood pressure EBP-R.
- a predetermined condition for example, the larger (or smaller) one of the blood pressure EBP-1 and the blood pressure EBP-2 is determined as the representative blood pressure EBP-R.
- one of blood pressure EBP-1 and blood pressure EBP-2 which exceeds the threshold (or which is lower than the threshold) is determined as the representative blood pressure EBP-R.
- the higher one of the blood pressure EBP-1 and the blood pressure EBP-2 (the smaller the noise) is determined as the representative blood pressure EBP-R.
- one of blood pressure EBP-1 and blood pressure EBP-2 that has a corresponding S / N ratio larger (higher) than a predetermined threshold value is determined as a representative blood pressure EBP-R.
- the average blood pressure calculation unit 113 has a function of weighted average calculation of calculating an average by weighting each of the blood pressure EBP-1 and the blood pressure EBP-2.
- the weight of blood pressure EBP-1 is based on the value of the corresponding S / N ratio R1
- the weight of blood pressure EBP-2 is based on the corresponding S / N ratio R2.
- the average blood pressure calculation unit 113 sets the weight to be larger as the corresponding S / N ratio is higher (that is, as the noise is smaller). Therefore, the representative blood pressure EBP-R calculated by the weighted average can represent a value close to the blood pressure of the one having a higher S / N ratio among the blood pressure EBP-1 and the blood pressure EBP-2.
- FIG. 11 is a diagram showing a display example of measurement results according to the first embodiment.
- the screen of display 50 includes systolic blood pressure SBP, diastolic blood pressure DBP and pulse rate PLS, representative blood pressure EBP-R, reliability 40B, and measurement date based on the oscillometric method. It is based on the value of S / N ratio corresponding to blood pressure EBP-1 based on representative blood pressure EBP-R and blood pressure EBP-2.
- the reliability 40B includes the reliability (or authenticity) of the value of the representative blood pressure EBP-R being displayed.
- the reliability 40B is based on the blood pressure EBP-1 based on the representative blood pressure EBP-R displayed on the same screen, the S / N ratio R1 corresponding to the blood pressure EBP-2, and the S / N ratio R2.
- Can. when the CPU 100 determines that the S / N ratio R1 and the S / N ratio R2 are larger (higher) values than the threshold, the CPU 100 determines that the reliability is high, and the reliability 40B is “GOOD”. It displays with the character of (refer to FIG. 11).
- the CPU 100 determines that at least one of the S / N ratio R1 and the S / N ratio R2 is equal to or less than the threshold, the CPU 100 determines that the reliability is low, and the character of "NG" To display the reliability 40B.
- the output aspect of reliability is not limited to such a character.
- the display of an image (pattern), the color of the value of the representative blood pressure EBP-R, or the like may be used.
- the user can also obtain an indication as to whether the displayed blood pressure EBP-R is a reliable value from the reliability 40B.
- the display example of FIG. 11 corresponds to, for example, a display example when the blood pressure measurement ends (step S28) or a display example of data read from the table 394 of FIG.
- the information in FIG. 11 is displayed by the display control unit 120 controlling the display 50.
- the display control unit 120 calculates the representative blood pressure EBP-R based on the blood pressure EBP-1 and EBP-2 calculated by the PTT blood pressure calculation unit 111, the blood pressure value calculated by the oscillometric blood pressure calculation unit 114, Display data is generated based on the reliability 40B, and the display 50 is driven based on the display data.
- the display control unit 120 generates display data based on the associated data 39H and data 39J and the reliability 40B of the table 394 in FIG. 10, and drives the display 50 based on the generated display data.
- the display control unit 120 can display the measured blood pressure data or the blood pressure data stored in the table 394 on the display 50.
- FIG. 12 is a diagram showing a schematic configuration of a system according to the first embodiment.
- the sphygmomanometer 1 described above communicates with the server 30 or the portable terminal 10 B, which is an external information processing device, via the network 900.
- the sphygmomanometer 1 communicates with the portable terminal 10B via the LAN, and the portable terminal 10B communicates with the server 30 via the Internet.
- the sphygmomanometer 1 can communicate with the server 30 via the portable terminal 10B.
- the sphygmomanometer 1 may communicate with the server 30 without passing through the portable terminal 10B.
- the CPU 100 may transmit the information to the portable terminal 10B and cause the display unit 158 to display the information.
- the storage destination of the measurement results shown in the table 394 of FIG. 10 is not limited to the memory 51 of the sphygmomanometer 1.
- the storage unit of the portable terminal 10B or the storage unit 32A of the server 30 may be used.
- it may be stored in two or more of the memory 51, the storage unit of the portable terminal 10B, and the storage unit 32A of the server 30.
- FIG. 13 is a diagram for explaining the background of the first embodiment.
- FIG. 14 is a diagram showing the configuration of the first embodiment.
- a voltage signal (pulse wave signal) having a high S / N ratio depending on individual differences or the mounting mode of the sphygmomanometer 1 Since there are variations in the part that can detect), a part that can detect a voltage signal (pulse wave signal) with a high S / N ratio among multiple measurement parts is determined, and the pulse wave signal is determined from the determined part. It is desirable to detect.
- electrodes are disposed with both the radial artery 91 and the ulnar artery 91 A as measurement sites, and different frequencies (first frequency or second frequency) for each measurement site.
- a current of frequency is output, and a voltage signal representing a pulse wave detected from each measurement site is processed based on filter characteristics corresponding to the corresponding frequency.
- the first embodiment by selecting the higher pulse wave signal having the above-described S / N ratio, it is possible to obtain pulse wave information with high accuracy and the representative blood pressure EBP-R.
- the first frequency exhibits a value different from the second frequency.
- the first frequency is one of 50 kHz and 60 kHz
- the second frequency is the other.
- the values of the first frequency and the second frequency are not limited to these.
- the sensor unit 40 corresponding to the first pulse wave sensor unit and the sensor unit 40A corresponding to the second pulse wave sensor unit are not simultaneously driven, but are predetermined. It is driven alternately at specified intervals.
- the sphygmomanometer 1 according to the second embodiment includes a CPU 100A that realizes a function different from that of the CPU 100 according to the first embodiment.
- the configuration of sphygmomanometer 1 according to the second embodiment is the same as the configuration shown in FIG. 1, and therefore description will not be repeated.
- FIG. 15 is a diagram schematically showing a configuration of functions related to measurement provided in the CPU 100A according to the second embodiment.
- CPU 100A includes switching unit 150 in addition to the configuration of CPU 100 shown in FIG.
- the other functions of CPU 100A are the same as those shown in FIG. 8, and therefore the description will not be repeated.
- the switching unit 150 outputs the control signal CT1 to the sensor unit 40, and outputs the control signal CT2 to the sensor unit 40A.
- the switching unit 150 alternately outputs the control signal CT1 and the control signal CT2 at a predetermined cycle (interval) CR.
- the sensor unit 40 is driven in a period in which the control signal CT1 is output from the switching unit 150, and stops in a period in which the control signal CT1 is not output.
- the sensor unit 40A is driven during the period when the control signal CT2 is output from the switching unit 150, and stops during the period when the control signal CT2 is not output.
- the sensor unit 40 and the sensor unit 40A operate in the same manner as in the first embodiment during the driving periods.
- the 2nd frequency which the 2nd current signal which the 2nd current signal which outputs to a part (part corresponding to radial artery 91) has is the same frequency, for example, shows 50 kHz, it is not limited to this. Therefore, the filter unit 493 and the filter unit 493A also have frequency characteristics (cutoff frequency) according to 50 kHz.
- the frequency of the output current is sufficiently large.
- CR is determined to have a period corresponding to several hundreds to several kHz. It is desirable to determine this period based on the frequency and sampling rate of the current output to the measurement site.
- FIG. 16 is a diagram schematically showing a cycle CR according to the second embodiment.
- the switching unit 150 outputs the control signal CT1 and the control signal CT2 alternately according to the cycle CR.
- the sensor unit 40 and the sensor unit 40A are alternately driven every half cycle CR1.
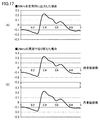
- FIG. 17 is a diagram schematically showing the waveform of the current signal output to the measurement site according to the second embodiment.
- the switching unit 150 alternately controls the control signal CT1 and the control signal CT2 in a cycle CR according to 25 kHz.
- Embodiment 2 As described above, when PTT is calculated based on impedance, the voltage signal (pulse wave signal) having a high S / N ratio can be detected depending on the individual difference or the mounting mode of the sphygmomanometer 1. Among the measurement sites, it is desirable to determine a site where a voltage signal (pulse wave signal) having a high S / N ratio can be detected, and to detect a pulse wave signal from the determined site.
- switching unit 150 sets a predetermined interval (interval according to period CR) to each measurement site corresponding to radial artery 91 and ulnar artery 91A. Then, current signals of the same frequency are alternately output, and pulse wave information including PTT is acquired from voltage signals representing pulse waves detected from each measurement site.
- a current signal is output to each measurement site, as shown in FIG. 13 (A) or 13 (B)
- no current signal is output to the other measurement site, as shown in FIG. 13 (C). It is possible to prevent the occurrence of the interference shown.
- the pulse wave information with high accuracy and the representative blood pressure EBP-R are acquired by selecting the higher pulse wave signal of the S / N ratio. You can also.
- the display of the measurement result on the display 50, the storage in the memory 51, and the transmission to an external information processing apparatus are also performed.
- the first frequency and the second frequency are the same frequency, but may be different.
- the first frequency is one of 50 kHz and 60 kHz
- the second frequency is the other.
- the sphygmomanometer 1 has a first mode and a second mode which are selectively activated as a mode for measuring pulse wave information.
- the sensor unit 40 outputs the first current signal having the first frequency to the measurement site corresponding to the radial artery 91, and sets the voltage signal representing the pulse wave signal detected from the measurement site to the first frequency. Process based on the corresponding filter characteristics.
- the sensor unit 40A outputs the second current signal having the second frequency to the measurement site corresponding to the ulnar artery 91A, and detects the pulse from the measurement site.
- a voltage signal representative of the wave signal is processed based on the filter characteristics corresponding to the second frequency.
- the switching unit 150 stops.
- the first pulse wave sensor unit and the second pulse wave sensor unit are alternately driven by the switching unit 150 at predetermined intervals.
- the sphygmomanometer 1 can acquire pulse wave information including PTT which is not affected by the interference described above.
- the user can instruct the CPU 100 which of the mode 1 and the mode 2 is to be activated.
- FIG. 18 is a flowchart showing a control method of the sphygmomanometer 1 according to the fourth embodiment.
- FIG. 19 is a flowchart showing another control method of the sphygmomanometer 1 according to the fourth embodiment.
- step S18 of FIG. 9 in the case of the first embodiment, the process according to the flowchart of FIG. 18 is executed, and in the case of the second embodiment, the process according to the flowchart of FIG.
- step S18 CPU 100 controls sensor units 40 and 40A as follows.
- the AC power supply unit 492 of the first pulse wave sensor unit (sensor unit 40) is controlled to output the first current signal having the first frequency to the corresponding measurement site (measurement site corresponding to the radial artery 91).
- the first output step (step S31) and the voltage detection unit 491 of the first pulse wave sensor unit represent pulse waves from the measurement site corresponding to the first pulse wave sensor section (measurement site corresponding to the radial artery 91).
- the second output step (step S33) for controlling output to the measurement site corresponding to the ulnar artery 91A, and the voltage detection unit 491A of the second pulse wave sensor unit, the measurement corresponding to the second pulse wave sensor unit Part (ulnar) for controlling to detect a voltage signal representing a pulse wave from the measurement site corresponding to the pulse 91A, and a voltage signal representing the pulse wave detected in the first detection step (step S32) Are processed using the filter unit 493 based on the filter characteristics corresponding to the first frequency (step S35), and the voltage signal representing the pulse wave detected in the second detection step is
- CPU 100 controls sensor units 40 and 40A in the following manner in step S18.
- step S41 controlling the switching unit 150 to drive the first pulse wave sensor unit (sensor unit 40) and the second pulse wave sensor unit (sensor unit 40A) alternately at predetermined intervals (step S41)
- step S42 controlling the AC power supply unit 492 of the first pulse wave sensor unit to output the first current signal having the first frequency to the corresponding measurement site (measurement site corresponding to the radial artery 91) S42), a first detection step (step S43) in which the first pulse wave sensor unit also controls the voltage detection unit 491 to detect a voltage signal representing a pulse wave from the corresponding measurement site, and a second pulse wave sensor unit
- step S44 for controlling the second AC power supply 492A to output the second current signal having the second frequency to the corresponding measurement site (the measurement site corresponding to the ulnar artery 91A); wave
- An AC power supply section 492A of the capacitors unit performs a second detection step of
- the program is non-transitory computer readable such as a compact disk read only memory (CD) attached to the computer of the sphygmomanometer 1, secondary storage device, main storage device and memory card. It can also be provided by recording on a special recording medium. Alternatively, the program can be provided by being recorded in a recording medium such as a hard disk built in the computer. Alternatively, the program can be provided by downloading via the network 900.
- CD compact disk read only memory
- SYMBOLS 1 Sphygmomanometer, 10 main body, 10B portable terminal, 30 server, 40, 40A sensor part, 40B reliability, 40E, 40F electrode group, 491, 491A voltage detection part, 50 display, 51 memory, 52 operation part, 53 battery , 59 communication unit, 71, 72 wiring, 90 wrist, 91 radial artery, 91 A ulnar artery, 110 blood pressure calculation unit, 111 PTT blood pressure calculation unit, 112 PTT detection unit, 113 mean blood pressure calculation unit, 114 oscillometric blood pressure calculation unit, Reference Signs List 120 display control unit 130 memory control unit 140 communication control unit 150 switching unit 158 display unit 310 340 oscillation circuit 394 table 492 492 A AC power supply unit 493 493 A filter unit 494 494 A S / N detection unit, 495, 495A A / D converter, 900 network, A1, A2 peak, CR cycle, CR1 half cycle, CT1, CT2 control signal, D interval, DBP diasto
Abstract
脈波に関する情報をより精度よく取得する。脈波を測定する装置は、互いに離間した測定部位のそれぞれに対応して配置され得る第1脈波センサ部および第2脈波センサ部を備える。第1脈波センサ部は、第1周波数を有する電流信号を測定部位に出力するとともに、測定部位から脈波を表す電圧信号を検出する。第2脈波センサ部は、第1周波数とは異なる周波数を有する電流信号を対応の測定部位に出力するとともに、測定部位から脈波を表す電圧信号を検出する。装置は、第1脈波センサ部が検出する電圧信号を、第1周波数に対応のフィルタ特性に基づき処理し、第2脈波センサ部が検出する電圧信号を、第2周波数に対応のフィルタ特性に基づき処理する。
Description
本開示は、測定装置およびプログラムに関し、特に、脈波に関する情報の測定装置およびプログラムに関する。
脈波を検出する方法として、例えば、特許文献1(特開2017-070739号公報)は、橈骨動脈および尺骨動脈のうちの一つ又は両方の脈波情報を含む生体信号を測定する構成を開示する。
特許文献2(特開2016-135261号公報)は、脈波を検出するために、第1方向に配列された発光素子を有するセンサから生体表面に光を照射し、生体内を通過した光を受光素子で受光して、脈波信号として検出する構成を開示する。また、特許文献2は、近接して配置されたセンサどうしの発光の周期をずらすことで、各センサに由来する光による信号どうしを区別する構成を開示する。
従来、脈波に関する情報を検出するために、動脈上の異なる2点のそれぞれで脈波センサにより脈波信号を検出する構成が提案されている。この場合、脈波センサが近接して配置されるときは、各脈波センサの検出信号は、他方の脈波センサの検出信号と干渉し得る。したがって、脈波に関する情報の正確な検出のために、当該干渉による影響を排除したいとの要望があった。
本開示のある局面における目的は、脈波に関する情報をより精度よく取得する測定装置およびプログラムを提供することである。
この開示のある局面に従うと、脈波を測定する装置は、互いに離間した測定部位のそれぞれに対応して配置され得る第1脈波センサ部および第2脈波センサ部と、を備える。
第1脈波センサ部は、第1周波数を有する第1電流信号を対応の測定部位に出力する第1出力部と、当該対応の測定部位から脈波を表す電圧信号を検出するための第1検出部と、を含む。第2脈波センサ部は、第1周波数とは異なる第2周波数を有する第2電流信号を対応の測定部位に出力する第2出力部と、当該対応の測定部位から脈波を表す電圧信号を検出するための第2検出部と、を含む。
さらに、第1検出部は、検出する脈波を表す電圧信号を、第1周波数に対応のフィルタ特性に基づき処理し、第2検出部は、検出する脈波を表す電圧信号を、第2周波数に対応のフィルタ特性に基づき処理する。
好ましくは、第1周波数は60kHzを示し、第2周波数は50kHzを示す。
この開示の他の局面に従う、脈波を測定する装置は、互いに離間した測定部位のそれぞれに対応して配置され得る第1脈波センサ部および第2脈波センサ部を備える。
この開示の他の局面に従う、脈波を測定する装置は、互いに離間した測定部位のそれぞれに対応して配置され得る第1脈波センサ部および第2脈波センサ部を備える。
第1脈波センサ部は、第1周波数を有する第1電流信号を対応の測定部位に出力する第1出力部と、当該対応の測定部位から脈波を表す電圧信号を検出するための第1検出部と、を含み、第2脈波センサ部は、第2周波数を有する第2電流信号を対応の測定部位に出力する第2出力部と、当該対応の測定部位から脈波を表す電圧信号を検出するための第2検出部と、を含む。測定装置は、第1脈波センサ部と第2脈波センサ部を、予め定められた間隔で交互に駆動する。
好ましくは、第1周波数と第2周波数は、同じ周波数を示す。
好ましくは、第1周波数は、第2周波数とは異なる。
好ましくは、第1周波数は、第2周波数とは異なる。
好ましくは、第1周波数は、50kHzまたは60kHzを示し、第2周波数は、50kHzまたは60kHzを示す。
好ましくは、測定装置は、さらに、第1検出部が検出する電圧信号が示す脈波および第2検出部が検出する電圧信号が示す脈波の少なくとも一方から、脈波伝搬速度を検出する。
好ましくは、測定装置は、さらに、第1検出部が検出する電圧信号が示す脈波から算出される脈波伝搬速度に基づく第1血圧および第2検出部が検出する電圧信号が示す脈波から算出される脈波伝搬速度に基づく第2血圧の少なくとも一方を算出する血圧算出部を、さらに備える。
好ましくは、測定装置は、さらに、第1検出部および第2検出部が検出する脈波を表す電圧信号のそれぞれについて、S/N比を検出する。
好ましくは、血圧算出部は、第1検出部および第2検出部が検出する脈波を表す電圧信号のうち、S/N比の高い方の電圧信号が示す脈波から算出される脈波伝搬速度に基づく血圧を算出する。
好ましくは、血圧算出部は、第1血圧および第2血圧のうちの代表血圧を算出する。
好ましくは、代表血圧は、第1血圧および第2血圧の平均血圧を含む。
好ましくは、代表血圧は、第1血圧および第2血圧の平均血圧を含む。
好ましくは、平均血圧は、第1血圧および第2血圧のそれぞれに重みを付けて算出される平均であって、第1血圧の重みは対応のS/N比に基づき、第2血圧の重みは対応のS/N比に基づいている。
好ましくは、測定装置は、ディスプレイを、さらに備え、表示部を有した外部の情報処理装置と通信する通信部を、さらに備え、測定装置は、血圧算出部が算出した血圧値を表示部に表示するように、通信部を介して情報処理装置に送信する。
この開示のさらに他の局面に従うと、装置の制御方法をコンピュータに実行させるためのプログラムであって、装置は、互いに離間した測定部位のそれぞれに対応して配置され得る第1脈波センサ部および第2脈波センサ部と、を備え、制御方法は、第1脈波センサ部を、第1周波数を有する第1電流信号を対応の測定部位に出力するよう制御する第1出力ステップと、第1脈波センサ部を、第1脈波センサ部に対応の測定部位から脈波を表す電圧信号を検出するよう制御する第1検出ステップと、第2脈波センサ部を、第2周波数を有する第2電流信号を対応の測定部位に出力するよう制御する第2出力ステップと、第2脈波センサ部を、第2脈波センサ部に対応の測定部位から脈波を表す電圧信号を検出するよう制御する第2検出ステップと、第1検出ステップにおいて検出する脈波を表す電圧信号を、第1周波数に対応のフィルタ特性に基づき処理する第1処理ステップと、第2検出ステップにおいて検出する脈波を表す電圧信号を、第2周波数に対応のフィルタ特性に基づき処理する第2処理ステップと、を備える。
この開示のさらに他の局面に従うと、装置の制御方法をコンピュータに実行させるためのプログラムが提供される。装置は、互いに離間した測定部位のそれぞれに対応して配置され得る第1脈波センサ部および第2脈波センサ部と、を備える。制御方法は、第1脈波センサ部を、第1周波数を有する第1電流信号を対応の測定部位に出力するよう制御する第1出力ステップと、第1脈波センサ部を、対応の測定部位から脈波を表す電圧信号を検出するよう制御する第1検出ステップと、第2脈波センサ部を、第2周波数を有する第2電流信号を対応の測定部位に出力するよう制御する第2出力ステップと、第2脈波センサ部を、対応の測定部位から脈波を表す電圧信号を検出するよう制御する第2検出ステップと、第1脈波センサ部と第2脈波センサ部を、予め定められた間隔で交互に駆動するステップと、を備える。
本開示によると、脈波に関する情報をより精度よく取得することが可能となる。
以下、図面を参照しつつ、本発明の実施の形態について説明する。以下の説明では、同一の部品には同一の符号を付してある。それらの名称および機能も同じである。したがって、それらについての詳細な説明は繰り返さない。
以下では、脈波に関する情報として、脈波伝搬時間(以下、PTTと称する)を例示するが、脈波に関する情報は、PTTに限定されない。また、脈波に関する情報を取得するための測定装置は、ウェアラブル端末である血圧計に搭載されるケースを説明する。ただし、「測定装置」を搭載する装置は、血圧計に限られない。また、血圧計は、ウェアラブル型の端末に限定されない。
[実施の形態1]
<血圧計の構成>
図1は、実施の形態1に係る血圧計1の外観斜視図である。図2は、実施の形態1に係る血圧計1が左の手首90に装着された状態(以下、「装着状態」とも称する。)で、手首90の長手方向に対して垂直な断面を模式的に示す図である。本実施の形態では、左の手首90が測定部位となる。なお、「測定部位」は、動脈が通っている部位であればよく、手首に限定されない。測定部位は、例えば、右手首、上腕、足首、大腿などの下肢であってもよい。
<血圧計の構成>
図1は、実施の形態1に係る血圧計1の外観斜視図である。図2は、実施の形態1に係る血圧計1が左の手首90に装着された状態(以下、「装着状態」とも称する。)で、手首90の長手方向に対して垂直な断面を模式的に示す図である。本実施の形態では、左の手首90が測定部位となる。なお、「測定部位」は、動脈が通っている部位であればよく、手首に限定されない。測定部位は、例えば、右手首、上腕、足首、大腿などの下肢であってもよい。
図1および図2を参照して、ベルト20は、帯状の部材である。ベルト20は、その長手方向が手首90を周方向に対応するようにして、装着状態では、摺動可能に巻き付け装着される。ベルト20の幅方向Yの寸法(幅寸法)は、例えば、約30mmである。ベルト20は、帯状体23と、圧迫カフ21とを含む。帯状体23は、測定部位側の面である内周面23aおよび内周面23aの反対側の面である外周面20bを有する。実施の形態1では、ベルト20が測定部位に巻き付けが装着される場合、血圧計1の状態は「装着状態」となる。また、「装着中」は、この「装着状態」が継続する場合を示す。
圧迫カフ21は、帯状体23の内周面23aに沿って取り付けられ、手首90に接する内周面20aを有する(図2参照)。圧迫カフ21は、伸縮可能な2枚のポリウレタンシートを厚さ方向に対向させ、それらの周縁部を溶着して、流体袋として構成されている。本実施の形態では、圧迫カフ21の流体袋は、流体を収容可能な袋状の部材であればよい。圧迫カフ21は、流体が供給されると膨張し、膨張に伴い測定部位は加圧される。また、流体が排出されると圧迫カフ21は収縮し、測定部位の加圧状態は解消される。
本体10は、ベルト20のうちの一方の端部20eと一体に設けられる。なお、ベルト20と本体10とを別々に形成し、ベルト20に対して本体10を、係合部材(例えば、ヒンジ)を介して、一体に取り付ける構成でもよい。本実施の形態では、本体10が配置された部位は、装着状態において手首90の背側面(手の甲側の面)90bに対応する(図2参照)。図2中には、手首90内で掌側面(手の平側の面)90a近傍を通る橈骨動脈91と尺骨動脈91Aが示されている。
図1に示すように、本体10は、ベルト20の外周面20bに対して垂直な方向に厚さを有する立体的形状を有する。本体10は、ユーザの日常活動を妨げないように、小型で、薄厚に形成される。本体10は、ベルト20から外向きに突起した四角錐台状の輪郭を有する。
本体10の頂面(測定部位から最も遠い側の面)10aには、ディスプレイ50が設けられる。本体10の側面(図1における左手前側の側面)10fに沿って、ユーザからの指示を入力するための操作部52が設けられる。
ベルト20の一方の端部20eと他方の端部20fとの間の部位であって、ベルト20の内周面20a(すなわち、圧迫カフ21の内周面20a)上には、センサ部40および40Aが設けられる。センサ部40および40Aは、インピーダンス測定機能を用いて脈波を検出する機能を備える。
センサ部40が配置された部位の内周面20aには、電極群40Eが配置される。電極群40Eは、ベルト20の幅方向Yに関して互いに離間した状態で配置された6個の板状(またはシート状)の電極41~46を有する。電極群40Eが配置された部位は、装着状態において手首90の橈骨動脈91に対応する。
外周面21aにおける、電極群40Eに対応する位置には、固形物22が配置される。固形物22の外周側には、押圧カフ24が配置される。押圧カフ24は、圧迫カフ21の周方向に関して電極群40Eに対応する領域を局所的に抑圧する拡張部材である。押圧カフ24は、ベルト20を構成する帯状体23の内周面23aに配置される(図2参照)。帯状体23は、厚さ方向に関して可撓性を有し、周方向(長手方向)に関して非伸縮性を有するプラスチック材料から構成される。
押圧カフ24は、ベルト20の厚さ方向に伸縮する流体袋であり、流体の供給により加圧状態となり、流体の排出により非加圧状態となる。押圧カフ24は、例えば、伸縮可能な2枚のポリウレタンシートを厚さ方向に対向させ、それらの周縁部を溶着して、流体袋として構成されている。
押圧カフ24の内周面24aのうち、電極群40Eに対応する位置には、固形物22が配置されている。固形物22は、例えば、厚さ1~2mm程度の板状の樹脂(例えば、ポリプロピレン)で構成されている。本実施の形態では、センサ部40を測定部位(橈骨動脈91に対応する部位)に押圧する押圧部として、ベルト20、押圧カフ24、および固形物22を用いている。
センサ部40Aは、センサ部40と類似した配置態様および構成を有する。具体的には、センサ部40Aが配置された部位の内周面20aには、電極群40Fが配置される。電極群40Fは、ベルト20の幅方向Yに関して互いに離間した状態で配置された6個の板状(またはシート状)の電極41A~46Aを有する。電極群40Fが配置された部位は、装着状態において手首90の尺骨動脈91Aに対応する。
外周面21aにおける、電極群40Fに対応する位置には、固形物22Aが配置される。固形物22Aの外周側には、押圧カフ24Aが配置される。押圧カフ24Aは、圧迫カフ21の周方向に関して電極群40Fに対応する領域を局所的に抑圧する拡張部材である。押圧カフ24Aも、押圧カフ24と同様に、ベルト20を構成する帯状体23の内周面23aに配置される(図2参照)。
押圧カフ24Aは、ベルト20の厚さ方向に伸縮する流体袋であり、流体の供給により加圧状態となり、流体の排出により非加圧状態となる。押圧カフ24Aは、例えば、伸縮可能な2枚のポリウレタンシートを厚さ方向に対向させ、それらの周縁部を溶着して、流体袋として構成されている。
押圧カフ24Aの内周面24bのうち、電極群40Fに対応する位置には、固形物22Aが配置されている。固形物22Aは、例えば、厚さ1~2mm程度の板状の樹脂(例えば、ポリプロピレン)で構成されている。本実施の形態では、センサ部40Aを測定部位(尺骨動脈91Aに対応する部位)に押圧する押圧部として、ベルト20、押圧カフ24A、および固形物22Aを用いている。
図1に示すように、本体10の底面(測定部位に最も近い側の面)10bと、ベルト20の端部20fとは、三つ折れバックル15(以下、単に「バックル15」とも称する。)によって接続されている。
バックル15は、外周側に配置された板状部材25と、内周側に配置された板状部材26とを含む。板状部材25の一方の端部25eは、幅方向Yに沿って延びる連結棒27を介して本体10に対して回動自在に取り付けられる。板状部材25の他方の端部25fは、幅方向Yに沿って延びる連結棒28を介して、板状部材26の一方の端部26eに対して回動自在に取り付けられる。板状部材26の他方の端部26fは、固定部29によってベルト20の端部20f近傍に固定されている。
ベルト20の周方向に関して、固定部29の取り付け位置は、ユーザの手首90の周囲長に合わせて予め可変して設定されている。これにより、血圧計1(ベルト20)は、全体として略環状に構成されるとともに、本体10の底面10bとベルト20の端部20fとが、バックル15によって図1中の矢印B方向に開閉可能に構成される。
ユーザは、血圧計1を手首90に装着する際、バックル15を開いてベルト20の環の径を大きくした状態で、図1中の矢印Aで示す方向からベルト20に左手を通す。次に、図2に示すように、ユーザは、手首90の周りのベルト20の角度位置を摺動させる等して調節し、橈骨動脈91上に位置するようにセンサ部40を移動させる。これにより、センサ部40の電極群40Eは、手首90の掌側面90aのうち橈骨動脈91に対応する部分90a1に当接する状態となる。また、センサ部40Aの電極群40Fは、手首90の掌側面90aのうち尺骨動脈91Aに対応する部分に当接する状態となる。この状態で、ユーザは、バックル15を閉じて固定する。このようにして、ユーザは血圧計1(ベルト20)を手首90に巻き付け装着する。
図3は、実施の形態1に係る血圧計1が手首90に装着された状態における、インピーダンス測定用の電極群の平面レイアウトを示す図である。図3を参照して、装着状態においては、センサ部40の電極群40Eは、左の手首90の橈骨動脈91に対応して、手首の長手方向に沿って並んだ状態となる。電極群40Eは、幅方向Yに関して、両側に配置された通電用の電流電極対41,46と、当該電流電極対41,46の間に配置された検出電極対42,43および検出電極対44,45とを含む。第1脈波センサ40-1は検出電極対42,43を含み、第2脈波センサ40-2は検出電極対44,45を含む。
検出電極対42,43に対して、橈骨動脈91の血流のより下流側の部分に対応して、検出電極対44,45が配置されている。幅方向Yに関して、検出電極対42,43の中央と検出電極対44,45の中央との間の間隔D(後述する図6参照)は、例えば、20mmに設定される。間隔Dは、第1脈波センサ40-1と第2脈波センサ40-2との間隔に相当する。また、幅方向Yに関して、検出電極対42,43間の間隔、および検出電極対44,45の間隔は、例えば、いずれも2mmに設定される。
同様に、装着状態においては、センサ部40Aの電極群40Fは、左の手首90の尺骨動脈91Aに対応して、手首の長手方向に沿って並んだ状態となる。電極群40Fは、幅方向Yに関して、両側に配置された通電用の電流電極対41A,46Aと、当該電流電極対41A,46Aの間に配置された検出電極対42A,43Aおよび検出電極対44A,45Aを含む。第1脈波センサ40-1Aは検出電極対42A,43Aを含み、第2脈波センサ40-2Aは検出電極対44A,45Aを含む。
検出電極対42A,43Aに対して、尺骨動脈91Aの血流のより下流側の部分に対応して、検出電極対44A,45Aが配置されている。幅方向Yに関して、検出電極対42A,43Aの中央と検出電極対44A,45Aの中央との間の上記の間隔Dは、例えば、20mmに設定される。間隔Dは、第1脈波センサ40-1Aと第2脈波センサ40-2Aとの間隔に相当する。また、幅方向Yに関して、検出電極対42A,43A間の間隔、および検出電極対44A,45Aの間隔は、例えば、いずれも2mmに設定される。
このような電極群40Eおよび40Fは偏平に構成され得るため、血圧計1では、ベルト20を全体として薄厚に構成できる。また、電極群40Eおよび40Fは、柔軟に構成され得るため、電極群40Eおよび40Fは、圧迫カフ21による左の手首90の圧迫を妨げず、後述のオシロメトリック法による血圧測定の精度を損なわない。
図4は、実施の形態1に係る血圧計1の制御系のブロック構成を示す図である。血圧計1は、オシロメトリック法による血圧測定機能と、PTTに基づく血圧測定機能とを備える。図4の血圧計1では、流体として空気を用いる構成を例示する。
図4を参照して、本体10は、制御部として機能するCPU(Central Processing Unit)100と、ディスプレイ50と、記憶部として機能するメモリ51と、操作部52と、電池53と、通信部59とを含む。また、本体10は、圧力センサ31と、ポンプ32と、弁33と、圧力センサ34と、切替弁35とを含む。切替弁35は、ポンプ32および弁33の接続先を、圧迫カフ21または押圧カフ24,24Aに切り替える。
さらに、本体10は、圧力センサ31および圧力センサ34のそれぞれからの出力を周波数に変換する発振回路310および発振回路340と、ポンプ32を駆動するポンプ駆動回路320とを含む。センサ部40,40Aの構成は、図5で後述する。
ディスプレイ50は、例えば、有機EL(Electro Luminescence)ディスプレイで構成され、CPU100からの制御信号に従って情報を表示する。この情報は、測定結果を含む。なお、ディスプレイ50は、有機ELディスプレイに限られず、例えば、LCD(Liquid Cristal Display)など、他のタイプのディスプレイで構成されてもよい。
操作部52は、例えば、プッシュ式スイッチで構成され、ユーザによる血圧測定開始または停止の指示に応じた操作信号をCPU100に入力する。なお、操作部52は、プッシュ式スイッチに限られず、例えば、感圧式(抵抗式)または近接式(静電容量式)のタッチパネル式スイッチなどであってもよい。また、本体10がマイクロフォン(図示しない)を含んでおり、ユーザの音声によって血圧測定開始の指示を受け付けてもよい。
メモリ51は、血圧計1を制御するためのプログラムのデータ、血圧計1を制御するために用いられるデータ、血圧計1の各種機能を設定するための設定データ、血圧値の測定結果のデータなどを非一時的に記憶する。また、メモリ51は、プログラムが実行されるときのワークメモリなどとして用いられる。
CPU100は、メモリ51に記憶された血圧計1を制御するためのプログラムに従って、制御部として各種機能を実行する。例えば、オシロメトリック法による血圧測定を実行する場合は、CPU100は、操作部52からの血圧測定開始の指示に応じて、圧力センサ31からの信号に基づいて、ポンプ32(および弁33)を駆動する。また、CPU100は、圧力センサ31からの信号に基づいて、血圧値(最高血圧(収縮期血圧:Systolic Blood Pressure)と最低血圧(拡張期血圧:Diastolic Blood Pressure))を算出するとともに、脈拍数を算出する。
CPU100は、PTTに基づく血圧測定を実行する場合、操作部52からの血圧測定開始の指示に応じて、圧迫カフ21内の空気を排出させるために弁33を駆動する制御を行なう。また、CPU100は、切替弁35を駆動して、ポンプ32(および弁33)の接続先を押圧カフ24,24Aに切り替える制御を行なう。さらに、CPU100は、圧力センサ34からの信号に基づいて、血圧値を算出する制御を行なう。
通信部59は、CPU100によって制御されて、ネットワーク900を介して外部の情報処理装置と通信する。外部の情報処理装置は、後述する携帯型端末10Bおよびサーバ30を含み得るが、これら装置に限定されない。ネットワーク900を介した通信は、無線または有線を含み得る。例えば、ネットワーク900は、インターネットおよびLAN(Local Area Network)を含み得る。または、USBケーブルを用いた1対1の通信も含み得る。通信部59は、マイクロUSBコネクタを含み得る。
ポンプ32および弁33は、切替弁35、エア配管39a,39bを介して、圧迫カフ21および押圧カフ24,24Aに接続されている。圧力センサ31はエア配管38aを介して、圧力センサ34はエア配管38bを介して、それぞれ圧迫力フ21および押圧カフ24,24Aに接続されている。圧力センサ31は、エア配管38aを介して、圧迫カフ21内の圧力を検出する。切替弁35は、CPU100から与えられる制御信号に基づいて駆動し、ポンプ32および弁33の接続先を圧迫カフ21または押圧カフ24,24Aに切り替える。
ポンプ32は、例えば、圧電ポンプで構成される。切替弁35により、ポンプ32および弁33の接続先が圧迫カフ21に切り替えられている場合には、ポンプ32は、圧迫カフ21内の圧力(カフ圧)を加圧するために、エア配管39aを通して圧迫カフ21に加圧用の流体としての空気を供給する。切替弁35により、ポンプ32および弁33の接続先が押圧カフ24,24Aに切り替えられている場合には、ポンプ32は、押圧カフ24,24Aのカフ内の圧力(カフ圧)を加圧するために、エア配管39bを通して押圧カフ24,24Aに空気を供給する。
弁33は、ポンプ32に搭載され、ポンプ32のオン/オフに伴って開閉が制御される構成になっている。具体的には、切替弁35により、ポンプ32および弁33の接続先が圧迫カフ21に切り替えられている場合には、弁33は、ポンプ32がオンされると閉じて、圧迫カフ21内に空気を封入する一方、ポンプ32がオフされると開いて、圧迫カフ21の空気をエア配管39aを通して大気中へ排出させる。
切替弁35により、ポンプ32および弁33の接続先が押圧カフ24,24Aに切り替えられている場合には、弁33は、ポンプ32がオンされると閉じて、押圧カフ24,24A内に空気を封入する一方、ポンプ32がオフされると開いて、押圧カフ24,24Aの空気を、エア配管39bを通して大気中へ排出させる。弁33は、逆止弁の機能を有し、排出されるエアが逆流することはない。ポンプ駆動回路320は、ポンプ32をCPU100から与えられる制御信号に基づいて駆動する。
圧力センサ31は、例えば、ピエゾ抵抗式圧力センサであり、エア配管38aを介して、ポンプ32、弁33および圧迫カフ21に接続されている。圧力センサ31は、エア配管38aを介して、ベルト20(圧迫カフ21)の圧力、例えば、大気圧を基準(ゼロ)とした圧力を検出して時系列の信号として出力する。
発振回路310は、圧力センサ31からのピエゾ抵抗効果による電気抵抗の変化に基づく電気信号値に応じた周波数を有する周波数信号をCPU100に出力する。圧力センサ31の出力は、圧迫力フ21の圧力を制御するため、および、オシロメトリック法によって血圧値を算出するために用いられる。
圧力センサ34は、例えば、ピエゾ抵抗式圧力センサであり、エア配管38bを介して、ポンプ32、弁33および押圧カフ24,24Aに接続されている。圧力センサ34は、エア配管38bを介して、押圧カフ24,24Aの圧力、例えば、大気圧を基準(ゼロ)とした圧力を検出して時系列の信号として出力する。
発振回路340は、圧力センサ34からのピエゾ抵抗効果による電気抵抗の変化に基づく電気信号値に応じて発振し、圧力センサ34の電気信号値に応じた周波数を有する周波数信号をCPU100に出力する。圧力センサ34の出力は、押圧カフ24,24Aの圧力を制御するため、および、PTTに基づく血圧を算出するために用いられる。PTTに基づく血圧測定のために押圧カフ24,24Aの圧力を制御する場合には、CPU100は、ポンプ32および弁33を制御して、種々の条件に応じてカフ圧の加圧と減圧を行なう。
電池53は、本体10に搭載された各種要素に電力を供給する。電池53は、配線71を通して、センサ部40,40A部49へも電力を供給する。配線71は、信号用の配線72とともに、ベルト20の帯状体23と圧迫カフ21との間に挟まれた状態で、ベルト20の周方向に沿って本体10とセンサ部40,40Aとの間に延在して設けられている。
(センサ部の構成)
図5は、実施の形態1に係るセンサ部の構成を示す図である。図5(A)を参照して、センサ部40は、前述した電極群40Eの電極41~46、ならびに通電および電圧検出部49を備える。通電および電圧検出部49は、第1周波数を有した第1電流信号を電流電極41および46を介して対応の測定部位に出力する交流電源部492(第1出力部に相当)と、当該対応の測定部位から脈波を表す電圧信号を検出電極42~45を介して検出するための電圧検出部491(第1検出部に相当)を含む。
図5は、実施の形態1に係るセンサ部の構成を示す図である。図5(A)を参照して、センサ部40は、前述した電極群40Eの電極41~46、ならびに通電および電圧検出部49を備える。通電および電圧検出部49は、第1周波数を有した第1電流信号を電流電極41および46を介して対応の測定部位に出力する交流電源部492(第1出力部に相当)と、当該対応の測定部位から脈波を表す電圧信号を検出電極42~45を介して検出するための電圧検出部491(第1検出部に相当)を含む。
交流電源部492は、CPU100からの制御信号CT1に従い、電池53からの電圧を受けて第1周波数を有した電圧を電流電極41,46に印加する。これにより、測定部位に電流が供給される。電圧検出部491は、CPU100からの制御信号CT1に従い、検出電極42~45を介して測定部位からの電圧信号を検出する。電圧検出部491は、第1周波数に対応のフィルタ特性(カットオフ周波数など)を有したBPF(band-pass filter)を含むフィルタ部493、検出される電圧信号のS/N比(signal-noise ratio)を検出するS/N比検出部494、および電圧信号をディジタルデータに変換するA/D(analog-digital)変換部495を含む。電圧検出部491は、検出されるS/N比R1および変換後のディジタルデータを、CPU100に出力する。
図5(B)を参照して、センサ部40Aは、前述した電極群40Fの電極41A~46A、ならびに通電および電圧検出部49Aを備える。通電および電圧検出部49Aは、第2周波数を有した第2電流信号を電流電極41Aおよび46Aを介して対応の測定部位に出力する交流電源部492A(第2出力部に相当)と、当該対応の測定部位から脈波を表す電圧信号を検出電極42A~45Aを介して検出するための電圧検出部491A(第2検出部に相当)を含む。
交流電源部492Aは、CPU100からの制御信号CT2に従い、電池53からの電圧を受けて第2周波数を有した電圧を電流電極41A,46Aに印加する。これにより、測定部位に電流が供給される。電圧検出部491Aは、CPU100からの制御信号CT2に従い、検出電極42A~45Aを介して測定部位からの電圧信号を検出する。電圧検出部491Aは、第2周波数に対応のフィルタ特性(カットオフ周波数)を有したBPFを含むフィルタ部493A、検出される電圧信号のS/N比(signal-noise ratio)を検出するS/N比検出部494A、および電圧信号をディジタルデータに変換するA/D変換部495Aを含む。電圧検出部491Aは、検出されるS/N比R2および変換後のディジタルデータを、CPU100に出力する。
なお、交流電源部492,492Aは、電池53からの電圧を受けて第1周波数,第2周波数の電圧信信号を生成するための、昇圧回路および電圧調整回路を含んで構成されてもよい。
(脈波伝播時間に基づく血圧測定の概要)
図6は、実施の形態1に係る脈波伝播時間に基づく血圧測定を説明するための模式図である。具体的には、図6(A)は、血圧計1が手首90に装着された状態における、脈波伝播時間に基づく血圧測定を行う際の手首の長手方向に沿った模式断面を示す。図6(B)は、脈波信号PS1,PS2の波形を示す。なお、図6では、センサ部40は測定部位の橈骨動脈91の上に位置した状態を示すが、センサ部40Aが測定部位の尺骨動脈91Aの上に位置した状態であっても、図6と同様の説明が可能である。したがって、ここでは、センサ部40Aによる、脈波伝播時間に基づく血圧測定の説明は簡単に行う。
図6は、実施の形態1に係る脈波伝播時間に基づく血圧測定を説明するための模式図である。具体的には、図6(A)は、血圧計1が手首90に装着された状態における、脈波伝播時間に基づく血圧測定を行う際の手首の長手方向に沿った模式断面を示す。図6(B)は、脈波信号PS1,PS2の波形を示す。なお、図6では、センサ部40は測定部位の橈骨動脈91の上に位置した状態を示すが、センサ部40Aが測定部位の尺骨動脈91Aの上に位置した状態であっても、図6と同様の説明が可能である。したがって、ここでは、センサ部40Aによる、脈波伝播時間に基づく血圧測定の説明は簡単に行う。
図6(A)を参照して、交流電源部492部は、所定電圧を電流電極対41,46間に印加することにより、測定部位に第1周波数を有した例えば電流値1mAの高周波定電流iを流す。
また、電圧検出部491は、第1脈波センサ40-1を構成する検出電極対42,43間の電圧信号v1と、第2脈波センサ40-2を構成する検出電極対44,45間の電圧信号v2とを検出する。電圧信号v1,v2は、左の手首90の掌側面90aのうち、それぞれ第1脈波センサ40-1、第2脈波センサ40-2が対向する部分における、橈骨動脈91の血流の脈波による電気インピーダンスの変化を表す。
具体的には、電圧検出部491では、電圧信号v1,v2はフィルタ部493により第1周波数に対応する信号成分を除く成分が除去される。S/N比検出部494は、フィルタ通過後の電圧信号のS/N比を検出する。A/D変換部495は、フィルタ部493を通過後の電圧信号v1,v2をアナログデータからディジタルデータに変換して、配線72を介してCPU100へ出力する。
CPU100は、入力された電圧信号v1,v2(ディジタルデータ)に対して、所定の信号処理を施して、図6(B)中に示すような山状の波形を有する脈波信号PS1,PS2を生成する。
なお、電圧信号v1,v2は、例えば、1mv程度である。また、脈波信号PS1,PS2のそれぞれのピークA1,A2は、例えば、約1Vである。橈骨動脈91の血流の脈波伝搬速度(Pulse Wave Velocity ; PWV)が1000cm/s~2000cm/sの範囲であるとすると、第1脈波センサ40-1と第2脈波センサ40-2との間の間隔D=20mmであることから、脈波信号PS1および脈波信号PS2間の時間差Δtは、1.0ms~2.0msの範囲となる。
センサ部40Aも尺骨動脈91Aの測定部位に対し、センサ部40Aの交流電源部492Aは、所定電圧を電流電極対41,46間に印加することにより、測定部位に第2周波数を有した例えば電流値1mAの高周波定電流iを流す。
また、電圧検出部491Aは、第1脈波センサ40-1Aを構成する検出電極対42A,43A間の電圧信号v1Aと、第2脈波センサ40-2Aを構成する検出電極対44A,45A間の電圧信号v2Aとを検出する。電圧信号v1A,v2Aは、左の手首90の掌側面90aのうち、それぞれ第1脈波センサ40-1A、第2脈波センサ40-2Aが対向する部分における、尺骨動脈91Aの血流の脈波による電気インピーダンスの変化を表す。
電圧検出部49Aでは、電圧信号v1A,v2Aはフィルタ部493Aにより第2周波数に対応する信号成分を除く成分が除去される。S/N比検出部494Aは、フィルタ通過後の電圧信号のS/N比を検出する。A/D変換部495Aは、フィルタ部493Aを通過後の電圧信号v1,v2をアナログデータからディジタルデータに変換して、配線72を介してCPU100へ出力する。なお、A/D変換部495およびA/D変換部495Aは、サンプリングレートとして例えば300Hzを有するが、このレートに限定されず、PTT算出の精度を維持するのに必要なサンプリングレートであればよい。
CPU100は、入力された電圧信号v1A,v2A(ディジタルデータ)に対して、所定の信号処理を施して、脈波信号PS1A,PS2Aを生成する。脈波信号PS1A,PS2AのそれぞれのピークA1,A2の間の間隔Dと時間差Δtを、上述と同様に検出する。
図6(A)に示すように、押圧カフ24は加圧状態となっており、圧迫カフ21は内部の空気が排出されて非加圧状態になっている。押圧カフ24および固形物22は、橈骨動脈91の動脈方向に関して、第1脈波センサ40-1、第2脈波センサ40-2、および電流電極対41,46に跨って配置されている。そのため、押圧カフ24は、ポンプ32により加圧されると、第1脈波センサ40-1、第2脈波センサ40-2、および電流電極対41,46を固形物22を介して、手首90の掌側面90aに押圧する。
手首90の掌側面90aに対する、電流電極対41,46、第1脈波センサ40-1、および第2脈波センサ40-2のそれぞれの押圧力は、適宜の値に設定することができる。本実施の形態では、押圧部として流体袋の押圧カフ24を用いているため、ポンプ32および弁33を圧迫カフ21と共通に使用することができ、構成の簡略化を図ることができる。また、固形物22を介して第1脈波センサ40-1、第2脈波センサ40-2、および電流電極対41,46を押圧できるため、測定部位に対する押圧力が均一になり、精度よく脈波伝播時間に基づく血圧測定を行なうことができる。このような特徴は、センサ部40Aで測定する場合であっても、同様に得ることができる。
(CPU100の機能構成)
図8は、実施の形態1に係るCPU100が備える測定に関する機能の構成を模式的に示す図である。図8を参照して、CPU100は、血圧を算出(推定)するための血圧算出部110、ディスプレイ50を制御する表示制御部120、メモリ51へのデータの書込み、またはメモリ51からのデータの読出しを制御するメモリ制御部130および通信部59を制御する通信制御部140を備える。
図8は、実施の形態1に係るCPU100が備える測定に関する機能の構成を模式的に示す図である。図8を参照して、CPU100は、血圧を算出(推定)するための血圧算出部110、ディスプレイ50を制御する表示制御部120、メモリ51へのデータの書込み、またはメモリ51からのデータの読出しを制御するメモリ制御部130および通信部59を制御する通信制御部140を備える。
血圧算出部110は、PTTに基づく血圧測定機能に相当するPTT血圧算出部111、および図7に示すオシロメトリック法に従う血圧測定機能に相当するオシロメトリック血圧算出部114を備える。PTT血圧算出部111は、PTT検出部112および平均血圧算出部113を含む。各部の機能の詳細は後述する。
(PTTに基づく血圧測定動作)
PTT血圧算出部111によるPTTに基づく血圧測定機能を説明する。まず、ユーザが操作部52を介してPTTに基づく血圧測定を指示すると、CPU100は、PTT血圧算出部111を起動する。また、CPU100は、ユーザの指示に従い切替弁35を駆動して、ポンプ32および弁33の接続先を押圧カフ24,24Aに切替える。その後、CPU100は弁33を閉じてポンプ駆動回路320を介してポンプ32を駆動し、押圧カフ24,24Aに空気を送り、押圧カフ24,24A内の圧力であるカフ圧Pcを一定速度で高くする。
PTT血圧算出部111によるPTTに基づく血圧測定機能を説明する。まず、ユーザが操作部52を介してPTTに基づく血圧測定を指示すると、CPU100は、PTT血圧算出部111を起動する。また、CPU100は、ユーザの指示に従い切替弁35を駆動して、ポンプ32および弁33の接続先を押圧カフ24,24Aに切替える。その後、CPU100は弁33を閉じてポンプ駆動回路320を介してポンプ32を駆動し、押圧カフ24,24Aに空気を送り、押圧カフ24,24A内の圧力であるカフ圧Pcを一定速度で高くする。
この加圧過程で、CPU100のPTT検出部112は、センサ部40の第1の第1脈波センサ40-1および第2の第2脈波センサ40-2のそれぞれが時系列に出力する第1および第2脈波信号PS1およびPS2を取得し、第1および第2脈波信号PS1およびPS2の波形間の相互相関係数rをリアルタイムに算出する。CPU100は、加圧過程にリアルタイムに算出される相互相関係数rが閾値Th(例えばTh=0.99)を超えると判断すると、その時点のカフ圧Pcにおいて検出される第1および第2脈波信号PS1およびPS2について、第1および第2脈波信号PS1およびPS2の振幅のピークA1およびA2の時間差ΔtをPTT(脈波伝搬時間)として算出する。
同様に、この加圧過程で、CPU100のPTT検出部112は、センサ部40Aの第1脈波センサ40-1Aおよび第2脈波センサ40-2Aから第1および第2脈波信号PS1AおよびPS2Aを取得し、両脈波信号の波形間の相互相関係数rを算出する。CPU100は、加圧過程においてリアルタイムに算出される相互相関係数rが上記の閾値Thを超えると判断すると、その時点のカフ圧Pcにおいて検出される第1および第2脈波信号PS1AおよびPS2Aについて、第1および第2脈波信号PS1AおよびPS2Aの振幅のピークの時間差ΔtをPTT(脈波伝搬時間)として算出する。
また、CPU100のPTT血圧算出部111は、公知の式(EBP=(α/(DT2)+β)に従い、センサ部40,40Aの出力に従うPTTに基づく血圧EBPをそれぞれ算出(推定)する。この式中のαとβは所定の係数であり、DTは脈波伝搬時間を示す。これにより、橈骨動脈91のPTTに基づく血圧EBP(以下、血圧EBP-1ともいう)と、尺骨動脈91AのPTTに基づく血圧EBP(以下、EBP-2ともいう)が測定される。平均血圧算出部113は、血圧EBP-1および血圧EBP-2の平均を算出する。
CPU100は、操作部52を介して測定開始が指示された後は停止の指示がなされない間は、PTTの算出と血圧EBPの算出を繰返し実施する。CPU100は、操作部52を介して測定停止の指示を入力すると、測定動作を終了するように各部を制御する。
(オシロメトリック法による血圧測定の概要)
オシロメトリック血圧算出部114によるオシロメトリック法に従う血圧測定機能を説明する。まず、ユーザが操作部52を介してオシロメトリックに従う血圧測定を指示すると、CPU100は、オシロメトリック血圧算出部114を起動する。図7は、実施の形態1に係るオシロメトリック法による血圧測定を行なう場合において、血圧計1が手首90に装着された状態での、手首の長手方向に沿った模式断面図である。
オシロメトリック血圧算出部114によるオシロメトリック法に従う血圧測定機能を説明する。まず、ユーザが操作部52を介してオシロメトリックに従う血圧測定を指示すると、CPU100は、オシロメトリック血圧算出部114を起動する。図7は、実施の形態1に係るオシロメトリック法による血圧測定を行なう場合において、血圧計1が手首90に装着された状態での、手首の長手方向に沿った模式断面図である。
図7を参照して、押圧カフ24は、内部の空気が排出されて非加圧状態となっており、圧迫カフ21は空気が供給された加圧状態になっている。圧迫カフ21は、手首90の周方向に延在しており、ポンプ32により加圧されると、左の手首90の周方向を一様に圧迫する。圧迫カフ21の内周面と左の手首90との間には、電極群40Eしか存在していないので、圧迫カフ21による圧迫が他の部材により阻害されることがなく、血管を充分に閉じることができる。
オシロメトリック法による血圧測定では、オシロメトリック血圧算出部114は、測定部位に対する圧迫カフ21の加圧過程または減圧過程で検出される発振回路310を介した第1圧力センサ31からの出力波形に従い、血圧を算出(推定)する。本実施の形態に係るオシロメトリック法による血圧の算出方法は、公知の方法に従うので、ここでは説明を繰返さない。
表示制御部120は、血圧算出部110により算出された血圧を含む各種の情報に基づく表示データを生成し、生成した表示データに従いディスプレイ50を駆動する。これにより、ディスプレイ50は、測定された血圧を含む情報を表示する。また、メモリ制御部130は、血圧算出部110により算出された血圧を含む各種の情報をメモリ51に格納する。これにより、メモリ51に、測定された血圧を含む情報の履歴を保存しておくことができる。メモリ制御部130は、メモリ51から、血圧算出部110により算出された血圧を含む各種の情報を読出す。通信制御部140は、血圧算出部110により算出された、またはメモリ51から読出された血圧を含む各種の情報を、通信部59を介して、外部の情報処理装置に送信し、当該情報処理装置に表示させる。
図8の各部の機能は、メモリ51にプログラムとして格納される。CPU100は、メモリ51からプログラムを読出し実行することにより、各部の機能が実現される。なお、各部の機能はプログラムで実現する方法に限定されない。例えば、ASIC(application specific integrated circuit:特定用途向け集積回路)またはFPGA(field-programmable gate array)を含む回路により実現されてもよい。さらには、プログラムと回路の組合せにより実現されてもよい。
(処理フローチャート)
図9は、実施の形態1に係るPTTに基づく血圧測定の処理を示すフローチャートである。このフローチャートに従うプログラムは、メモリ51に格納されて、CPU100により読出されて、実行される。
図9は、実施の形態1に係るPTTに基づく血圧測定の処理を示すフローチャートである。このフローチャートに従うプログラムは、メモリ51に格納されて、CPU100により読出されて、実行される。
図9を参照して、まず、CPU100は、装着状態において、操作部52でユーザがPTTの血圧測定開始のスイッチ操作をしたとき、開始指示を受付ける(ステップS10)。CPU100は、血圧測定を開始する際に、ポンプ32および弁33の接続先を押圧カフ24,24Aに切り替えるよう、切替弁35を制御する(ステップS12)。これにより、カフ24,24Aから空気を排気する。
CPU100は、ポンプ32を駆動して、押圧カフ24,24Aを所定圧力まで加圧した後に弁33を閉じて(ステップS14)、その後、ポンプ32を停止する(ステップSS16)。CPU100は、測定部位に、電流信号を出力して、脈波を示す電圧信号を検出するよう、制御信号CT1とCT2を、センサ部40,40Aにそれぞれ出力する(ステップS18)。
センサ部40は、橈骨動脈91の測定部位から検出された電圧信号(脈波信号)のディジタルデータを出力するとともに、電圧信号のうち第1周波数の成分のS/N比R1を検出し、CPU100に出力する(ステップS22)。同様に、センサ部40Aは、尺骨動脈91Aの測定部位から検出された電圧信号(脈波信号)のディジタルデータを出力するとともに、電圧信号のうち第2周波数の成分のS/N比R2を検出し、CPU100に出力する(ステップS22)。
PTT検出部112は、センサ部40,40Aからの脈波信号のそれぞれに従い、PTTを算出する(ステップS24)。PTT血圧算出部111は、センサ部40に対応のPTTに基づく血圧EBP-1を算出し、また、センサ部40Aに対応のPTTに基づく血圧EBP-2を算出する(ステップS26)。
CPU100は、算出された血圧EBP-1,EBP-2に基づく血圧の情報を出力する(ステップS28)。例えば、表示制御部120は、当該血圧の情報を表示するようディスプレイ50を制御する。または、メモリ制御部130は、当該血圧の情報をメモリ51に格納する。または、通信制御部140は、当該血圧の情報を、通信部59を介して外部の情報処理装置に送信する。
(測定結果の格納例)
図10は、実施の形態1に係る測定結果の格納例を示す図である。図10を参照して、メモリ51は血圧計1の測定結果を記録するテーブル394を格納する。図10を参照して、テーブル394は、測定結果のデータをレコード単位で格納する。各レコードは、当該レコードを一意に識別するためのID(identification)のデータ39E、測定日時のデータ39G、オシロメトリック血圧算出部114により算出(推定)された血圧値(収縮期血圧SBPと拡張期血圧DBP)および脈拍数PLSを含むデータ39H、S/N比データ39I、およびPTT血圧算出部111により算出(推定)された血圧を示すデータ39Jを関連付けて含む。
図10は、実施の形態1に係る測定結果の格納例を示す図である。図10を参照して、メモリ51は血圧計1の測定結果を記録するテーブル394を格納する。図10を参照して、テーブル394は、測定結果のデータをレコード単位で格納する。各レコードは、当該レコードを一意に識別するためのID(identification)のデータ39E、測定日時のデータ39G、オシロメトリック血圧算出部114により算出(推定)された血圧値(収縮期血圧SBPと拡張期血圧DBP)および脈拍数PLSを含むデータ39H、S/N比データ39I、およびPTT血圧算出部111により算出(推定)された血圧を示すデータ39Jを関連付けて含む。
S/N比データ39Iは、関連付けられた血圧EBP-1について検出されたS/N比R1、および関連付けられた血圧EBP-2について検出されたS/N比R2を含む。
データ39Jは、PTT血圧の測定時に算出(推定)された血圧EBP-1および血圧EBP-2を含む。データ39Jは、さらに代表血圧EBP-Rを含むとしてもよい。代表血圧EBP-Rは、対応の血圧EBP-1および血圧EBP-2を代表する血圧を示す。
メモリ制御部130は、測定日時のデータ39Gに関連付けて、当該日時に測定されたオシロメトリック法に従う血圧および脈拍数のデータ39H、およびPTTに基づく血圧値のデータ39Jを、メモリ51のテーブル394に格納する。
テーブル394における測定データの記憶の態様は、図10に示すようなレコード単位には限定されない。血圧が測定される毎に、検出されたデータ39E~39Jが関連付け(紐付け)される態様であればよい。
(代表血圧EBP-Rの決定方法)
実施の形態1では、代表血圧EBP-Rは、平均血圧算出部113が、対応の血圧EBP-1および血圧EBP-2から算出した平均の血圧を示すが、代表血圧EBP-Rは、平均血圧に限定されない。
実施の形態1では、代表血圧EBP-Rは、平均血圧算出部113が、対応の血圧EBP-1および血圧EBP-2から算出した平均の血圧を示すが、代表血圧EBP-Rは、平均血圧に限定されない。
例えば、CPU100は、血圧EBP-1および血圧EBP-2のうちの予め定められた条件を満たす方を、代表血圧EBP-Rと決定してもよい。予め定められた条件としては、例えば、血圧EBP-1および血圧EBP-2のうちの値が大きい方(または小さい方)を代表血圧EBP-Rと決定する。または、血圧EBP-1および血圧EBP-2のうちの閾値を超える方(または閾値以下の方)を代表血圧EBP-Rと決定する。または、血圧EBP-1および血圧EBP-2のうち対応するS/N比の高い方(ノイズが少ない方)を代表血圧EBP-Rと決定する。または、血圧EBP-1および血圧EBP-2のうち対応するS/N比が予め定められた閾値よりも大きい方(高い方)を代表血圧EBP-Rと決定する。
また、平均血圧算出部113は、血圧EBP-1および血圧EBP-2のそれぞれに重み付けて平均を算出する重み付き平均算出の機能を有する。具体的には、血圧EBP-1の重みは対応のS/N比R1の値に基づき、血圧EBP-2の重みは対応のS/N比R2に基づいている。平均血圧算出部113は、対応するS/N比が高いほど(すなわち、ノイズが少ないほど)重みが大きくなるように設定する。したがって、重み付き平均による算出される代表血圧EBP-Rは、血圧EBP-1および血圧EBP-2のうちよりS/N比が高い方の血圧に近い値を表すことが可能となる。
(表示例)
図11は、実施の形態1に係る測定結果の表示例を示す図である。図11を参照して、ディスプレイ50の画面には、オシロメトリック法に基づく収縮期血圧SBP、拡張期血圧DBPおよび脈拍数PLS、代表血圧EBP-R、信頼度40Bおよび測定日付を含む。代表血圧EBP-Rが基く血圧EBP-1および血圧EBP-2に対応のS/N比の値に基づいている。信頼度40Bは、表示されている代表血圧EBP-Rの値の信頼度(または信憑性)を含む。
図11は、実施の形態1に係る測定結果の表示例を示す図である。図11を参照して、ディスプレイ50の画面には、オシロメトリック法に基づく収縮期血圧SBP、拡張期血圧DBPおよび脈拍数PLS、代表血圧EBP-R、信頼度40Bおよび測定日付を含む。代表血圧EBP-Rが基く血圧EBP-1および血圧EBP-2に対応のS/N比の値に基づいている。信頼度40Bは、表示されている代表血圧EBP-Rの値の信頼度(または信憑性)を含む。
実施の形態1では、信頼度40Bは、同一画面で表示中の代表血圧EBP-Rが基づく血圧EBP-1,血圧EBP-2に対応のS/N比R1,S/N比R2に基づくことができる。例えば、CPU100は、このS/N比R1およびS/N比R2が閾値を超えて大きい(高い)値であると判断したときは、信頼度は高いと決定し、信頼度40Bを「GOOD」の文字で表示する(図11参照)。これに対し、CPU100は、このS/N比R1およびS/N比R2のうち少なくとも一方が当該閾値以下の値であると判断したときは、信頼度は低いと決定し、「NG」の文字で信頼度40Bを表示する。
なお、信頼度の出力態様は、このような文字に限定されない。例えば、画像(絵柄)の表示、代表血圧EBP-Rの値の色などであってもよい。
図11の画面によれば、ユーザは、信頼度40Bから、表示される血圧EBP-Rが信頼できる値であるかに関する目安を得ることもできる。
図11の表示例は、例えば、血圧測定が終了するとき(ステップS28)の表示例、または図10のテーブル394から読出されたデータの表示例に相当する。図11の情報は、表示制御部120がディスプレイ50を制御することにより表示される。具体的には、表示制御部120は、PTT血圧算出部111により算出された血圧EBP-1とEBP-2に基づく代表血圧EBP-R、オシロメトリック血圧算出部114により算出された血圧の値、信頼度40Bに基づく表示データを生成し、表示データに基づき、ディスプレイ50を駆動する。または、表示制御部120が、図10のテーブル394の関連付けられたデータ39Hおよびデータ39Jならびに信頼度40Bに基づき表示データを生成し、生成した表示データに基づき、ディスプレイ50を駆動する。これにより、表示制御部120は、測定された血圧のデータまたはテーブル394に格納された血圧のデータをディスプレイ50に表示することができる。
(システムの構成)
図12は、実施の形態1に係るシステムの概略的な構成を示す図である。上記の血圧計1は、外部の情報処理装置であるサーバ30または携帯型端末10Bと、ネットワーク900を介し通信する。図12のシステムでは、血圧計1はLANを介して携帯型端末10Bと通信し、携帯型端末10Bはインターネットを介してサーバ30と通信する。これにより、血圧計1は携帯型端末10Bを経由してサーバ30と通信することができる。なお、血圧計1は、携帯型端末10Bを経由せずに、サーバ30と通信してもよい。
図12は、実施の形態1に係るシステムの概略的な構成を示す図である。上記の血圧計1は、外部の情報処理装置であるサーバ30または携帯型端末10Bと、ネットワーク900を介し通信する。図12のシステムでは、血圧計1はLANを介して携帯型端末10Bと通信し、携帯型端末10Bはインターネットを介してサーバ30と通信する。これにより、血圧計1は携帯型端末10Bを経由してサーバ30と通信することができる。なお、血圧計1は、携帯型端末10Bを経由せずに、サーバ30と通信してもよい。
上記の実施の形態1では、図11の情報は血圧計1のディスプレイ50に表示されたが、CPU100は当該情報を携帯型端末10Bに送信し、表示部158に表示させるようにしてもよい。
また、図10のテーブル394に示す測定結果の格納先は、血圧計1のメモリ51に限定されない。例えば、携帯型端末10Bの記憶部、またはサーバ30の記憶部32Aであってもよい。または、メモリ51、携帯型端末10Bの記憶部、およびサーバ30の記憶部32Aの2つ以上に格納されてもよい。
(実施の形態1の利点)
図13は、実施の形態1の背景を説明するための図である。図14は、実施の形態1の構成を示す図である。まず、脈波信号の測定部位として複数の部位が有る場合、インピーダンスによりPTTを算出する際は、個人差により、または血圧計1の装着態様により、S/N比が高い電圧信号(脈波信号)を検出できる部位はバラツキがあるため、複数の測定部位のうち、S/N比が高い電圧信号(脈波信号)を検出できる部位を判定し、判定された方の部位から脈波信号を検出することが望ましい。
図13は、実施の形態1の背景を説明するための図である。図14は、実施の形態1の構成を示す図である。まず、脈波信号の測定部位として複数の部位が有る場合、インピーダンスによりPTTを算出する際は、個人差により、または血圧計1の装着態様により、S/N比が高い電圧信号(脈波信号)を検出できる部位はバラツキがあるため、複数の測定部位のうち、S/N比が高い電圧信号(脈波信号)を検出できる部位を判定し、判定された方の部位から脈波信号を検出することが望ましい。
このような背景のもと、橈骨動脈91と尺骨動脈91Aの両方の測定部位に電流を同時に流した場合、図13(C)に示すように、互いに干渉し、電位分布が本来得られるものと異なる可能性がある。
この点に関し、実施の形態1では、図14に示すように、橈骨動脈91と尺骨動脈91Aの両方を測定部位として電極を配置し、各測定部位に対して異なる周波数(第1周波数または第2周波数)の電流を出力し、各測定部位から検出される脈波を表す電圧信号を、対応する周波数に対応のフィルタ特性に基づき処理する。
これにより、上記の干渉が発生するとしても、干渉による信号成分が排除された脈波信号を抽出することができる。
さらに、実施の形態1では、上記に述べたS/N比のより高い方の脈波信号を選択することで、高い精度の脈波情報および代表血圧EBP-Rを取得することができる。
(第1周波数と第2周波数)
実施の形態1では、第1周波数は、第2周波数とは異なる値を示す。例えば、第1周波数は50kHzおよび60kHzのうちの一方であり、第2周波数はその他方である。なお、第1周波数および第2周波数の値は、これらに限定されない。
実施の形態1では、第1周波数は、第2周波数とは異なる値を示す。例えば、第1周波数は50kHzおよび60kHzのうちの一方であり、第2周波数はその他方である。なお、第1周波数および第2周波数の値は、これらに限定されない。
[実施の形態2]
実施の形態2では、実施の形態1と異なり、第1脈波センサ部に相当するセンサ部40と第2脈波センサ部に相当するセンサ部40Aは、同時に駆動されるのではなく、予め定められた間隔で交互に駆動される。
実施の形態2では、実施の形態1と異なり、第1脈波センサ部に相当するセンサ部40と第2脈波センサ部に相当するセンサ部40Aは、同時に駆動されるのではなく、予め定められた間隔で交互に駆動される。
実施の形態2に係る血圧計1は、実施の形態1のCPU100とは異なる機能を実現するCPU100Aを備える。実施の形態2に係る血圧計1の構成は、図1に示された構成と同様であるので、説明は繰返さない。
図15は、実施の形態2に係るCPU100Aが備える測定に関する機能の構成を模式的に示す図である。図15を参照して、CPU100Aは、図8に示したCPU100の構成に追加して、切替部150を備える。CPU100Aの他の機能は、図8に示すものと同様であるから、説明は繰返さない。
切替部150は、センサ部40に制御信号CT1を出力し、またセンサ部40Aに制御信号CT2を出力する。切替部150は、予め定められた周期(間隔)CRで、交互に制御信号CT1と制御信号CT2を出力する。センサ部40は、切替部150から制御信号CT1が出力される期間は駆動されて、制御信号CT1が出力されない期間は停止する。同様に、センサ部40Aは、切替部150から制御信号CT2が出力される期間は駆動されて、制御信号CT2が出力されない期間は停止する。センサ部40とセンサ部40Aは、それぞれ、駆動される期間は、実施の形態1と同様に動作する。
実施の形態2では、センサ部40の交流電源部492により測定部位(橈骨動脈91に対応の部位)に出力する第1電流信号が有する第1周波数と、センサ部40Aの交流電源部492Aにより測定部位(橈骨動脈91に対応の部位)に出力する第2電流信号が有する第2周波数とは、同じ周波数であって、例えば50kHzを示すが、これに限定されない。したがって、フィルタ部493およびフィルタ部493Aも、50kHzに応じた周波数特性(カットオフ周波数)を有する。
実施の形態2では、測定部位に出力される電流の周波数は50kHz、PTT算出のためのサンプリングレートは、例えば300Hzとした場合に、出力される電流の周波数は十分に大きいために、上記の周期CRを数百~数kHzに対応した周期に決定する。この周期は、測定部位に出力される電流の周波数とサンプリングレートに基づき決定することが望ましい。
図16は、実施の形態2に係る周期CRを模式的に示す図である。切替部150は、図16に示すように、周期CRに従い、交互に制御信号CT1と制御信号CT2を出力する。これにより、半周期CR1毎に、センサ部40とセンサ部40Aが交互に駆動される。図17は、実施の形態2に係る測定部位に出力される電流信号の波形を模式的に示す図である。センサ部40またはセンサ部40Aから図17(A)に示す50kHzの電流信号が、対応の測定部位に出力される場合に、切替部150が25kHzに従う周期CRで交互に制御信号CT1と制御信号CT2を出力する。このとき、センサ部40から橈骨動脈91に対応する測定部位に出力される電流信号と、センサ部40Aから尺骨動脈91Aに対応する測定部位に出力される電流信号の波形(図17(B))は、図17(A)の波形と類似する。
実施の形態2においても、図9に示したフローチャートに従い、PTTに基づく血圧測定の処理が実施される。
(実施の形態2の利点)
上記に述べたように、インピーダンスによりPTTを算出する際は、個人差または血圧計1の装着態様により、S/N比が高い電圧信号(脈波信号)を検出できる部位はバラツクため、複数の測定部位のうち、S/N比が高い電圧信号(脈波信号)を検出できる部位を判定し、判定された方の部位から脈波信号を検出することが望ましい。
上記に述べたように、インピーダンスによりPTTを算出する際は、個人差または血圧計1の装着態様により、S/N比が高い電圧信号(脈波信号)を検出できる部位はバラツクため、複数の測定部位のうち、S/N比が高い電圧信号(脈波信号)を検出できる部位を判定し、判定された方の部位から脈波信号を検出することが望ましい。
このような背景のもと、橈骨動脈91と尺骨動脈91Aの両方の測定部位に電流を同時に流すとすれば、図13(C)に示すように、互いに干渉し、電位分布が本来得られるものと異なる可能性がある。
この点に関し、実施の形態2では、切替部150は、図16に示すように、橈骨動脈91と尺骨動脈91Aに対応する各測定部位に対して、予め定められた間隔(周期CRに従う間隔)で、同じ周波数の電流信号を交互に出力し、且つ各測定部位から検出される脈波を表す電圧信号からPTTを含む脈波の情報を取得する。これにより、各測定部位に電流信号が出力されるときは、図13(A)または図13(B)に示すように、他方の測定部位に電流信号は出力されないため、図13(C)に示す干渉の発生を防止することができる。
さらに、実施の形態2でも、実施の形態1と同様に、S/N比のより高い方の脈波信号を選択することで、高い精度の脈波情報および代表血圧EBP-Rを取得することもできる。また、実施の形態2でも、実施の形態1と同様に、測定結果のディスプレイ50への表示、メモリ51への格納、および外部の情報処理装置への送信も実施される。
実施の形態2では、第1周波数および第2周波数は同じ周波数としているが、異なっていてもよい。例えば、実施の形態1と同様に、第1周波数は50kHzおよび60kHzのうちの一方であり、第2周波数はその他方である。
[実施の形態3]
実施の形態3では、血圧計1の動作モードを説明する。血圧計1は、脈波の情報を測定するモードとして、選択的に起動される第1モードと第2モードとを備える。第1モードでは、センサ部40は、第1周波数を有する第1電流信号を橈骨動脈91に対応の測定部位に出力し、当該測定部位から検出する脈波信号を表す電圧信号を第1周波数に対応のフィルタ特性に基づき処理する。また、センサ部40Aは、センサ部40が第1電流信号を出力する際に、第2周波数を有する第2電流信号を尺骨動脈91Aに対応の測定部位に出力し、当該測定部位から検出する脈波信号を表す電圧信号を第2周波数に対応のフィルタ特性に基づき処理する。第1モードでは、切替部150は、停止する。
実施の形態3では、血圧計1の動作モードを説明する。血圧計1は、脈波の情報を測定するモードとして、選択的に起動される第1モードと第2モードとを備える。第1モードでは、センサ部40は、第1周波数を有する第1電流信号を橈骨動脈91に対応の測定部位に出力し、当該測定部位から検出する脈波信号を表す電圧信号を第1周波数に対応のフィルタ特性に基づき処理する。また、センサ部40Aは、センサ部40が第1電流信号を出力する際に、第2周波数を有する第2電流信号を尺骨動脈91Aに対応の測定部位に出力し、当該測定部位から検出する脈波信号を表す電圧信号を第2周波数に対応のフィルタ特性に基づき処理する。第1モードでは、切替部150は、停止する。
第2モードでは、第1脈波センサ部と第2脈波センサ部を、切替部150により、予め定められた間隔で交互に駆動する。
第1モードおよび第2モードにいずれにおいても、血圧計1は上記に述べた干渉による影響がないPTTを含む脈波の情報を取得することができる。
ユーザは、操作部52を操作することにより、CPU100に対して、モード1およびモード2にいずれを起動するかを指示することができる。
[実施の形態4]
上述した実施の形態において、コンピュータを機能させて、図9のフローチャートで説明したような処理を実行させるプログラムを提供することができる。
上述した実施の形態において、コンピュータを機能させて、図9のフローチャートで説明したような処理を実行させるプログラムを提供することができる。
図18は、実施の形態4に係る血圧計1の制御方法を示すフローチャートである。図19は、実施の形態4に係る血圧計1の他の制御方法を示すフローチャートである。図9のステップS18では、実施の形態1の場合は、図18のフローチャートに従う処理が実行されて、実施の形態2に場合は、図19のフローチャートに従う処理が実行される。
図18を参照して、CPU100は、ステップS18において、センサ部40,40Aを次のように制御する。まず、第1脈波センサ部(センサ部40)の交流電源部492を、第1周波数を有する第1電流信号を対応の測定部位(橈骨動脈91に対応の測定部位)に出力するよう制御する第1出力ステップ(ステップS31)と、第1脈波センサ部の電圧検出部491を、当該第1脈波センサ部に対応の測定部位(橈骨動脈91に対応の測定部位)から脈波を表す電圧信号を検出するよう制御する第1検出ステップ(ステップS32)と、第2脈波センサ部(センサ部40A)の交流電源部492Aを、第2周波数を有する第2電流信号を対応の測定部位(尺骨動脈91Aに対応の測定部位)に出力するよう制御する第2出力ステップ(ステップS33)と、第2脈波センサ部の電圧検出部491Aを、当該第2脈波センサ部に対応の測定部位(尺骨動脈91Aに対応の測定部位)から脈波を表す電圧信号を検出するよう制御する第2検出ステップ(ステップS34)と、上記の第1検出ステップ(ステップS32)において検出する脈波を表す電圧信号を、第1周波数に対応のフィルタ特性に基づきフィルタ部493を用いて処理する第1処理ステップ(ステップS35)と、上記の第2検出ステップにおいて検出する脈波を表す電圧信号を、第2周波数に対応のフィルタ特性に基づきフィルタ部493Aを用いて処理する第2処理ステップ(ステップS36)を実行する。
また、図19を参照して、CPU100は、ステップS18において、センサ部40,40Aを次のように制御する。まず、第1脈波センサ部(センサ部40)と第2脈波センサ部(センサ部40A)を、予め定められた間隔で交互に駆動するよう切替部150を制御するステップ(ステップS41)と、第1脈波センサ部の交流電源部492を、第1周波数を有する第1電流信号を対応の測定部位(橈骨動脈91に対応の測定部位)に出力するよう制御する第1出力ステップ(ステップS42)と、第1脈波センサ部も電圧検出部491を、対応の測定部位から脈波を表す電圧信号を検出するよう制御する第1検出ステップ(ステップS43)と、第2脈波センサ部の交流電源部492Aを、第2周波数を有する第2電流信号を対応の測定部位(尺骨動脈91Aに対応の測定部位)に出力するよう制御する第2出力ステップ(ステップS44)と、第2脈波センサ部の交流電源部492Aを、対応の測定部位から脈波を表す電圧信号を検出するよう制御する第2検出ステップ(ステップS45)とを実行する。
図9、図18および図19のフローチャートに従いプログラムは、血圧計1のコンピュータに付属するCD(Compact Disk Read Only Memory)、二次記憶装置、主記憶装置およびメモリカードなどの一時的でないコンピュータ読取り可能な記録媒体にて記録させて提供することもできる。あるいは、コンピュータに内蔵するハードディスクなどの記録媒体にて記録させて、プログラムを提供することもできる。また、ネットワーク900を介したダウンロードによって、プログラムを提供することもできる。
今回開示された実施の形態はすべての点で例示であって制限的なものではないと考えられるべきである。本発明の範囲は、上記した説明ではなく、請求の範囲によって示され、請求の範囲と均等の意味および範囲内でのすべての変更が含まれることが意図される。
1 血圧計、10 本体、10B 携帯型端末、30 サーバ、40,40A センサ部、40B 信頼度、40E,40F 電極群、491,491A 電圧検出部、50 ディスプレイ、51 メモリ、52 操作部、53 電池、59 通信部、71,72 配線、90 手首、91 橈骨動脈、91A 尺骨動脈、110 血圧算出部、111 PTT血圧算出部、112 PTT検出部、113 平均血圧算出部、114 オシロメトリック血圧算出部、120 表示制御部、130 メモリ制御部、140 通信制御部、150 切替部、158 表示部、310,340 発振回路、394 テーブル、492,492A 交流電源部、493,493A フィルタ部、494,494A S/N検出部、495,495A A/D変換部、900 ネットワーク、A1,A2 ピーク、CR 周期、CR1 半周期、CT1,CT2 制御信号、D 間隔、DBP 拡張期血圧、SBP 収縮期血圧、EBP-R 代表血圧、R1,R2 S/N比、PLS 脈拍数、PS1,PS1A,PS2A,PS2 脈波信号、Y 幅方向、i 定電流、r 相互相関係数、v1,v1A,v2,v2A 電圧信号。
Claims (16)
- 脈波を測定する装置であって、
互いに離間した測定部位のそれぞれに対応して配置され得る第1脈波センサ部および第2脈波センサ部と、を備え、
前記第1脈波センサ部は、第1周波数を有する第1電流信号を対応の前記測定部位に出力する第1出力部と、当該対応の測定部位から脈波を表す電圧信号を検出するための第1検出部と、を含み、
前記第2脈波センサ部は、前記第1周波数とは異なる第2周波数を有する第2電流信号を対応の前記測定部位に出力する第2出力部と、当該対応の測定部位から脈波を表す電圧信号を検出するための第2検出部と、を含み、
さらに、
前記第1検出部は、検出する前記脈波を表す電圧信号を、前記第1周波数に対応のフィルタ特性に基づき処理し、
前記第2検出部は、検出する前記脈波を表す電圧信号を、前記第2周波数に対応のフィルタ特性に基づき処理する、測定装置。 - 前記第1周波数は60kHzを示し、前記第2周波数は50kHzを示す、請求項1に記載の測定装置。
- 脈波を測定する装置であって、
互いに離間した測定部位のそれぞれに対応して配置され得る第1脈波センサ部および第2脈波センサ部を備え、
前記第1脈波センサ部は、第1周波数を有する第1電流信号を対応の前記測定部位に出力する第1出力部と、当該対応の測定部位から脈波を表す電圧信号を検出するための第1検出部と、を含み、
前記第2脈波センサ部は、第2周波数を有する第2電流信号を対応の前記測定部位に出力する第2出力部と、当該対応の測定部位から脈波を表す電圧信号を検出するための第2検出部と、を含み、
前記第1脈波センサ部と前記第2脈波センサ部を、予め定められた間隔で交互に駆動する、測定装置。 - 前記第1周波数と前記第2周波数は、同じ周波数を示す、請求項3に記載の測定装置。
- 前記第1周波数は、前記第2周波数とは異なる、請求項3に記載の測定装置。
- 前記第1周波数は、50kHzまたは60kHzを示し、
前記第2周波数は、50kHzまたは60kHzを示す、請求項1から5のいずれか1項に記載の測定装置。 - 前記測定装置は、さらに、
前記第1検出部が検出する前記電圧信号が示す脈波および前記第2検出部が検出する前記電圧信号が示す脈波の少なくとも一方から、脈波伝搬速度を検出する、請求項1から6のいずれか1項に記載の測定装置。 - 前記測定装置は、さらに、
前記第1検出部が検出する前記電圧信号が示す脈波から算出される前記脈波伝搬速度に基づく第1血圧および前記第2検出部が検出する前記電圧信号が示す脈波から算出される前記脈波伝搬速度に基づく第2血圧の少なくとも一方を算出する血圧算出部を、さらに備える、請求項7に記載の測定装置。 - 前記測定装置は、さらに、
前記第1検出部および前記第2検出部が検出する前記脈波を表す電圧信号のそれぞれについて、S/N比を検出する、請求項8に記載の測定装置。 - 前記血圧算出部は、前記第1検出部および前記第2検出部が検出する前記脈波を表す電圧信号のうち、前記S/N比の高い方の電圧信号が示す脈波から算出される前記脈波伝搬速度に基づく血圧を算出する、請求項9に記載の測定装置。
- 前記血圧算出部は、
前記第1血圧および前記第2血圧のうちの代表血圧を算出する、請求項9または10に記載の測定装置。 - 前記代表血圧は、
前記第1血圧および前記第2血圧の平均血圧を含む、請求項11に記載の測定装置。 - 前記平均血圧は、
前記第1血圧および前記第2血圧のそれぞれに重みを付けて算出される平均であって、
前記第1血圧の重みは対応のS/N比に基づき、前記第2血圧の重みは対応の前記S/N比に基づいている、請求項12に記載の測定装置。 - 前記測定装置は、ディスプレイと、
表示部を有した外部の情報処理装置と通信する通信部を、さらに備え、
前記測定装置は、
前記血圧算出部が算出した血圧値を前記表示部に表示するように、前記通信部を介して前記情報処理装置に送信する、請求項8から13のいずれか1項に記載の測定装置。 - 装置の制御方法をコンピュータに実行させるためのプログラムであって、
前記装置は、
互いに離間した測定部位のそれぞれに対応して配置され得る第1脈波センサ部および第2脈波センサ部と、を備え、
前記制御方法は、
前記第1脈波センサ部を、第1周波数を有する第1電流信号を対応の前記測定部位に出力するよう制御する第1出力ステップと、
前記第1脈波センサ部を、前記第1脈波センサ部に対応の測定部位から脈波を表す電圧信号を検出するよう制御する第1検出ステップと、
前記第2脈波センサ部を、第2周波数を有する第2電流信号を対応の前記測定部位に出力するよう制御する第2出力ステップと、
前記第2脈波センサ部を、前記第2脈波センサ部に対応の測定部位から脈波を表す電圧信号を検出するよう制御する第2検出ステップと、
前記第1検出ステップにおいて検出する前記脈波を表す電圧信号を、前記第1周波数に対応のフィルタ特性に基づき処理する第1処理ステップと、
前記第2検出ステップにおいて検出する前記脈波を表す電圧信号を、前記第2周波数に対応のフィルタ特性に基づき処理する第2処理ステップと、を備える、プログラム。 - 装置の制御方法をコンピュータに実行させるためのプログラムであって、
前記装置は、
互いに離間した測定部位のそれぞれに対応して配置され得る第1脈波センサ部および第2脈波センサ部と、を備え、
前記制御方法は、
前記第1脈波センサ部を、第1周波数を有する第1電流信号を対応の前記測定部位に出力するよう制御する第1出力ステップと、
前記第1脈波センサ部を、対応の測定部位から脈波を表す電圧信号を検出するよう制御する第1検出ステップと、
前記第2脈波センサ部を、第2周波数を有する第2電流信号を対応の前記測定部位に出力するよう制御する第2出力ステップと、
前記第2脈波センサ部を、対応の測定部位から脈波を表す電圧信号を検出するよう制御する第2検出ステップと、
前記第1脈波センサ部と前記第2脈波センサ部を、予め定められた間隔で交互に駆動するステップと、を備える、プログラム。
Priority Applications (3)
| Application Number | Priority Date | Filing Date | Title |
|---|---|---|---|
| DE112018006494.8T DE112018006494T5 (de) | 2017-12-21 | 2018-11-30 | Messgerät und Programm |
| CN201880082820.6A CN111542261A (zh) | 2017-12-21 | 2018-11-30 | 测量装置和程序 |
| US16/899,450 US20200345245A1 (en) | 2017-12-21 | 2020-06-11 | Measurement apparatus and computer-readable recording medium |
Applications Claiming Priority (2)
| Application Number | Priority Date | Filing Date | Title |
|---|---|---|---|
| JP2017-245311 | 2017-12-21 | ||
| JP2017245311A JP2019110987A (ja) | 2017-12-21 | 2017-12-21 | 測定装置およびプログラム |
Related Child Applications (1)
| Application Number | Title | Priority Date | Filing Date |
|---|---|---|---|
| US16/899,450 Continuation US20200345245A1 (en) | 2017-12-21 | 2020-06-11 | Measurement apparatus and computer-readable recording medium |
Publications (1)
| Publication Number | Publication Date |
|---|---|
| WO2019124025A1 true WO2019124025A1 (ja) | 2019-06-27 |
Family
ID=66994130
Family Applications (1)
| Application Number | Title | Priority Date | Filing Date |
|---|---|---|---|
| PCT/JP2018/044217 WO2019124025A1 (ja) | 2017-12-21 | 2018-11-30 | 測定装置およびプログラム |
Country Status (5)
| Country | Link |
|---|---|
| US (1) | US20200345245A1 (ja) |
| JP (1) | JP2019110987A (ja) |
| CN (1) | CN111542261A (ja) |
| DE (1) | DE112018006494T5 (ja) |
| WO (1) | WO2019124025A1 (ja) |
Families Citing this family (5)
| Publication number | Priority date | Publication date | Assignee | Title |
|---|---|---|---|---|
| JP7106563B2 (ja) | 2016-11-29 | 2022-07-26 | スミトモ ファーマ オンコロジー, インコーポレイテッド | ナフトフラン誘導体、その調製、および使用方法 |
| CA3062656A1 (en) | 2017-05-17 | 2018-11-22 | Boston Biomedical, Inc. | Methods for treating cancer |
| US20220323015A1 (en) * | 2019-09-06 | 2022-10-13 | Sharp Kabushiki Kaisha | Measurement apparatus and measurement method |
| JP2022052778A (ja) | 2020-09-24 | 2022-04-05 | カシオ計算機株式会社 | 電子機器およびプログラム |
| CN112587114A (zh) * | 2020-12-25 | 2021-04-02 | 苏州益舒缘科技有限公司 | 一种心率检测手环及其检测方法 |
Citations (9)
| Publication number | Priority date | Publication date | Assignee | Title |
|---|---|---|---|---|
| JPH04250135A (ja) * | 1990-07-18 | 1992-09-07 | Rudolf A Hatschek | 血圧測定装置 |
| JP2003169779A (ja) * | 2001-12-06 | 2003-06-17 | Fukuda Denshi Co Ltd | 脈波伝播速度測定装置 |
| WO2008065873A1 (fr) * | 2006-12-01 | 2008-06-05 | Omron Healthcare Co., Ltd. | Unité d'électrodes sphygmométriques et sphygmomètre |
| US8197416B1 (en) * | 2005-08-19 | 2012-06-12 | Ravi Shankar | Pulsatile measurement of cardiac malfunction conditions |
| JP2016000088A (ja) * | 2014-06-11 | 2016-01-07 | フクダ電子株式会社 | 脈波伝播時間計測用具及び脈波伝播時間計測装置 |
| US20160374618A1 (en) * | 2015-06-23 | 2016-12-29 | PhysioWave, Inc. | Determining physiological parameters using movement detection |
| US20170065185A1 (en) * | 2015-04-30 | 2017-03-09 | Withings | Weighing Scale with Extended Functions |
| JP2017070739A (ja) * | 2015-10-06 | 2017-04-13 | 三星電子株式会社Samsung Electronics Co.,Ltd. | 生体情報測定装置及び方法並びにウェアラブルデバイス |
| US20180078148A1 (en) * | 2016-09-22 | 2018-03-22 | Microsoft Technology Licensing, Llc | Bioimpedance based pulse waveform sensing |
Family Cites Families (7)
| Publication number | Priority date | Publication date | Assignee | Title |
|---|---|---|---|---|
| US8233969B2 (en) * | 2006-07-05 | 2012-07-31 | Koninklijke Philips Electronics, N.V. | Wearable monitoring system |
| DK2675349T3 (en) * | 2011-02-17 | 2018-01-08 | Qualcomm Inc | PROCEDURE AND SYSTEM FOR DETERMINING A CARDIOVASCULAR QUANTITY OF A MAMMAL |
| EP2816950A4 (en) * | 2012-02-22 | 2015-10-28 | Aclaris Medical Llc | DEVICE AND SYSTEM FOR DETECTING PHYSIOLOGICAL SIGNALS |
| EP3294128B1 (en) * | 2015-05-11 | 2022-06-29 | Samsung Electronics Co., Ltd. | Biosensor electrode structure and biosensor including the same |
| US10213117B2 (en) * | 2016-02-18 | 2019-02-26 | Qualcomm Incorporated | Blood pressure estimation based on pulse wave velocity |
| DE102016004462A1 (de) * | 2016-04-06 | 2017-10-12 | Fachhochschule Lübeck | Messverfahren und Messvorrichtung zur nicht-invasiven Messung der aortalen Pulswellengeschwindigkeit einer Messperson |
| EP3518753A4 (en) * | 2016-09-27 | 2020-08-26 | Spry Health, Inc. | SYSTEMS AND METHODS FOR MEASURING BIOLOGICAL METRICS |
-
2017
- 2017-12-21 JP JP2017245311A patent/JP2019110987A/ja active Pending
-
2018
- 2018-11-30 CN CN201880082820.6A patent/CN111542261A/zh active Pending
- 2018-11-30 DE DE112018006494.8T patent/DE112018006494T5/de active Pending
- 2018-11-30 WO PCT/JP2018/044217 patent/WO2019124025A1/ja active Application Filing
-
2020
- 2020-06-11 US US16/899,450 patent/US20200345245A1/en not_active Abandoned
Patent Citations (9)
| Publication number | Priority date | Publication date | Assignee | Title |
|---|---|---|---|---|
| JPH04250135A (ja) * | 1990-07-18 | 1992-09-07 | Rudolf A Hatschek | 血圧測定装置 |
| JP2003169779A (ja) * | 2001-12-06 | 2003-06-17 | Fukuda Denshi Co Ltd | 脈波伝播速度測定装置 |
| US8197416B1 (en) * | 2005-08-19 | 2012-06-12 | Ravi Shankar | Pulsatile measurement of cardiac malfunction conditions |
| WO2008065873A1 (fr) * | 2006-12-01 | 2008-06-05 | Omron Healthcare Co., Ltd. | Unité d'électrodes sphygmométriques et sphygmomètre |
| JP2016000088A (ja) * | 2014-06-11 | 2016-01-07 | フクダ電子株式会社 | 脈波伝播時間計測用具及び脈波伝播時間計測装置 |
| US20170065185A1 (en) * | 2015-04-30 | 2017-03-09 | Withings | Weighing Scale with Extended Functions |
| US20160374618A1 (en) * | 2015-06-23 | 2016-12-29 | PhysioWave, Inc. | Determining physiological parameters using movement detection |
| JP2017070739A (ja) * | 2015-10-06 | 2017-04-13 | 三星電子株式会社Samsung Electronics Co.,Ltd. | 生体情報測定装置及び方法並びにウェアラブルデバイス |
| US20180078148A1 (en) * | 2016-09-22 | 2018-03-22 | Microsoft Technology Licensing, Llc | Bioimpedance based pulse waveform sensing |
Also Published As
| Publication number | Publication date |
|---|---|
| DE112018006494T5 (de) | 2020-10-22 |
| CN111542261A (zh) | 2020-08-14 |
| JP2019110987A (ja) | 2019-07-11 |
| US20200345245A1 (en) | 2020-11-05 |
Similar Documents
| Publication | Publication Date | Title |
|---|---|---|
| WO2019124025A1 (ja) | 測定装置およびプログラム | |
| JP6991022B2 (ja) | 表示制御装置およびプログラム | |
| WO2018123284A1 (ja) | 脈波測定装置および脈波測定方法、並びに血圧測定装置 | |
| US20190307336A1 (en) | Pulse wave measurement device, pulse wave measurement method, and blood pressure measurement device | |
| US11589757B2 (en) | Blood pressure estimation device | |
| WO2018123275A1 (ja) | 血圧計および血圧測定方法並びに機器 | |
| JP6741570B2 (ja) | 脈波測定装置および脈波測定方法、並びに血圧測定装置 | |
| JP6965066B2 (ja) | 脈波測定装置、血圧測定装置、機器、脈波測定方法、および血圧測定方法 | |
| US11495350B2 (en) | Information processing apparatus, information processing method, and non-transitory computer-readable storage medium information processing program | |
| US11317818B2 (en) | Blood pressure measurement device and blood pressure measurement method | |
| JP7023751B2 (ja) | 生体情報測定装置 | |
| CN110891480B (zh) | 测定装置和测定方法 | |
| JP7102176B2 (ja) | 生体情報測定装置 | |
| CN111511273A (zh) | 信息处理装置、信息处理方法和信息处理程序 | |
| JP6970605B2 (ja) | 血圧推定装置 | |
| JP2019010380A (ja) | 脈波測定装置 |
Legal Events
| Date | Code | Title | Description |
|---|---|---|---|
| 121 | Ep: the epo has been informed by wipo that ep was designated in this application |
Ref document number: 18892387 Country of ref document: EP Kind code of ref document: A1 |
|
| 122 | Ep: pct application non-entry in european phase |
Ref document number: 18892387 Country of ref document: EP Kind code of ref document: A1 |