WO2019054254A1 - Display control device and program - Google Patents
Display control device and program Download PDFInfo
- Publication number
- WO2019054254A1 WO2019054254A1 PCT/JP2018/032903 JP2018032903W WO2019054254A1 WO 2019054254 A1 WO2019054254 A1 WO 2019054254A1 JP 2018032903 W JP2018032903 W JP 2018032903W WO 2019054254 A1 WO2019054254 A1 WO 2019054254A1
- Authority
- WO
- WIPO (PCT)
- Prior art keywords
- pulse wave
- information
- magnitude
- display
- sensor
- Prior art date
Links
Images


Classifications
-
- A—HUMAN NECESSITIES
- A61—MEDICAL OR VETERINARY SCIENCE; HYGIENE
- A61B—DIAGNOSIS; SURGERY; IDENTIFICATION
- A61B5/00—Measuring for diagnostic purposes; Identification of persons
- A61B5/68—Arrangements of detecting, measuring or recording means, e.g. sensors, in relation to patient
- A61B5/6801—Arrangements of detecting, measuring or recording means, e.g. sensors, in relation to patient specially adapted to be attached to or worn on the body surface
- A61B5/6802—Sensor mounted on worn items
- A61B5/681—Wristwatch-type devices
-
- A—HUMAN NECESSITIES
- A61—MEDICAL OR VETERINARY SCIENCE; HYGIENE
- A61B—DIAGNOSIS; SURGERY; IDENTIFICATION
- A61B5/00—Measuring for diagnostic purposes; Identification of persons
- A61B5/02—Detecting, measuring or recording pulse, heart rate, blood pressure or blood flow; Combined pulse/heart-rate/blood pressure determination; Evaluating a cardiovascular condition not otherwise provided for, e.g. using combinations of techniques provided for in this group with electrocardiography or electroauscultation; Heart catheters for measuring blood pressure
- A61B5/021—Measuring pressure in heart or blood vessels
- A61B5/022—Measuring pressure in heart or blood vessels by applying pressure to close blood vessels, e.g. against the skin; Ophthalmodynamometers
- A61B5/02225—Measuring pressure in heart or blood vessels by applying pressure to close blood vessels, e.g. against the skin; Ophthalmodynamometers using the oscillometric method
-
- A—HUMAN NECESSITIES
- A61—MEDICAL OR VETERINARY SCIENCE; HYGIENE
- A61B—DIAGNOSIS; SURGERY; IDENTIFICATION
- A61B5/00—Measuring for diagnostic purposes; Identification of persons
- A61B5/05—Detecting, measuring or recording for diagnosis by means of electric currents or magnetic fields; Measuring using microwaves or radio waves
- A61B5/053—Measuring electrical impedance or conductance of a portion of the body
-
- A—HUMAN NECESSITIES
- A61—MEDICAL OR VETERINARY SCIENCE; HYGIENE
- A61B—DIAGNOSIS; SURGERY; IDENTIFICATION
- A61B5/00—Measuring for diagnostic purposes; Identification of persons
- A61B5/68—Arrangements of detecting, measuring or recording means, e.g. sensors, in relation to patient
- A61B5/6801—Arrangements of detecting, measuring or recording means, e.g. sensors, in relation to patient specially adapted to be attached to or worn on the body surface
- A61B5/684—Indicating the position of the sensor on the body
-
- A—HUMAN NECESSITIES
- A61—MEDICAL OR VETERINARY SCIENCE; HYGIENE
- A61B—DIAGNOSIS; SURGERY; IDENTIFICATION
- A61B5/00—Measuring for diagnostic purposes; Identification of persons
- A61B5/70—Means for positioning the patient in relation to the detecting, measuring or recording means
-
- A—HUMAN NECESSITIES
- A61—MEDICAL OR VETERINARY SCIENCE; HYGIENE
- A61B—DIAGNOSIS; SURGERY; IDENTIFICATION
- A61B5/00—Measuring for diagnostic purposes; Identification of persons
- A61B5/74—Details of notification to user or communication with user or patient ; user input means
- A61B5/742—Details of notification to user or communication with user or patient ; user input means using visual displays
- A61B5/743—Displaying an image simultaneously with additional graphical information, e.g. symbols, charts, function plots
-
- A—HUMAN NECESSITIES
- A61—MEDICAL OR VETERINARY SCIENCE; HYGIENE
- A61B—DIAGNOSIS; SURGERY; IDENTIFICATION
- A61B2562/00—Details of sensors; Constructional details of sensor housings or probes; Accessories for sensors
- A61B2562/04—Arrangements of multiple sensors of the same type
- A61B2562/043—Arrangements of multiple sensors of the same type in a linear array
-
- A—HUMAN NECESSITIES
- A61—MEDICAL OR VETERINARY SCIENCE; HYGIENE
- A61B—DIAGNOSIS; SURGERY; IDENTIFICATION
- A61B5/00—Measuring for diagnostic purposes; Identification of persons
- A61B5/02—Detecting, measuring or recording pulse, heart rate, blood pressure or blood flow; Combined pulse/heart-rate/blood pressure determination; Evaluating a cardiovascular condition not otherwise provided for, e.g. using combinations of techniques provided for in this group with electrocardiography or electroauscultation; Heart catheters for measuring blood pressure
- A61B5/021—Measuring pressure in heart or blood vessels
- A61B5/02108—Measuring pressure in heart or blood vessels from analysis of pulse wave characteristics
- A61B5/02116—Measuring pressure in heart or blood vessels from analysis of pulse wave characteristics of pulse wave amplitude
-
- A—HUMAN NECESSITIES
- A61—MEDICAL OR VETERINARY SCIENCE; HYGIENE
- A61B—DIAGNOSIS; SURGERY; IDENTIFICATION
- A61B5/00—Measuring for diagnostic purposes; Identification of persons
- A61B5/02—Detecting, measuring or recording pulse, heart rate, blood pressure or blood flow; Combined pulse/heart-rate/blood pressure determination; Evaluating a cardiovascular condition not otherwise provided for, e.g. using combinations of techniques provided for in this group with electrocardiography or electroauscultation; Heart catheters for measuring blood pressure
- A61B5/021—Measuring pressure in heart or blood vessels
- A61B5/02108—Measuring pressure in heart or blood vessels from analysis of pulse wave characteristics
- A61B5/02125—Measuring pressure in heart or blood vessels from analysis of pulse wave characteristics of pulse wave propagation time
Definitions
- the present disclosure relates to a display control device and program, and more particularly to a display control device and program of pulse wave information.
- Patent Document 1 Japanese Patent Application Laid-Open No. 2004-222814 discloses that the magnitude of a pressure pulse wave detected by pressure detection elements arranged in a line is displayed on a display.
- Patent Document 2 discloses a configuration for adjusting the position of a pulse wave detection circuit while viewing the display of the amplitude value of a detected pulse wave.
- An object in one aspect of the present disclosure is to provide a display control device and a program that present information for aligning a pulse wave sensor with respect to a measurement site when measuring a pulse wave propagation time.
- a display control device provided in a measurement device.
- the measuring device includes a belt wound around and mounted at a measurement site of pulse wave propagation time, a sensor section provided on an inner circumferential surface which is a surface on the side of the measurement site of the belt when the belt is mounted, and And a display provided on an outer peripheral surface which is a surface opposite to the peripheral surface.
- the display is provided on the outer peripheral surface at a portion that can face the portion where the sensor unit is located when the belt is mounted, and the sensor unit is provided at a position apart from each other in the width direction of the belt And a second pulse wave sensor.
- the display control device is configured such that, in the display, the magnitude of the first pulse wave amplitude indicated by the output of the first pulse wave sensor at a position corresponding to each of the first pulse wave sensor and the second pulse wave sensor disposed apart from each other. And second indicator information representing the magnitude of the second pulse wave amplitude indicated by the output of the second pulse wave sensor.
- the display control device is guide information according to the magnitude of the first pulse wave amplitude and the magnitude of the second pulse wave amplitude, and is for adjusting the relative positional relationship between the sensor unit and the measurement site. Display guide information on the display.
- the display control device displays the guide information on the same screen as the first indicator information and the second indicator information on the display.
- the guide information includes information for guiding a direction in which the position of the sensor unit with respect to the measurement site is moved.
- the guide information displays information for guiding the moving direction.
- the guide information includes information for guiding fixing of the position of the sensor unit.
- the guide information replaces the information for guiding the direction of movement, and It contains information to guide fixing the position.
- the information indicating the magnitude of the first pulse wave amplitude and the information indicating the magnitude of the second pulse wave amplitude each have a display mode in the case where the magnitude of the pulse wave amplitude indicates a predetermined magnitude. And the display mode in the case where the predetermined size is not indicated.
- the guide information includes information for evaluating the state of attachment to the measurement site, and the information to be evaluated predetermines the magnitude of the first pulse wave amplitude and the magnitude of the second pulse wave amplitude during attachment.
- the information to be evaluated predetermines the magnitude of the first pulse wave amplitude and the magnitude of the second pulse wave amplitude during attachment.
- different evaluations are indicated.
- the guide information includes information prompting re-rolling of the winding.
- the measurement apparatus further includes a communication unit that communicates with an external information processing apparatus including a display unit, and transmits guide information to the information processing apparatus via the communication unit in order to cause the display unit to display the guide information.
- a communication unit that communicates with an external information processing apparatus including a display unit, and transmits guide information to the information processing apparatus via the communication unit in order to cause the display unit to display the guide information.
- the pulse wave propagation time is calculated from the magnitude of the first pulse wave amplitude and the magnitude of the second pulse wave amplitude, and the measurement device calculates the blood pressure based on the pulse wave transit time.
- the guide information includes information for evaluating the state of attachment to the measurement site, and the display control device displays the information for evaluating the state of attachment in association with the information for evaluating the calculated blood pressure.
- the display control device when the display control device further displays guide information, when the magnitude of the first pulse wave amplitude or the magnitude of the second pulse wave amplitude changes, information for notifying the change in the guide information is displayed.
- a program for causing a computer to execute a display control method in an apparatus comprises a belt wound around and mounted at a measurement site of pulse wave propagation time, a sensor section provided on an inner peripheral surface which is a surface on the side of the measurement site of the belt when the belt is mounted, and A display provided on an outer circumferential surface which is a surface opposite to the circumferential surface, the display being provided on the outer circumferential surface at a portion which can face a portion where the sensor unit is located when the belt is attached,
- the sensor unit includes a first pulse wave sensor and a second pulse wave sensor provided at mutually spaced positions in the width direction of the belt.
- the display control method causes the display to display the first indicator information and the second indicator information respectively at positions corresponding to the first pulse wave sensor and the second pulse wave sensor disposed apart from each other.
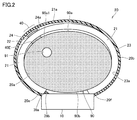
- FIG. 1 is an external perspective view of a sphygmomanometer 1 according to a first embodiment.
- FIG. 5 is a diagram showing a state in which the blood pressure monitor 1 according to Embodiment 1 is attached to the left wrist 90. It is a figure which shows the planar layout of the electrode group for impedance measurement in the state with which the sphygmomanometer 1 of FIG. 1 was mounted
- FIG. FIG. 2 is a block diagram showing a control system of the sphygmomanometer 1 according to the first embodiment.
- FIG. 5 is a schematic diagram for illustrating blood pressure measurement based on pulse wave propagation time according to the first embodiment.
- FIG. 10 is a schematic cross-sectional view along the longitudinal direction of the wrist in a state where the sphygmomanometer 1 is attached to the wrist 90 when performing blood pressure measurement by the oscillometric method according to the first embodiment.
- FIG. 7 is a diagram for explaining the determination of the mounting state of the sensor unit according to the first embodiment.
- FIG. 5 is a diagram schematically showing the configuration of a function for outputting guide information according to Embodiment 1, in association with a blood pressure measurement function. It is a flowchart which shows the process of the blood pressure measurement based on the output of the guide information which concerns on Embodiment 1, and pulse wave propagation time. 5 is a view showing another display example of guide information according to Embodiment 1.
- FIG. 1 is a schematic cross-sectional view along the longitudinal direction of the wrist in a state where the sphygmomanometer 1 is attached to the wrist 90 when performing blood pressure measurement by the oscillometric method according to the first embodiment.
- FIG. 7 is a diagram for
- FIG. 5 is a view showing another display example of guide information according to Embodiment 1.
- FIG. 5 is a view showing another display example of guide information according to Embodiment 1.
- FIG. 5 is a diagram showing an example of storage of measurement results according to the first embodiment.
- 5 is a view showing another display example according to Embodiment 1.
- FIG. 10 is a diagram showing still another display example according to Embodiment 1;
- FIG. 10 is a diagram showing still another display example according to Embodiment 1;
- FIG. 10 is a diagram showing still another display example according to Embodiment 1;
- FIG. 8 is a diagram showing a schematic configuration of a system according to a second embodiment.
- the sphygmomanometer which is a wearable terminal is illustrated as an apparatus which measures a pulse wave propagation time (it is hereafter called PTT), and the case where a "display control apparatus" is mounted in a sphygmomanometer is demonstrated.
- the device mounting the “display control device” may be any device including a sensor that detects a pulse wave signal and a processing device that processes a signal detected by the sensor, and is not limited to the sphygmomanometer.
- the sphygmomanometer is not limited to a wearable terminal.
- FIG. 1 is an external perspective view of the sphygmomanometer 1 according to the first embodiment.
- FIG. 2 schematically shows a cross section perpendicular to the longitudinal direction of the wrist 90 in a state in which the sphygmomanometer 1 according to the first embodiment is attached to the left wrist 90 (hereinafter also referred to as “mounted state”).
- the left wrist 90 is the measurement site.
- the “measurement site” may be a site through which an artery passes, and is not limited to the wrist.
- the measurement site may be, for example, the lower limbs such as the right wrist, the upper arm, the ankle, and the thigh.
- belt 20 is a belt-like member.
- the belt 20 is slidably wound and mounted in the mounted state so that the longitudinal direction of the belt 20 corresponds to the circumferential direction of the wrist 90.
- the dimension (width dimension) in the width direction Y of the belt 20 is, for example, about 30 mm.
- Belt 20 includes a band 23 and a compression cuff 21.
- the strip 23 has an inner circumferential surface 23a which is a surface on the measurement site side and an outer circumferential surface 20b which is a surface opposite to the inner circumferential surface 23a.
- the compression cuff 21 is attached along the inner circumferential surface 23 a of the strip 23 and has an inner circumferential surface 20 a in contact with the wrist 90 (see FIG. 2).
- the compression cuff 21 is configured as a fluid bag by facing two stretchable polyurethane sheets in the thickness direction and welding their peripheral portions.
- the fluid bag of the compression cuff 21 may be a bag-like member capable of containing a fluid.
- the compression cuff 21 is inflated when the fluid is supplied, and the measurement site is pressurized as the compression cuff 21 is inflated. In addition, when the fluid is discharged, the compression cuff 21 contracts and the pressurization state of the measurement site is released.
- the main body 10 is provided integrally with one end 20 e of the belt 20.
- the belt 20 and the main body 10 may be separately formed, and the main body 10 may be integrally attached to the belt 20 via an engaging member (for example, a hinge).
- the portion where the main body 10 is disposed corresponds to the back side surface (surface on the back side of the hand) 90b of the wrist 90 in the mounted state (see FIG. 2).
- FIG. 2 a radial artery 91 passing near the palmar side (palm side) 90a in the wrist 90 is shown.
- the main body 10 has a three-dimensional shape having a thickness in a direction perpendicular to the outer circumferential surface 20 b of the belt 20.
- the main body 10 is small and thin so as not to interfere with the daily activities of the user.
- the main body 10 has a quadrangular frustum-shaped contour protruding outward from the belt 20.
- a display 50 is provided on the top surface (the surface farthest from the measurement site) 10 a of the main body 10.
- An operation unit 52 for inputting an instruction from the user is provided along the side surface 10f of the main body 10 (the left side front side surface in FIG. 1) 10f.
- a sensor section 40 is provided on the inner peripheral surface 20a of the belt 20 (that is, the inner peripheral surface 20a of the compression cuff 21) at a portion between the one end 20e and the other end 20f of the belt 20.
- the sensor unit 40 has a function of detecting a pulse wave using an impedance measurement function.
- An electrode group 40E is disposed on the inner circumferential surface 20a of the portion where the sensor unit 40 is disposed.
- the electrode group 40E has six plate-like (or sheet-like) electrodes 41 to arranged in a state of being separated from each other in the width direction Y of the belt 20.
- the part where the electrode group 40E is disposed corresponds to the radial artery 91 of the wrist 90 in the mounted state.
- the solid 22 may be disposed at a position corresponding to the electrode group 40E on the outer circumferential surface 21a.
- a pressure cuff 24 is disposed on the outer peripheral side of the solid 22.
- the pressing cuff 24 is an expanding member that locally suppresses a region corresponding to the electrode group 40E in the circumferential direction of the compression cuff 21.
- the pressure cuff 24 is disposed on the inner circumferential surface 23 a of the strip 23 that constitutes the belt 20 (see FIG. 2).
- the strip 23 is made of a plastic material that is flexible in the thickness direction and inelastic in the circumferential direction (longitudinal direction).
- the pressing cuff 24 is a fluid bag that expands and contracts in the thickness direction of the belt 20, and is pressurized by the supply of fluid and is not pressurized by discharging the fluid.
- the pressure cuff 24 is configured as, for example, a fluid bag by facing two stretchable polyurethane sheets in the thickness direction and welding their peripheral portions.
- the solid 22 is disposed at a position corresponding to the electrode group 40 ⁇ / b> E on the inner circumferential surface 24 a of the pressing cuff 24.
- the solid 22 is made of, for example, a plate-like resin (for example, polypropylene) having a thickness of about 1 to 2 mm.
- the belt 20, the pressing cuff 24, and the solid 22 are used as the pressing portion.
- the bottom surface 10b (the surface closest to the measurement site) 10b of the main body 10 and the end 20f of the belt 20 are three-fold buckles 15 (hereinafter, also simply referred to as "buckles 15"). Connected by.
- the buckle 15 includes a plate-like member 25 disposed on the outer circumferential side and a plate-like member 26 disposed on the inner circumferential side.
- One end 25 e of the plate member 25 is rotatably attached to the main body 10 via a connecting rod 27 extending along the width direction Y.
- the other end 25 f of the plate 25 is rotatably attached to one end 26 e of the plate 26 via a connecting rod 28 extending in the width direction Y.
- the other end 26 f of the plate member 26 is fixed by the fixing portion 29 in the vicinity of the end 20 f of the belt 20.
- the mounting position of the fixing portion 29 is variably set in advance in accordance with the circumferential length of the wrist 90 of the user.
- the sphygmomanometer 1 (belt 20) is generally formed in a substantially annular shape, and the bottom surface 10b of the main body 10 and the end 20f of the belt 20 can be opened and closed in the arrow B direction in FIG. Configured
- the user When mounting the sphygmomanometer 1 on the wrist 90, the user passes the left hand through the belt 20 from the direction indicated by the arrow A in FIG. 1 with the buckle 15 opened and the diameter of the ring of the belt 20 increased.
- the user adjusts the angular position of the belt 20 around the wrist 90 by sliding or the like, and moves the sensor unit 40 so as to be positioned on the radial artery 91.
- the electrode group 40E of the sensor unit 40 abuts on a portion 90a1 of the palm lateral surface 90a of the wrist 90 corresponding to the radial artery 91.
- the user closes and fixes the buckle 15.
- the user winds and wears the sphygmomanometer 1 (belt 20) around the wrist 90.
- FIG. 3 is a diagram showing a planar layout of the electrode group for impedance measurement in a state where the sphygmomanometer 1 according to the first embodiment is attached to the wrist 90.
- the electrode group 40E of the sensor unit 40 in the worn state, is aligned along the longitudinal direction of the wrist corresponding to the radial artery 91 of the left wrist 90.
- Electrode group 40E includes current electrode pairs 41 and 46 for current conduction disposed on both sides in the width direction Y, and detection electrode pairs 42 and 43 and detection electrode pair 44 disposed between the current electrode pairs 41 and 46. , 45 and so on.
- the first pulse wave sensor 40-1 includes detection electrode pairs 42 and 43
- the second pulse wave sensor 40-2 includes detection electrode pairs 44 and 45.
- Detection electrode pairs 44 and 45 are arranged corresponding to the downstream side of the blood flow of the radial artery 91 with respect to the detection electrode pairs 42 and 43.
- a distance D (see FIG. 5A described later) between the center of the detection electrode pair 42, 43 and the center of the detection electrode pair 44, 45 is set to, for example, 20 mm.
- the interval D corresponds to the interval between the first pulse wave sensor 40-1 and the second pulse wave sensor 40-2.
- the distance between the detection electrode pair 42, 43 and the distance between the detection electrode pair 44, 45 are both set to, for example, 2 mm.
- the sphygmomanometer 1 can configure the belt 20 to be thin as a whole.
- the electrode group 40E can be flexibly configured, the electrode group 40E does not prevent the compression of the left wrist 90 by the compression cuff 21, and does not impair the accuracy of blood pressure measurement by the oscillometric method described later.
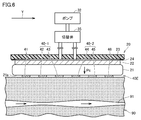
- FIG. 4 is a block diagram of a control system of the sphygmomanometer 1 according to the first embodiment.
- the sphygmomanometer 1 has an oscillometric blood pressure measurement function and a blood pressure measurement function based on PTT.
- the sphygmomanometer 1 of FIG. 4 exemplifies a configuration using air as a fluid.
- the main unit 10 includes a central processing unit (CPU) 100 functioning as a control unit, a display 50, a memory 51 functioning as a storage unit, an operation unit 52, a battery 53, and a communication unit 59. And. Further, the main body 10 includes a first pressure sensor 31, a pump 32, a valve 33, a second pressure sensor 34, and a switching valve 35. The switching valve 35 switches the connection destination of the pump 32 and the valve 33 to the compression cuff 21 or the pressing cuff 24.
- CPU central processing unit
- the main body 10 includes a first pressure sensor 31, a pump 32, a valve 33, a second pressure sensor 34, and a switching valve 35.
- the switching valve 35 switches the connection destination of the pump 32 and the valve 33 to the compression cuff 21 or the pressing cuff 24.
- the main body 10 includes an oscillation circuit 310 and an oscillation circuit 340 that convert outputs from the first pressure sensor 31 and the second pressure sensor 34 into frequencies, and a pump drive circuit 320 that drives the pump 32.
- the sensor unit 40 includes an electrode group 40E and a conduction and voltage detection circuit 49.
- the display 50 is configured of, for example, an organic EL (Electro Luminescence) display, and displays information in accordance with a control signal from the CPU 100. This information includes the measurement results.
- the display 50 is not limited to the organic EL display, and may be configured of another type of display such as, for example, an LCD (Liquid Cristal Display).
- the operation unit 52 is, for example, a push-type switch, and inputs an operation signal to the CPU 100 in accordance with an instruction to start or stop blood pressure measurement by the user.
- the operation unit 52 is not limited to the push-type switch, and may be, for example, a pressure-sensitive (resistive) or proximity-type (electrostatic capacitive) touch panel switch.
- the main body 10 may include a microphone (not shown), and may receive an instruction to start blood pressure measurement by the user's voice.
- the memory 51 is data of a program for controlling the sphygmomanometer 1, data used to control the sphygmomanometer 1, setting data for setting various functions of the sphygmomanometer 1, data of measurement results of blood pressure values, etc. Is stored temporarily.
- the memory 51 is also used as a work memory or the like when a program is executed.
- the CPU 100 executes various functions as a control unit in accordance with a program for controlling the sphygmomanometer 1 stored in the memory 51. For example, when performing blood pressure measurement by the oscillometric method, when the CPU 100 receives an instruction to start blood pressure measurement from the operation unit 52, the pump 32 (and the valve 33) is received based on the signal from the first pressure sensor 31. Drive). Further, the CPU 100 calculates the blood pressure value (systolic blood pressure (systolic blood pressure) and diastolic blood pressure (Diastolic blood pressure)) based on the signal from the first pressure sensor 31 and the pulse. Calculate the number.
- systolic blood pressure systolic blood pressure
- Diastolic blood pressure diastolic blood pressure
- the CPU 100 When performing blood pressure measurement based on PTT, the CPU 100 performs control to drive the valve 33 in order to discharge air in the compression cuff 21 in accordance with an instruction to start blood pressure measurement from the operation unit 52. Further, the CPU 100 controls the switching valve 35 to switch the connection destination of the pump 32 (and the valve 33) to the pressure cuff 24. Furthermore, based on the signal from the second pressure sensor 34, the CPU 100 performs control to calculate the blood pressure value.
- Communication unit 59 is controlled by CPU 100 to communicate with an external information processing apparatus via network 900.
- the external information processing apparatus may include a portable terminal 10B and a server 30, which will be described later, but is not limited to these apparatuses.
- Communication via network 900 may include wireless or wired.
- the network 900 may include the Internet and a LAN (Local Area Network). Alternatively, it may include one-to-one communication using a USB cable.
- the communication unit 59 may include a micro USB connector.
- the pump 32 and the valve 33 are connected to the compression cuff 21 and the pressure cuff 24 via the switching valve 35 and the air pipes 39a and 39b.
- the first pressure sensor 31 is connected to the compression force cuff 21 and the pressing cuff 24 via the air pipe 38a and the second pressure sensor 34 via the air pipe 38b.
- the first pressure sensor 31 detects the pressure in the compression cuff 21 via the air pipe 38a.
- the switching valve 35 is driven based on a control signal supplied from the CPU 100 and switches the connection destination of the pump 32 and the valve 33 to the compression cuff 21 or the pressing cuff 24.
- the pump 32 is configured of, for example, a piezoelectric pump.
- the pump 32 passes the air pipe 39a to pressurize the pressure (cuff pressure) in the compression cuff 21.
- the compression cuff 21 is supplied with air as a fluid for pressurization.
- the pump 32 passes the air pipe 39 b to pressurize the pressure (cuff pressure) in the pressure cuff 24. Air is supplied to the pressure cuff 24.
- the valve 33 is mounted on the pump 32, and is configured to be controlled in opening / closing as the pump 32 is turned on / off. Specifically, when the connection destination of the pump 32 and the valve 33 is switched to the compression cuff 21 by the switching valve 35, the valve 33 is closed when the pump 32 is turned on, and the pressure cuff 21 is While the air is enclosed, it is opened when the pump 32 is turned off, and the air of the compression cuff 21 is exhausted to the atmosphere through the air pipe 39a.
- Pump drive circuit 320 drives pump 32 based on a control signal supplied from CPU 100.
- the first pressure sensor 31 is, for example, a piezoresistive pressure sensor, and is connected to the pump 32, the valve 33, and the compression cuff 21 via an air pipe 38a.
- the first pressure sensor 31 detects the pressure of the belt 20 (the compression cuff 21), for example, the pressure based on the atmospheric pressure (zero) via the air pipe 38a, and outputs it as a time-series signal.
- the oscillation circuit 310 outputs, to the CPU 100, a frequency signal having a frequency corresponding to an electrical signal value based on a change in electrical resistance due to the piezoresistive effect from the first pressure sensor 31.
- the output of the first pressure sensor 31 is used to control the pressure of the compression force 21 and to calculate the blood pressure value by oscillometric method.
- the second pressure sensor 34 is, for example, a piezoresistive pressure sensor, and is connected to the pump 32, the valve 33, and the pressing cuff 24 via an air pipe 38b.
- the second pressure sensor 34 detects the pressure of the pressure cuff 24, for example, the pressure with the atmospheric pressure as a reference (zero) through the air pipe 38b, and outputs it as a time-series signal.
- the oscillation circuit 340 oscillates according to the electrical signal value based on the change in electrical resistance due to the piezoresistive effect from the second pressure sensor 34, and the CPU 100 generates a frequency signal having a frequency according to the electrical signal value of the second pressure sensor 34.
- Output to The output of the second pressure sensor 34 is used to control the pressure of the pressure cuff 24 and to calculate the PTT-based blood pressure.
- the CPU 100 controls the pump 32 and the valve 33 to pressurize and depressurize the cuff pressure according to various conditions.
- the battery 53 supplies power to various elements mounted on the main body 10.
- the battery 53 also supplies power to the energization of the sensor unit 40 and the voltage detection circuit 49 through the wiring 71.
- the wire 71 extends between the main body 10 and the sensor portion 40 along the circumferential direction of the belt 20 in a state of being sandwiched between the strip 23 of the belt 20 and the compression cuff 21 together with the wire 72 for signal. It is provided.
- FIG. 5 is a schematic view for explaining blood pressure measurement based on pulse wave propagation time according to the first embodiment.
- FIG. 5A is a schematic cross-sectional view along the longitudinal direction of the wrist when blood pressure measurement based on pulse wave propagation time is performed in a state where the sphygmomanometer 1 is attached to the wrist 90.
- FIG. 5B is a diagram showing the waveforms of pulse wave signals PS1 and PS2.
- the sensor unit 40 is located above the radial artery 91 at the measurement site.
- voltage detection circuit 49 applies a predetermined voltage between current electrode pairs 41 and 46 using a booster circuit, a voltage adjustment circuit, etc.
- a high frequency constant current i of 1 mA is applied.
- the voltage detection circuit 49 is configured such that the voltage signal v1 between the detection electrode pair 42, 43 constituting the first pulse wave sensor 40-1 and the detection electrode pair 44, 45 constituting the second pulse wave sensor 40-2 And the voltage signal v2 of the
- the voltage signals v1 and v2 are pulses of the blood flow of the radial artery 91 in portions of the palm side 90a of the left wrist 90, which are opposed to the first pulse wave sensor 40-1 and the second pulse wave sensor 40-2, respectively. Represents the change in electrical impedance due to waves.
- the amplifier 401 of the voltage detection circuit 49 is configured to include, for example, an operational amplifier, and amplifies the voltage signals v1 and v2.
- the analog filter 403 performs a filtering process on the amplified voltage signals v1 and v2. Specifically, the analog filter 403 removes noise other than the frequency that characterizes the voltage signals v1 and v2 (pulse wave signal), and performs a filtering process to improve the S / N.
- the A / D converter 405 converts the voltage signals v1 and v2 subjected to the filtering process from analog data to digital data, and outputs the data to the CPU 100 through the wiring 72.
- the CPU 100 performs predetermined signal processing on the input voltage signals v1 and v2 (digital data) to generate pulse wave signals PS1 and PS2 having a mountain-like waveform as shown in FIG. 5 (B).
- the voltage signals v1 and v2 are, for example, about 1 mv. Moreover, each peak A1, A2 of pulse wave signal PS1, PS2 is about 1V, for example.
- PWV Pulse Wave Velocity
- the pressure cuff 24 is in a pressurized state, and the pressure cuff 21 is in a non-pressurized state by discharging the internal air.
- the pressure cuff 24 and the solid 22 are disposed across the first pulse wave sensor 40-1, the second pulse wave sensor 40-2, and the current electrode pair 41, 46 in the arterial direction of the radial artery 91. Therefore, when the pressure cuff 24 is pressurized by the pump 32, the first pulse wave sensor 40-1, the second pulse wave sensor 40-2, and the current electrode pair 41, 46 are wrist-linked via the solid material 22.
- the palm side 90 a of 90 is pressed.
- the pressing force of each of the current electrode pairs 41 and 46, the first pulse wave sensor 40-1, and the second pulse wave sensor 40-2 on the palm side 90a of the wrist 90 can be set to an appropriate value.
- the pressure cuff 24 of the fluid bag is used as the pressing portion, the pump 32 and the valve 33 can be used in common with the compression cuff 21, and the configuration can be simplified.
- the first pulse wave sensor 40-1, the second pulse wave sensor 40-2, and the current electrode pair 41, 46 can be pressed through the solid 22, the pressing force on the measurement site becomes uniform, and the accuracy is high. Blood pressure measurement based on pulse wave transit time can be performed.
- the CPU 100 drives the switching valve 35 according to the instruction to switch the connection destination of the pump 32 and the valve 33 to the pressure cuff 24. Thereafter, the CPU 100 closes the valve 33 and drives the pump 32 through the pump drive circuit 320 to send air to the pressure cuff 24 to increase the cuff pressure Pc which is the pressure in the pressure cuff 24 at a constant speed.
- the CPU 100 outputs first and second pulse wave signals PS1 and PS2 output in time series by the first and second pulse wave sensors 40-1 and 40-2, respectively.
- PS2 is acquired, and the cross-correlation coefficient r between the waveforms of the first and second pulse wave signals PS1 and PS2 is calculated in real time.
- the time difference ⁇ t between the peaks A1 and A2 of the amplitudes of the first and second pulse wave signals PS1 and PS2 is calculated as PTT (pulse wave propagation time).
- the CPU 100 repeatedly executes calculation of PTT and calculation of the blood pressure EBP while an instruction to stop measurement is not issued via the operation unit 52.
- the CPU 100 displays the blood pressure EBP on the display 50 and stores it in the memory 51.
- the CPU 100 controls each unit to end the measurement operation.
- the sensor part 40 utilized the electrode for impedance measurement in order to measure a pulse wave signal, it is not limited to this.
- the sensor unit 40 may include a pressure sensor or a light sensor to measure pulse wave signals.
- FIG. 6 is a schematic cross-sectional view along the longitudinal direction of the wrist in a state where the sphygmomanometer 1 is attached to the wrist 90 when blood pressure measurement by the oscillometric method according to the first embodiment is performed.
- the pressure cuff 24 is in a non-pressurized state by discharging the air therein, and the compression cuff 21 is in a pressurized state in which the air is supplied.
- the compression cuff 21 extends in the circumferential direction of the wrist 90, and when pressed by the pump 32, uniformly compresses the circumferential direction of the left wrist 90. Since only the electrode group 40E exists between the inner peripheral surface of the compression cuff 21 and the left wrist 90, the compression by the compression cuff 21 is not blocked by other members, and the blood vessel is sufficiently closed. be able to.
- the CPU 100 calculates (estimates blood pressure according to the output waveform from the first pressure sensor 31 via the oscillation circuit 310 detected in the pressurization process or decompression process of the compression cuff 21 to the measurement site. ).
- the method of calculating blood pressure by the oscillometric method according to the present embodiment follows a known method, and therefore the description will not be repeated here.
- CPU 100 determines whether sphygmomanometer 1 is in the attached state. Specifically, when the belt 20 is wound around and attached to the measurement site, the belt 20 (compression cuff 21) is pressed against the measurement site. The first pressure sensor 31 detects this pressing force via the air pipe 38a.
- the CPU 100 detects a pressing force from the output of the first pressure sensor 31 via the oscillation circuit 310.
- the CPU 100 compares the pressing force detected via the first pressure sensor 31 with a predetermined threshold P.
- the comparison result satisfies the condition of (pressure magnitude> threshold value P)
- the CPU 100 determines that the sphygmomanometer 1 is in the mounted state, and the comparison result is (pressure magnitude ⁇ threshold value P).
- the condition of) is satisfied, the CPU 100 determines that the sphygmomanometer 1 is not in the worn state. Therefore, while the sphygmomanometer 1 is continuously determined to be in the wearing state, the CPU 100 determines that the sphygmomanometer 1 is being worn.
- the threshold value P is obtained in advance by experiment or the like.
- the determination method of the mounting state described above is a method using the pressing force detected by the first pressure sensor 31, it may be a method using the pressing force detected by the second pressure sensor 34. Alternatively, the determination may be made based on the pressing force detected by both the first pressure sensor 31 and the second pressure sensor 34.
- the determination of the mounting state is not limited to the determination based on the magnitude of the pressing force described above.
- the CPU 100 may determine whether or not it is in the mounted state (or in the mounting state).
- the accuracy of the PTT-based measured blood pressure is a feature of the waveform of the pulse wave signal output from the pulse wave sensor (cross correlation coefficient r and peak of amplitude) It depends on the detection accuracy of A1, A2). Therefore, accurate detection of the pulse wave signal is required. That is, it is necessary to arrange the first pulse wave sensor 40-1 and the second pulse wave sensor 40-2 of the sensor unit 40 on the measurement site (more specifically, the radial artery 91).
- guide information for position adjustment is provided. Is displayed on the display 50.
- the guide information includes a predetermined amplitude A1 of the amplitude of the first pulse wave signal PS1 of the first pulse wave sensor 40-1 and a peak A2 of the amplitude of the second pulse wave signal PS2 of the second pulse wave sensor. As such, it includes information for assisting in adjusting the relative positional relationship between the sensor unit 40 and the measurement site.
- the user adjusts the position of the sensor unit 40 in the mounted state, supported by the guide information.
- the user pushes and shifts (slides) the housing of the display 50 in the width direction Y in the mounted state to move the position of the sensor unit 40 up and down with respect to the measurement site (direction in which the left arm extends) Can be moved to
- the user pushes and shifts (slides) the housing of the display 50 in the direction intersecting the width direction Y in the mounted state to move the position of the sensor unit 40 in the left-right direction (the direction in which the left arm extends) Can be moved in a direction substantially crossing the
- the guide information includes information for evaluating the mounting state. Specifically, when the magnitudes of the amplitudes of the first pulse wave signal PS1 and the second pulse wave signal PS2 exceed the threshold value TA, the CPU 100 evaluates the wearing state as "OK". On the other hand, when the magnitude of the amplitude of at least one of the first pulse wave signal PS1 and the second pulse wave signal PS2 is less than or equal to the threshold value TA, the CPU 100 evaluates the mounting state as "NG".
- the threshold value TA is a value corresponding to a predetermined accuracy of the measured blood pressure based on the PTT, and indicates a value acquired in an experiment.
- the user can confirm that the position adjustment has succeeded by confirming "OK", and it is determined that the position adjustment has not succeeded by continuing the adjustment by confirming "NG”. can do.
- the wearing state is determined as “NG”
- the CPU 100 does not start the blood pressure measurement process, and when “OK” is determined, the CPU 100 can start the blood pressure measurement process (step S8 in FIG. 9 described later). reference). Therefore, the evaluation result of the wearing state can be used to determine the start of the blood pressure measurement process.
- the evaluation that the mounting state is "OK” indicates that the relative positional relationship between the sensor unit 40 and the measurement site is a relationship that can obtain the accuracy of PTT-based blood pressure measurement. More specifically, it shows a state in which the first pulse wave sensor 40-1 and the second pulse wave sensor 40-2 are located directly above the radial artery 91.
- the evaluation of the mounting state "NG” indicates that the relative positional relationship between the sensor unit 40 and the measurement site is a relationship in which the accuracy of the blood pressure measurement based on PTT can not be obtained. More specifically, it shows a state in which one or both of the first pulse wave sensor 40-1 and the second pulse wave sensor 40-2 are not positioned directly above the radial artery 91.
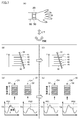
- FIG. 7 is a diagram for explaining the determination of the mounting state of the sensor unit 40 according to the first embodiment.
- the user visually recognizes the guide information of the display 50 from above in a state in which the extending direction of the left arm is parallel to the front of the body.
- the first pulse wave sensor 40-1 is located on the left side of the user, and the second pulse wave sensor 40-2 on the right side similarly. Will be located.
- the CPU 100 displays the first indicator information G1 representing the magnitude of the amplitude of the first pulse wave signal PS1 on the screen of the display 50 on the left side of the user, and the magnitude of the amplitude of the second pulse wave signal PS2
- the second indicator information G2 representing the distance is displayed on the screen of the display 50 on the right side of the user (see FIG. 7 (D) and FIG. 7 (E) described later).
- the CPU 100 causes the first pulse wave sensor 40-1 and the second pulse wave to transmit the first and second indicator information G1 and G2 in accordance with the direction in which the user of FIG. 7A views the information on the display 50.
- the first pulse wave sensor 40-1 is positioned directly above the radial artery 91
- the second pulse wave sensor 40-2 is positioned directly above the radial artery 91.
- the amplitude of the first pulse wave signal PS1 shows a magnitude exceeding the threshold TA
- the magnitude of the amplitude of the second pulse wave signal PS2 exceeds the threshold TA Absent. Therefore, the CPU 100 evaluates the mounting state of FIG. 7B as “NG”.
- the CPU 100 causes the display 50 to display the first pulse wave signal PS1 and the second pulse wave signal PS2 as shown in the upper part of FIG. 7D.
- the first indicator information G1 and the second indicator information G2 corresponding to each are displayed as a pictogram group.
- the pictogram group is a row of a plurality of rectangular pictograms, and the CPU 100 displays the pictogram group so as to extend in the direction intersecting the Y direction.
- the CPU 100 detects the amplitude magnitudes of the first pulse wave signal PS1 and the second pulse wave signal PS2, and lights one or more pictograms corresponding to the amplitude magnitude of the pulse wave signal among the corresponding pictogram groups.
- the number of lit pictograms in a row of pictograms indicates the magnitude of the amplitude of the corresponding pulse wave signal.
- the display mode As a lighting mode of the pictogram group, it is desirable to make the display mode different between a pictogram showing that the amplitude exceeds the threshold TA and a pictogram showing the threshold TA or less.
- the pictogram indicating that the amplitude exceeds the threshold TA continues lighting, and the pictogram indicating the threshold TA or less blinks.
- the display mode may change the display color in addition to lighting / flashing.
- the shape of the pictogram is not limited to a rectangle.
- the CPU 100 displays the character CH indicating the "left" or "right” side of the user as the position of the corresponding pulse wave sensor in association with the first indicator information G1 and the second indicator information G2 of each pictogram group. .
- the CPU 100 indicates that the pulse wave amplitude values detected by the first pulse wave sensor 40-1 and the second pulse wave sensor 40-2 are unbalanced with respect to the user. Or, it can be guided that the pulse wave amplitude value is relatively high / low, and the user can be motivated to move the position of the sensor unit 40. The motivated user pushes the housing of the display 50 in the right direction so as to increase the amplitude of the pulse wave signal indicated by the indicator information G2 associated with the "right" character CH.
- the position of the sensor unit 40 moves to the left of the user.
- the position of the sensor unit 40 (the first pulse wave sensor 40-1 and the second pulse wave sensor 40-2) interlocks with this movement, as shown in FIG. 7 (B) to FIG. 7 (C). It moves directly above the artery 91.
- the amplitudes of the first pulse wave signal PS1 and the second pulse wave signal PS2 become sufficiently large, and the first indicator information G1 and the second indicator information G2 are as shown in FIG.
- the threshold value TA shown in the lower part of (E) is exceeded.
- the first indicator information G1 and the second indicator information G2 indicate that the amplitudes of the first pulse wave signal PS1 and the second pulse wave signal PS2 have become sufficiently large. indicate.
- the CPU 100 determines that the mounting state of FIG. 7C is “OK”. By confirming the first indicator information G1 and the second indicator information G2 at the top of FIG. 7E, the user is guided that the mounting state has become good.
- the CPU 110 uses the PTT-based blood pressure according to the well-known equation described above and the characteristics of the waveforms of the first pulse wave signal PS1 and the second pulse wave signal PS2 detected when the wearing state is determined as “OK”. Perform measurement (estimate).
- the user is motivated to adjust the relative positional relationship between the sensor unit 40 and the measurement site from the first indicator information G1 and the second indicator information G2, and the first indicator information G1 .
- Guidance for adjustment is given from the second indicator information G2 and the character CH.
- the character CH is displayed on the same screen in association with the indicator information, the user can confirm guide information for position adjustment without switching the screen.
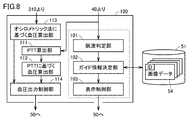
- FIG. 8 is a diagram schematically showing a configuration of a function for outputting guide information according to the first embodiment in association with a blood pressure measurement function.
- CPU 100 determines pulse information using pulse wave determination unit 101, image data 54 of memory 51, guide information determination unit 102 and display control unit 103.
- the CPU 100 calculates a PTT according to the above-described process
- the PTT calculation unit 111 calculates (estimates) a blood pressure based on PTT according to the above known equation
- a blood pressure output control unit 114 according to the oscillometric method for calculating (estimating) the blood pressure based on the oscillometric method described above.
- image data 54 is stored corresponding to each of the sets of (the amplitude of the first pulse wave signal PS1 and the amplitude of the second pulse wave signal PS2) that can be detected.
- the corresponding set of image data 54 is indicated by an identification (ID) assigned to the image data 54.
- the image data 54 includes a pictogram group indicating magnitudes of amplitudes of the first pulse wave signal PS1 and the second pulse wave signal PS2, and an image of the characters "left” and "right”.
- Image data 54 corresponding to a set of (the magnitude of the amplitude of the first pulse wave signal PS1 and the magnitude of the amplitude of the second pulse wave signal PS2) is generated based on an experiment or the like, and stored in the memory 51. It is stored in association with it.
- the pulse wave determination unit 101 compares the magnitudes of the amplitudes of the first pulse wave signal PS1 and the second pulse wave signal PS2 with the threshold value TA, and based on the comparison result, the condition of (amplitude size> threshold value TA) is satisfied. It is determined whether or not.
- the wearing condition is the desired wearing condition for blood pressure measurement based on PTT, ie measurement It is the wearing state which can maintain accuracy.
- the guide information determination unit 102 determines guide information to be output. Specifically, the guide information determination unit 102 detects the amplitudes of the first pulse wave signal PS1 and the second pulse wave signal PS2, and detects (the magnitude of the amplitude of the first pulse wave signal PS1, the second pulse The memory 51 is searched based on the combination of the wave signal PS2 and the amplitude). The guide information determination unit 102 reads from the memory 51 the image data 54 to which an ID matching the combination is assigned.
- the display control unit 103 generates a control signal to be displayed on the display 50 based on the image data 54 from the guide information determination unit 102.
- the display 50 displays first indicator information G1 and second indicator information G2 based on magnitudes of amplitudes of the first pulse wave signal PS1 and the second pulse wave signal PS2 detected. Is displayed.
- the functions of the units in FIG. 8 are stored in the memory 51 as a program.
- the CPU 100 realizes the functions of the respective units by reading and executing a program from the memory 51.
- the function of each part is not limited to the method realized by the program.
- it may be realized by a circuit including an application specific integrated circuit (ASIC) or a field-programmable gate array (FPGA).
- ASIC application specific integrated circuit
- FPGA field-programmable gate array
- it may be realized by a combination of a program and a circuit.
- the guide information is not limited to the image data 54 stored in the memory 51.
- image data for display control may be generated by executing an image generation program including a script program.
- the combination (the magnitude of the amplitude of the first pulse wave signal PS1 and the magnitude of the amplitude of the second pulse wave signal PS2) described above becomes a parameter (such as an argument) of the script program.
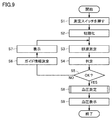
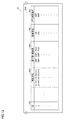
- FIG. 9 is a flowchart showing the process of blood pressure measurement based on the output of guide information and PTT according to the first embodiment.
- a program according to this flowchart is stored in the memory 51, read by the CPU 100, and executed.
- CPU 100 receives a start instruction when the user performs a switch operation to start blood pressure measurement of PTT at operation unit 52 in the wearing state (step S1).
- the CPU 100 performs an initialization process when starting blood pressure measurement (step S2). For example, exhaust air from the cuff.
- the CPU 100 starts processing of pulse wave measurement for PTT (step S3).
- the pulse wave determination unit 101 acquires the first pulse wave signal PS1 and the second pulse wave signal PS2 measured from the sensor unit 40, and the magnitudes of the amplitudes of the acquired first and second pulse wave signals PS1 and PS2 It is determined whether the condition of (amplitude> threshold value TA) is satisfied (step S4).
- the CPU 100 determines, based on the output of the pulse wave determination unit 101, whether the above condition is satisfied (step S5). If it is determined that the condition is satisfied (YES in step S5), the CPU 100 evaluates the mounting state as "OK" and performs blood pressure measurement based on PTT in step S8 described later.
- step S5 when it is determined that the condition is not satisfied (NO in step S5), CPU 100 evaluates that the mounting state is "NG". Further, the guide information determination unit 102 determines guide information (step S6), and the display control unit 103 controls the display of the display 50 according to the guide information (step S7). Then, it transfers to step S3 and implements the following processes similarly to the above.
- step S8 When the PTT-based blood pressure measurement is performed (step S8), the measured blood pressure is displayed on the display 50 (step S9). Also, the measurement result is stored in the memory 51.
- step S8 PTT is calculated by the PTT calculation unit 111, and the blood pressure calculation unit 112 based on PTT calculates (estimates) the blood pressure based on the calculated PTT.
- step S 8 blood pressure measurement based on PTT (step S 8) is not performed while the wearing state is evaluated as “NG”, but PTT calculation is performed even when the wearing state is evaluated as “NG”
- the calculation of PTT by the unit 111 and the calculation (estimate) of blood pressure based on the PTT by the blood pressure calculation unit 112 based on the PTT may be performed.
- the wearing state "NG” is continuously evaluated a predetermined number of times, or when the time when the wearing state "NG” is evaluated continuously exceeds a predetermined time (for example, start When receiving the instruction (when a predetermined time has elapsed since step S1), the blood pressure measurement based on PPT (step S8) may be performed in the evaluation of the wearing state “NG”.
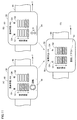
- FIGS. 10A and 10B are display examples when the mounting state is “NG”, and on the screen of the display 50, information 93 indicating the evaluation of the mounting state (“NG”), and measurement Information 94 for guiding the direction in which the position of the sensor unit 40 with respect to the part is moved is displayed on the same screen as the other information (the indicator information G1, G2 and the character CH).
- Information 94 in FIG. 10A is information for guiding the circular casing of the display 50 to rotate concentrically at the center of the circle, and is indicated by an arrow mark indicating the rotation direction.
- information 94 in FIG. 10B is information for guiding moving the housing of the display 50 in the vertical direction, and is indicated by an arrow mark indicating the vertical direction.
- FIG. 10C is a display example in the case where the mounting state is evaluated as “OK”, and the display 50 displays information 93 indicating the evaluation of the mounting state (“OK”) and the information 94 of the moving direction described above.
- information 95 for guiding fixing of the position of the sensor unit 40 is displayed on the same screen together with other information (the indicator information G1, G2 and the character CH).
- the fixed guide information 95 is, for example, a message "Please fix", but is not limited to this.
- the information 95 guiding the fixing of the position of the sensor unit 40 is replaced with the information 93 and the information 94 when the mounting state is evaluated as "NG”. , And displayed on the display 50.
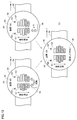
- FIG. 11 shows a case where the housing (screen) of the display 50 is rectangular.
- FIG. 11A and FIG. 11B are display examples when the mounting state is evaluated as “NG”.
- Information 94 in FIG. 11A is information for guiding the rectangular casing of the display 50 to rotate concentrically at the center of the rectangle, and is an arrow mark indicating the rotation direction (the two arrows having different directions. Shown in the figure).
- FIG. 11C is a display example in the case where the mounting state is evaluated as “OK”.
- FIG. 12 is a modification of FIG. In FIG. 12A, the information 94 is indicated not by a set of two arrow marks different in the direction of the information 94 of FIG. 11A, but by a single arrow in both directions.
- the movement is vertical movement or rotational movement according to the information 94 on the same screen. You will be guided as to which to do. Therefore, the user operates the housing of the display 50 in accordance with the moving direction of the information 94 to efficiently adjust the relative positional relationship between the sensor unit 40 and the measurement site so that the mounting state is "OK". can do.
- the guide information (corresponding to the icon of the arrow mark) as to whether the movement should be performed in the vertical direction or the rotational movement (the magnitude of the amplitude of the first pulse wave signal PS1 and the amplitude of the second pulse wave signal PS2)
- the information is determined based on the combination of (size) and is included in advance in the image data 54 described above in association with the set.
- the above-mentioned display was a case where the sphygmomanometer 1 was attached to the left wrist 90, it can be implemented similarly, also when attaching to the right wrist.
- the arrangement of the first pulse wave sensor 40-1 and the second pulse wave sensor 40-2 with respect to the measurement site is the reverse of the case of mounting on the left wrist 90.
- the display positions of the corresponding first indicator information G1 and second indicator information G2 on the display 50 are also reversed.
- the CPU 100 can determine whether the site on which the sphygmomanometer 1 is attached is the left wrist or the right wrist, based on user input from the operation unit 52.
- the sphygmomanometer 1 may be equipped with an acceleration sensor, and the CPU 100 may determine, from the output of the acceleration sensor, which side it is attached to on the left or right.
- FIG. 13 is a diagram showing an example of storage of measurement results according to the first embodiment.
- memory 51 stores a table 394 for recording the measurement results of blood pressure monitor 1.
- table 394 stores measurement data in record units.
- Each record includes ID (identification) data 39E for uniquely identifying the record, measurement date and time data 39G, blood pressure values calculated (estimated) by the blood pressure calculation unit 113 according to the oscillometric method (systolic blood pressure SBP and Data 39H including diastolic blood pressure DBP) and pulse rate PLS, data 39I representing "OK” or "NG” which is an evaluation of the wearing condition at the time of blood pressure measurement based on PTT, and calculated by blood pressure calculation unit 112 based on PTT Data 39J indicating the estimated blood pressure value is associated and included.
- the blood pressure output control unit 114 stores in the memory 51 the blood pressure and pulse rate data 39H according to the oscillometric method measured according to the measurement date and time, and the data 39J of the blood pressure value based on the PTT in association with the measurement date data 39G.
- the manner of storing measurement data in the table 394 is not limited to the record unit as shown in FIG. Any mode may be used as long as the detected data 39E to 39J are associated (linked) each time the blood pressure is measured.
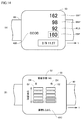
- FIG. 14 is a diagram showing another display example according to the first embodiment.
- evaluation 40B of the wearing state on the screen of display 50, evaluation 40B of the wearing state, systolic blood pressure SBP, diastolic blood pressure DBP and pulse rate PLS, and measured blood pressure EBP based on PTT are shown as measurement results.
- Data of measurement date and time are displayed.
- FIG. 14 (A) it is displayed by the character of "GOOD" that evaluation of the mounting state was "OK" by evaluation 40B of the mounting state.
- the user can also obtain an indication of the reliability as to whether the displayed blood pressure EBP is a reliable value from the information of the evaluation 40B of the wearing state.
- the display example shown in FIG. 14A corresponds to, for example, a display example when the blood pressure measurement ends (step S9) or a display example of data read from the table 394 in FIG.
- the blood pressure output control unit 114 controls the display 50 to display the information on the blood pressure in FIG. Specifically, the blood pressure output control unit 114 generates display data based on the blood pressure calculated by the blood pressure calculation unit 112 based on PTT or the blood pressure value calculated by the blood pressure calculation unit 113 based on oscillometric method, The display 50 is driven based on the display data. Alternatively, the blood pressure output control unit 114 generates display data based on the associated data 39H and data 39J of the table 394 of FIG. 13 and drives the display 50 based on the generated display data. Thereby, the blood pressure output control unit 114 can display the measured blood pressure data or the blood pressure data stored in the table 394 on the display 50.
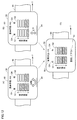
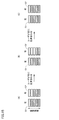
- FIG. 15 is a diagram showing still another display example according to the first embodiment.
- the guide information in FIG. 15 includes not only the amplitude value (signal strength) of the first pulse wave signal PS1 or the second pulse wave signal PS2 from the first pulse wave sensor 40-1 or the second pulse wave sensor 40-2. It also presents the change in amplitude value.
- the guide information based on the amplitude value is from FIG. 15 (A) ⁇ FIG. 15 (B) ⁇ FIG. And changing cases are shown.
- the amplitude value (signal strength) of the first pulse wave signal PS1 exceeds the threshold value TA (here, it corresponds to four pictograms)
- the second The amplitude value of the pulse wave signal PS2 is less than the threshold value TA.
- the user adjusts the position of the sensor unit 40 by pushing the display 50 in the right direction in accordance with the guide information of FIG.
- the CPU 100 determines that the amplitude value of the second pulse wave signal PS2 has changed from the amplitude value before movement shown in FIG. 15A and has become smaller, the CPU 100 performs processing as shown in FIG. , The color of the pictogram of the second indicator information G2 is changed. This change in display color can guide the user that the position adjustment is not appropriate.
- the user adjusts the position of the sensor unit 40 by pushing the display 50 in the left direction according to the change of the color of the second indicator information G2 in FIG.
- the position of the sensor unit 40 (the first pulse wave sensor 40-1 and the second pulse wave sensor 40-2) moves directly above the radial artery 91.
- the CPU 100 determines that the amplitude value of the second pulse wave signal PS2 has changed and become larger than the amplitude value before the movement of FIG. 15 (B), and based on the determination, as shown in FIG. Then, the pictogram of the second indicator information G2 is changed to the original color.
- the guide information in FIG. 15C can guide the user that the position adjustment was appropriate.
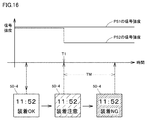
- FIG. 16 is a diagram showing still another display example according to the first embodiment.
- the change of the signal intensity (pulse wave amplitude value) of the first pulse wave signal PS1 and the second pulse wave signal PS2 according to the passage of time, and the display of the icon 50-4 showing the evaluation of the wearing state A change of aspect is shown.
- the signal intensity (pulse wave amplitude value) of the first pulse wave signal PS1 and the second pulse wave signal PS2 exceeds the threshold value TA from the start of mounting to time T1. Therefore, from the mounting start to the time T1, the CPU 100 displays the icon 50-4 of the display 50 with characters and colors representing the mounting state "OK".
- the CPU 100 changes the icon 50-4 of the display 50 to a character and color representing the wearing state "attention".
- CPU 100 determines that the state in which the pulse wave amplitude value is equal to or less than threshold value TA continues from time T1 for a predetermined time (for example, time TM)
- CPU 100 displays icon 50-4 on display 50. , Change the character and color representing the mounting state "NG”.
- the guide information when the guide information is displayed, the magnitude of the amplitude of the pulse wave signal of the first pulse wave signal PS1 or the magnitude of the amplitude of the pulse wave signal of the second pulse wave signal PS2 has changed.
- the guide information may include information for notifying the change. Therefore, it is possible to guide the change of the evaluation of the wearing state to the user by the change of the character and the color by the icon 50-4.
- the device blood pressure monitor 1 or the portable terminal 10B described later
- the strength or period of the vibration is changed in conjunction with the change of the guide information by the icon 50-4. It is also good.
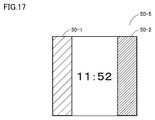
- FIG. 17 is a diagram showing still another display example according to the first embodiment.
- the icon 50-5 displayed on the display 50 has a portion 50-1 indicating the evaluation of the wearing state and a portion 50-2 indicating the evaluation of the blood pressure EBP measured based on the PTT.
- the CPU 100 changes the color of the portion 50-1 of the evaluation of the wearing state of the icon 50-5 and the color of the portion 50-2 of the evaluation of the blood pressure EBP in accordance with the contents of the corresponding evaluation. In this way, the user is guided while relating the evaluation of the wearing state (“OK”, “NG”, “reseating”, etc.) and the evaluation of the measured blood pressure EBP (normal blood pressure, hypertension, etc.) Can.
- the time to carry out the determination of the mounting state of the sphygmomanometer 1 is not limited to the time of blood pressure measurement according to the PTT described above (see FIG. 9).
- the CPU 100 may periodically determine the wearing state, and may display the above-described guide information based on the determination result.
- the pulse wave determination unit 101 of the CPU 100 determines that the sphygmomanometer 1 is being worn, the condition of (magnitude of amplitude> threshold value TA) is always (for example, at regular fixed intervals) To determine if Then, the guide information determination unit 102 sets guide information including the evaluation (OK or NG) of the mounting state, and the display control unit 103 displays the guide information on the display 50.
- This display mode is shown, for example, in FIG. 10 (A), FIG. 10 (B), FIG. 11 (A), FIG. 11 (B), or FIG. 12 (A), FIG. 12 (B).
- CPU 100 determines that peak A1 of pulse wave signal PS1 or peak A2 of pulse wave signal PS2 detected in the attached state of sphygmomanometer 1 is less than threshold value TA, or is less than threshold value TA.
- an alarm 40C or an error prompting the user to reattach is displayed on the display 50 (see FIG. 14B).
- the peak A1 of the pulse wave signal PS1 or the peak A2 of the pulse wave signal PS2 is less than the threshold value TA1 ( ⁇ TA)
- the peak A1 of the pulse wave signal PS1 or the peak A2 of the pulse wave signal PS2 is the threshold value TA1.
- the CPU 100 displays an alarm 40C (or an error) on the display 50 (see FIG. 14B).
- the text message of 'reinserted' is shown as the alarm 40C, but it is not limited to the text message, and may be other information including a predetermined image (moving image, still image). Good.
- the user can always check whether or not the wearing state is appropriate or not, by checking the screen of the display 50.
- the output mode of the information 93 or the alarm 40C representing the evaluation ("OK" or "NG") of the wearing state during wearing is not limited to the display of the display 50, but is another mode including audio output or vibration. It may be.
- FIG. 18 is a diagram showing a schematic configuration of a system according to a second embodiment.
- the sphygmomanometer 1 described above communicates with the server 30 or the portable terminal 10 B, which is an external information processing device, via the network 900.
- the sphygmomanometer 1 communicates with the portable terminal 10B via the LAN, and the portable terminal 10B communicates with the server 30 via the Internet.
- the sphygmomanometer 1 can communicate with the server 30 via the portable terminal 10B.
- the sphygmomanometer 1 may communicate with the server 30 without passing through the portable terminal 10B.
- the CPU 100 evaluates the wearing state
- the information 93 or the alarm 40C may be transmitted to the portable terminal 10B and displayed on the display unit 158.
- the sphygmomanometer 1 can output the evaluation of the wearing state from the display of the display unit 158 of the portable terminal 10B.
- the portable terminal 10B may notify the information 93 of the evaluation of the wearing state or the alarm 40C in another output mode including vibration or voice of the portable terminal 10B.
- the measurement result (FIG. 14A) is displayed on the display 50 of the sphygmomanometer 1, but the display destination may be the display unit 158 of the portable terminal 10B. And the display unit 158 may be used.
- the storage destination of the measurement results shown in the table 394 of FIG. 13 is not limited to the memory 51 of the sphygmomanometer 1.
- the storage unit of the portable terminal 10B or the storage unit 32A of the server 30 may be used. Alternatively, it may be stored in two or more of the memory 51, the storage unit of the portable terminal 10B, and the storage unit 32A of the server 30.
- a program that causes a computer to function to execute control as described in the above-described flowchart.
- a program is recorded on a non-temporary computer readable recording medium such as a CD (Compact Disk Read Only Memory) attached to the computer of the blood pressure monitor 1, a secondary storage device, a main storage device and a memory card. It can also be provided.
- the program can be provided by being recorded in a recording medium such as a hard disk built in the computer.
- the program can be provided by downloading via the network 900.
Abstract
The purpose of the present invention is to present information for positioning a pulse wave sensor relative to a site to be measured. A measurement device is provided with: a belt that is wrappingly attached to a site to be measured for pulse wave propagation time; a sensor unit provided on the inner peripheral surface of the belt which will be toward the site to be measured when the belt is worn; and a display (50) provided on the outer peripheral surface which is on the opposite side of the inner peripheral surface of the belt. On the outer peripheral surface, the display is provided on a portion which may face a portion whereat the sensor unit is positioned when the belt is worn. The sensor unit comprises a first pulse wave sensor and a second pulse wave sensor which are spaced apart from each other in the width direction of the belt. On the display are displayed first indicator information showing the first pulse wave amplitude indicated by the output of the first pulse wave sensor and second indicator information showing the second pulse wave amplitude indicated by the output of the second pulse wave sensor at positions corresponding to the first pulse wave sensor and the second pulse wave sensor, respectively.
Description
本開示は、表示制御装置およびプログラムに関し、特に、脈波情報の表示制御装置およびプログラムに関する。
The present disclosure relates to a display control device and program, and more particularly to a display control device and program of pulse wave information.
脈波を検出するために、脈波検出センサを動脈上に位置合わせするための方法が提案されている。例えば、特許文献1(特開2004-222814号公報)は、一列に配列された圧力検出素子による検出圧脈波の大きさが表示器に表示される点を開示する。また、特許文献2(国際公開第98/51025号)は、検出脈波の振幅値の表示を見ながら脈波検出回路の位置調整を行う構成を開示する。
Methods have been proposed for aligning pulse wave detection sensors on arteries to detect pulse waves. For example, Patent Document 1 (Japanese Patent Application Laid-Open No. 2004-222814) discloses that the magnitude of a pressure pulse wave detected by pressure detection elements arranged in a line is displayed on a display. Patent Document 2 (WO 98/51025) discloses a configuration for adjusting the position of a pulse wave detection circuit while viewing the display of the amplitude value of a detected pulse wave.
従来、動脈を伝播する脈波の伝播時間(脈波伝播時間;Pulse Transit Time;PTT)から血圧を推定(測定)する方法が知られている。PTTは、動脈上の異なる2点のそれぞれで脈波センサにより脈波信号を検出し、2点間で脈波振幅のピーク(最大)が検出される時間差から求められる。したがって、高い血圧測定精度を得るために、脈波センサを動脈上に確実に位置合わせするための情報の提示が望まれる。しかし、特許文献1および特許文献2は、脈波伝搬時間を測定する場合の脈波センサを位置合わせするための情報を提示しない。
Conventionally, there is known a method of estimating (measuring) the blood pressure from the propagation time of a pulse wave propagating through an artery (pulse wave transit time; PTT). The PTT is obtained from the time difference in which the pulse wave signal is detected by the pulse wave sensor at each of two different points on the artery and the peak (maximum) of the pulse wave amplitude is detected between the two points. Therefore, in order to obtain high blood pressure measurement accuracy, presentation of information for reliably aligning the pulse wave sensor on the artery is desired. However, Patent Document 1 and Patent Document 2 do not present information for aligning the pulse wave sensor when measuring the pulse wave propagation time.
本開示のある局面における目的は、脈波伝搬時間を測定する場合に、測定部位に対する脈波センサを位置合わせするための情報を提示する表示制御装置およびプログラムを提供することである。
An object in one aspect of the present disclosure is to provide a display control device and a program that present information for aligning a pulse wave sensor with respect to a measurement site when measuring a pulse wave propagation time.
この発明のある局面に従うと、測定装置に備えられる表示制御装置が提供される。測定装置は、脈波伝搬時間の測定部位に巻き付け装着されるベルトと、ベルトが装着される場合にベルトの測定部位の側となる面である内周面に設けられるセンサ部と、ベルトの内周面とは反対側の面である外周面に設けられるディスプレイと、を備える。
According to an aspect of the present invention, a display control device provided in a measurement device is provided. The measuring device includes a belt wound around and mounted at a measurement site of pulse wave propagation time, a sensor section provided on an inner circumferential surface which is a surface on the side of the measurement site of the belt when the belt is mounted, and And a display provided on an outer peripheral surface which is a surface opposite to the peripheral surface.
ディスプレイは、外周面において、ベルトが装着される場合にセンサ部が位置する部位と対向し得る部位に設けられ、センサ部は、ベルトの幅方向に互いに離間した配置で設けられる第1脈波センサおよび第2脈波センサを含む。
The display is provided on the outer peripheral surface at a portion that can face the portion where the sensor unit is located when the belt is mounted, and the sensor unit is provided at a position apart from each other in the width direction of the belt And a second pulse wave sensor.
表示制御装置は、ディスプレイにおいて、離間して配置された第1脈波センサおよび第2脈波センサのそれぞれに対応した位置で、第1脈波センサの出力が示す第1脈波振幅の大きさを表す第1インジケータ情報および第2脈波センサの出力が示す第2脈波振幅の大きさを表す第2インジケータ情報をそれぞれ表示する。
The display control device is configured such that, in the display, the magnitude of the first pulse wave amplitude indicated by the output of the first pulse wave sensor at a position corresponding to each of the first pulse wave sensor and the second pulse wave sensor disposed apart from each other. And second indicator information representing the magnitude of the second pulse wave amplitude indicated by the output of the second pulse wave sensor.
好ましくは、表示制御装置は、第1脈波振幅の大きさ、および第2脈波振幅の大きさに従うガイド情報であって、センサ部と測定部位との相対的な位置関係を調整するためのガイド情報を、ディスプレイに表示する。
Preferably, the display control device is guide information according to the magnitude of the first pulse wave amplitude and the magnitude of the second pulse wave amplitude, and is for adjusting the relative positional relationship between the sensor unit and the measurement site. Display guide information on the display.
好ましくは、表示制御装置は、ガイド情報を、ディスプレイにおいて、第1インジケータ情報および第2インジケータ情報と同一画面に表示する。
Preferably, the display control device displays the guide information on the same screen as the first indicator information and the second indicator information on the display.
好ましくは、ガイド情報は、測定部位に対するセンサ部の位置を移動させる方向をガイドする情報を含む。
Preferably, the guide information includes information for guiding a direction in which the position of the sensor unit with respect to the measurement site is moved.
好ましくは、第1脈波振幅の大きさ、または第2脈波振幅の大きさが予め定められた大きさを示さない場合、ガイド情報は移動させる方向をガイドする情報を表示する。
Preferably, when the magnitude of the first pulse wave amplitude or the magnitude of the second pulse wave amplitude does not indicate a predetermined magnitude, the guide information displays information for guiding the moving direction.
好ましくは、第1脈波振幅の大きさ、および第2脈波振幅の大きさが予め定められた大きさを示す場合、ガイド情報はセンサ部の位置を固定することをガイドする情報を含む。
Preferably, when the magnitude of the first pulse wave amplitude and the magnitude of the second pulse wave amplitude indicate a predetermined magnitude, the guide information includes information for guiding fixing of the position of the sensor unit.
好ましくは、第1脈波振幅の大きさ、および第2脈波振幅の大きさが予め定められた大きさを示す場合、ガイド情報は、移動させる方向をガイドする情報に代えて、センサ部の位置を固定することをガイドする情報を含む。
Preferably, when the magnitude of the first pulse wave amplitude and the magnitude of the second pulse wave amplitude indicate predetermined magnitudes, the guide information replaces the information for guiding the direction of movement, and It contains information to guide fixing the position.
好ましくは、第1脈波振幅の大きさを示す情報および第2脈波振幅の大きさを示す情報は、それぞれ、当該脈波振幅の大きさが予め定められた大きさを示す場合の表示態様と、当該予め定められた大きさを示さない場合の表示態様とは異なる。
Preferably, the information indicating the magnitude of the first pulse wave amplitude and the information indicating the magnitude of the second pulse wave amplitude each have a display mode in the case where the magnitude of the pulse wave amplitude indicates a predetermined magnitude. And the display mode in the case where the predetermined size is not indicated.
好ましくは、ガイド情報は、測定部位に対する装着の状態を評価する情報を含み、評価する情報は、装着中に、第1脈波振幅の大きさ、および第2脈波振幅の大きさが予め定められた大きさを示す場合と、第1脈波振幅の大きさ、または第2脈波振幅の大きさが予め定められた大きさを示さない場合とで異なる評価を示す。
Preferably, the guide information includes information for evaluating the state of attachment to the measurement site, and the information to be evaluated predetermines the magnitude of the first pulse wave amplitude and the magnitude of the second pulse wave amplitude during attachment. In the case of indicating the determined magnitude, and in the case where the magnitude of the first pulse wave amplitude or the magnitude of the second pulse wave amplitude does not indicate the predetermined magnitude, different evaluations are indicated.
好ましくは、第1脈波振幅の大きさ、または第2脈波振幅の大きさが予め定められた大きさを示さない場合、ガイド情報は、巻き付け装着のしなおしを促す情報を含む。
Preferably, when the magnitude of the first pulse wave amplitude or the magnitude of the second pulse wave amplitude does not indicate a predetermined magnitude, the guide information includes information prompting re-rolling of the winding.
好ましくは、測定装置は、表示部を備える外部の情報処理装置と通信する通信部を、さらに備え、ガイド情報を、表示部に表示させるために通信部を介して情報処理装置に送信する。
Preferably, the measurement apparatus further includes a communication unit that communicates with an external information processing apparatus including a display unit, and transmits guide information to the information processing apparatus via the communication unit in order to cause the display unit to display the guide information.
好ましくは、脈波伝搬時間は、第1脈波振幅の大きさおよび第2脈波振幅の大きさから算出され、測定装置は、脈波伝搬時間に基づく血圧を算出する。
Preferably, the pulse wave propagation time is calculated from the magnitude of the first pulse wave amplitude and the magnitude of the second pulse wave amplitude, and the measurement device calculates the blood pressure based on the pulse wave transit time.
好ましくは、ガイド情報は、測定部位に対する装着の状態を評価する情報を含み、表示制御装置は、装着の状態を評価する情報を、算出された血圧を評価する情報と関連づけて表示する。
Preferably, the guide information includes information for evaluating the state of attachment to the measurement site, and the display control device displays the information for evaluating the state of attachment in association with the information for evaluating the calculated blood pressure.
好ましくは、表示制御装置は、さらに、ガイド情報を表示する場合、第1脈波振幅の大きさまたは第2脈波振幅の大きさが変化したとき、当該ガイド情報に当該変化を報知する情報を含める。
Preferably, when the display control device further displays guide information, when the magnitude of the first pulse wave amplitude or the magnitude of the second pulse wave amplitude changes, information for notifying the change in the guide information is displayed. include.
この発明の他の局面に従うと、装置における表示制御方法をコンピュータに実行させるためのプログラムが提供される。この装置は、脈波伝搬時間の測定部位に巻き付け装着されるベルトと、ベルトが装着される場合にベルトの測定部位の側となる面である内周面に設けられるセンサ部と、ベルトの内周面とは反対側の面である外周面に設けられるディスプレイと、を備え、ディスプレイは、外周面において、ベルトが装着される場合にセンサ部が位置する部位と対向し得る部位に設けられ、センサ部は、ベルトの幅方向に互いに離間した配置で設けられる第1脈波センサおよび第2脈波センサを含む。表示制御方法は、ディスプレイにおいて、離間して配置された第1脈波センサおよび第2脈波センサのそれぞれに対応した位置で、第1インジケータ情報および第2インジケータ情報をそれぞれ表示する。
According to another aspect of the present invention, there is provided a program for causing a computer to execute a display control method in an apparatus. This device comprises a belt wound around and mounted at a measurement site of pulse wave propagation time, a sensor section provided on an inner peripheral surface which is a surface on the side of the measurement site of the belt when the belt is mounted, and A display provided on an outer circumferential surface which is a surface opposite to the circumferential surface, the display being provided on the outer circumferential surface at a portion which can face a portion where the sensor unit is located when the belt is attached, The sensor unit includes a first pulse wave sensor and a second pulse wave sensor provided at mutually spaced positions in the width direction of the belt. The display control method causes the display to display the first indicator information and the second indicator information respectively at positions corresponding to the first pulse wave sensor and the second pulse wave sensor disposed apart from each other.
本開示によると、脈波伝搬時間を測定する場合に脈波センサを位置合わせするための情報を提示することが可能となる。
According to the present disclosure, it is possible to present information for aligning the pulse wave sensor when measuring the pulse wave propagation time.
以下、図面を参照しつつ、本発明の実施の形態について説明する。以下の説明では、同一の部品には同一の符号を付してある。それらの名称および機能も同じである。したがって、それらについての詳細な説明は繰り返さない。
Hereinafter, embodiments of the present invention will be described with reference to the drawings. In the following description, the same components are denoted by the same reference numerals. Their names and functions are also the same. Therefore, not repeated detailed description thereof.
以下では、脈波伝搬時間(以下、PTTと称する)を測定する装置としてウェアラブル端末である血圧計を例示し、血圧計に「表示制御装置」を搭載するケースを説明する。ただし、「表示制御装置」を搭載する装置は、脈波信号を検出するセンサと、当該センサにより検出された信号を処理する処理装置とを含む装置であればよく、血圧計に限られない。また、血圧計は、ウェアラブル型の端末に限定されない。
Below, the sphygmomanometer which is a wearable terminal is illustrated as an apparatus which measures a pulse wave propagation time (it is hereafter called PTT), and the case where a "display control apparatus" is mounted in a sphygmomanometer is demonstrated. However, the device mounting the “display control device” may be any device including a sensor that detects a pulse wave signal and a processing device that processes a signal detected by the sensor, and is not limited to the sphygmomanometer. Further, the sphygmomanometer is not limited to a wearable terminal.
[実施の形態1]
<血圧計の構成>
図1は、実施の形態1に係る血圧計1の外観斜視図である。図2は、実施の形態1に係る血圧計1が左の手首90に装着された状態(以下、「装着状態」とも称する。)で、手首90の長手方向に対して垂直な断面を模式的に示す図である。本実施の形態では、左の手首90が測定部位となる。なお、「測定部位」は、動脈が通っている部位であればよく、手首に限定されない。測定部位は、例えば、右手首、上腕、足首、大腿などの下肢であってもよい。 First Embodiment
<Configuration of sphygmomanometer>
FIG. 1 is an external perspective view of thesphygmomanometer 1 according to the first embodiment. FIG. 2 schematically shows a cross section perpendicular to the longitudinal direction of the wrist 90 in a state in which the sphygmomanometer 1 according to the first embodiment is attached to the left wrist 90 (hereinafter also referred to as “mounted state”). FIG. In the present embodiment, the left wrist 90 is the measurement site. The “measurement site” may be a site through which an artery passes, and is not limited to the wrist. The measurement site may be, for example, the lower limbs such as the right wrist, the upper arm, the ankle, and the thigh.
<血圧計の構成>
図1は、実施の形態1に係る血圧計1の外観斜視図である。図2は、実施の形態1に係る血圧計1が左の手首90に装着された状態(以下、「装着状態」とも称する。)で、手首90の長手方向に対して垂直な断面を模式的に示す図である。本実施の形態では、左の手首90が測定部位となる。なお、「測定部位」は、動脈が通っている部位であればよく、手首に限定されない。測定部位は、例えば、右手首、上腕、足首、大腿などの下肢であってもよい。 First Embodiment
<Configuration of sphygmomanometer>
FIG. 1 is an external perspective view of the
図1および図2を参照して、ベルト20は、帯状の部材である。ベルト20は、その長手方向が手首90を周方向に対応するようにして、装着状態では、摺動可能に巻き付け装着される。ベルト20の幅方向Yの寸法(幅寸法)は、例えば、約30mmである。ベルト20は、帯状体23と、圧迫カフ21とを含む。帯状体23は、測定部位側の面である内周面23aおよび内周面23aの反対側の面である外周面20bを有する。実施の形態1では、ベルト20が測定部位に巻き付けが装着される場合、血圧計1の状態は「装着状態」となる。また、「装着中」は、この「装着状態」が継続する場合を示す。
Referring to FIGS. 1 and 2, belt 20 is a belt-like member. The belt 20 is slidably wound and mounted in the mounted state so that the longitudinal direction of the belt 20 corresponds to the circumferential direction of the wrist 90. The dimension (width dimension) in the width direction Y of the belt 20 is, for example, about 30 mm. Belt 20 includes a band 23 and a compression cuff 21. The strip 23 has an inner circumferential surface 23a which is a surface on the measurement site side and an outer circumferential surface 20b which is a surface opposite to the inner circumferential surface 23a. In the first embodiment, when the belt 20 is mounted on the measurement site, the sphygmomanometer 1 is in the “mounted state”. Also, "during mounting" indicates a case where the "mounted state" continues.
圧迫カフ21は、帯状体23の内周面23aに沿って取り付けられ、手首90に接する内周面20aを有する(図2参照)。圧迫カフ21は、伸縮可能な2枚のポリウレタンシートを厚さ方向に対向させ、それらの周縁部を溶着して、流体袋として構成されている。本実施の形態では、圧迫カフ21の流体袋は、流体を収容可能な袋状の部材であればよい。圧迫カフ21は、流体が供給されると膨張し、膨張に伴い測定部位は加圧される。また、流体が排出されると圧迫カフ21は収縮し、測定部位の加圧状態は解消される。
The compression cuff 21 is attached along the inner circumferential surface 23 a of the strip 23 and has an inner circumferential surface 20 a in contact with the wrist 90 (see FIG. 2). The compression cuff 21 is configured as a fluid bag by facing two stretchable polyurethane sheets in the thickness direction and welding their peripheral portions. In the present embodiment, the fluid bag of the compression cuff 21 may be a bag-like member capable of containing a fluid. The compression cuff 21 is inflated when the fluid is supplied, and the measurement site is pressurized as the compression cuff 21 is inflated. In addition, when the fluid is discharged, the compression cuff 21 contracts and the pressurization state of the measurement site is released.
本体10は、ベルト20のうちの一方の端部20eと一体に設けられる。なお、ベルト20と本体10とを別々に形成し、ベルト20に対して本体10を、係合部材(例えば、ヒンジ)を介して、一体に取り付ける構成でもよい。本実施の形態では、本体10が配置された部位は、装着状態において手首90の背側面(手の甲側の面)90bに対応する(図2参照)。図2中には、手首90内で掌側面(手の平側の面)90a近傍を通る橈骨動脈91が示されている。
The main body 10 is provided integrally with one end 20 e of the belt 20. The belt 20 and the main body 10 may be separately formed, and the main body 10 may be integrally attached to the belt 20 via an engaging member (for example, a hinge). In the present embodiment, the portion where the main body 10 is disposed corresponds to the back side surface (surface on the back side of the hand) 90b of the wrist 90 in the mounted state (see FIG. 2). In FIG. 2, a radial artery 91 passing near the palmar side (palm side) 90a in the wrist 90 is shown.
図1に示すように、本体10は、ベルト20の外周面20bに対して垂直な方向に厚さを有する立体的形状を有する。本体10は、ユーザの日常活動を妨げないように、小型で、薄厚に形成される。本体10は、ベルト20から外向きに突起した四角錐台状の輪郭を有する。
As shown in FIG. 1, the main body 10 has a three-dimensional shape having a thickness in a direction perpendicular to the outer circumferential surface 20 b of the belt 20. The main body 10 is small and thin so as not to interfere with the daily activities of the user. The main body 10 has a quadrangular frustum-shaped contour protruding outward from the belt 20.
本体10の頂面(測定部位から最も遠い側の面)10aには、ディスプレイ50が設けられる。本体10の側面(図1における左手前側の側面)10fに沿って、ユーザからの指示を入力するための操作部52が設けられる。
A display 50 is provided on the top surface (the surface farthest from the measurement site) 10 a of the main body 10. An operation unit 52 for inputting an instruction from the user is provided along the side surface 10f of the main body 10 (the left side front side surface in FIG. 1) 10f.
ベルト20の一方の端部20eと他方の端部20fとの間の部位であって、ベルト20の内周面20a(すなわち、圧迫カフ21の内周面20a)上には、センサ部40が設けられる。センサ部40は、インピーダンス測定機能を用いて脈波を検出する機能を備える。
A sensor section 40 is provided on the inner peripheral surface 20a of the belt 20 (that is, the inner peripheral surface 20a of the compression cuff 21) at a portion between the one end 20e and the other end 20f of the belt 20. Provided. The sensor unit 40 has a function of detecting a pulse wave using an impedance measurement function.
センサ部40が配置された部位の内周面20aには、電極群40Eが配置される。電極群40Eは、ベルト20の幅方向Yにおいて互いに離間した状態で配置された6個の板状(またはシート状)の電極41~46を有する。電極群40Eが配置された部位は、装着状態において手首90の橈骨動脈91に対応する。
An electrode group 40E is disposed on the inner circumferential surface 20a of the portion where the sensor unit 40 is disposed. The electrode group 40E has six plate-like (or sheet-like) electrodes 41 to arranged in a state of being separated from each other in the width direction Y of the belt 20. The part where the electrode group 40E is disposed corresponds to the radial artery 91 of the wrist 90 in the mounted state.
外周面21aにおける、電極群40Eに対応する位置には、固形物22が配置されてもよい。固形物22の外周側には、押圧カフ24が配置される。押圧カフ24は、圧迫カフ21の周方向において電極群40Eに対応する領域を局所的に抑圧する拡張部材である。押圧カフ24は、ベルト20を構成する帯状体23の内周面23aに配置される(図2参照)。帯状体23は、厚さ方向において可撓性を有し、周方向(長手方向)において非伸縮性を有するプラスチック材料から構成される。
The solid 22 may be disposed at a position corresponding to the electrode group 40E on the outer circumferential surface 21a. A pressure cuff 24 is disposed on the outer peripheral side of the solid 22. The pressing cuff 24 is an expanding member that locally suppresses a region corresponding to the electrode group 40E in the circumferential direction of the compression cuff 21. The pressure cuff 24 is disposed on the inner circumferential surface 23 a of the strip 23 that constitutes the belt 20 (see FIG. 2). The strip 23 is made of a plastic material that is flexible in the thickness direction and inelastic in the circumferential direction (longitudinal direction).
押圧カフ24は、ベルト20の厚さ方向に伸縮する流体袋であり、流体の供給により加圧状態となり、流体の排出により非加圧状態となる。押圧カフ24は、例えば、伸縮可能な2枚のポリウレタンシートを厚さ方向に対向させ、それらの周縁部を溶着して、流体袋として構成されている。
The pressing cuff 24 is a fluid bag that expands and contracts in the thickness direction of the belt 20, and is pressurized by the supply of fluid and is not pressurized by discharging the fluid. The pressure cuff 24 is configured as, for example, a fluid bag by facing two stretchable polyurethane sheets in the thickness direction and welding their peripheral portions.
押圧カフ24の内周面24aのうち、電極群40Eに対応する位置には、固形物22が配置されている。固形物22は、例えば、厚さ1~2mm程度の板状の樹脂(例えば、ポリプロピレン)で構成されている。本実施の形態では、押圧部として、ベルト20、押圧カフ24、および固形物22を用いている。
The solid 22 is disposed at a position corresponding to the electrode group 40 </ b> E on the inner circumferential surface 24 a of the pressing cuff 24. The solid 22 is made of, for example, a plate-like resin (for example, polypropylene) having a thickness of about 1 to 2 mm. In the present embodiment, the belt 20, the pressing cuff 24, and the solid 22 are used as the pressing portion.
図1に示すように、本体10の底面(測定部位に最も近い側の面)10bと、ベルト20の端部20fとは、三つ折れバックル15(以下、単に「バックル15」とも称する。)によって接続されている。
As shown in FIG. 1, the bottom surface 10b (the surface closest to the measurement site) 10b of the main body 10 and the end 20f of the belt 20 are three-fold buckles 15 (hereinafter, also simply referred to as "buckles 15"). Connected by.
バックル15は、外周側に配置された板状部材25と、内周側に配置された板状部材26とを含む。板状部材25の一方の端部25eは、幅方向Yに沿って延びる連結棒27を介して本体10に対して回動自在に取り付けられる。板状部材25の他方の端部25fは、幅方向Yに沿って延びる連結棒28を介して、板状部材26の一方の端部26eに対して回動自在に取り付けられる。板状部材26の他方の端部26fは、固定部29によってベルト20の端部20f近傍に固定されている。
The buckle 15 includes a plate-like member 25 disposed on the outer circumferential side and a plate-like member 26 disposed on the inner circumferential side. One end 25 e of the plate member 25 is rotatably attached to the main body 10 via a connecting rod 27 extending along the width direction Y. The other end 25 f of the plate 25 is rotatably attached to one end 26 e of the plate 26 via a connecting rod 28 extending in the width direction Y. The other end 26 f of the plate member 26 is fixed by the fixing portion 29 in the vicinity of the end 20 f of the belt 20.
ベルト20の周方向において、固定部29の取り付け位置は、ユーザの手首90の周囲長に合わせて予め可変して設定されている。これにより、血圧計1(ベルト20)は、全体として略環状に構成されるとともに、本体10の底面10bとベルト20の端部20fとが、バックル15によって図1中の矢印B方向に開閉可能に構成される。
In the circumferential direction of the belt 20, the mounting position of the fixing portion 29 is variably set in advance in accordance with the circumferential length of the wrist 90 of the user. Thereby, the sphygmomanometer 1 (belt 20) is generally formed in a substantially annular shape, and the bottom surface 10b of the main body 10 and the end 20f of the belt 20 can be opened and closed in the arrow B direction in FIG. Configured
ユーザは、血圧計1を手首90に装着する際、バックル15を開いてベルト20の環の径を大きくした状態で、図1中の矢印Aで示す方向からベルト20に左手を通す。次に、図2に示すように、ユーザは、手首90の周りのベルト20の角度位置を摺動させる等して調節し、橈骨動脈91上に位置するようにセンサ部40を移動させる。これにより、センサ部40の電極群40Eは、手首90の掌側面90aのうち橈骨動脈91に対応する部分90a1に当接する状態となる。この状態で、ユーザは、バックル15を閉じて固定する。このようにして、ユーザは血圧計1(ベルト20)を手首90に巻き付け装着する。
When mounting the sphygmomanometer 1 on the wrist 90, the user passes the left hand through the belt 20 from the direction indicated by the arrow A in FIG. 1 with the buckle 15 opened and the diameter of the ring of the belt 20 increased. Next, as shown in FIG. 2, the user adjusts the angular position of the belt 20 around the wrist 90 by sliding or the like, and moves the sensor unit 40 so as to be positioned on the radial artery 91. As a result, the electrode group 40E of the sensor unit 40 abuts on a portion 90a1 of the palm lateral surface 90a of the wrist 90 corresponding to the radial artery 91. In this state, the user closes and fixes the buckle 15. Thus, the user winds and wears the sphygmomanometer 1 (belt 20) around the wrist 90.
図3は、実施の形態1に係る血圧計1が手首90に装着された状態における、インピーダンス測定用の電極群の平面レイアウトを示す図である。図3を参照して、装着状態においては、センサ部40の電極群40Eは、左の手首90の橈骨動脈91に対応して、手首の長手方向に沿って並んだ状態となる。電極群40Eは、幅方向Yにおいて、両側に配置された通電用の電流電極対41,46と、当該電流電極対41,46の間に配置された検出電極対42,43および検出電極対44,45とを含む。第1脈波センサ40-1は検出電極対42,43を含み、第2脈波センサ40-2は検出電極対44,45を含む。
FIG. 3 is a diagram showing a planar layout of the electrode group for impedance measurement in a state where the sphygmomanometer 1 according to the first embodiment is attached to the wrist 90. As shown in FIG. Referring to FIG. 3, in the worn state, the electrode group 40E of the sensor unit 40 is aligned along the longitudinal direction of the wrist corresponding to the radial artery 91 of the left wrist 90. Electrode group 40E includes current electrode pairs 41 and 46 for current conduction disposed on both sides in the width direction Y, and detection electrode pairs 42 and 43 and detection electrode pair 44 disposed between the current electrode pairs 41 and 46. , 45 and so on. The first pulse wave sensor 40-1 includes detection electrode pairs 42 and 43, and the second pulse wave sensor 40-2 includes detection electrode pairs 44 and 45.
検出電極対42,43に対して、橈骨動脈91の血流のより下流側の部分に対応して、検出電極対44,45が配置されている。幅方向Yにおいて、検出電極対42,43の中央と検出電極対44,45の中央との間の間隔D(後述する図5(A)参照)は、例えば、20mmに設定される。間隔Dは、第1脈波センサ40-1と第2脈波センサ40-2との間隔に相当する。また、幅方向Yにおいて、検出電極対42,43間の間隔、および検出電極対44,45の間隔は、例えば、いずれも2mmに設定される。
Detection electrode pairs 44 and 45 are arranged corresponding to the downstream side of the blood flow of the radial artery 91 with respect to the detection electrode pairs 42 and 43. In the width direction Y, a distance D (see FIG. 5A described later) between the center of the detection electrode pair 42, 43 and the center of the detection electrode pair 44, 45 is set to, for example, 20 mm. The interval D corresponds to the interval between the first pulse wave sensor 40-1 and the second pulse wave sensor 40-2. Further, in the width direction Y, the distance between the detection electrode pair 42, 43 and the distance between the detection electrode pair 44, 45 are both set to, for example, 2 mm.
このような電極群40Eは偏平に構成され得るため、血圧計1では、ベルト20を全体として薄厚に構成できる。また、電極群40Eは、柔軟に構成され得るため、電極群40Eは、圧迫カフ21による左の手首90の圧迫を妨げず、後述のオシロメトリック法による血圧測定の精度を損なわない。
Since such an electrode group 40E can be configured to be flat, the sphygmomanometer 1 can configure the belt 20 to be thin as a whole. In addition, since the electrode group 40E can be flexibly configured, the electrode group 40E does not prevent the compression of the left wrist 90 by the compression cuff 21, and does not impair the accuracy of blood pressure measurement by the oscillometric method described later.
図4は、実施の形態1に係る血圧計1の制御系のブロック構成を示す図である。血圧計1は、オシロメトリック法による血圧測定機能と、PTTに基づく血圧測定機能とを備える。図4の血圧計1では、流体として空気を用いる構成を例示する。
FIG. 4 is a block diagram of a control system of the sphygmomanometer 1 according to the first embodiment. The sphygmomanometer 1 has an oscillometric blood pressure measurement function and a blood pressure measurement function based on PTT. The sphygmomanometer 1 of FIG. 4 exemplifies a configuration using air as a fluid.
図4を参照して、本体10は、制御部として機能するCPU(Central Processing Unit)100と、ディスプレイ50と、記憶部として機能するメモリ51と、操作部52と、電池53と、通信部59とを含む。また、本体10は、第1圧力センサ31と、ポンプ32と、弁33と、第2圧力センサ34と、切替弁35とを含む。切替弁35は、ポンプ32および弁33の接続先を、圧迫カフ21または押圧カフ24に切り替える。
Referring to FIG. 4, the main unit 10 includes a central processing unit (CPU) 100 functioning as a control unit, a display 50, a memory 51 functioning as a storage unit, an operation unit 52, a battery 53, and a communication unit 59. And. Further, the main body 10 includes a first pressure sensor 31, a pump 32, a valve 33, a second pressure sensor 34, and a switching valve 35. The switching valve 35 switches the connection destination of the pump 32 and the valve 33 to the compression cuff 21 or the pressing cuff 24.
さらに、本体10は、第1圧力センサ31および第2圧力センサ34のそれぞれからの出力を周波数に変換する発振回路310および発振回路340と、ポンプ32を駆動するポンプ駆動回路320とを含む。センサ部40は、電極群40Eと、通電および電圧検出回路49とを含む。
Furthermore, the main body 10 includes an oscillation circuit 310 and an oscillation circuit 340 that convert outputs from the first pressure sensor 31 and the second pressure sensor 34 into frequencies, and a pump drive circuit 320 that drives the pump 32. The sensor unit 40 includes an electrode group 40E and a conduction and voltage detection circuit 49.
ディスプレイ50は、例えば、有機EL(Electro Luminescence)ディスプレイで構成され、CPU100からの制御信号に従って情報を表示する。この情報は、測定結果を含む。なお、ディスプレイ50は、有機ELディスプレイに限られず、例えば、LCD(Liquid Cristal Display)など、他のタイプのディスプレイで構成されてもよい。
The display 50 is configured of, for example, an organic EL (Electro Luminescence) display, and displays information in accordance with a control signal from the CPU 100. This information includes the measurement results. The display 50 is not limited to the organic EL display, and may be configured of another type of display such as, for example, an LCD (Liquid Cristal Display).
操作部52は、例えば、プッシュ式スイッチで構成され、ユーザによる血圧測定開始または停止の指示に応じた操作信号をCPU100に入力する。なお、操作部52は、プッシュ式スイッチに限られず、例えば、感圧式(抵抗式)または近接式(静電容量式)のタッチパネル式スイッチなどであってもよい。また、本体10がマイクロフォン(図示しない)を含んでおり、ユーザの音声によって血圧測定開始の指示を受け付けてもよい。
The operation unit 52 is, for example, a push-type switch, and inputs an operation signal to the CPU 100 in accordance with an instruction to start or stop blood pressure measurement by the user. The operation unit 52 is not limited to the push-type switch, and may be, for example, a pressure-sensitive (resistive) or proximity-type (electrostatic capacitive) touch panel switch. Also, the main body 10 may include a microphone (not shown), and may receive an instruction to start blood pressure measurement by the user's voice.
メモリ51は、血圧計1を制御するためのプログラムのデータ、血圧計1を制御するために用いられるデータ、血圧計1の各種機能を設定するための設定データ、血圧値の測定結果のデータなどを非一時的に記憶する。また、メモリ51は、プログラムが実行されるときのワークメモリなどとして用いられる。
The memory 51 is data of a program for controlling the sphygmomanometer 1, data used to control the sphygmomanometer 1, setting data for setting various functions of the sphygmomanometer 1, data of measurement results of blood pressure values, etc. Is stored temporarily. The memory 51 is also used as a work memory or the like when a program is executed.
CPU100は、メモリ51に記憶された血圧計1を制御するためのプログラムに従って、制御部として各種機能を実行する。例えば、オシロメトリック法による血圧測定を実行する場合は、CPU100は、操作部52からの血圧測定開始の指示を受付けたとき、第1圧力センサ31からの信号に基づいて、ポンプ32(および弁33)を駆動する。また、CPU100は、第1圧力センサ31からの信号に基づいて、血圧値(最高血圧(収縮期血圧:Systolic Blood Pressure)と最低血圧(拡張期血圧:Diastolic Blood Pressure))を算出するとともに、脈拍数を算出する。
The CPU 100 executes various functions as a control unit in accordance with a program for controlling the sphygmomanometer 1 stored in the memory 51. For example, when performing blood pressure measurement by the oscillometric method, when the CPU 100 receives an instruction to start blood pressure measurement from the operation unit 52, the pump 32 (and the valve 33) is received based on the signal from the first pressure sensor 31. Drive). Further, the CPU 100 calculates the blood pressure value (systolic blood pressure (systolic blood pressure) and diastolic blood pressure (Diastolic blood pressure)) based on the signal from the first pressure sensor 31 and the pulse. Calculate the number.
CPU100は、PTTに基づく血圧測定を実行する場合、操作部52からの血圧測定開始の指示に応じて、圧迫カフ21内の空気を排出させるために弁33を駆動する制御を行なう。また、CPU100は、切替弁35を駆動して、ポンプ32(および弁33)の接続先を押圧カフ24に切り替える制御を行なう。さらに、CPU100は、第2圧力センサ34からの信号に基づいて、血圧値を算出する制御を行なう。
When performing blood pressure measurement based on PTT, the CPU 100 performs control to drive the valve 33 in order to discharge air in the compression cuff 21 in accordance with an instruction to start blood pressure measurement from the operation unit 52. Further, the CPU 100 controls the switching valve 35 to switch the connection destination of the pump 32 (and the valve 33) to the pressure cuff 24. Furthermore, based on the signal from the second pressure sensor 34, the CPU 100 performs control to calculate the blood pressure value.
通信部59は、CPU100によって制御されて、ネットワーク900を介して外部の情報処理装置と通信する。外部の情報処理装置は、後述する携帯型端末10Bおよびサーバ30を含み得るが、これら装置に限定されない。ネットワーク900を介した通信は、無線または有線を含み得る。例えば、ネットワーク900は、インターネットおよびLAN(Local Area Network)を含み得る。または、USBケーブルを用いた1対1の通信も含み得る。通信部59は、マイクロUSBコネクタを含み得る。
Communication unit 59 is controlled by CPU 100 to communicate with an external information processing apparatus via network 900. The external information processing apparatus may include a portable terminal 10B and a server 30, which will be described later, but is not limited to these apparatuses. Communication via network 900 may include wireless or wired. For example, the network 900 may include the Internet and a LAN (Local Area Network). Alternatively, it may include one-to-one communication using a USB cable. The communication unit 59 may include a micro USB connector.
ポンプ32および弁33は、切替弁35、エア配管39a,39bを介して、圧迫カフ21および押圧カフ24に接続されている。第1圧力センサ31はエア配管38aを介して、第2圧力センサ34はエア配管38bを介して、それぞれ圧迫力フ21および押圧カフ24に接続されている。第1圧力センサ31は、エア配管38aを介して、圧迫カフ21内の圧力を検出する。切替弁35は、CPU100から与えられる制御信号に基づいて駆動し、ポンプ32および弁33の接続先を圧迫カフ21または押圧カフ24に切り替える。
The pump 32 and the valve 33 are connected to the compression cuff 21 and the pressure cuff 24 via the switching valve 35 and the air pipes 39a and 39b. The first pressure sensor 31 is connected to the compression force cuff 21 and the pressing cuff 24 via the air pipe 38a and the second pressure sensor 34 via the air pipe 38b. The first pressure sensor 31 detects the pressure in the compression cuff 21 via the air pipe 38a. The switching valve 35 is driven based on a control signal supplied from the CPU 100 and switches the connection destination of the pump 32 and the valve 33 to the compression cuff 21 or the pressing cuff 24.
ポンプ32は、例えば、圧電ポンプで構成される。切替弁35により、ポンプ32および弁33の接続先が圧迫カフ21に切り替えられている場合には、ポンプ32は、圧迫カフ21内の圧力(カフ圧)を加圧するために、エア配管39aを通して圧迫カフ21に加圧用の流体としての空気を供給する。切替弁35により、ポンプ32および弁33の接続先が押圧カフ24に切り替えられている場合には、ポンプ32は、押圧カフ24内の圧力(カフ圧)を加圧するために、エア配管39bを通して押圧カフ24に空気を供給する。
The pump 32 is configured of, for example, a piezoelectric pump. When the connection destination of the pump 32 and the valve 33 is switched to the compression cuff 21 by the switching valve 35, the pump 32 passes the air pipe 39a to pressurize the pressure (cuff pressure) in the compression cuff 21. The compression cuff 21 is supplied with air as a fluid for pressurization. When the connection destination of the pump 32 and the valve 33 is switched to the pressure cuff 24 by the switching valve 35, the pump 32 passes the air pipe 39 b to pressurize the pressure (cuff pressure) in the pressure cuff 24. Air is supplied to the pressure cuff 24.
弁33は、ポンプ32に搭載され、ポンプ32のオン/オフに伴って開閉が制御される構成になっている。具体的には、切替弁35により、ポンプ32および弁33の接続先が圧迫カフ21に切り替えられている場合には、弁33は、ポンプ32がオンされると閉じて、圧迫カフ21内に空気を封入する一方、ポンプ32がオフされると開いて、圧迫カフ21の空気をエア配管39aを通して大気中へ排出させる。
The valve 33 is mounted on the pump 32, and is configured to be controlled in opening / closing as the pump 32 is turned on / off. Specifically, when the connection destination of the pump 32 and the valve 33 is switched to the compression cuff 21 by the switching valve 35, the valve 33 is closed when the pump 32 is turned on, and the pressure cuff 21 is While the air is enclosed, it is opened when the pump 32 is turned off, and the air of the compression cuff 21 is exhausted to the atmosphere through the air pipe 39a.
切替弁35により、ポンプ32および弁33の接続先が押圧カフ24に切り替えられている場合には、弁33は、ポンプ32がオンされると閉じて、押圧カフ24内に空気を封入する一方、ポンプ32がオフされると開いて、押圧カフ24の空気を、エア配管39bを通して大気中へ排出させる。弁33は、逆止弁の機能を有し、排出されるエアが逆流することはない。ポンプ駆動回路320は、ポンプ32をCPU100から与えられる制御信号に基づいて駆動する。
When the connection destination of the pump 32 and the valve 33 is switched to the pressure cuff 24 by the switching valve 35, the valve 33 is closed when the pump 32 is turned on to enclose air in the pressure cuff 24. When the pump 32 is turned off, the air of the pressure cuff 24 is exhausted to the atmosphere through the air pipe 39b. The valve 33 has the function of a non-return valve so that the discharged air does not flow back. Pump drive circuit 320 drives pump 32 based on a control signal supplied from CPU 100.
第1圧力センサ31は、例えば、ピエゾ抵抗式圧力センサであり、エア配管38aを介して、ポンプ32、弁33および圧迫カフ21に接続されている。第1圧力センサ31は、エア配管38aを介して、ベルト20(圧迫カフ21)の圧力、例えば、大気圧を基準(ゼロ)とした圧力を検出して時系列の信号として出力する。
The first pressure sensor 31 is, for example, a piezoresistive pressure sensor, and is connected to the pump 32, the valve 33, and the compression cuff 21 via an air pipe 38a. The first pressure sensor 31 detects the pressure of the belt 20 (the compression cuff 21), for example, the pressure based on the atmospheric pressure (zero) via the air pipe 38a, and outputs it as a time-series signal.
発振回路310は、第1圧力センサ31からのピエゾ抵抗効果による電気抵抗の変化に基づく電気信号値に応じた周波数を有する周波数信号をCPU100に出力する。第1圧力センサ31の出力は、圧迫力フ21の圧力を制御するため、および、オシロメトリック法によって血圧値を算出するために用いられる。
The oscillation circuit 310 outputs, to the CPU 100, a frequency signal having a frequency corresponding to an electrical signal value based on a change in electrical resistance due to the piezoresistive effect from the first pressure sensor 31. The output of the first pressure sensor 31 is used to control the pressure of the compression force 21 and to calculate the blood pressure value by oscillometric method.
第2圧力センサ34は、例えば、ピエゾ抵抗式圧力センサであり、エア配管38bを介して、ポンプ32、弁33および押圧カフ24に接続されている。第2圧力センサ34は、エア配管38bを介して、押圧カフ24の圧力、例えば、大気圧を基準(ゼロ)とした圧力を検出して時系列の信号として出力する。
The second pressure sensor 34 is, for example, a piezoresistive pressure sensor, and is connected to the pump 32, the valve 33, and the pressing cuff 24 via an air pipe 38b. The second pressure sensor 34 detects the pressure of the pressure cuff 24, for example, the pressure with the atmospheric pressure as a reference (zero) through the air pipe 38b, and outputs it as a time-series signal.
発振回路340は、第2圧力センサ34からのピエゾ抵抗効果による電気抵抗の変化に基づく電気信号値に応じて発振し、第2圧力センサ34の電気信号値に応じた周波数を有する周波数信号をCPU100に出力する。第2圧力センサ34の出力は、押圧カフ24の圧力を制御するため、および、PTTに基づく血圧を算出するために用いられる。PTTに基づく血圧測定のために押圧カフ24の圧力を制御する場合には、CPU100は、ポンプ32および弁33を制御して、種々の条件に応じてカフ圧の加圧と減圧を行なう。
The oscillation circuit 340 oscillates according to the electrical signal value based on the change in electrical resistance due to the piezoresistive effect from the second pressure sensor 34, and the CPU 100 generates a frequency signal having a frequency according to the electrical signal value of the second pressure sensor 34. Output to The output of the second pressure sensor 34 is used to control the pressure of the pressure cuff 24 and to calculate the PTT-based blood pressure. When controlling the pressure of the pressure cuff 24 for blood pressure measurement based on PTT, the CPU 100 controls the pump 32 and the valve 33 to pressurize and depressurize the cuff pressure according to various conditions.
電池53は、本体10に搭載された各種要素に電力を供給する。電池53は、配線71を通して、センサ部40の通電および電圧検出回路49へも電力を供給する。配線71は、信号用の配線72とともに、ベルト20の帯状体23と圧迫カフ21との間に挟まれた状態で、ベルト20の周方向に沿って本体10とセンサ部40との間に延在して設けられている。
The battery 53 supplies power to various elements mounted on the main body 10. The battery 53 also supplies power to the energization of the sensor unit 40 and the voltage detection circuit 49 through the wiring 71. The wire 71 extends between the main body 10 and the sensor portion 40 along the circumferential direction of the belt 20 in a state of being sandwiched between the strip 23 of the belt 20 and the compression cuff 21 together with the wire 72 for signal. It is provided.
(脈波伝播時間に基づく血圧測定の概要)
図5は、実施の形態1に係る脈波伝播時間に基づく血圧測定を説明するための模式図である。具体的には、図5(A)は、血圧計1が手首90に装着された状態における、脈波伝播時間に基づく血圧測定を行う際の手首の長手方向に沿った模式断面図である。図5(B)は、脈波信号PS1,PS2の波形を示す図である。なお、図5では、センサ部40は測定部位の橈骨動脈91の上に位置している。 (Outline of blood pressure measurement based on pulse wave transit time)
FIG. 5 is a schematic view for explaining blood pressure measurement based on pulse wave propagation time according to the first embodiment. Specifically, FIG. 5A is a schematic cross-sectional view along the longitudinal direction of the wrist when blood pressure measurement based on pulse wave propagation time is performed in a state where thesphygmomanometer 1 is attached to the wrist 90. FIG. 5B is a diagram showing the waveforms of pulse wave signals PS1 and PS2. In FIG. 5, the sensor unit 40 is located above the radial artery 91 at the measurement site.
図5は、実施の形態1に係る脈波伝播時間に基づく血圧測定を説明するための模式図である。具体的には、図5(A)は、血圧計1が手首90に装着された状態における、脈波伝播時間に基づく血圧測定を行う際の手首の長手方向に沿った模式断面図である。図5(B)は、脈波信号PS1,PS2の波形を示す図である。なお、図5では、センサ部40は測定部位の橈骨動脈91の上に位置している。 (Outline of blood pressure measurement based on pulse wave transit time)
FIG. 5 is a schematic view for explaining blood pressure measurement based on pulse wave propagation time according to the first embodiment. Specifically, FIG. 5A is a schematic cross-sectional view along the longitudinal direction of the wrist when blood pressure measurement based on pulse wave propagation time is performed in a state where the
図5(A)を参照して、電圧検出回路49は、昇圧回路および電圧調整回路等を用いて、所定電圧を電流電極対41,46間に印加することにより、例えば、周波数50kHz,電流値1mAの高周波定電流iを流す。
Referring to FIG. 5A, voltage detection circuit 49 applies a predetermined voltage between current electrode pairs 41 and 46 using a booster circuit, a voltage adjustment circuit, etc. A high frequency constant current i of 1 mA is applied.
また、電圧検出回路49は、第1脈波センサ40-1を構成する検出電極対42,43間の電圧信号v1と、第2脈波センサ40-2を構成する検出電極対44,45間の電圧信号v2とを検出する。電圧信号v1,v2は、左の手首90の掌側面90aのうち、それぞれ第1脈波センサ40-1、第2脈波センサ40-2が対向する部分における、橈骨動脈91の血流の脈波による電気インピーダンスの変化を表す。
In addition, the voltage detection circuit 49 is configured such that the voltage signal v1 between the detection electrode pair 42, 43 constituting the first pulse wave sensor 40-1 and the detection electrode pair 44, 45 constituting the second pulse wave sensor 40-2 And the voltage signal v2 of the The voltage signals v1 and v2 are pulses of the blood flow of the radial artery 91 in portions of the palm side 90a of the left wrist 90, which are opposed to the first pulse wave sensor 40-1 and the second pulse wave sensor 40-2, respectively. Represents the change in electrical impedance due to waves.
具体的には、電圧検出回路49の増幅器401は、例えば、オペアンプを含んで構成され、電圧信号v1,v2を増幅する。アナログフィルタ403は、増幅された電圧信号v1,v2に対してフィルタリング処理を行なう。具体的には、アナログフィルタ403は、電圧信号v1,v2(脈波信号)を特徴づける周波数以外のノイズを除去し、S/Nを向上するためのフィルタリング処理を行なう。A/Dコンバータ405は、フィルタリング処理された電圧信号v1,v2をアナログデータからディジタルデータに変換して、配線72を介してCPU100へ出力する。
Specifically, the amplifier 401 of the voltage detection circuit 49 is configured to include, for example, an operational amplifier, and amplifies the voltage signals v1 and v2. The analog filter 403 performs a filtering process on the amplified voltage signals v1 and v2. Specifically, the analog filter 403 removes noise other than the frequency that characterizes the voltage signals v1 and v2 (pulse wave signal), and performs a filtering process to improve the S / N. The A / D converter 405 converts the voltage signals v1 and v2 subjected to the filtering process from analog data to digital data, and outputs the data to the CPU 100 through the wiring 72.
CPU100は、入力された電圧信号v1,v2(ディジタルデータ)に対して、所定の信号処理を施して、図5(B)中に示すような山状の波形を有する脈波信号PS1,PS2を生成する。
The CPU 100 performs predetermined signal processing on the input voltage signals v1 and v2 (digital data) to generate pulse wave signals PS1 and PS2 having a mountain-like waveform as shown in FIG. 5 (B). Generate
なお、電圧信号v1,v2は、例えば、1mv程度である。また、脈波信号PS1,PS2のそれぞれのピークA1,A2は、例えば、約1Vである。橈骨動脈91の血流の脈波伝搬速度(Pulse Wave Velocity ; PWV)が1000cm/s~2000cm/sの範囲であるとすると、第1脈波センサ40-1と第2脈波センサ40-2との間の間隔D=20mmであることから、脈波信号PS1および脈波信号PS2間の時間差Δtは、1.0ms~2.0msの範囲となる。
The voltage signals v1 and v2 are, for example, about 1 mv. Moreover, each peak A1, A2 of pulse wave signal PS1, PS2 is about 1V, for example. Assuming that the pulse wave velocity (Pulse Wave Velocity; PWV) of the blood flow of the radial artery 91 is in the range of 1000 cm / s to 2000 cm / s, the first pulse wave sensor 40-1 and the second pulse wave sensor 40-2 And the time difference Δt between the pulse wave signal PS1 and the pulse wave signal PS2 is in the range of 1.0 ms to 2.0 ms.
図5(A)に示すように、押圧カフ24は加圧状態となっており、圧迫カフ21は内部の空気が排出されて非加圧状態になっている。押圧カフ24および固形物22は、橈骨動脈91の動脈方向において、第1脈波センサ40-1、第2脈波センサ40-2、および電流電極対41,46に跨って配置されている。そのため、押圧カフ24は、ポンプ32により加圧されると、第1脈波センサ40-1、第2脈波センサ40-2、および電流電極対41,46を固形物22を介して、手首90の掌側面90aに押圧する。
As shown in FIG. 5A, the pressure cuff 24 is in a pressurized state, and the pressure cuff 21 is in a non-pressurized state by discharging the internal air. The pressure cuff 24 and the solid 22 are disposed across the first pulse wave sensor 40-1, the second pulse wave sensor 40-2, and the current electrode pair 41, 46 in the arterial direction of the radial artery 91. Therefore, when the pressure cuff 24 is pressurized by the pump 32, the first pulse wave sensor 40-1, the second pulse wave sensor 40-2, and the current electrode pair 41, 46 are wrist-linked via the solid material 22. The palm side 90 a of 90 is pressed.
手首90の掌側面90aに対する、電流電極対41,46、第1脈波センサ40-1、および第2脈波センサ40-2のそれぞれの押圧力は、適宜の値に設定することができる。本実施の形態では、押圧部として流体袋の押圧カフ24を用いているため、ポンプ32および弁33を圧迫カフ21と共通に使用することができ、構成の簡略化を図ることができる。また、固形物22を介して第1脈波センサ40-1、第2脈波センサ40-2、および電流電極対41,46を押圧できるため、測定部位に対する押圧力が均一になり、精度よく脈波伝播時間に基づく血圧測定を行なうことができる。
The pressing force of each of the current electrode pairs 41 and 46, the first pulse wave sensor 40-1, and the second pulse wave sensor 40-2 on the palm side 90a of the wrist 90 can be set to an appropriate value. In the present embodiment, since the pressure cuff 24 of the fluid bag is used as the pressing portion, the pump 32 and the valve 33 can be used in common with the compression cuff 21, and the configuration can be simplified. Further, since the first pulse wave sensor 40-1, the second pulse wave sensor 40-2, and the current electrode pair 41, 46 can be pressed through the solid 22, the pressing force on the measurement site becomes uniform, and the accuracy is high. Blood pressure measurement based on pulse wave transit time can be performed.
(PTTに基づく血圧測定動作)
ユーザが操作部52を介してPTTに基づく血圧測定を指示すると、CPU100は、指示に従い切替弁35を駆動して、ポンプ32および弁33の接続先を押圧カフ24に切替える。その後、CPU100は弁33を閉じてポンプ駆動回路320を介してポンプ32を駆動し、押圧カフ24に空気を送り、押圧カフ24内の圧力であるカフ圧Pcを一定速度で高くする。 (PTT-based blood pressure measurement operation)
When the user instructs blood pressure measurement based on PTT via theoperation unit 52, the CPU 100 drives the switching valve 35 according to the instruction to switch the connection destination of the pump 32 and the valve 33 to the pressure cuff 24. Thereafter, the CPU 100 closes the valve 33 and drives the pump 32 through the pump drive circuit 320 to send air to the pressure cuff 24 to increase the cuff pressure Pc which is the pressure in the pressure cuff 24 at a constant speed.
ユーザが操作部52を介してPTTに基づく血圧測定を指示すると、CPU100は、指示に従い切替弁35を駆動して、ポンプ32および弁33の接続先を押圧カフ24に切替える。その後、CPU100は弁33を閉じてポンプ駆動回路320を介してポンプ32を駆動し、押圧カフ24に空気を送り、押圧カフ24内の圧力であるカフ圧Pcを一定速度で高くする。 (PTT-based blood pressure measurement operation)
When the user instructs blood pressure measurement based on PTT via the
この加圧過程で、CPU100は、第1の第1脈波センサ40-1および第2の第2脈波センサ40-2のそれぞれが時系列に出力する第1および第2脈波信号PS1およびPS2を取得し、第1および第2脈波信号PS1およびPS2の波形間の相互相関係数rをリアルタイムに算出する。CPU100は、加圧過程にリアルタイムに算出される相互相関係数rが閾値Th(例えばTh=0.99)を超えると判断すると、その時点のカフ圧Pcにおいて検出される第1および第2脈波信号PS1およびPS2について、第1および第2脈波信号PS1およびPS2の振幅のピークA1およびA2の時間差ΔtをPTT(脈波伝搬時間)として算出する。
In this pressurization process, the CPU 100 outputs first and second pulse wave signals PS1 and PS2 output in time series by the first and second pulse wave sensors 40-1 and 40-2, respectively. PS2 is acquired, and the cross-correlation coefficient r between the waveforms of the first and second pulse wave signals PS1 and PS2 is calculated in real time. If the CPU 100 determines that the cross-correlation coefficient r calculated in real time during the pressurization process exceeds the threshold value Th (for example, Th = 0.99), the first and second pulses detected at the cuff pressure Pc at that time For the wave signals PS1 and PS2, the time difference Δt between the peaks A1 and A2 of the amplitudes of the first and second pulse wave signals PS1 and PS2 is calculated as PTT (pulse wave propagation time).
また、CPU100は、公知の式(EBP=(α/(DT2)+β)に従い、PTTに基づく血圧EBPを算出(推定)する。この式中のαとβは所定の係数であり、DTは脈波伝搬時間を示す。これにより、PTTに基づく血圧が測定される。
Further, the CPU 100 calculates (estimates) the blood pressure EBP based on PTT in accordance with a known equation (EBP = (α / (DT 2 ) + β), where α and β are predetermined coefficients, and DT is The pulse wave propagation time is shown to measure the PTT-based blood pressure.
CPU100は、操作部52を介して測定停止の指示がなされない間は、PTTの算出と血圧EBPの算出を繰返し実施する。CPU100は、血圧EBPをディスプレイ50に表示するとともに、メモリ51に格納する。CPU100は、操作部52を介して測定停止の指示を入力すると、測定動作を終了するように各部を制御する。
The CPU 100 repeatedly executes calculation of PTT and calculation of the blood pressure EBP while an instruction to stop measurement is not issued via the operation unit 52. The CPU 100 displays the blood pressure EBP on the display 50 and stores it in the memory 51. When an instruction to stop measurement is input via the operation unit 52, the CPU 100 controls each unit to end the measurement operation.
なお、センサ部40は、脈波信号を測定するためにインピーダンス測定用の電極を利用したが、これに限定されない。例えば、センサ部40は、脈波信号を測定するために圧力センサまたは光センサを含み得る。
In addition, although the sensor part 40 utilized the electrode for impedance measurement in order to measure a pulse wave signal, it is not limited to this. For example, the sensor unit 40 may include a pressure sensor or a light sensor to measure pulse wave signals.
(オシロメトリック法による血圧測定の概要)
図6は、実施の形態1に係るオシロメトリック法による血圧測定を行なう場合において、血圧計1が手首90に装着された状態での、手首の長手方向に沿った模式断面図である。 (Outline of blood pressure measurement by oscillometric method)
FIG. 6 is a schematic cross-sectional view along the longitudinal direction of the wrist in a state where thesphygmomanometer 1 is attached to the wrist 90 when blood pressure measurement by the oscillometric method according to the first embodiment is performed.
図6は、実施の形態1に係るオシロメトリック法による血圧測定を行なう場合において、血圧計1が手首90に装着された状態での、手首の長手方向に沿った模式断面図である。 (Outline of blood pressure measurement by oscillometric method)
FIG. 6 is a schematic cross-sectional view along the longitudinal direction of the wrist in a state where the
図6を参照して、押圧カフ24は、内部の空気が排出されて非加圧状態となっており、圧迫カフ21は空気が供給された加圧状態になっている。圧迫カフ21は、手首90の周方向に延在しており、ポンプ32により加圧されると、左の手首90の周方向を一様に圧迫する。圧迫カフ21の内周面と左の手首90との間には、電極群40Eしか存在していないので、圧迫カフ21による圧迫が他の部材により阻害されることがなく、血管を充分に閉じることができる。
Referring to FIG. 6, the pressure cuff 24 is in a non-pressurized state by discharging the air therein, and the compression cuff 21 is in a pressurized state in which the air is supplied. The compression cuff 21 extends in the circumferential direction of the wrist 90, and when pressed by the pump 32, uniformly compresses the circumferential direction of the left wrist 90. Since only the electrode group 40E exists between the inner peripheral surface of the compression cuff 21 and the left wrist 90, the compression by the compression cuff 21 is not blocked by other members, and the blood vessel is sufficiently closed. be able to.
オシロメトリック法による血圧測定では、CPU100は、測定部位に対する圧迫カフ21の加圧過程または減圧過程で検出される発振回路310を介した第1圧力センサ31からの出力波形に従い、血圧を算出(推定)する。本実施の形態に係るオシロメトリック法による血圧の算出方法は、公知の方法に従うので、ここでは説明を繰返さない。
In blood pressure measurement by the oscillometric method, the CPU 100 calculates (estimates blood pressure according to the output waveform from the first pressure sensor 31 via the oscillation circuit 310 detected in the pressurization process or decompression process of the compression cuff 21 to the measurement site. ). The method of calculating blood pressure by the oscillometric method according to the present embodiment follows a known method, and therefore the description will not be repeated here.
(装着状態の判定)
実施の形態1では、CPU100は、血圧計1が装着状態であるか否かを判定する。具体的には、ベルト20が測定部位に巻き付け装着されている場合、測定部位に対してベルト20(圧迫カフ21)が押圧される。第1圧力センサ31は、この押圧力を、エア配管38aを介して検出する。 (Determination of wearing condition)
In the first embodiment,CPU 100 determines whether sphygmomanometer 1 is in the attached state. Specifically, when the belt 20 is wound around and attached to the measurement site, the belt 20 (compression cuff 21) is pressed against the measurement site. The first pressure sensor 31 detects this pressing force via the air pipe 38a.
実施の形態1では、CPU100は、血圧計1が装着状態であるか否かを判定する。具体的には、ベルト20が測定部位に巻き付け装着されている場合、測定部位に対してベルト20(圧迫カフ21)が押圧される。第1圧力センサ31は、この押圧力を、エア配管38aを介して検出する。 (Determination of wearing condition)
In the first embodiment,
CPU100は、発振回路310を介した第1圧力センサ31の出力から押圧力を検出する。CPU100は、第1圧力センサ31を介し検出される押圧力を、予め定められた閾値Pと比較する。比較の結果が(押圧力の大きさ>閾値P)の条件を満たすとき、CPU100は、血圧計1は装着状態であると判定し、また、比較の結果が(押圧力の大きさ≦閾値P)の条件を満たすとき、CPU100は、血圧計1は装着状態ではないと判定する。したがって、CPU100は、血圧計1が継続して装着状態であると判定する間は、装着中であると決定する。ここで、閾値Pは予め実験等により取得される。
The CPU 100 detects a pressing force from the output of the first pressure sensor 31 via the oscillation circuit 310. The CPU 100 compares the pressing force detected via the first pressure sensor 31 with a predetermined threshold P. When the comparison result satisfies the condition of (pressure magnitude> threshold value P), the CPU 100 determines that the sphygmomanometer 1 is in the mounted state, and the comparison result is (pressure magnitude ≦ threshold value P). When the condition of) is satisfied, the CPU 100 determines that the sphygmomanometer 1 is not in the worn state. Therefore, while the sphygmomanometer 1 is continuously determined to be in the wearing state, the CPU 100 determines that the sphygmomanometer 1 is being worn. Here, the threshold value P is obtained in advance by experiment or the like.
上記に述べた装着状態の判定方法は、第1圧力センサ31により検出される押圧力を用いる方法であったが、第2圧力センサ34により検出される押圧力を用いる方法であってもよい。または、第1圧力センサ31と第2圧力センサ34の両方が検出する押圧力に基づき判定する方法であってもよい。
Although the determination method of the mounting state described above is a method using the pressing force detected by the first pressure sensor 31, it may be a method using the pressing force detected by the second pressure sensor 34. Alternatively, the determination may be made based on the pressing force detected by both the first pressure sensor 31 and the second pressure sensor 34.
また、装着状態の判定は、上記に述べた押圧力の大きさに基づく判定に限定されない。例えば、ユーザが操作部52を介して入力する信号に基づき、CPU100は、装着状態(または装着中)であるか否かを判定してもよい。
Also, the determination of the mounting state is not limited to the determination based on the magnitude of the pressing force described above. For example, based on a signal input by the user via the operation unit 52, the CPU 100 may determine whether or not it is in the mounted state (or in the mounting state).
(センサ部の装着位置の判定)
上記に述べたPTTに基づく血圧測定動作から理解されるように、PTTに基づく測定血圧の精度は、脈波センサから出力される脈波信号の波形の特徴(相互相関係数rおよび振幅のピークA1,A2)の検出精度に依存する。したがって、脈波信号を正確に検知することが要求される。すなわち、センサ部40の第1脈波センサ40-1と第2脈波センサ40-2を測定部位(より特定的には橈骨動脈91)の上に配置することが必要とされる。 (Determination of mounting position of sensor unit)
As understood from the PTT-based blood pressure measurement operation described above, the accuracy of the PTT-based measured blood pressure is a feature of the waveform of the pulse wave signal output from the pulse wave sensor (cross correlation coefficient r and peak of amplitude) It depends on the detection accuracy of A1, A2). Therefore, accurate detection of the pulse wave signal is required. That is, it is necessary to arrange the first pulse wave sensor 40-1 and the second pulse wave sensor 40-2 of thesensor unit 40 on the measurement site (more specifically, the radial artery 91).
上記に述べたPTTに基づく血圧測定動作から理解されるように、PTTに基づく測定血圧の精度は、脈波センサから出力される脈波信号の波形の特徴(相互相関係数rおよび振幅のピークA1,A2)の検出精度に依存する。したがって、脈波信号を正確に検知することが要求される。すなわち、センサ部40の第1脈波センサ40-1と第2脈波センサ40-2を測定部位(より特定的には橈骨動脈91)の上に配置することが必要とされる。 (Determination of mounting position of sensor unit)
As understood from the PTT-based blood pressure measurement operation described above, the accuracy of the PTT-based measured blood pressure is a feature of the waveform of the pulse wave signal output from the pulse wave sensor (cross correlation coefficient r and peak of amplitude) It depends on the detection accuracy of A1, A2). Therefore, accurate detection of the pulse wave signal is required. That is, it is necessary to arrange the first pulse wave sensor 40-1 and the second pulse wave sensor 40-2 of the
上記の背景に鑑みて、本実施の形態では、CPU100は、第1脈波センサ40-1と第2脈波センサ40-2を橈骨動脈91の上に配置するために、位置調整のガイド情報をディスプレイ50に表示する。ガイド情報は、第1脈波センサ40-1の第1脈波信号PS1の振幅のピークA1、および第2脈波センサの第2脈波信号PS2の振幅のピークA2が予め定められた大きさとなるように、センサ部40と測定部位との相対的な位置関係を調整するのを支援するための情報を含む。
In view of the above background, in the present embodiment, in order to place the first pulse wave sensor 40-1 and the second pulse wave sensor 40-2 on the radial artery 91, guide information for position adjustment is provided. Is displayed on the display 50. The guide information includes a predetermined amplitude A1 of the amplitude of the first pulse wave signal PS1 of the first pulse wave sensor 40-1 and a peak A2 of the amplitude of the second pulse wave signal PS2 of the second pulse wave sensor. As such, it includes information for assisting in adjusting the relative positional relationship between the sensor unit 40 and the measurement site.
ユーザは、ガイド情報に支援されて、装着状態においてセンサ部40の位置を調整する。この位置調整では、ユーザは、装着状態においてディスプレイ50の筐体を、幅方向Yに押してずらす(摺動させる)ことで、センサ部40の位置を測定部位に対し上下方向(左腕が延びる方向)に移動させることができる。また、ユーザは、装着状態においてディスプレイ50の筐体を、幅方向Yと交差する方向に押してずらす(摺動させる)ことで、センサ部40の位置を測定部位に対し左右方向(左腕が伸びる方向と略交差する方向)に移動させることができる。
The user adjusts the position of the sensor unit 40 in the mounted state, supported by the guide information. In this position adjustment, the user pushes and shifts (slides) the housing of the display 50 in the width direction Y in the mounted state to move the position of the sensor unit 40 up and down with respect to the measurement site (direction in which the left arm extends) Can be moved to In addition, the user pushes and shifts (slides) the housing of the display 50 in the direction intersecting the width direction Y in the mounted state to move the position of the sensor unit 40 in the left-right direction (the direction in which the left arm extends) Can be moved in a direction substantially crossing the
本実施の形態では、ガイド情報は、装着状態を評価する情報を含む。具体的には、第1脈波信号PS1および第2脈波信号PS2の振幅の大きさが、閾値TAを超える場合、CPU100は、装着状態を「OK」と評価する。一方、第1脈波信号PS1および第2脈波信号PS2の少なくとも一方の振幅の大きさが、閾値TA以下である場合、CPU100は、装着状態を「NG」と評価する。なお、閾値TAは、PTTに基づく測定血圧の予め定められた精度に相当する値であって、実験で取得された値を示す。ユーザは「OK」を確認することで、位置調整が成功したことを把握することができ、また「NG」を確認することで位置調整は成功しておらず調整を継続する必要があると判断することができる。装着状態が「NG」と判断される間は、CPU100は血圧測定の処理を起動せず、「OK」と判断されたときCPU100は血圧測定処理を起動し得る(後述の図9のステップS8を参照)。したがって、装着状態の評価結果を、血圧測定処理の起動の判断に利用することができる。
In the present embodiment, the guide information includes information for evaluating the mounting state. Specifically, when the magnitudes of the amplitudes of the first pulse wave signal PS1 and the second pulse wave signal PS2 exceed the threshold value TA, the CPU 100 evaluates the wearing state as "OK". On the other hand, when the magnitude of the amplitude of at least one of the first pulse wave signal PS1 and the second pulse wave signal PS2 is less than or equal to the threshold value TA, the CPU 100 evaluates the mounting state as "NG". The threshold value TA is a value corresponding to a predetermined accuracy of the measured blood pressure based on the PTT, and indicates a value acquired in an experiment. The user can confirm that the position adjustment has succeeded by confirming "OK", and it is determined that the position adjustment has not succeeded by continuing the adjustment by confirming "NG". can do. While the wearing state is determined as “NG”, the CPU 100 does not start the blood pressure measurement process, and when “OK” is determined, the CPU 100 can start the blood pressure measurement process (step S8 in FIG. 9 described later). reference). Therefore, the evaluation result of the wearing state can be used to determine the start of the blood pressure measurement process.
装着状態が「OK」の評価は、センサ部40と測定部位との相対的な位置関係がPTTに基づく血圧測定の精度を得ることができる関係であることを示す。より特定的には第1脈波センサ40-1および第2脈波センサ40-2が橈骨動脈91の真上に位置する状態を示す。一方、装着状態が「NG」の評価は、センサ部40と測定部位との相対的な位置関係がPTTに基づく血圧測定の精度が得られない関係であることを示す。より特定的には第1脈波センサ40-1および第2脈波センサ40-2の両方または一方が橈骨動脈91の真上に位置していない状態を示す。なお、ここでは、装着状態の評価は「OK」または「NG」の2種類としているが、3種類以上であってもよい。具体的には、「NG」のケースであっても、第1脈波信号PS1および第2脈波信号PS2の振幅の大きさと、閾値TAとの差の大きさに基づき、差が小さい順に「NG-1」、「NG-2」・・・と分類してよい。また、「OK」のケースにおいても、第1脈波信号PS1および第2脈波信号PS2の振幅の大きさと、閾値TAとの差の大きさに基づき、差が大きい順に「OK-1」、「OK-2」・・・と分類してよい。
The evaluation that the mounting state is "OK" indicates that the relative positional relationship between the sensor unit 40 and the measurement site is a relationship that can obtain the accuracy of PTT-based blood pressure measurement. More specifically, it shows a state in which the first pulse wave sensor 40-1 and the second pulse wave sensor 40-2 are located directly above the radial artery 91. On the other hand, the evaluation of the mounting state "NG" indicates that the relative positional relationship between the sensor unit 40 and the measurement site is a relationship in which the accuracy of the blood pressure measurement based on PTT can not be obtained. More specifically, it shows a state in which one or both of the first pulse wave sensor 40-1 and the second pulse wave sensor 40-2 are not positioned directly above the radial artery 91. In addition, although evaluation of a mounting state is made into two types of "OK" or "NG" here, three or more types may be sufficient. Specifically, even in the case of "NG", the differences are ordered in ascending order based on the magnitude of the difference between the amplitudes of the first pulse wave signal PS1 and the second pulse wave signal PS2 and the threshold value TA. It may be classified as “NG-1”, “NG-2”, and so on. Also in the case of "OK", based on the magnitude of the difference between the amplitude of the first pulse wave signal PS1 and the amplitude of the second pulse wave signal PS2 and the threshold value TA, "OK-1" in descending order of difference. It may be classified as "OK-2".
図7は、実施の形態1に係るセンサ部40の装着状態の判定を説明する図である。図7(A)に示されるように、実施の形態1では、装着状態において、左腕の延びる方向が身体の前面と並行となる状態で、ユーザはディスプレイ50のガイド情報を上方向から視認する。図7(A)の状態では、上記の間隔Dの離間配置によれば、ユーザの左側に第1脈波センサ40-1が位置し、同様に向かって右側に第2脈波センサ40-2が位置することになる。この背景のもと、CPU100は、第1脈波信号PS1の振幅の大きさを表す第1インジケータ情報G1をディスプレイ50の画面においてユーザの左側に表示し、第2脈波信号PS2の振幅の大きさを表す第2インジケータ情報G2をディスプレイ50の画面においてユーザの右側に表示する(後述の図7(D)および図7(E)を参照)。
FIG. 7 is a diagram for explaining the determination of the mounting state of the sensor unit 40 according to the first embodiment. As shown in FIG. 7A, in the first embodiment, in the wearing state, the user visually recognizes the guide information of the display 50 from above in a state in which the extending direction of the left arm is parallel to the front of the body. In the state of FIG. 7A, according to the spacing arrangement of the above-mentioned interval D, the first pulse wave sensor 40-1 is located on the left side of the user, and the second pulse wave sensor 40-2 on the right side similarly. Will be located. Under this background, the CPU 100 displays the first indicator information G1 representing the magnitude of the amplitude of the first pulse wave signal PS1 on the screen of the display 50 on the left side of the user, and the magnitude of the amplitude of the second pulse wave signal PS2 The second indicator information G2 representing the distance is displayed on the screen of the display 50 on the right side of the user (see FIG. 7 (D) and FIG. 7 (E) described later).
このように、CPU100は、図7(A)のユーザがディスプレイ50の情報を視認する方向に従い、第1および第2インジケータ情報G1およびG2を、第1脈波センサ40-1および第2脈波センサ40-2の上記に述べた離間配置に整合した位置で表示する。すなわち「整合した位置で表示する」とは、ディスプレイ50の画面において、間隔Dで離間配置された第1脈波センサ40-1および第2脈波センサ40-2のそれぞれに対応した位置で、第1インジケータ情報G1および第2インジケータ情報G2をそれぞれ表示することに相当する。
Thus, the CPU 100 causes the first pulse wave sensor 40-1 and the second pulse wave to transmit the first and second indicator information G1 and G2 in accordance with the direction in which the user of FIG. 7A views the information on the display 50. Display at a position aligned with the above-described spaced arrangement of the sensor 40-2. That is, “display at the aligned position” means at a position corresponding to each of the first pulse wave sensor 40-1 and the second pulse wave sensor 40-2 which are arranged at an interval D on the screen of the display 50. It corresponds to displaying the first indicator information G1 and the second indicator information G2, respectively.
装着状態で、図7(B)に示すように、第1脈波センサ40-1は橈骨動脈91の真上に位置し、第2脈波センサ40-2が橈骨動脈91の真上に位置しないときは、図7(D)の下段に示すように第1脈波信号PS1の振幅は閾値TAを超える大きさを示すが、第2脈波信号PS2の振幅の大きさは閾値TAを超えない。したがって、CPU100は、図7(B)の装着状態を「NG」と評価する。
In the mounted state, as shown in FIG. 7B, the first pulse wave sensor 40-1 is positioned directly above the radial artery 91, and the second pulse wave sensor 40-2 is positioned directly above the radial artery 91. When not, as shown in the lower part of FIG. 7D, the amplitude of the first pulse wave signal PS1 shows a magnitude exceeding the threshold TA, but the magnitude of the amplitude of the second pulse wave signal PS2 exceeds the threshold TA Absent. Therefore, the CPU 100 evaluates the mounting state of FIG. 7B as “NG”.
図7(B)の装着状態が「NG」と評価される場合、CPU100は、図7(D)の上段に示すように、ディスプレイ50に第1脈波信号PS1および第2脈波信号PS2のそれぞれに対応した第1インジケータ情報G1,第2インジケータ情報G2を、ピクトグラム群で表示する。ピクトグラム群は、複数の矩形状のピクトグラムからなる列であって、CPU100は、ピクトグラム群をY方向と交差する方向に延びるように表示する。CPU100は、第1脈波信号PS1および第2脈波信号PS2の振幅の大きさを検出し、対応のピクトグラム群のうち、脈波信号の振幅の大きさに従う1つ以上のピクトグラムを点灯する。これにより、ピクトグラム群の列において点灯しているピクトグラムの数により、対応する脈波信号の振幅の大きさが示される。
When the mounting state in FIG. 7B is evaluated as “NG”, the CPU 100 causes the display 50 to display the first pulse wave signal PS1 and the second pulse wave signal PS2 as shown in the upper part of FIG. 7D. The first indicator information G1 and the second indicator information G2 corresponding to each are displayed as a pictogram group. The pictogram group is a row of a plurality of rectangular pictograms, and the CPU 100 displays the pictogram group so as to extend in the direction intersecting the Y direction. The CPU 100 detects the amplitude magnitudes of the first pulse wave signal PS1 and the second pulse wave signal PS2, and lights one or more pictograms corresponding to the amplitude magnitude of the pulse wave signal among the corresponding pictogram groups. Thus, the number of lit pictograms in a row of pictograms indicates the magnitude of the amplitude of the corresponding pulse wave signal.
ピクトグラム群の点灯態様として、振幅が閾値TAを超えることを示すピクトグラムと、閾値TA以下を示すピクトグラムとでは、表示態様を異ならせることが望ましい。図7では、例えば、振幅が閾値TAを超えることを示すピクトグラムは点灯を継続し、閾値TA以下を示すピクトグラムは点滅する。表示態様は、点灯/点滅の他に、表示色を変更しても良い。なお、ピクトグラムの形状は、矩形に限定されない。
As a lighting mode of the pictogram group, it is desirable to make the display mode different between a pictogram showing that the amplitude exceeds the threshold TA and a pictogram showing the threshold TA or less. In FIG. 7, for example, the pictogram indicating that the amplitude exceeds the threshold TA continues lighting, and the pictogram indicating the threshold TA or less blinks. The display mode may change the display color in addition to lighting / flashing. The shape of the pictogram is not limited to a rectangle.
さらに、CPU100は、各ピクトグラム群の第1インジケータ情報G1,第2インジケータ情報G2に関連付けて、対応の脈波センサの位置としてユーザの「左」または「右」の側を示す文字CHを表示する。図7(D)上段の表示では、CPU100は、ユーザに対して、例えば、第1脈波センサ40-1と第2脈波センサ40-2が検出する脈波振幅値がアンバランスであること、または脈波振幅値が相対的に高い/低いことをガイダンスできて、ユーザに対して、センサ部40の位置を移動させることの動機付けを与えることができる。動機づけされたユーザは、「右」の文字CHが関連付けされたインジケータ情報G2が示す脈波信号の振幅を大きくするよう、ディスプレイ50の筐体を右方向に押す。
Furthermore, the CPU 100 displays the character CH indicating the "left" or "right" side of the user as the position of the corresponding pulse wave sensor in association with the first indicator information G1 and the second indicator information G2 of each pictogram group. . In the display in the upper part of FIG. 7D, for example, the CPU 100 indicates that the pulse wave amplitude values detected by the first pulse wave sensor 40-1 and the second pulse wave sensor 40-2 are unbalanced with respect to the user. Or, it can be guided that the pulse wave amplitude value is relatively high / low, and the user can be motivated to move the position of the sensor unit 40. The motivated user pushes the housing of the display 50 in the right direction so as to increase the amplitude of the pulse wave signal indicated by the indicator information G2 associated with the "right" character CH.
ディスプレイ50が右方向に押されると、センサ部40の位置は、ユーザの左方向に移動する。この移動に連動して、センサ部40(第1脈波センサ40-1および第2脈波センサ40-2)の位置は、図7(B)から図7(C)に示すように、橈骨動脈91の真上に移動する。
When the display 50 is pushed to the right, the position of the sensor unit 40 moves to the left of the user. The position of the sensor unit 40 (the first pulse wave sensor 40-1 and the second pulse wave sensor 40-2) interlocks with this movement, as shown in FIG. 7 (B) to FIG. 7 (C). It moves directly above the artery 91.
センサ部40が橈骨動脈91の真上に位置すると、第1脈波信号PS1および第2脈波信号PS2の振幅は十分に大きくなり、第1インジケータ情報G1および第2インジケータ情報G2は、図7(E)の下段に示す閾値TAを超える。このとき、図7(E)上段に示すように、第1インジケータ情報G1および第2インジケータ情報G2は、第1脈波信号PS1および第2脈波信号PS2の振幅が十分に大きくなったことを表示する。このとき、CPU100は、図7(C)の装着状態を「OK」と判定する。ユーザは、図7(E)上段の第1インジケータ情報G1,第2インジケータ情報G2を確認することにより、装着状態が良好になったことがガイドされる。
When the sensor unit 40 is positioned directly above the radial artery 91, the amplitudes of the first pulse wave signal PS1 and the second pulse wave signal PS2 become sufficiently large, and the first indicator information G1 and the second indicator information G2 are as shown in FIG. The threshold value TA shown in the lower part of (E) is exceeded. At this time, as shown in the upper portion of FIG. 7E, the first indicator information G1 and the second indicator information G2 indicate that the amplitudes of the first pulse wave signal PS1 and the second pulse wave signal PS2 have become sufficiently large. indicate. At this time, the CPU 100 determines that the mounting state of FIG. 7C is “OK”. By confirming the first indicator information G1 and the second indicator information G2 at the top of FIG. 7E, the user is guided that the mounting state has become good.
CPU110は、装着状態を「OK」と判定したときに検出される第1脈波信号PS1および第2脈波信号PS2の波形の特徴と、上記に述べた公知の式に従い、PTTに基づいた血圧測定(推定)を実施する。
The CPU 110 uses the PTT-based blood pressure according to the well-known equation described above and the characteristics of the waveforms of the first pulse wave signal PS1 and the second pulse wave signal PS2 detected when the wearing state is determined as “OK”. Perform measurement (estimate).
このように、ユーザは、第1インジケータ情報G1,第2インジケータ情報G2から、センサ部40と測定部位との相対的な位置関係の調整をすることが動機づけされるとともに、第1インジケータ情報G1,第2インジケータ情報G2および文字CHから調整のためのガイダンスがなされる。また、文字CHは、インジケータ情報に関連付けて同一画面に表示されるので、ユーザは画面を切替えずとも、位置調整のためのガイド情報を確認することができる。
Thus, the user is motivated to adjust the relative positional relationship between the sensor unit 40 and the measurement site from the first indicator information G1 and the second indicator information G2, and the first indicator information G1 , Guidance for adjustment is given from the second indicator information G2 and the character CH. In addition, since the character CH is displayed on the same screen in association with the indicator information, the user can confirm guide information for position adjustment without switching the screen.
(CPU100の機能構成)
図8は、実施の形態1に係るガイド情報を出力するための機能の構成を、血圧測定機能と関連づけて模式的に示す図である。図8を参照して、CPU100は、ガイド情報を出力するための機能として、脈波判定部101、メモリ51の画像データ54を用いてガイド情報を決定するガイド情報決定部102および表示制御部103を備える。また、CPU100は、血圧測定機能として、上記に述べた処理に従いPTTを算出するPTT算出部111、上記の公知の式に従いPTTに基づく血圧を算出(推定)するPTTに基づく血圧算出部112、上記に述べたオシロメトリック法に基づく血圧を算出(推定)するオシロメトリック法に従う血圧算出部113、および血圧出力制御部114を備える。 (Functional configuration of CPU 100)
FIG. 8 is a diagram schematically showing a configuration of a function for outputting guide information according to the first embodiment in association with a blood pressure measurement function. Referring to FIG. 8, as a function for outputting guide information,CPU 100 determines pulse information using pulse wave determination unit 101, image data 54 of memory 51, guide information determination unit 102 and display control unit 103. Equipped with In addition, as a blood pressure measurement function, the CPU 100 calculates a PTT according to the above-described process, the PTT calculation unit 111, calculates (estimates) a blood pressure based on PTT according to the above known equation And a blood pressure output control unit 114 according to the oscillometric method for calculating (estimating) the blood pressure based on the oscillometric method described above.
図8は、実施の形態1に係るガイド情報を出力するための機能の構成を、血圧測定機能と関連づけて模式的に示す図である。図8を参照して、CPU100は、ガイド情報を出力するための機能として、脈波判定部101、メモリ51の画像データ54を用いてガイド情報を決定するガイド情報決定部102および表示制御部103を備える。また、CPU100は、血圧測定機能として、上記に述べた処理に従いPTTを算出するPTT算出部111、上記の公知の式に従いPTTに基づく血圧を算出(推定)するPTTに基づく血圧算出部112、上記に述べたオシロメトリック法に基づく血圧を算出(推定)するオシロメトリック法に従う血圧算出部113、および血圧出力制御部114を備える。 (Functional configuration of CPU 100)
FIG. 8 is a diagram schematically showing a configuration of a function for outputting guide information according to the first embodiment in association with a blood pressure measurement function. Referring to FIG. 8, as a function for outputting guide information,
メモリ51には、検出され得る(第1脈波信号PS1の振幅の大きさ、第2脈波信号PS2に振幅の大きさ)の組のそれぞれに対応して画像データ54が格納される。画像データ54の対応する組は、当該画像データ54に割当られるID(identification)により示される。画像データ54は、第1脈波信号PS1および第2脈波信号PS2の振幅の大きさを示すピクトグラム群と、「左」,「右」の文字CHの画像とを含む。(第1脈波信号PS1の振幅の大きさ、第2脈波信号PS2に振幅の大きさ)の組に対応する画像データ54は、実験等に基づき生成されて、メモリ51に、当該組に対応付けて格納される。
In the memory 51, image data 54 is stored corresponding to each of the sets of (the amplitude of the first pulse wave signal PS1 and the amplitude of the second pulse wave signal PS2) that can be detected. The corresponding set of image data 54 is indicated by an identification (ID) assigned to the image data 54. The image data 54 includes a pictogram group indicating magnitudes of amplitudes of the first pulse wave signal PS1 and the second pulse wave signal PS2, and an image of the characters "left" and "right". Image data 54 corresponding to a set of (the magnitude of the amplitude of the first pulse wave signal PS1 and the magnitude of the amplitude of the second pulse wave signal PS2) is generated based on an experiment or the like, and stored in the memory 51. It is stored in association with it.
脈波判定部101は、第1脈波信号PS1および第2脈波信号PS2の振幅の大きさを閾値TAと比較し、比較結果に基づき(振幅の大きさ>閾値TA)の条件が満たされるか否かを判定する。第1脈波信号PS1および第2脈波信号PS2の振幅の大きさについて、当該条件が満たされているときは、装着状態は、PTTに基づく血圧測定のための望ましい装着状態である、すなわち測定精度を維持できる装着状態である。
The pulse wave determination unit 101 compares the magnitudes of the amplitudes of the first pulse wave signal PS1 and the second pulse wave signal PS2 with the threshold value TA, and based on the comparison result, the condition of (amplitude size> threshold value TA) is satisfied. It is determined whether or not. For the amplitude magnitudes of the first pulse wave signal PS1 and the second pulse wave signal PS2, when the condition is satisfied, the wearing condition is the desired wearing condition for blood pressure measurement based on PTT, ie measurement It is the wearing state which can maintain accuracy.
ガイド情報決定部102は、脈波判定部101により上記の条件が満たされないと判定されたとき、出力するべきガイド情報を決定する。具体的には、ガイド情報決定部102は、第1脈波信号PS1および第2脈波信号PS2の振幅を検出し、検出された(第1脈波信号PS1の振幅の大きさ、第2脈波信号PS2に振幅の大きさ)の組合せに基づき、メモリ51を検索する。ガイド情報決定部102は、当該組合せに一致するIDが割当てられた画像データ54をメモリ51から読出す。
When the pulse wave determination unit 101 determines that the above condition is not satisfied, the guide information determination unit 102 determines guide information to be output. Specifically, the guide information determination unit 102 detects the amplitudes of the first pulse wave signal PS1 and the second pulse wave signal PS2, and detects (the magnitude of the amplitude of the first pulse wave signal PS1, the second pulse The memory 51 is searched based on the combination of the wave signal PS2 and the amplitude). The guide information determination unit 102 reads from the memory 51 the image data 54 to which an ID matching the combination is assigned.
表示制御部103は、ガイド情報決定部102からの画像データ54に基づき、ディスプレイ50に表示させるための制御信号を生成する。制御信号に従いディスプレイ50が駆動されることで、ディスプレイ50に、検出される第1脈波信号PS1および第2脈波信号PS2の振幅の大きさに基づく第1インジケータ情報G1および第2インジケータ情報G2が表示される。
The display control unit 103 generates a control signal to be displayed on the display 50 based on the image data 54 from the guide information determination unit 102. By driving the display 50 in accordance with the control signal, the display 50 displays first indicator information G1 and second indicator information G2 based on magnitudes of amplitudes of the first pulse wave signal PS1 and the second pulse wave signal PS2 detected. Is displayed.
図8の各部の機能は、メモリ51にプログラムとして格納される。CPU100は、メモリ51からプログラムを読出し実行することにより、各部の機能が実現される。なお、各部の機能はプログラムで実現する方法に限定されない。例えば、ASIC(application specific integrated circuit:特定用途向け集積回路)またはFPGA(field-programmable gate array)を含む回路により実現されてもよい。さらには、プログラムと回路の組合せにより実現されてもよい。
The functions of the units in FIG. 8 are stored in the memory 51 as a program. The CPU 100 realizes the functions of the respective units by reading and executing a program from the memory 51. The function of each part is not limited to the method realized by the program. For example, it may be realized by a circuit including an application specific integrated circuit (ASIC) or a field-programmable gate array (FPGA). Furthermore, it may be realized by a combination of a program and a circuit.
なお、ガイド情報は、メモリ51に格納される画像データ54に限定されない。例えばスクリプトプログラムを含む画像生成プログラムを実行することで表示制御のための画像データを生成するとしてもよい。この場合、上記に述べた(第1脈波信号PS1の振幅の大きさ,第2脈波信号PS2に振幅の大きさ)の組合せが、スクリプトプログラムのパラメータ(引数など)となる。
The guide information is not limited to the image data 54 stored in the memory 51. For example, image data for display control may be generated by executing an image generation program including a script program. In this case, the combination (the magnitude of the amplitude of the first pulse wave signal PS1 and the magnitude of the amplitude of the second pulse wave signal PS2) described above becomes a parameter (such as an argument) of the script program.
(処理フローチャート)
図9は、実施の形態1に係るガイド情報の出力とPTTに基づく血圧測定の処理を示すフローチャートである。このフローチャートに従うプログラムは、メモリ51に格納されて、CPU100により読出されて、実行される。 (Processing flowchart)
FIG. 9 is a flowchart showing the process of blood pressure measurement based on the output of guide information and PTT according to the first embodiment. A program according to this flowchart is stored in thememory 51, read by the CPU 100, and executed.
図9は、実施の形態1に係るガイド情報の出力とPTTに基づく血圧測定の処理を示すフローチャートである。このフローチャートに従うプログラムは、メモリ51に格納されて、CPU100により読出されて、実行される。 (Processing flowchart)
FIG. 9 is a flowchart showing the process of blood pressure measurement based on the output of guide information and PTT according to the first embodiment. A program according to this flowchart is stored in the
図9を参照して、まず、CPU100は、装着状態において、操作部52でユーザがPTTの血圧測定開始のスイッチ操作をしたとき、開始指示を受付ける(ステップS1)。CPU100は、血圧測定を開始する際に、初期化処理を実施する(ステップS2)。例えば、カフから空気を排気する。
Referring to FIG. 9, first, CPU 100 receives a start instruction when the user performs a switch operation to start blood pressure measurement of PTT at operation unit 52 in the wearing state (step S1). The CPU 100 performs an initialization process when starting blood pressure measurement (step S2). For example, exhaust air from the cuff.
CPU100は、PTTのための脈波測定の処理を開始する(ステップS3)。脈波判定部101は、センサ部40から測定される第1脈波信号PS1および第2脈波信号PS2を取得し、取得された第1および第2脈波信号PS1およびPS2の振幅の大きさについて(振幅>閾値TA)の条件が満たされるかを判定する(ステップS4)。
The CPU 100 starts processing of pulse wave measurement for PTT (step S3). The pulse wave determination unit 101 acquires the first pulse wave signal PS1 and the second pulse wave signal PS2 measured from the sensor unit 40, and the magnitudes of the amplitudes of the acquired first and second pulse wave signals PS1 and PS2 It is determined whether the condition of (amplitude> threshold value TA) is satisfied (step S4).
CPU100は、脈波判定部101の出力に基づき、上記の条件が満たされているか否かを判定する(ステップS5)。条件が満たされていると判定されたとき(ステップS5でYES)、CPU100は、装着状態「OK」と評価し、後述するステップS8のPTTに基づく血圧測定を実施する。
The CPU 100 determines, based on the output of the pulse wave determination unit 101, whether the above condition is satisfied (step S5). If it is determined that the condition is satisfied (YES in step S5), the CPU 100 evaluates the mounting state as "OK" and performs blood pressure measurement based on PTT in step S8 described later.
一方、条件が満たされないと判定されると(ステップS5でNO)、CPU100は、装着状態「NG」と評価する。また、ガイド情報決定部102は、ガイド情報を決定し(ステップS6)、表示制御部103はガイド情報に従いディスプレイ50の表示を制御する(ステップS7)。その後、ステップS3に移行し、以下の処理を上記と同様に実施する。
On the other hand, when it is determined that the condition is not satisfied (NO in step S5), CPU 100 evaluates that the mounting state is "NG". Further, the guide information determination unit 102 determines guide information (step S6), and the display control unit 103 controls the display of the display 50 according to the guide information (step S7). Then, it transfers to step S3 and implements the following processes similarly to the above.
PTTに基づく血圧測定が実施されると(ステップS8)、測定された血圧はディスプレイ50に表示される(ステップS9)。また、測定結果は、メモリ51に格納される。ステップS8では、PTT算出部111によりPTTが算出され、PTTに基づく血圧算出部112により、算出されたPTTに基づく血圧が算出(推定)される。
When the PTT-based blood pressure measurement is performed (step S8), the measured blood pressure is displayed on the display 50 (step S9). Also, the measurement result is stored in the memory 51. In step S8, PTT is calculated by the PTT calculation unit 111, and the blood pressure calculation unit 112 based on PTT calculates (estimates) the blood pressure based on the calculated PTT.
なお、図9では、装着状態が「NG」と評価される間は、PTTに基づく血圧測定(ステップS8)は実施されないとしているが、装着状態が「NG」と評価される場合でも、PTT算出部111によるPTTの算出と、PTTに基づく血圧算出部112によるPTTに基づく血圧の算出(推定)が実施されるとしてもよい。例えば、予め定められた回数連続して装着状態「NG」と評価されるとき、または装着状態「NG」と評価される時間が、継続して予め定められた時間を超えたとき(例えば、開始指示を受付けたとき(ステップS1)から予め定められた時間が経過したとき)、装着状態が「NG」の評価においてPPTに基づく血圧測定(ステップS8)が実施されるとしてもよい。
In FIG. 9, it is assumed that blood pressure measurement based on PTT (step S 8) is not performed while the wearing state is evaluated as “NG”, but PTT calculation is performed even when the wearing state is evaluated as “NG” The calculation of PTT by the unit 111 and the calculation (estimate) of blood pressure based on the PTT by the blood pressure calculation unit 112 based on the PTT may be performed. For example, when the wearing state "NG" is continuously evaluated a predetermined number of times, or when the time when the wearing state "NG" is evaluated continuously exceeds a predetermined time (for example, start When receiving the instruction (when a predetermined time has elapsed since step S1), the blood pressure measurement based on PPT (step S8) may be performed in the evaluation of the wearing state “NG”.
(ガイド情報の表示例)
図10、図11および図12は、実施の形態1に係るガイド情報の他の表示例を示す図である。図10では、ディスプレイ50の筐体(画面)が円形であるケースが示される。図10(A)と図10(B)は装着状態が「NG」である場合の表示例であり、ディスプレイ50の画面には、装着状態の評価(「NG」)を表す情報93、および測定部位に対するセンサ部40の位置を移動させる方向をガイドする情報94を、他の情報(インジケータ情報G1,G2および文字CH)と同一画面で表示する。図10(A)の情報94は、ディスプレイ50の円形の筐体を、円の中心で同心円状に回転させることをガイドする情報であり、回転方向を示す矢印マークで示される。これに対して図10(B)の情報94は、ディスプレイ50の筐体を上下方向に動かすことをガイドする情報であり、上下方向を示す矢印マークで示される。 (Display example of guide information)
10, 11 and 12 are diagrams showing other display examples of guide information according to the first embodiment. In FIG. 10, the case where the housing (screen) of thedisplay 50 is circular is shown. FIGS. 10A and 10B are display examples when the mounting state is “NG”, and on the screen of the display 50, information 93 indicating the evaluation of the mounting state (“NG”), and measurement Information 94 for guiding the direction in which the position of the sensor unit 40 with respect to the part is moved is displayed on the same screen as the other information (the indicator information G1, G2 and the character CH). Information 94 in FIG. 10A is information for guiding the circular casing of the display 50 to rotate concentrically at the center of the circle, and is indicated by an arrow mark indicating the rotation direction. On the other hand, information 94 in FIG. 10B is information for guiding moving the housing of the display 50 in the vertical direction, and is indicated by an arrow mark indicating the vertical direction.
図10、図11および図12は、実施の形態1に係るガイド情報の他の表示例を示す図である。図10では、ディスプレイ50の筐体(画面)が円形であるケースが示される。図10(A)と図10(B)は装着状態が「NG」である場合の表示例であり、ディスプレイ50の画面には、装着状態の評価(「NG」)を表す情報93、および測定部位に対するセンサ部40の位置を移動させる方向をガイドする情報94を、他の情報(インジケータ情報G1,G2および文字CH)と同一画面で表示する。図10(A)の情報94は、ディスプレイ50の円形の筐体を、円の中心で同心円状に回転させることをガイドする情報であり、回転方向を示す矢印マークで示される。これに対して図10(B)の情報94は、ディスプレイ50の筐体を上下方向に動かすことをガイドする情報であり、上下方向を示す矢印マークで示される。 (Display example of guide information)
10, 11 and 12 are diagrams showing other display examples of guide information according to the first embodiment. In FIG. 10, the case where the housing (screen) of the
図10(C)は装着状態が「OK」と評価される場合の表示例であり、ディスプレイ50には、装着状態の評価(「OK」)を表す情報93、および上記の移動方向の情報94に代えて、センサ部40の位置を固定することをガイドする情報95が、他の情報(インジケータ情報G1,G2および文字CH)とともに同一画面で表示される。固定ガイドの情報95は、例えば“固定して下さい”のメッセージであるが、これに限定されない。
FIG. 10C is a display example in the case where the mounting state is evaluated as “OK”, and the display 50 displays information 93 indicating the evaluation of the mounting state (“OK”) and the information 94 of the moving direction described above. Instead of the above, information 95 for guiding fixing of the position of the sensor unit 40 is displayed on the same screen together with other information (the indicator information G1, G2 and the character CH). The fixed guide information 95 is, for example, a message "Please fix", but is not limited to this.
なお、装着状態が「OK」と評価される時、センサ部40の位置を固定することをガイドする情報95は、装着状態が「NG」と評価されるときの情報93および情報94に代わって、ディスプレイ50に表示される。
In addition, when the mounting state is evaluated as "OK", the information 95 guiding the fixing of the position of the sensor unit 40 is replaced with the information 93 and the information 94 when the mounting state is evaluated as "NG". , And displayed on the display 50.
図11では、ディスプレイ50の筐体(画面)が矩形であるケースが示される。図11(A)と図11(B)は装着状態が「NG」と評価される場合の表示例である。図11(A)の情報94は、ディスプレイ50の矩形の筐体を、矩形の中心で同心円状に回転させることをガイドする情報であり、回転方向を示す矢印マーク(向きが異なる2つの矢印の組)で示される。図11(C)は装着状態が「OK」と評価される場合の表示例である。
FIG. 11 shows a case where the housing (screen) of the display 50 is rectangular. FIG. 11A and FIG. 11B are display examples when the mounting state is evaluated as “NG”. Information 94 in FIG. 11A is information for guiding the rectangular casing of the display 50 to rotate concentrically at the center of the rectangle, and is an arrow mark indicating the rotation direction (the two arrows having different directions. Shown in the figure). FIG. 11C is a display example in the case where the mounting state is evaluated as “OK”.
図12は、図11の変形例である。図12(A)では、情報94は、図11(A)の情報94の向きが異なる2つの矢印マークからなる組ではなく、両方向の1個の矢印で示される。
FIG. 12 is a modification of FIG. In FIG. 12A, the information 94 is indicated not by a set of two arrow marks different in the direction of the information 94 of FIG. 11A, but by a single arrow in both directions.
このように、ユーザは、センサ部40の測定部位に対する位置を調整することが必要であることが情報93でガイドされるとき、同一画面の情報94により、移動は上下方向の移動または回転移動のいずれで行うべきかについてもガイドされる。したがって、ユーザは、情報94の移動方向に従いディスプレイ50の筐体を操作することで、装着状態「OK」となるように、センサ部40と測定部位との相対的な位置関係を効率的に調整することができる。なお、上下方向の移動または回転移動のいずれで行うべきかについてのガイド情報(矢印マークのアイコンに相当)も、(第1脈波信号PS1の振幅の大きさ,第2脈波信号PS2に振幅の大きさ)の組合せに基づき決定される情報であり、当該組に対応付けて上記に述べた画像データ54の中に予め含まれている。
Thus, when the user is guided by the information 93 that the user needs to adjust the position of the sensor unit 40 relative to the measurement site, the movement is vertical movement or rotational movement according to the information 94 on the same screen. You will be guided as to which to do. Therefore, the user operates the housing of the display 50 in accordance with the moving direction of the information 94 to efficiently adjust the relative positional relationship between the sensor unit 40 and the measurement site so that the mounting state is "OK". can do. The guide information (corresponding to the icon of the arrow mark) as to whether the movement should be performed in the vertical direction or the rotational movement (the magnitude of the amplitude of the first pulse wave signal PS1 and the amplitude of the second pulse wave signal PS2) The information is determined based on the combination of (size) and is included in advance in the image data 54 described above in association with the set.
上記の表示は、血圧計1を左の手首90に装着した場合であったが、右の手首に装着する場合でも同様に実施することができる。その場合は、第1脈波センサ40-1と第2脈波センサ40-2の測定部位に対する配置態様が、左の手首90に装着する場合と逆となるから、各脈波センサの出力に対応する第1インジケータ情報G1,第2インジケータ情報G2のディスプレイ50における表示位置も逆となる。また、CPU100は、血圧計1が装着された部位が左手首または右手首のいずれであるかは、操作部52からのユーザ入力で判定することができる。または、血圧計1に加速度センサを備えて、CPU100は、加速度センサの出力から、左右のいずれの側に装着されているかを判断するとしてもよい。
Although the above-mentioned display was a case where the sphygmomanometer 1 was attached to the left wrist 90, it can be implemented similarly, also when attaching to the right wrist. In that case, the arrangement of the first pulse wave sensor 40-1 and the second pulse wave sensor 40-2 with respect to the measurement site is the reverse of the case of mounting on the left wrist 90. The display positions of the corresponding first indicator information G1 and second indicator information G2 on the display 50 are also reversed. Further, the CPU 100 can determine whether the site on which the sphygmomanometer 1 is attached is the left wrist or the right wrist, based on user input from the operation unit 52. Alternatively, the sphygmomanometer 1 may be equipped with an acceleration sensor, and the CPU 100 may determine, from the output of the acceleration sensor, which side it is attached to on the left or right.
(測定結果の格納例)
図13は、実施の形態1に係る測定結果の格納例を示す図である。図13を参照して、メモリ51は血圧計1の測定結果を記録するテーブル394を格納する。図13を参照して、テーブル394は、測定のデータをレコード単位で格納する。各レコードは、当該レコードを一意に識別するためのID(identification)のデータ39E、測定日時のデータ39G、オシロメトリック法に従う血圧算出部113による算出(推定)された血圧値(収縮期血圧SBPと拡張期血圧DBP)および脈拍数PLSを含むデータ39H、PTTに基づく血圧測定時の装着状態の評価である「OK」または「NG」を表すデータ39I、およびPTTに基づく血圧算出部112により算出(推定)された血圧値を示すデータ39Jを関連付けて含む。 (Example of storing measurement results)
FIG. 13 is a diagram showing an example of storage of measurement results according to the first embodiment. Referring to FIG. 13,memory 51 stores a table 394 for recording the measurement results of blood pressure monitor 1. Referring to FIG. 13, table 394 stores measurement data in record units. Each record includes ID (identification) data 39E for uniquely identifying the record, measurement date and time data 39G, blood pressure values calculated (estimated) by the blood pressure calculation unit 113 according to the oscillometric method (systolic blood pressure SBP and Data 39H including diastolic blood pressure DBP) and pulse rate PLS, data 39I representing "OK" or "NG" which is an evaluation of the wearing condition at the time of blood pressure measurement based on PTT, and calculated by blood pressure calculation unit 112 based on PTT Data 39J indicating the estimated blood pressure value is associated and included.
図13は、実施の形態1に係る測定結果の格納例を示す図である。図13を参照して、メモリ51は血圧計1の測定結果を記録するテーブル394を格納する。図13を参照して、テーブル394は、測定のデータをレコード単位で格納する。各レコードは、当該レコードを一意に識別するためのID(identification)のデータ39E、測定日時のデータ39G、オシロメトリック法に従う血圧算出部113による算出(推定)された血圧値(収縮期血圧SBPと拡張期血圧DBP)および脈拍数PLSを含むデータ39H、PTTに基づく血圧測定時の装着状態の評価である「OK」または「NG」を表すデータ39I、およびPTTに基づく血圧算出部112により算出(推定)された血圧値を示すデータ39Jを関連付けて含む。 (Example of storing measurement results)
FIG. 13 is a diagram showing an example of storage of measurement results according to the first embodiment. Referring to FIG. 13,
血圧出力制御部114は、メモリ51に測定日時のデータ39Gに関連付けて、当該日時に測定されたオシロメトリック法に従う血圧および脈拍数のデータ39H、およびPTTに基づく血圧値のデータ39Jを格納する。
The blood pressure output control unit 114 stores in the memory 51 the blood pressure and pulse rate data 39H according to the oscillometric method measured according to the measurement date and time, and the data 39J of the blood pressure value based on the PTT in association with the measurement date data 39G.
テーブル394における測定データの記憶の態様は、図13に示すようなレコード単位には限定されない。血圧が測定される毎に、検出されたデータ39E~39Jが関連付け(紐付け)される態様であればよい。
The manner of storing measurement data in the table 394 is not limited to the record unit as shown in FIG. Any mode may be used as long as the detected data 39E to 39J are associated (linked) each time the blood pressure is measured.
(他の表示例)
図14は、実施の形態1に係る他の表示例を示す図である。図14(A)を参照して、ディスプレイ50の画面には、測定結果として、装着状態の評価40Bと、収縮期血圧SBP、拡張期血圧DBPおよび脈拍数PLSと、PTTに基づく測定血圧EBPと、測定日時のデータが表示される。図14(A)では装着状態の評価40Bにより、装着状態の評価が「OK」であったことが「GOOD」の文字によって表示される。ユーザは、装着状態の評価40Bの情報から、表示される血圧EBPが信頼できる値であるかに関する信頼度の目安を得ることもできる。 (Other display example)
FIG. 14 is a diagram showing another display example according to the first embodiment. Referring to FIG. 14A, on the screen ofdisplay 50, evaluation 40B of the wearing state, systolic blood pressure SBP, diastolic blood pressure DBP and pulse rate PLS, and measured blood pressure EBP based on PTT are shown as measurement results. , Data of measurement date and time are displayed. In FIG. 14 (A), it is displayed by the character of "GOOD" that evaluation of the mounting state was "OK" by evaluation 40B of the mounting state. The user can also obtain an indication of the reliability as to whether the displayed blood pressure EBP is a reliable value from the information of the evaluation 40B of the wearing state.
図14は、実施の形態1に係る他の表示例を示す図である。図14(A)を参照して、ディスプレイ50の画面には、測定結果として、装着状態の評価40Bと、収縮期血圧SBP、拡張期血圧DBPおよび脈拍数PLSと、PTTに基づく測定血圧EBPと、測定日時のデータが表示される。図14(A)では装着状態の評価40Bにより、装着状態の評価が「OK」であったことが「GOOD」の文字によって表示される。ユーザは、装着状態の評価40Bの情報から、表示される血圧EBPが信頼できる値であるかに関する信頼度の目安を得ることもできる。 (Other display example)
FIG. 14 is a diagram showing another display example according to the first embodiment. Referring to FIG. 14A, on the screen of
図14(A)の表示例は、例えば、血圧測定が終了するとき(ステップS9)の表示例、または図13のテーブル394から読出されたデータの表示例に相当する。図14(A)の血圧の情報は、血圧出力制御部114がディスプレイ50を制御することにより表示される。具体的には、血圧出力制御部114は、PTTに基づく血圧算出部112により算出された血圧、またはオシロメトリック法に基づく血圧算出部113により算出された血圧の値に基づく表示データを生成し、表示データに基づき、ディスプレイ50を駆動する。または、血圧出力制御部114が、図13のテーブル394の関連付けられたデータ39Hおよびデータ39Jに基づき表示データを生成し、生成した表示データに基づき、ディスプレイ50を駆動する。これにより、血圧出力制御部114は、測定された血圧のデータまたはテーブル394に格納された血圧のデータをディスプレイ50に表示することができる。
The display example shown in FIG. 14A corresponds to, for example, a display example when the blood pressure measurement ends (step S9) or a display example of data read from the table 394 in FIG. The blood pressure output control unit 114 controls the display 50 to display the information on the blood pressure in FIG. Specifically, the blood pressure output control unit 114 generates display data based on the blood pressure calculated by the blood pressure calculation unit 112 based on PTT or the blood pressure value calculated by the blood pressure calculation unit 113 based on oscillometric method, The display 50 is driven based on the display data. Alternatively, the blood pressure output control unit 114 generates display data based on the associated data 39H and data 39J of the table 394 of FIG. 13 and drives the display 50 based on the generated display data. Thereby, the blood pressure output control unit 114 can display the measured blood pressure data or the blood pressure data stored in the table 394 on the display 50.
(更なる他の表示例)
図15は、実施の形態1に係る更なる他の表示例を示す図である。図15のガイド情報は、第1脈波センサ40-1または第2脈波センサ40-2からの第1脈波信号PS1または第2脈波信号PS2の振幅値(信号強度)だけでなく、振幅値の変化も提示する。 (Further another display example)
FIG. 15 is a diagram showing still another display example according to the first embodiment. The guide information in FIG. 15 includes not only the amplitude value (signal strength) of the first pulse wave signal PS1 or the second pulse wave signal PS2 from the first pulse wave sensor 40-1 or the second pulse wave sensor 40-2. It also presents the change in amplitude value.
具体的には、図15では、ガイド情報に従いユーザが行うセンサ部40の位置調整に伴なって、振幅値に基づくガイド情報が図15(A)→図15(B)→図15(C)と変化するケースが示される。具体的には、図15(A)では、例えば、第1脈波信号PS1の振幅値(信号強度)は閾値TA(ここでは、4個分のピクトグラムに相当)を超えているが、第2脈波信号PS2の振幅値は閾値TA未満である。
Specifically, in FIG. 15, along with the position adjustment of the sensor unit 40 performed by the user according to the guide information, the guide information based on the amplitude value is from FIG. 15 (A) → FIG. 15 (B) → FIG. And changing cases are shown. Specifically, in FIG. 15A, for example, although the amplitude value (signal strength) of the first pulse wave signal PS1 exceeds the threshold value TA (here, it corresponds to four pictograms), the second The amplitude value of the pulse wave signal PS2 is less than the threshold value TA.
ユーザは、図15(A)のガイド情報に従い、ディスプレイ50を右方向に押してセンサ部40の位置調整を行う。この結果、CPU100は、第2脈波信号PS2の振幅値が図15(A)に示す移動前の振幅値から変化し小さくなったと判断したときは、CPU100は、図15(B)のように、第2インジケータ情報G2のピクトグラムの色を変化させる。この表示色の変化により、ユーザに対して、位置調整が適切でないことをガイドすることができる。
The user adjusts the position of the sensor unit 40 by pushing the display 50 in the right direction in accordance with the guide information of FIG. As a result, when the CPU 100 determines that the amplitude value of the second pulse wave signal PS2 has changed from the amplitude value before movement shown in FIG. 15A and has become smaller, the CPU 100 performs processing as shown in FIG. , The color of the pictogram of the second indicator information G2 is changed. This change in display color can guide the user that the position adjustment is not appropriate.
ユーザは、図15(B)の第2インジケータ情報G2の色の変化に従い、ディスプレイ50を左方向に押してセンサ部40の位置調整を行う。この結果、センサ部40(第1脈波センサ40-1および第2脈波センサ40-2)の位置が、橈骨動脈91の真上に移動する。この場合は、CPU100は、第2脈波信号PS2の振幅値は、図15(B)の移動前の振幅値よりも変化し大きくなったと判断し、判断に基づき、図15(C)のように、第2インジケータ情報G2のピクトグラムを元の色に変化させる。図15(C)のガイド情報により、ユーザに対して、位置調整が適切であったことをガイドすることができる。
The user adjusts the position of the sensor unit 40 by pushing the display 50 in the left direction according to the change of the color of the second indicator information G2 in FIG. As a result, the position of the sensor unit 40 (the first pulse wave sensor 40-1 and the second pulse wave sensor 40-2) moves directly above the radial artery 91. In this case, the CPU 100 determines that the amplitude value of the second pulse wave signal PS2 has changed and become larger than the amplitude value before the movement of FIG. 15 (B), and based on the determination, as shown in FIG. Then, the pictogram of the second indicator information G2 is changed to the original color. The guide information in FIG. 15C can guide the user that the position adjustment was appropriate.
(更なる他の表示例)
図16は、実施の形態1に係る更なる他の表示例を示す図である。図16では、第1脈波信号PS1と第2脈波信号PS2の信号強度(脈波振幅値)の時間経過に従う変化と、これに関連付けて、装着状態の評価を示すアイコン50-4の表示態様の変化が示される。 (Further another display example)
FIG. 16 is a diagram showing still another display example according to the first embodiment. In FIG. 16, the change of the signal intensity (pulse wave amplitude value) of the first pulse wave signal PS1 and the second pulse wave signal PS2 according to the passage of time, and the display of the icon 50-4 showing the evaluation of the wearing state A change of aspect is shown.
具体的には、装着開始から時刻T1までは第1脈波信号PS1および第2脈波信号PS2の信号強度(脈波振幅値)は閾値TAを超えている。したがって、装着開始から時刻T1までは、CPU100は、ディスプレイ50のアイコン50-4を、装着状態「OK」を表す文字と色で表示する。時刻T1で第2脈波信号PS2の脈波振幅値が閾値TA以下となったとき、CPU100は、ディスプレイ50のアイコン50-4を、装着状態「注意」を表す文字と色に変化させる。さらに、CPU100は、当該脈波振幅値が閾値TA以下である状態が時刻T1から予め定められた時間(例えば、時間TM)継続したと判断したとき、CPU100は、ディスプレイ50のアイコン50-4を、装着状態「NG」を表す文字と色に変化させる。
Specifically, the signal intensity (pulse wave amplitude value) of the first pulse wave signal PS1 and the second pulse wave signal PS2 exceeds the threshold value TA from the start of mounting to time T1. Therefore, from the mounting start to the time T1, the CPU 100 displays the icon 50-4 of the display 50 with characters and colors representing the mounting state "OK". When the pulse wave amplitude value of the second pulse wave signal PS2 becomes equal to or less than the threshold value TA at time T1, the CPU 100 changes the icon 50-4 of the display 50 to a character and color representing the wearing state "attention". Furthermore, when CPU 100 determines that the state in which the pulse wave amplitude value is equal to or less than threshold value TA continues from time T1 for a predetermined time (for example, time TM), CPU 100 displays icon 50-4 on display 50. , Change the character and color representing the mounting state "NG".
図15または図16によれば、ガイド情報を表示する場合、第1脈波信号PS1の脈波信号の振幅の大きさまたは第2脈波信号PS2の脈波信号の振幅の大きさが変化したとき、当該ガイド情報に当該変化を報知する情報を含めることもできる。したがって、ユーザに対して装着状態の評価の変化を、アイコン50-4による文字と色の変化でガイドすることが可能になる。
According to FIG. 15 or FIG. 16, when the guide information is displayed, the magnitude of the amplitude of the pulse wave signal of the first pulse wave signal PS1 or the magnitude of the amplitude of the pulse wave signal of the second pulse wave signal PS2 has changed. At the same time, the guide information may include information for notifying the change. Therefore, it is possible to guide the change of the evaluation of the wearing state to the user by the change of the character and the color by the icon 50-4.
なお、機器(血圧計1または後述する携帯型端末10B)を振動させてガイドする場合には、アイコン50-4によるガイド情報の変化に連動して、当該振動の強さまたは周期を変化させてもよい。
When the device (blood pressure monitor 1 or the portable terminal 10B described later) is vibrated and guided, the strength or period of the vibration is changed in conjunction with the change of the guide information by the icon 50-4. It is also good.
(更なる他の表示例)
実施の形態1では、装着の状態を評価する情報を、PTTに基づき測定された血圧EBPを評価する情報と関連づけて表示する。図17は、実施の形態1に係る更なる他の表示例を示す図である。図17では、ディスプレイ50に表示されるアイコン50-5は、装着状態の評価を示す部分50-1と、PTTに基づき測定された血圧EBPの評価を示す部分50-2を有する。CPU100は、アイコン50-5の装着状態の評価の部分50-1の色と、血圧EBPの評価の部分50-2の色を、対応する評価の内容に従い変化させる。これにより、ユーザに対して、装着状態の評価(「OK」、「NG」、「装着しなおし」等)と、測定された血圧EBPの評価(正常血圧、高血圧など)を関連付けながらガイドすることができる。 (Further another display example)
In the first embodiment, the information for evaluating the wearing state is displayed in association with the information for evaluating the blood pressure EBP measured based on the PTT. FIG. 17 is a diagram showing still another display example according to the first embodiment. In FIG. 17, the icon 50-5 displayed on thedisplay 50 has a portion 50-1 indicating the evaluation of the wearing state and a portion 50-2 indicating the evaluation of the blood pressure EBP measured based on the PTT. The CPU 100 changes the color of the portion 50-1 of the evaluation of the wearing state of the icon 50-5 and the color of the portion 50-2 of the evaluation of the blood pressure EBP in accordance with the contents of the corresponding evaluation. In this way, the user is guided while relating the evaluation of the wearing state (“OK”, “NG”, “reseating”, etc.) and the evaluation of the measured blood pressure EBP (normal blood pressure, hypertension, etc.) Can.
実施の形態1では、装着の状態を評価する情報を、PTTに基づき測定された血圧EBPを評価する情報と関連づけて表示する。図17は、実施の形態1に係る更なる他の表示例を示す図である。図17では、ディスプレイ50に表示されるアイコン50-5は、装着状態の評価を示す部分50-1と、PTTに基づき測定された血圧EBPの評価を示す部分50-2を有する。CPU100は、アイコン50-5の装着状態の評価の部分50-1の色と、血圧EBPの評価の部分50-2の色を、対応する評価の内容に従い変化させる。これにより、ユーザに対して、装着状態の評価(「OK」、「NG」、「装着しなおし」等)と、測定された血圧EBPの評価(正常血圧、高血圧など)を関連付けながらガイドすることができる。 (Further another display example)
In the first embodiment, the information for evaluating the wearing state is displayed in association with the information for evaluating the blood pressure EBP measured based on the PTT. FIG. 17 is a diagram showing still another display example according to the first embodiment. In FIG. 17, the icon 50-5 displayed on the
(装着状態の判定時期の変形例)
血圧計1の装着状態の判定を実施する時間は、上記に述べたPTTに従う血圧測定時(図9参照)に限定されない。例えば、CPU100は、ユーザが血圧計1を装着中と判定する間は、定期的に装着状態を判定し、判定結果に基づき上記のガイド情報を表示してもよい。 (Modified example of the judgment time of wearing condition)
The time to carry out the determination of the mounting state of thesphygmomanometer 1 is not limited to the time of blood pressure measurement according to the PTT described above (see FIG. 9). For example, while the CPU 100 determines that the user is wearing the sphygmomanometer 1, the CPU 100 may periodically determine the wearing state, and may display the above-described guide information based on the determination result.
血圧計1の装着状態の判定を実施する時間は、上記に述べたPTTに従う血圧測定時(図9参照)に限定されない。例えば、CPU100は、ユーザが血圧計1を装着中と判定する間は、定期的に装着状態を判定し、判定結果に基づき上記のガイド情報を表示してもよい。 (Modified example of the judgment time of wearing condition)
The time to carry out the determination of the mounting state of the
より具体的には、CPU100の脈波判定部101は、血圧計1が装着中と判定される間は、常に(例えば、定期の一定間隔で)、(振幅の大きさ>閾値TA)の条件が満たされるかを判定する。そして、ガイド情報決定部102は、装着状態の評価(OKまたはNG)を含むガイド情報を設定し、表示制御部103はガイド情報をディスプレイ50に表示する。この表示態様は、例えば、図10(A),図10(B)、または図11(A),図11(B)、または図12(A),図12(B)に示される。
More specifically, while the pulse wave determination unit 101 of the CPU 100 determines that the sphygmomanometer 1 is being worn, the condition of (magnitude of amplitude> threshold value TA) is always (for example, at regular fixed intervals) To determine if Then, the guide information determination unit 102 sets guide information including the evaluation (OK or NG) of the mounting state, and the display control unit 103 displays the guide information on the display 50. This display mode is shown, for example, in FIG. 10 (A), FIG. 10 (B), FIG. 11 (A), FIG. 11 (B), or FIG. 12 (A), FIG. 12 (B).
また、CPU100は、血圧計1の装着状態において検出される脈波信号PS1のピークA1または脈波信号PS2のピークA2が、閾値TA未満であると判定したときは、または閾値TA未満であると判定した回数が、予め定められた回数連続したときは、装着のしなおしを促すアラーム40C(またはエラー)を、ディスプレイ50に表示する(図14(B)参照)。
When CPU 100 determines that peak A1 of pulse wave signal PS1 or peak A2 of pulse wave signal PS2 detected in the attached state of sphygmomanometer 1 is less than threshold value TA, or is less than threshold value TA. When the number of times of determination has continued for a predetermined number of times, an alarm 40C (or an error) prompting the user to reattach is displayed on the display 50 (see FIG. 14B).
または、脈波信号PS1のピークA1または脈波信号PS2のピークA2が閾値TA1(<TA)未満となったときは、または脈波信号PS1のピークA1または脈波信号PS2のピークA2が閾値TA1(<TA)未満となった回数が予め定められた回数連続しときは、CPU100は、アラーム40C(またはエラー)を、ディスプレイ50に表示する(図14(B)参照)。
Alternatively, when the peak A1 of the pulse wave signal PS1 or the peak A2 of the pulse wave signal PS2 is less than the threshold value TA1 (<TA), the peak A1 of the pulse wave signal PS1 or the peak A2 of the pulse wave signal PS2 is the threshold value TA1. When the number of times less than (<TA) continues a predetermined number of times, the CPU 100 displays an alarm 40C (or an error) on the display 50 (see FIG. 14B).
図14(B)では、アラーム40Cとして‘装着しなおし’の文字メッセージを示したが、文字メッセージに限定されず、予め定められた画像(動画,静止画)を含む他の情報であってもよい。
In FIG. 14 (B), the text message of 'reinserted' is shown as the alarm 40C, but it is not limited to the text message, and may be other information including a predetermined image (moving image, still image). Good.
ユーザは、血圧計1の装着中は、ディスプレイ50の画面を確認することにより、常に、装着状態の適否または装着しなおしの要否を確認することが可能となる。なお、装着中における装着状態の評価(「OK」または「NG」)を表す情報93またはアラーム40Cの出力態様は、ディスプレイ50の表示に限定されず、音声の出力または振動を含む他の態様であってもよい。
While the sphygmomanometer 1 is being worn, the user can always check whether or not the wearing state is appropriate or not, by checking the screen of the display 50. In addition, the output mode of the information 93 or the alarm 40C representing the evaluation ("OK" or "NG") of the wearing state during wearing is not limited to the display of the display 50, but is another mode including audio output or vibration. It may be.
[実施の形態2]
図18は、実施の形態2に係るシステムの概略的な構成を示す図である。上記の血圧計1は、外部の情報処理装置であるサーバ30または携帯型端末10Bと、ネットワーク900を介し通信する。図18のシステムでは、血圧計1はLANを介して携帯型端末10Bと通信し、携帯型端末10Bはインターネットを介してサーバ30と通信する。これにより、血圧計1は携帯型端末10Bを経由してサーバ30と通信することができる。なお、血圧計1は、携帯型端末10Bを経由せずに、サーバ30と通信してもよい。 Second Embodiment
FIG. 18 is a diagram showing a schematic configuration of a system according to a second embodiment. Thesphygmomanometer 1 described above communicates with the server 30 or the portable terminal 10 B, which is an external information processing device, via the network 900. In the system of FIG. 18, the sphygmomanometer 1 communicates with the portable terminal 10B via the LAN, and the portable terminal 10B communicates with the server 30 via the Internet. Thereby, the sphygmomanometer 1 can communicate with the server 30 via the portable terminal 10B. The sphygmomanometer 1 may communicate with the server 30 without passing through the portable terminal 10B.
図18は、実施の形態2に係るシステムの概略的な構成を示す図である。上記の血圧計1は、外部の情報処理装置であるサーバ30または携帯型端末10Bと、ネットワーク900を介し通信する。図18のシステムでは、血圧計1はLANを介して携帯型端末10Bと通信し、携帯型端末10Bはインターネットを介してサーバ30と通信する。これにより、血圧計1は携帯型端末10Bを経由してサーバ30と通信することができる。なお、血圧計1は、携帯型端末10Bを経由せずに、サーバ30と通信してもよい。 Second Embodiment
FIG. 18 is a diagram showing a schematic configuration of a system according to a second embodiment. The
上記の実施の形態1では、装着中における装着状態の評価を表す「OK」または「NG」の情報93、またはアラーム40Cは血圧計1のディスプレイ50に表示されたが、CPU100は装着状態の評価の情報93、またはアラーム40Cを携帯型端末10Bに送信し、表示部158に表示させるようにしてもよい。これにより、血圧計1は、携帯型端末10Bの表示部158の表示から、装着状態の評価を出力することができる。また、携帯型端末10Bは、装着状態の評価の情報93またはアラーム40Cを、携帯型端末10Bの振動、または音声を含む他の出力態様で報知してもよい。
In the first embodiment described above, although the information “OK” or “NG” 93 indicating the evaluation of the wearing state during wearing or the alarm 40C is displayed on the display 50 of the sphygmomanometer 1, the CPU 100 evaluates the wearing state The information 93 or the alarm 40C may be transmitted to the portable terminal 10B and displayed on the display unit 158. Thereby, the sphygmomanometer 1 can output the evaluation of the wearing state from the display of the display unit 158 of the portable terminal 10B. In addition, the portable terminal 10B may notify the information 93 of the evaluation of the wearing state or the alarm 40C in another output mode including vibration or voice of the portable terminal 10B.
上記の実施の形態1では、測定結果(図14(A))を血圧計1のディスプレイ50に表示させたが、表示先は、携帯型端末10Bの表示部158であってもよく、ディスプレイ50と表示部158の両方であってもよい。また、図13のテーブル394に示す測定結果の格納先は、血圧計1のメモリ51に限定されない。例えば、携帯型端末10Bの記憶部、またはサーバ30の記憶部32Aであってもよい。または、メモリ51、携帯型端末10Bの記憶部、およびサーバ30の記憶部32Aの2つ以上に格納されてもよい。
In the first embodiment described above, the measurement result (FIG. 14A) is displayed on the display 50 of the sphygmomanometer 1, but the display destination may be the display unit 158 of the portable terminal 10B. And the display unit 158 may be used. Further, the storage destination of the measurement results shown in the table 394 of FIG. 13 is not limited to the memory 51 of the sphygmomanometer 1. For example, the storage unit of the portable terminal 10B or the storage unit 32A of the server 30 may be used. Alternatively, it may be stored in two or more of the memory 51, the storage unit of the portable terminal 10B, and the storage unit 32A of the server 30.
[実施の形態3]
上述した実施の形態において、コンピュータを機能させて、上述のフローチャートで説明したような制御を実行させるプログラムを提供することもできる。このようなプログラムは、血圧計1のコンピュータに付属するCD(Compact Disk Read Only Memory)、二次記憶装置、主記憶装置およびメモリカードなどの一時的でないコンピュータ読取り可能な記録媒体にて記録させて提供することもできる。あるいは、コンピュータに内蔵するハードディスクなどの記録媒体にて記録させて、プログラムを提供することもできる。また、ネットワーク900を介したダウンロードによって、プログラムを提供することもできる。 Third Embodiment
In the above-described embodiment, it is possible to provide a program that causes a computer to function to execute control as described in the above-described flowchart. Such a program is recorded on a non-temporary computer readable recording medium such as a CD (Compact Disk Read Only Memory) attached to the computer of theblood pressure monitor 1, a secondary storage device, a main storage device and a memory card. It can also be provided. Alternatively, the program can be provided by being recorded in a recording medium such as a hard disk built in the computer. Alternatively, the program can be provided by downloading via the network 900.
上述した実施の形態において、コンピュータを機能させて、上述のフローチャートで説明したような制御を実行させるプログラムを提供することもできる。このようなプログラムは、血圧計1のコンピュータに付属するCD(Compact Disk Read Only Memory)、二次記憶装置、主記憶装置およびメモリカードなどの一時的でないコンピュータ読取り可能な記録媒体にて記録させて提供することもできる。あるいは、コンピュータに内蔵するハードディスクなどの記録媒体にて記録させて、プログラムを提供することもできる。また、ネットワーク900を介したダウンロードによって、プログラムを提供することもできる。 Third Embodiment
In the above-described embodiment, it is possible to provide a program that causes a computer to function to execute control as described in the above-described flowchart. Such a program is recorded on a non-temporary computer readable recording medium such as a CD (Compact Disk Read Only Memory) attached to the computer of the
今回開示された実施の形態はすべての点で例示であって制限的なものではないと考えられるべきである。本発明の範囲は、上記した説明ではなく、請求の範囲によって示され、請求の範囲と均等の意味および範囲内でのすべての変更が含まれることが意図される。
It should be understood that the embodiments disclosed herein are illustrative and non-restrictive in every respect. The scope of the present invention is indicated not by the above description but by the scope of the claims, and is intended to include all modifications within the scope and meaning equivalent to the scope of the claims.
1 血圧計、10B 携帯型端末、20 ベルト、20a,23a,24a 内周面、20b,21a 外周面、21 圧迫力フ、24 押圧カフ、30 サーバ、40-1 第1脈波センサ、40-2 第2脈波センサ、40 センサ部、40B 装着状態の評価、50 ディスプレイ、51 メモリ、52 操作部、54 画像データ、59 通信部、40C アラーム、90 手首、91 橈骨動脈、101 脈波判定部、102 ガイド情報決定部、103 表示制御部、158 表示部、900 ネットワーク、A1,A2 ピーク、CH 文字、D 間隔、DBP 拡張期血圧、EBP 血圧、G1 第1インジケータ情報、G2 第2インジケータ情報、PLS 脈拍数、PS1 第1脈波信号、PS2 第2脈波信号、SBP 収縮期血圧、TA,Th 閾値、i 定電流、r 相互相関係数、v1,v2 電圧信号。
1 Sphygmomanometer, 10B portable terminal, 20 belt, 20a, 23a, 24a inner circumferential surface, 20b, 21a outer circumferential surface, 21 compression force, 24 pressing cuff, 30 server, 40-1 first pulse wave sensor, 40- 2 second pulse wave sensor, 40 sensor unit, 40B evaluation of mounting condition, 50 display, 51 memory, 52 operation unit, 54 image data, 59 communication unit, 40C alarm, 90 wrist, 91 radial artery, 101 pulse wave determination unit , 102 guide information determination unit, 103 display control unit, 158 display unit, 900 network, A1, A2 peak, CH letter, D interval, DBP diastolic blood pressure, EBP blood pressure, G1 first indicator information, G2 second indicator information, PLS pulse rate, PS1 first pulse wave signal, PS2 second pulse wave signal, S P systolic blood pressure, TA, Th threshold, i constant current, r cross-correlation coefficient, v1, v2 voltage signal.
Claims (15)
- 測定装置に備えられる表示制御装置であって、
前記測定装置は、
脈波伝搬時間の測定部位に巻き付け装着されるベルトと、
前記ベルトが装着される場合に、前記ベルトの前記測定部位の側となる面である内周面に設けられるセンサ部と、
前記ベルトの前記内周面とは反対側の面である外周面に設けられるディスプレイと、を備え、
前記ディスプレイは、前記外周面において、前記ベルトが装着される場合に前記センサ部が位置する部位と対向し得る部位に設けられ、
前記センサ部は、前記ベルトの幅方向に互いに離間した配置で設けられる第1脈波センサおよび第2脈波センサを含み、
前記表示制御装置は、
前記ディスプレイにおいて、前記離間して配置された前記第1脈波センサおよび前記第2脈波センサのそれぞれに対応した位置で、前記第1脈波センサの出力が示す第1脈波振幅の大きさを表す第1インジケータ情報および前記第2脈波センサの出力が示す第2脈波振幅の大きさを表す第2インジケータ情報をそれぞれ表示する、表示制御装置。 A display control device provided in the measurement device,
The measuring device
A belt wound around a measurement site of pulse wave propagation time;
A sensor unit provided on an inner circumferential surface which is a surface on the side of the measurement site of the belt when the belt is mounted;
A display provided on an outer peripheral surface which is a surface opposite to the inner peripheral surface of the belt;
The display is provided on a portion of the outer circumferential surface that can face a portion where the sensor unit is located when the belt is mounted.
The sensor unit includes a first pulse wave sensor and a second pulse wave sensor provided at mutually spaced positions in the width direction of the belt,
The display control device
In the display, a magnitude of a first pulse wave amplitude indicated by an output of the first pulse wave sensor at a position corresponding to each of the first pulse wave sensor and the second pulse wave sensor disposed apart from each other. A display control device that displays first indicator information representing a second indicator information and second indicator information representing a magnitude of a second pulse wave amplitude indicated by an output of the second pulse wave sensor. - 前記表示制御装置は、
前記第1脈波振幅の大きさ、および前記第2脈波振幅の大きさに従うガイド情報であって、前記センサ部と前記測定部位との相対的な位置関係を調整するためのガイド情報を、前記ディスプレイに表示する、請求項1に記載の表示制御装置。 The display control device
The guide information according to the magnitude of the first pulse wave amplitude and the magnitude of the second pulse wave amplitude, the guide information for adjusting the relative positional relationship between the sensor unit and the measurement site, The display control apparatus according to claim 1, wherein the display control apparatus displays the information on the display. - 前記表示制御装置は、
前記ガイド情報を、前記ディスプレイにおいて、前記第1インジケータ情報および前記第2インジケータ情報と同一画面に表示する、請求項2に記載の表示制御装置。 The display control device
The display control device according to claim 2, wherein the guide information is displayed on the same screen as the first indicator information and the second indicator information on the display. - 前記ガイド情報は、
前記測定部位に対する前記センサ部の位置を移動させる方向をガイドする情報を含む、請求項2または3に記載の表示制御装置。 The guide information is
The display control apparatus according to claim 2, further comprising information for guiding a direction in which the position of the sensor unit with respect to the measurement site is moved. - 前記第1脈波振幅の大きさ、または前記第2脈波振幅の大きさが前記予め定められた大きさを示さない場合、前記ガイド情報は前記移動させる方向をガイドする情報を表示する、請求項2から4のいずれか1項に記載の表示制御装置。 When the magnitude of the first pulse wave amplitude or the magnitude of the second pulse wave amplitude does not indicate the predetermined magnitude, the guide information displays information for guiding the moving direction. Item 5. A display control device according to any one of items 2 to 4.
- 前記第1脈波振幅の大きさ、および前記第2脈波振幅の大きさが前記予め定められた大きさを示す場合、前記ガイド情報は前記センサ部の位置を固定することをガイドする情報を含む、請求項5に記載の表示制御装置。 When the magnitude of the first pulse wave amplitude and the magnitude of the second pulse wave amplitude indicate the predetermined magnitude, the guide information guides information for fixing the position of the sensor unit. The display control device according to claim 5, comprising.
- 前記第1脈波振幅の大きさ、および前記第2脈波振幅の大きさが前記予め定められた大きさを示す場合、前記ガイド情報は、前記移動させる方向をガイドする情報に代えて、前記センサ部の位置を固定することをガイドする情報を含む、請求項6に記載の表示制御装置。 When the magnitude of the first pulse wave amplitude and the magnitude of the second pulse wave amplitude indicate the predetermined magnitude, the guide information is replaced with the information for guiding the moving direction, The display control apparatus according to claim 6, further comprising information for guiding fixing of the position of the sensor unit.
- 前記第1脈波振幅の大きさを示す情報および前記第2脈波振幅の大きさを示す情報は、それぞれ、当該脈波振幅の大きさが前記予め定められた大きさを示す場合の表示態様と、当該予め定められた大きさを示さない場合の表示態様とは異なる、請求項5に記載の表示制御装置。 Each of the information indicating the magnitude of the first pulse wave amplitude and the information indicating the magnitude of the second pulse wave amplitude has a display mode in the case where the magnitude of the pulse wave amplitude indicates the predetermined magnitude. The display control device according to claim 5, wherein the display mode is different from the display mode when the predetermined size is not indicated.
- 前記ガイド情報は、
前記測定部位に対する前記装着の状態を評価する情報を含み、
前記評価する情報は、
前記第1脈波振幅の大きさ、および前記第2脈波振幅の大きさが前記予め定められた大きさを示す場合と、前記第1脈波振幅の大きさ、または前記第2脈波振幅の大きさが前記予め定められた大きさを示さない場合とで異なる評価を示す、請求項2から8のいずれか1項に記載の表示制御装置。 The guide information is
Including information for evaluating the state of the attachment to the measurement site,
The information to be evaluated is
When the magnitude of the first pulse wave amplitude and the magnitude of the second pulse wave amplitude indicate the predetermined magnitude, the magnitude of the first pulse wave amplitude, or the second pulse wave amplitude The display control device according to any one of claims 2 to 8, wherein the display control device according to any one of claims 2 to 8 shows different evaluations in the case where the size does not indicate the predetermined size. - 前記第1脈波振幅の大きさ、または前記第2脈波振幅の大きさが前記予め定められた大きさを示さない場合、ガイド情報は、前記巻き付け装着のし直しを促す情報を含む、請求項9に記載の表示制御装置。 When the magnitude of the first pulse wave amplitude or the magnitude of the second pulse wave amplitude does not indicate the predetermined magnitude, the guide information includes information for prompting reattachment of the winding. 10. A display control device according to item 9.
- 前記測定装置は、
表示部を備える外部の情報処理装置と通信する通信部を、さらに備え、
前記ガイド情報を、前記表示部に表示させるために前記通信部を介して前記情報処理装置に送信する、請求項9または10に記載の表示制御装置。 The measuring device
A communication unit for communicating with an external information processing apparatus including the display unit;
The display control device according to claim 9, wherein the guide information is transmitted to the information processing device via the communication unit to cause the display unit to display the guide information. - 前記脈波伝搬時間は、前記第1脈波振幅の大きさおよび前記第2脈波振幅の大きさから算出され、
前記測定装置は、
前記脈波伝搬時間に基づく血圧を算出する、請求項2から11のいずれか1項に記載の表示制御装置。 The pulse wave propagation time is calculated from the magnitude of the first pulse wave amplitude and the magnitude of the second pulse wave amplitude,
The measuring device
The display control device according to any one of claims 2 to 11, wherein a blood pressure based on the pulse wave propagation time is calculated. - 前記ガイド情報は、
前記測定部位に対する前記装着の状態を評価する情報を含み、
前記表示制御装置は、
前記装着の状態を評価する情報を、前記算出された前記血圧を評価する情報と関連づけて表示する、請求項12に記載の表示制御装置。 The guide information is
Including information for evaluating the state of the attachment to the measurement site,
The display control device
The display control device according to claim 12, wherein the information for evaluating the state of attachment is displayed in association with the information for evaluating the calculated blood pressure. - 前記表示制御装置は、さらに、
前記ガイド情報を表示する場合、前記第1脈波振幅の大きさまたは前記第2脈波振幅の大きさが変化したとき、当該ガイド情報に当該変化を報知する情報を含める、請求項2から13のいずれか1項に記載の表示制御装置。 The display control device further includes:
The display device according to any one of claims 2 to 13, wherein, when the guide information is displayed, when the magnitude of the first pulse wave amplitude or the magnitude of the second pulse wave amplitude changes, the guide information includes information for notifying the change. The display control device according to any one of the above. - 装置における表示制御方法をコンピュータに実行させるためのプログラムであって、
前記装置は、
脈波伝搬時間の測定部位に巻き付け装着されるベルトと、
前記ベルトが装着される場合に前記ベルトの前記測定部位の側となる面である内周面に設けられるセンサ部と、
前記ベルトの前記内周面とは反対側の面である外周面に設けられるディスプレイと、を備え、
前記ディスプレイは、前記外周面において、前記ベルトが装着される場合に前記センサ部が位置する部位と対向し得る部位に設けられ、
前記センサ部は、前記ベルトの幅方向に互いに離間した配置で設けられる第1脈波センサおよび第2脈波センサを含み、
前記表示制御方法は、
前記第1脈波センサの出力が示す第1脈波振幅の大きさを表す第1インジケータ情報、および前記第2脈波センサの出力が示す第2脈波振幅の大きさを表す第2インジケータ情報を取得し、
前記ディスプレイにおいて、前記離間して配置された前記第1脈波センサおよび前記第2脈波センサのそれぞれに対応した位置で、前記第1インジケータ情報および前記第2インジケータ情報をそれぞれ表示する、プログラム。 A program for causing a computer to execute a display control method in an apparatus, comprising:
The device
A belt wound around a measurement site of pulse wave propagation time;
A sensor unit provided on an inner circumferential surface which is a surface on the side of the measurement site of the belt when the belt is mounted;
A display provided on an outer peripheral surface which is a surface opposite to the inner peripheral surface of the belt;
The display is provided on a portion of the outer circumferential surface that can face a portion where the sensor unit is located when the belt is mounted.
The sensor unit includes a first pulse wave sensor and a second pulse wave sensor provided at mutually spaced positions in the width direction of the belt,
The display control method is
First indicator information indicating the magnitude of the first pulse wave amplitude indicated by the output of the first pulse wave sensor, and second indicator information indicating the magnitude of the second pulse wave amplitude indicated by the output of the second pulse wave sensor Get
A program for displaying the first indicator information and the second indicator information on the display at positions respectively corresponding to the first pulse wave sensor and the second pulse wave sensor which are disposed apart from each other.
Priority Applications (3)
| Application Number | Priority Date | Filing Date | Title |
|---|---|---|---|
| DE112018004117.4T DE112018004117T5 (en) | 2017-09-12 | 2018-09-05 | DISPLAY CONTROL DEVICE AND PROGRAM |
| CN201880058384.9A CN111225606A (en) | 2017-09-12 | 2018-09-05 | Display control device and program |
| US16/812,464 US20200221961A1 (en) | 2017-09-12 | 2020-03-09 | Display control device and recording medium of program |
Applications Claiming Priority (2)
| Application Number | Priority Date | Filing Date | Title |
|---|---|---|---|
| JP2017-175113 | 2017-09-12 | ||
| JP2017175113A JP6991022B2 (en) | 2017-09-12 | 2017-09-12 | Display control unit and program |
Related Child Applications (1)
| Application Number | Title | Priority Date | Filing Date |
|---|---|---|---|
| US16/812,464 Continuation US20200221961A1 (en) | 2017-09-12 | 2020-03-09 | Display control device and recording medium of program |
Publications (1)
| Publication Number | Publication Date |
|---|---|
| WO2019054254A1 true WO2019054254A1 (en) | 2019-03-21 |
Family
ID=65723590
Family Applications (1)
| Application Number | Title | Priority Date | Filing Date |
|---|---|---|---|
| PCT/JP2018/032903 WO2019054254A1 (en) | 2017-09-12 | 2018-09-05 | Display control device and program |
Country Status (5)
| Country | Link |
|---|---|
| US (1) | US20200221961A1 (en) |
| JP (1) | JP6991022B2 (en) |
| CN (1) | CN111225606A (en) |
| DE (1) | DE112018004117T5 (en) |
| WO (1) | WO2019054254A1 (en) |
Families Citing this family (6)
| Publication number | Priority date | Publication date | Assignee | Title |
|---|---|---|---|---|
| JP6900432B2 (en) * | 2019-08-08 | 2021-07-07 | 京セラ株式会社 | Electronics, control methods, and control programs |
| CN112274126B (en) * | 2020-10-28 | 2022-11-29 | 河北工业大学 | Noninvasive continuous blood pressure detection method and device based on multiple pulse waves |
| JP2023005370A (en) * | 2021-06-29 | 2023-01-18 | オムロンヘルスケア株式会社 | Drive circuit for blood pressure measurement and blood pressure measurement device |
| JP7409360B2 (en) * | 2021-09-07 | 2024-01-09 | カシオ計算機株式会社 | Information processing device, program, and wearing state determination method |
| JP2024002185A (en) * | 2022-06-23 | 2024-01-11 | オムロンヘルスケア株式会社 | Biological information measuring device, biological information processing system, biological information measuring device, and control method of information processing terminal |
| JP2024014477A (en) * | 2022-07-22 | 2024-02-01 | オムロンヘルスケア株式会社 | Biological information measuring device |
Citations (5)
| Publication number | Priority date | Publication date | Assignee | Title |
|---|---|---|---|---|
| JPH01249036A (en) * | 1988-03-29 | 1989-10-04 | Citizen Watch Co Ltd | Electronic watch with pulsimeter |
| JP2004222814A (en) * | 2003-01-21 | 2004-08-12 | Colin Medical Technology Corp | Pressure pulse wave detecting probe |
| JP2009297235A (en) * | 2008-06-12 | 2009-12-24 | Fujitsu Ltd | Guidance method, its device, its program and apparatus |
| JP2014171513A (en) * | 2013-03-06 | 2014-09-22 | Seiko Epson Corp | Biological information detecting apparatus and program |
| JP2017063884A (en) * | 2015-09-28 | 2017-04-06 | 京セラ株式会社 | Measuring apparatus and measuring system |
Family Cites Families (10)
| Publication number | Priority date | Publication date | Assignee | Title |
|---|---|---|---|---|
| EP0936762B9 (en) | 1997-05-02 | 2005-10-05 | Seiko Epson Corporation | Polarized light communication device |
| JP3972141B2 (en) * | 2002-05-09 | 2007-09-05 | オムロンヘルスケア株式会社 | Pulse meter |
| CN101912259B (en) * | 2010-08-06 | 2012-10-10 | 深圳瑞光康泰科技有限公司 | Non-invasive blood pressure measuring device |
| RU2480150C2 (en) * | 2010-09-09 | 2013-04-27 | Общество С Ограниченной Ответственностью "Эмдея" | Device for arterial pressure measurement |
| JP5821657B2 (en) * | 2012-01-25 | 2015-11-24 | オムロンヘルスケア株式会社 | Measuring apparatus and measuring method |
| JP5821658B2 (en) * | 2012-01-25 | 2015-11-24 | オムロンヘルスケア株式会社 | Measuring apparatus and measuring method |
| JP6155448B2 (en) * | 2012-11-01 | 2017-07-05 | アイカム エルエルシー | Wireless wrist computing and controlling device and method for 3D imaging, mapping, networking and interfacing |
| KR102302439B1 (en) * | 2014-02-21 | 2021-09-15 | 삼성전자주식회사 | Electronic device |
| CN105595979A (en) * | 2016-01-21 | 2016-05-25 | 中山大学 | Noninvasive and continuous blood pressure monitoring method and device based on pulse wave propagation time |
| US11589758B2 (en) * | 2016-01-25 | 2023-02-28 | Fitbit, Inc. | Calibration of pulse-transit-time to blood pressure model using multiple physiological sensors and various methods for blood pressure variation |
-
2017
- 2017-09-12 JP JP2017175113A patent/JP6991022B2/en active Active
-
2018
- 2018-09-05 CN CN201880058384.9A patent/CN111225606A/en active Pending
- 2018-09-05 WO PCT/JP2018/032903 patent/WO2019054254A1/en active Application Filing
- 2018-09-05 DE DE112018004117.4T patent/DE112018004117T5/en active Pending
-
2020
- 2020-03-09 US US16/812,464 patent/US20200221961A1/en not_active Abandoned
Patent Citations (5)
| Publication number | Priority date | Publication date | Assignee | Title |
|---|---|---|---|---|
| JPH01249036A (en) * | 1988-03-29 | 1989-10-04 | Citizen Watch Co Ltd | Electronic watch with pulsimeter |
| JP2004222814A (en) * | 2003-01-21 | 2004-08-12 | Colin Medical Technology Corp | Pressure pulse wave detecting probe |
| JP2009297235A (en) * | 2008-06-12 | 2009-12-24 | Fujitsu Ltd | Guidance method, its device, its program and apparatus |
| JP2014171513A (en) * | 2013-03-06 | 2014-09-22 | Seiko Epson Corp | Biological information detecting apparatus and program |
| JP2017063884A (en) * | 2015-09-28 | 2017-04-06 | 京セラ株式会社 | Measuring apparatus and measuring system |
Also Published As
| Publication number | Publication date |
|---|---|
| JP6991022B2 (en) | 2022-02-03 |
| JP2019050853A (en) | 2019-04-04 |
| DE112018004117T5 (en) | 2020-04-30 |
| US20200221961A1 (en) | 2020-07-16 |
| CN111225606A (en) | 2020-06-02 |
Similar Documents
| Publication | Publication Date | Title |
|---|---|---|
| WO2019054254A1 (en) | Display control device and program | |
| WO2019124025A1 (en) | Measurement device and program | |
| US20190307336A1 (en) | Pulse wave measurement device, pulse wave measurement method, and blood pressure measurement device | |
| WO2018123374A1 (en) | Sphygmomanometer, blood pressure measurement method, and device | |
| US11589757B2 (en) | Blood pressure estimation device | |
| JP2018102869A (en) | Pulse wave measurement device, pulse wave measurement method, and blood pressure measurement device | |
| JP7124552B2 (en) | measuring device | |
| WO2018123275A1 (en) | Sphygmomanometer, and method and device for blood pressure measurement | |
| JP6950722B2 (en) | Clock type blood pressure measuring device | |
| JP2019050853A5 (en) | ||
| KR101273619B1 (en) | electronical blood pressure measurement apparatus using bluetooth | |
| US20200205682A1 (en) | Pulse wave measurement device, blood pressure measurement device, equipment, method for measuring pulse wave, and method for measuring blood pressure | |
| JP6741570B2 (en) | Pulse wave measuring device, pulse wave measuring method, and blood pressure measuring device | |
| WO2019102874A1 (en) | Information processing device, information processing method, and information processing program | |
| US20190307340A1 (en) | Blood pressure measurement device and blood pressure measurement method | |
| JP2012152372A (en) | Blood pressure measurement device and blood pressure measurement method | |
| WO2019021649A1 (en) | Measurement device and measurement method | |
| KR101520929B1 (en) | Arm model for training of blood pressure and pulse examination | |
| CN111511273A (en) | Information processing apparatus, information processing method, and information processing program | |
| JP2000254104A (en) | Arteriosclerosis level measurement device | |
| CN108354595A (en) | Measuring device and measuring method |
Legal Events
| Date | Code | Title | Description |
|---|---|---|---|
| 121 | Ep: the epo has been informed by wipo that ep was designated in this application |
Ref document number: 18857134 Country of ref document: EP Kind code of ref document: A1 |
|
| 122 | Ep: pct application non-entry in european phase |
Ref document number: 18857134 Country of ref document: EP Kind code of ref document: A1 |