WO2018123129A1 - 疲労限度応力特定システム、疲労限度応力特定装置及び疲労限度応力特定方法 - Google Patents
疲労限度応力特定システム、疲労限度応力特定装置及び疲労限度応力特定方法 Download PDFInfo
- Publication number
- WO2018123129A1 WO2018123129A1 PCT/JP2017/029846 JP2017029846W WO2018123129A1 WO 2018123129 A1 WO2018123129 A1 WO 2018123129A1 JP 2017029846 W JP2017029846 W JP 2017029846W WO 2018123129 A1 WO2018123129 A1 WO 2018123129A1
- Authority
- WO
- WIPO (PCT)
- Prior art keywords
- fatigue limit
- limit stress
- temperature
- measurement object
- approximate line
- Prior art date
Links
Images


Classifications
-
- G—PHYSICS
- G01—MEASURING; TESTING
- G01N—INVESTIGATING OR ANALYSING MATERIALS BY DETERMINING THEIR CHEMICAL OR PHYSICAL PROPERTIES
- G01N3/00—Investigating strength properties of solid materials by application of mechanical stress
- G01N3/32—Investigating strength properties of solid materials by application of mechanical stress by applying repeated or pulsating forces
- G01N3/36—Investigating strength properties of solid materials by application of mechanical stress by applying repeated or pulsating forces generated by pneumatic or hydraulic means
-
- G—PHYSICS
- G01—MEASURING; TESTING
- G01N—INVESTIGATING OR ANALYSING MATERIALS BY DETERMINING THEIR CHEMICAL OR PHYSICAL PROPERTIES
- G01N3/00—Investigating strength properties of solid materials by application of mechanical stress
- G01N3/02—Details
- G01N3/06—Special adaptations of indicating or recording means
-
- G—PHYSICS
- G01—MEASURING; TESTING
- G01N—INVESTIGATING OR ANALYSING MATERIALS BY DETERMINING THEIR CHEMICAL OR PHYSICAL PROPERTIES
- G01N3/00—Investigating strength properties of solid materials by application of mechanical stress
- G01N3/08—Investigating strength properties of solid materials by application of mechanical stress by applying steady tensile or compressive forces
- G01N3/18—Performing tests at high or low temperatures
-
- G—PHYSICS
- G01—MEASURING; TESTING
- G01N—INVESTIGATING OR ANALYSING MATERIALS BY DETERMINING THEIR CHEMICAL OR PHYSICAL PROPERTIES
- G01N3/00—Investigating strength properties of solid materials by application of mechanical stress
- G01N3/32—Investigating strength properties of solid materials by application of mechanical stress by applying repeated or pulsating forces
- G01N3/34—Investigating strength properties of solid materials by application of mechanical stress by applying repeated or pulsating forces generated by mechanical means, e.g. hammer blows
-
- G—PHYSICS
- G01—MEASURING; TESTING
- G01N—INVESTIGATING OR ANALYSING MATERIALS BY DETERMINING THEIR CHEMICAL OR PHYSICAL PROPERTIES
- G01N2203/00—Investigating strength properties of solid materials by application of mechanical stress
- G01N2203/0058—Kind of property studied
- G01N2203/0069—Fatigue, creep, strain-stress relations or elastic constants
- G01N2203/0073—Fatigue
-
- G—PHYSICS
- G01—MEASURING; TESTING
- G01N—INVESTIGATING OR ANALYSING MATERIALS BY DETERMINING THEIR CHEMICAL OR PHYSICAL PROPERTIES
- G01N2203/00—Investigating strength properties of solid materials by application of mechanical stress
- G01N2203/02—Details not specific for a particular testing method
- G01N2203/022—Environment of the test
- G01N2203/0222—Temperature
Definitions
- the present disclosure relates to a fatigue limit stress specifying system, a fatigue limit stress specifying device, and a fatigue limit stress specifying method for measuring a fatigue limit stress of a measurement object.
- Patent Document 1 specifies fatigue limit stress using a dissipative energy measuring means that adds a repeated stress amplitude to a measurement object and measures a distribution of an average temperature rise caused by energy dissipation in a material within a certain region by an infrared camera. Disclose the system.
- the fatigue limit stress identification system disclosed in Patent Document 1 includes a vibration exciter, an infrared camera, and an information processing device.
- the vibration exciter repeatedly applies a load to the measurement object.
- the infrared camera obtains a temperature image of the measurement object.
- the information processing apparatus has Fourier transform means for processing the temperature image of the measurement object obtained from the infrared camera.
- the information processing apparatus performs a dissipated energy measuring step for measuring the dissipated energy and a fatigue limit stress specifying step for specifying the fatigue limit stress from the measurement result obtained from the dissipated energy measuring step.
- a temperature amplitude image of the fundamental frequency component and second harmonic component of vibration is acquired from the temperature image taken by the infrared camera. Then, in the region where the temperature amplitude of the second harmonic component is maximum, the dissipated energy of the pixel region where the gradient of the load characteristic with respect to the temperature amplitude of the fundamental frequency component is maximum is extracted.
- the fatigue limit stress is identified from the intersection of two approximate lines obtained by the coefficient of freedom adjusted for the degree of freedom and the Gauss-Newton method.
- This disclosure provides a fatigue limit stress identification system that can accurately measure the fatigue limit stress of an object to be measured.
- the fatigue limit for measuring the fatigue limit stress of the measurement object based on the temperature fluctuation of the measurement object generated when the measurement object is vibrated while increasing the load stepwise Provide a stress identification system.
- the fatigue limit stress identification system includes a vibration exciter, a temperature sensor, and an information processing device.
- the vibration exciter repeatedly applies each load to the measurement object at a predetermined frequency.
- the temperature sensor obtains a temperature fluctuation indicating a temperature fluctuation of the measurement object to which a load is applied.
- the information processing apparatus obtains the fatigue limit stress of the measurement object based on the temperature image obtained from the temperature sensor.
- the information processing apparatus obtains the relationship of the temperature amplitude of the second harmonic component with respect to the temperature amplitude of the fundamental frequency component of the vibration relating to the measurement object from the temperature fluctuation obtained from the temperature sensor. Fitting the relationship with the first approximate line that is a quadratic curve and the second approximate line that is a quadratic curve, and based on the intersection of the first approximate line and the second approximate line, the fatigue limit stress of the measurement object Ask for.
- a stress identification device includes an acquisition unit and a calculation unit.
- An acquisition part acquires the temperature fluctuation of a measuring object.
- the calculation unit analyzes the temperature fluctuation and measures the fatigue limit stress of the measurement object.
- the calculation unit obtains the relationship of the temperature amplitude of the second harmonic component with respect to the temperature amplitude of the fundamental frequency component of vibration from the temperature fluctuation, and the relationship is a first approximate line and a quadratic curve which are quadratic curves. Fitting is performed using the second approximate line, and the fatigue limit stress of the measurement object is obtained based on the intersection of the first approximate line and the second approximate line.
- a stress identification method is provided.
- the load is repeatedly added to the measurement object at a predetermined frequency while increasing the load stepwise.
- the temperature variation of the measurement object to which the load is applied is performed, and the relationship between the temperature amplitude of the second harmonic component with respect to the temperature amplitude of the fundamental frequency component of vibration is obtained from the temperature variation. Fitting the relationship with a first approximate line that is a quadratic curve and a second approximate line that is a quadratic curve, and based on the intersection of the first approximate line and the second approximate line, the fatigue limit of the measurement object Find the stress.
- the relationship between the temperature amplitude of the second harmonic component and the temperature amplitude of the fundamental frequency component is fitted with two quadratic curves, and the fatigue limit stress of the measurement object is based on the intersection of the two quadratic curves. Ask for. Thereby, the fatigue limit stress of the measurement object can be obtained with high accuracy.
- FIG. 1A is a diagram illustrating a configuration of a fatigue limit stress identification system according to Embodiment 1 of the present disclosure.
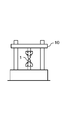
- FIG. 1B is a diagram illustrating a state in which a test piece is fixed to a vibration exciter.
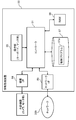
- FIG. 2 is a block diagram illustrating a configuration of the information processing apparatus according to the first embodiment.
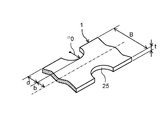
- FIG. 3 is a diagram illustrating the shape and dimensions of a test piece 1b that is a measurement object having a radius of curvature rh0 according to the first embodiment of the present disclosure.
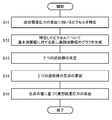
- FIG. 4 is a flowchart showing the fatigue limit stress specifying process.
- FIG. 5A is a diagram showing a temperature amplitude image distribution for the second harmonic component.
- FIG. 5A is a diagram showing a temperature amplitude image distribution for the second harmonic component.
- FIG. 5B is an enlarged view of a region R1 in FIG. 4A.
- FIG. 6A is a diagram showing temperature fluctuations of the test piece during excitation.
- FIG. 6B is an enlarged view of a broken line region in FIG. 6A.
- FIG. 7A is a diagram showing a frequency spectrum of temperature fluctuation.
- FIG. 7B is an enlarged view of the broken line region in FIG. 7A.
- FIG. 8A is a diagram showing the relationship between the load amplitude and the fundamental wave amplitude.
- FIG. 8B is a diagram illustrating a relationship between the load amplitude and the second harmonic amplitude.
- FIG. 8C is a diagram illustrating a relationship between the fundamental wave amplitude and the second harmonic amplitude.
- FIG. 9 is a diagram for explaining how to obtain the first approximate line and the second approximate line.
- FIG. 10 is a flowchart showing a calculation process of the first approximate line and the second approximate line.
- FIG. 11A is a diagram illustrating the relationship between the fundamental wave amplitude and the second harmonic amplitude.
- FIG. 11B is a diagram illustrating the residual sum of squares obtained for each boundary number.
- FIG. 12A is a diagram illustrating inappropriate data measured when the load amplitude is large.
- FIG. 12B is a diagram for explaining inappropriate data measured when the load amplitude is large.
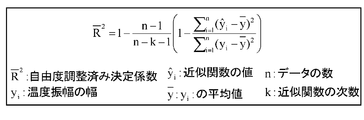
- FIG. 12C is a diagram illustrating a calculation formula for the degree-of-freedom-adjusted determination coefficient.
- FIG. 13A is a diagram illustrating fitting results for N data ranges.
- FIG. 13A is a diagram illustrating fitting results for N data ranges.
- FIG. 13B is a diagram for explaining a fitting result for N ⁇ 1 data ranges.
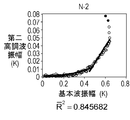
- FIG. 13C is a diagram for explaining a fitting result for N-2 data ranges.
- FIG. 13D is a diagram illustrating fitting results for N-3 data ranges.
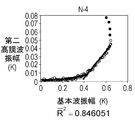
- FIG. 13E is a diagram for explaining a fitting result for N-4 data ranges.
- FIG. 13F is a diagram for explaining a fitting result with respect to N-5 data ranges.
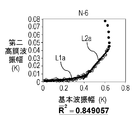
- FIG. 13G is a diagram for explaining the fitting results for N-6 data ranges.
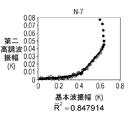
- FIG. 13H is a diagram for explaining a fitting result with respect to N-7 data ranges.
- FIG. 14A is a diagram illustrating the relationship between the fundamental wave amplitude and the second harmonic amplitude.
- FIG. 14A is a diagram illustrating the relationship between the fundamental wave amplitude and the second harmonic amplitude.
- FIG. 14B is a diagram for explaining a method of calculating the fatigue limit based on the data shown in FIG. 14A.
- FIG. 15 is a diagram (a notch radius of a test piece: 5.0 mm) showing a comparison between the fatigue limit stress obtained by the method of Embodiment 1 and the fatigue limit stress obtained by a conventional method.
- FIG. 16 is a diagram showing a comparison between the fatigue limit stress obtained by the method of Embodiment 1 and the fatigue limit stress obtained by the conventional method (notch radius of the test piece: 2.0 mm).
- FIG. 17 is a diagram showing a comparison between the fatigue limit stress obtained by the method of Embodiment 1 and the fatigue limit stress obtained by the conventional method.
- the fatigue limit stress specifying system described in the following embodiment is a system for calculating the fatigue limit stress of a test piece.
- FIG. 1A is a diagram illustrating a fatigue limit stress identification system according to an embodiment of the present disclosure.
- the fatigue limit stress identification system 100 includes a vibration exciter 10, an infrared camera 30 (an example of a temperature sensor according to the present disclosure), an information processing device 50 (an example of a fatigue limit stress identification device according to the present disclosure), and a monitor 60.
- the vibration exciter 10 vibrates the test piece 1 which is a measurement object.
- the infrared camera 30 captures a temperature image (infrared image) of the test piece 1.
- the information processing apparatus 50 analyzes the temperature image and calculates the fatigue limit of the test piece 1. Specifically, the information processing apparatus 50 performs a dissipated energy measuring step 21 and a fatigue limit stress specifying step 22 (details will be described later in [1-2. Operation]).
- the monitor 60 displays predetermined information.
- FIG. 1B is a diagram showing a state in which the test piece 1 is fixed to the vibrator 10.
- the vibrator 10 is a device that applies a predetermined force to the test piece 1 at a predetermined frequency.
- the measurement data referred to in the following description is data measured using a hydraulic servo fatigue tester (manufactured by Shimadzu Corporation, servo pulser, maximum test capability: 10 kN) as the vibrator 10.
- the temperature image of the test piece 1 was measured by the infrared camera 30 while increasing the tensile load on the test piece 1 by 0.1 kN from 0 kN to 8.5 kN by controlling the load of the vibrator 10.
- the fundamental frequency (1f) by vibration was 25 Hz.
- the frame rate of the infrared camera 30 is 249 Hz.
- the temperature image measured by the infrared camera 30 is processed by the information processing apparatus 50 having a Fourier transform function.
- the information processing device 50 analyzes the temperature image (infrared image) taken by the infrared camera 30 and identifies the fatigue limit stress of the test piece 1.
- a monitor 60 is connected to the information processing apparatus 50.
- the monitor 60 is a liquid crystal display device or an organic EL display device.
- FIG. 2 is a block diagram illustrating the internal configuration of the information processing apparatus 50.
- the information processing apparatus 50 is a personal computer, for example.
- the information processing apparatus 50 includes a controller 51 that controls the overall operation, an operation unit 55 that is operated by a user, a RAM 56 that stores data and programs, and a data storage unit 57.
- the information processing apparatus 50 further includes a device interface 58 (an example of an acquisition unit according to the present disclosure) for connecting to an external device such as the infrared camera 30 (FIG. 1A) or the monitor 60 (FIG. 1A), and a network.
- Network interface 59 (an example of an acquisition unit according to the present disclosure).
- the device interface 58 is a communication module (circuit) that performs communication such as data in accordance with USB (Universal Serial Bus), HDMI (registered trademark) (High Definition Multimedia interface), IEEE 1394, and the like.
- the network interface 59 is a communication module (circuit) that performs data communication in accordance with standards such as IEEE 802.11, WiFi, and Bluetooth (registered trademark).
- the controller 51 (an example of a calculation unit according to the present disclosure) is configured by a CPU (Central Processing Unit) and an MPU (Micro Processing Unit), and executes a predetermined control program 57a stored in the data storage unit 57 to execute a predetermined process. Realize the function.
- the control program executed by the controller 51 may be provided via the network 200 or may be provided via a recording medium such as a CD-ROM.
- the RAM 56 is a storage element that temporarily stores programs and data, and functions as a work area for the controller 51.
- the data storage unit 57 is a recording medium that stores parameters, data, and programs necessary for realizing the functions, and stores a control program executed by the controller 51 and various data.
- the data storage unit 57 includes, for example, a hard disk drive (HDD), an SSD (Solid State Drive), and an optical disk medium.
- a control program 57 a is installed in the data storage unit 57.
- the controller 51 implements functions to be described later by executing this control program 57a.
- the data storage unit 57 also functions as a work area for the controller 51.
- FIG. 3 is a diagram illustrating the test piece 1 which is a measurement object.
- the test piece 1 is a strip-shaped member having a width B and a thickness t, and a notch 25 that is deeper from both sides toward the center is formed in the center in the length direction.
- the radius of curvature of the notch 25 is rh0.
- the depth d of the notch 25 is 1 ⁇ 2 the width of the minimum width portion of the notch 25 which is a stress concentration portion.
- the length b is the length from the center in the width direction of the notch 25 to the deepest part of the notch.
- the length b is equal to the depth d of the notch 25.
- the information processing apparatus 50 performs a dissipated energy measurement process 21 and a fatigue limit stress identification process 22.
- the test piece 1 that has been subjected to repeated loads undergoes repeated temperature changes at the same frequency as the vibration frequency of the vibration exciter 10 due to the thermoelastic effect.
- the test piece 1 subjected to repeated loading causes an average temperature increase due to energy dissipation inside the material.
- the temperature change due to the thermoelastic effect and the average temperature rise due to dissipative energy are small compared to the temperature change caused by external factors such as wind and ambient temperature changes. For this reason, when the temperature change amount ⁇ T of the test piece 1 is expressed, the following (formula 1) is obtained.
- ⁇ T re ⁇ Tc + D + Te (1)
- ⁇ T Amount of temperature change re: External factor (wind or ambient temperature change)
- Tc heat conduction (high temperature and low temperature make uniform)
- D Dissipated energy (temperature rise in repeated cycles)
- Te Thermoelastic effect
- the information processing apparatus 50 measures the temperature of the test piece 1 with the infrared camera 30 and simultaneously captures a synchronous input signal as a control signal from the shaker 10. Then, the information processing apparatus 50 performs infrared stress image processing by Fourier transform on a specific frequency component based on the synchronous input signal.
- the information processing apparatus 50 extracts the temperature change amount component corresponding to the excitation frequency to eliminate the influence of the external factor, and the temperature due to the thermoelastic effect generated by exciting the test piece 1. Measure changes.
- the dissipation energy D of the temperature rise during the repetitive cycle is measured. An image is obtained. The fatigue limit stress of the test piece 1 is calculated from the measurement image of the dissipation energy D.
- the fatigue limit stress specifying process will be described with reference to the flowchart shown in FIG. This process is mainly executed by the controller 51 of the information processing apparatus 50.
- the controller 51 specifies a pixel to be used when obtaining the fatigue limit stress based on the image taken by the infrared camera 30 (step S11).
- step S11 the process of step S11 is demonstrated concretely.
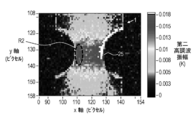
- FIG. 5A is a diagram showing an image for measuring the dissipated energy of the test piece 1 obtained from an image taken by the infrared camera 30.
- FIG. FIG. 5B is an enlarged view of the portion of the broken line region R1 in FIG. 5A.
- 5A and 5B show the temperature amplitude (hereinafter “second harmonic component”) of a component (hereinafter referred to as “second harmonic component”) having a frequency 2 f (hereinafter referred to as “second harmonic component”) that is twice the fundamental frequency 1 f of excitation. It is a figure which shows the image of a "harmonic amplitude”.
- the controller 51 specifies pixels in the region R2 including a portion where the second harmonic amplitude is large.
- the controller 51 creates a graph of the temperature amplitude of the fundamental frequency in vibration (hereinafter referred to as “fundamental wave amplitude”) with respect to the load amplitude for each pixel in the specified region R2, and obtains the slope of the graph.
- This process is performed by the controller 51 in the dissipated energy measurement step 21 as follows.
- Step 1 Based on the image photographed by the infrared camera 30, a distribution image of the second harmonic component temperature amplitude (second harmonic amplitude) is created for each load amplitude.
- Step 2 In the region of the test piece 1, a region R2 that is a region where the temperature amplitude of the second harmonic component (second harmonic amplitude) is relatively large is specified.
- Step 3 A graph of the temperature amplitude (fundamental wave amplitude) of the excitation frequency with respect to the load amplitude is created for all the pixels in the specified region R2.
- Step 4 The pixel having the maximum slope of the graph obtained in Step 3 is determined as a pixel used for specifying the fatigue limit stress.
- step S11 when the pixel used for specifying the fatigue limit stress is determined in step S11, the controller 51 executes the fatigue limit stress specifying step 22. Specifically, the controller 51 generates a graph of the second harmonic amplitude with respect to the fundamental wave amplitude (see FIG. 8C) for the identified pixel (step S12). Hereinafter, the process of step S12 is demonstrated concretely.
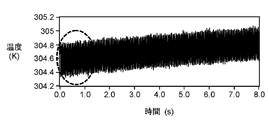
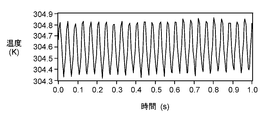
- FIG. 6A is a diagram showing temperature variation with respect to time of the test piece 1 due to vibration, which is obtained by analyzing an image of the infrared camera 30.
- FIG. 6B is an enlarged view of the broken line area of FIG. 6A.
- 6A and 6B show measurement results when a test piece having a notch radius rh0 of 5.0 mm is vibrated at a load amplitude of 7.0 kN and an excitation frequency of 25 Hz.
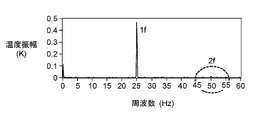
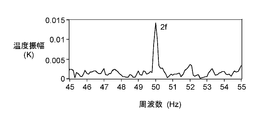
- the frequency spectrum with respect to the temperature amplitude as shown in FIG. 7A can be obtained by Fourier transforming the data of the temperature fluctuation with respect to time as shown in FIG. 6A and FIG. 6B.
- FIG. 7B is an enlarged view of the broken line area shown in FIG. 7A.
- attention is paid to the temperature amplitude (fundamental wave amplitude) of the fundamental frequency component (1f) and the temperature amplitude (second harmonic amplitude) of the second harmonic component (2f).
- the fundamental wave amplitude (1f) and the second harmonic amplitude (2f) are obtained for each of the plurality of load amplitudes.
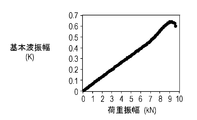
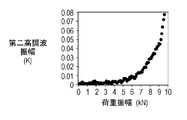
- a graph of the fundamental wave amplitude (1f) with respect to the load amplitude as shown in FIG. 8A and a graph of the second harmonic amplitude (2f) with respect to the load amplitude as shown in FIG. 8B are obtained.
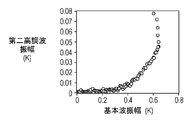
- the second harmonic amplitude with respect to the fundamental wave amplitude as shown in FIG. 8C is generated.
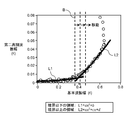
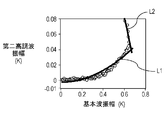
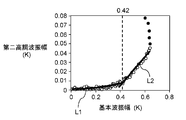
- the controller 51 determines two approximate lines for the graph of the second harmonic amplitude with respect to the fundamental amplitude (see FIG. 8C) (step S13). That is, as shown in FIG. 9, two approximate lines (first approximate line L1 and second approximate line L2) for fitting the relationship of the second harmonic amplitude to the fundamental wave amplitude are obtained. Details of the processing in step S13 will be described later.
- the controller 51 calculates the intersection of the first approximate line L1 and the second approximate line L2 (step S14).
- a fatigue limit stress is determined based on the intersection (step S15). Details of the processes in steps S14 and S15 will be described later.
- the fatigue limit stress of the test piece 1 is obtained as described above.
- step S13 the process of step S13 will be described in detail.
- the boundary B is set in the region of the fundamental wave amplitude
- the first approximate line L1 and the second approximate line L2 are set in the region below the boundary B and the region above the boundary B.
- the first approximate line L1 and the second approximate line L2 are represented by a quadratic curve (quadratic function) as in the following equation.
- x is the fundamental wave amplitude
- y is the second harmonic amplitude.
- a, b, c, d ⁇ 0.
- the first approximate line L1 for the range below the boundary B is a polynomial composed of a quadratic term and a constant term of the fundamental wave amplitude and not including a first-order term.
- the second approximate line L2 for the range above the boundary B is a polynomial composed of a quadratic term, a primary term and a constant term of the fundamental wave amplitude.
- the inventors of the present application investigated the load signal, displacement signal, and strain signal output from the load cell, actuator, and strain gauge in the load amplitude control, and found that the load signal contained the second harmonic component. It was. From this, the inventors of the present application thought that the load waveform of a complete sine wave is not necessarily added to the test piece 1, and that the load waveform is distorted in the process of controlling the load. It was also confirmed that the second harmonic component was included in the displacement signal and the distortion signal. This is considered to be the influence of the second harmonic component contained in the load signal. Furthermore, it is considered that the second harmonic component may be caused by dark current generated from the sensor of the infrared camera or noise from the surrounding environment.
- the inventors of the present application considered that the second harmonic component of temperature includes the second harmonic component (first approximate line L1 and its extension line) generated due to the above-described causes. Based on such knowledge, the inventors of the present application perform fitting using the first approximate line L1 and the second approximate line L2 that are quadratic curves (quadratic functions) as shown in equations (2) and (3). As a result, the fatigue limit stress could be obtained with high accuracy.
- the controller 51 (see FIG. 2) first sets the boundary B (see FIG. 9) as a start point (step S21). Then, the first approximate line L1 and the second approximate line L2 are obtained at the set boundary B using the measurement data of the entire range (step S22). Specifically, as shown in FIG. 11A, the data of the area below the boundary B is fitted with the first approximate line L1, the data of the area above the boundary B is fitted with the second approximate line L2, and the measured value and The coefficients of the first approximate line L1 and the second approximate line L2 are obtained so that the residual sum of squares with the calculated value is minimized.
- the range to move the boundary B is set in advance.
- the controller 51 changes the position of the boundary B stepwise as shown in FIG. 9 until the movement of the boundary B is completed in the entire predetermined range set in advance (NO in step S23, step S30).
- the first approximate line L1 and the second approximate line L2 are obtained for each boundary (step S22).
- the calculation is performed on the first approximate line L1 and the second approximate line L2 obtained at each boundary.
- One boundary that minimizes the residual sum of squares is specified (step S24). Thereby, the boundary between the data range to which the first approximate line L1 is applied and the data range to which the second approximate line L2 is applied is specified.
- FIG. 11B is a diagram showing the residual sum of squares calculated for each boundary.
- the horizontal axis is a boundary number indicating a boundary, and the boundary number takes a value proportional to the position of the boundary.
- the residual sum of squares is the smallest at the boundary with the boundary number “92”. Therefore, the position of the fundamental wave amplitude corresponding to the boundary number “92” is specified as the boundary.
- the controller 51 determines an appropriate range (upper limit) of data used for calculation of the fatigue limit stress (step S25 to step S28, step S31).
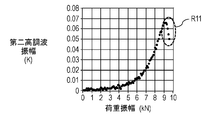
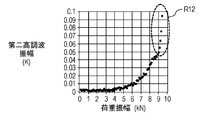
- the measurement data includes data inappropriate for use in calculating the fatigue limit stress, as shown by the broken line region R11 and the broken line region R12 in FIGS. 12A and 12B. Possible causes of this include the generation and propagation of microcracks and the occurrence of strain-induced martensitic transformation. Therefore, in the present embodiment, in order to remove data inappropriate for use in calculating the fatigue limit stress, such as data included in the broken line region R11 and the broken line region R12, a determination coefficient with a degree of freedom adjusted is used. To set the upper limit of the data range.
- the controller 51 first sets the upper limit of the data range to the maximum value (step S25). That is, the data range is set to include all data. Then, using the data within the set data range, the first approximate line L1 and the second approximate line L2 are calculated based on the previously specified boundary (step S26). In other words, the first approximate line L1 and the second approximate line L2 that minimize the residual sum of squares are calculated using data within the set data range.
- the controller 51 calculates a degree-of-freedom adjusted determination coefficient for the calculated first approximate line L1 and the second approximate line L2 (step S27).
- the degree-of-freedom adjusted determination coefficient is calculated by the equation shown in FIG. 12C.
- the range for changing the upper limit of the data range is predetermined.
- the upper limit of the data range is changed until the change of the upper limit of the data range is completed within the predetermined range (NO in step S28, step S31).
- the first approximate line L1 and the second approximate line L2 are obtained for the new data range (step S26).
- the determination coefficient with adjusted degrees of freedom for the first approximate line and the second approximate line L2 is calculated (step S27).
- the upper limit of the data range is changed by shifting the upper limit of the data range from the higher second harmonic amplitude to the lower one by one so as to narrow the data range.
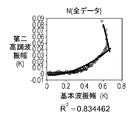
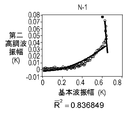
- FIG. 13A to 13H are diagrams showing changes in the first approximate line L1, the second approximate line L2, and the degree-of-freedom-adjusted determination coefficient calculated while changing the upper limit of the data range one by one.
- FIG. 13A is a diagram illustrating fitting results of approximate lines and values of degrees of freedom adjusted adjustment coefficients for all data (data for N pieces) when the upper limit of the data range is set to the maximum.
- FIG. 13B is a diagram showing the fitting result of the approximate line and the value of the coefficient of freedom adjusted for the degree of freedom when the upper limit is shifted by one data from the case of all data, that is, N ⁇ 1 pieces of data.
- FIG. 13A is a diagram illustrating fitting results of approximate lines and values of degrees of freedom adjusted adjustment coefficients for all data (data for N pieces) when the upper limit of the data range is set to the maximum.
- FIG. 13B is a diagram showing the fitting result of the approximate line and the value of the coefficient of freedom adjusted for the degree of freedom when the upper limit is shifted by
- FIGS. 13D to 13H sequentially show the fitting result of the approximate line obtained while changing the upper limit of the data range one by one and the determination coefficient adjusted for the degree of freedom.
- the controller 51 specifies the upper limit of the data range when the degree of freedom adjusted determination coefficient is the maximum, and specifies The first approximate line L1 and the second approximate line L2 calculated in the upper limit range of the data range are specified (step S29).
- the first approximate line L1 and the second approximate line L2 can be obtained from the graph of the second harmonic amplitude with respect to the fundamental wave amplitude (see FIG. 8C).
- the controller 51 calculates the fatigue limit stress as follows.
- the intersection of the first approximate line L1 and the second approximate line L2 is obtained.
- 0.42 [K] is obtained as the value of the fundamental wave amplitude at the intersection of the first approximate line L1 and the second approximate line L2 (step S14).
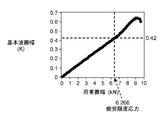
- the controller 51 refers to the graph of the fundamental wave amplitude with respect to the load amplitude (see FIG. 14B), obtains the load amplitude value 6.266 [N] based on the fundamental wave amplitude value 0.42 [K] at the intersection, This value is defined as the fatigue limit stress (step S15).
- the fatigue limit stress of the test piece 1 can be obtained.
- both the first approximate line and the second approximate line are quadratic curves (quadratic functions).
- the first approximate line is a quadratic curve (quadratic function)
- the second approximate line is a straight line.
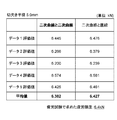
- FIG. 15 shows the fatigue limit stress obtained by the method of the first embodiment (shown as “secondary curve and quadratic curve” in FIG. 15) for five test pieces 1 having a notch radius of 5.0 mm.
- a comparison of fatigue limit stress values obtained by a conventional method (shown as “secondary curve and straight line” in FIG. 15) is shown.
- the measured value of the fatigue limit stress obtained from the fatigue test on the test piece 1 under the same conditions was 6.4 kN.
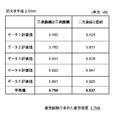
- FIG. 16 shows the five test pieces 1 having a notch radius of 2.0 mm and the conventional method (shown as “secondary curve and quadratic curve” in FIG. 16) and the conventional method (FIG. 16).
- FIG. 17 is a diagram showing a comparison between the fatigue limit stress obtained by the method of Embodiment 1 and the fatigue limit stress obtained by the conventional method.
- both the case where the notch radius is 5.0 mm (FIG. 15) and the case where the notch radius is 2.0 mm (FIG. 16) are fitted with a quadratic curve and a quadratic curve (Embodiment 1).
- the value of the fatigue limit stress closer to the value obtained from the fatigue test is obtained in the method (2) than when fitting with a quadratic curve and a straight line (conventional method).
- the information processing apparatus 50 can obtain the fatigue limit stress of the test piece 1 from the temperature image of the measurement object to which each load is added at a predetermined frequency while increasing the load stepwise.
- the fatigue limit stress identification system 100 is configured so that the load at each stage measured while increasing the load applied to the test piece 1 (an example of the measurement object according to the present disclosure) stepwise.
- the fatigue limit stress of the test piece 1 is measured on the basis of the temperature amplitude generated with respect to.
- the fatigue limit stress identification system 100 includes a vibration exciter 10, an infrared camera 30 (an example of a temperature sensor according to the present disclosure), and an information processing device 50.
- the vibration exciter 10 repeatedly applies a load to the test piece 1 at a predetermined frequency.
- the infrared camera 30 acquires the temperature fluctuation of the test piece 1.
- the information processing apparatus 50 obtains the fatigue limit stress of the test piece 1 based on the temperature fluctuation of the test piece 1 acquired from the infrared camera 30.
- the information processing apparatus 50 obtains the relationship of the temperature amplitude of the second harmonic component with respect to the temperature amplitude of the fundamental frequency component of the vibration relating to the test piece 1 (graph of FIG. 9) from the temperature fluctuation acquired from the infrared camera 30.
- the information processing apparatus 50 fits the relationship using a first approximate line L1 that is a quadratic curve and a second approximate line L2 that is a quadratic curve, and the first approximate line L1 and the second approximate line L2
- the fatigue limit stress of the object to be measured is obtained based on the intersection point.
- Such a fatigue limit stress identification system 100 uses a quadratic curve for two approximate lines (first approximate line L1 and second approximate line L2) used for fitting. Thereby, in the fitting process, it is possible to obtain an approximate line in consideration of the influence of the distortion of the load waveform generated in the vibration control process, the distortion generated in the test piece, disturbance noise, and the like. Therefore, the fatigue limit stress can be obtained with high accuracy.
- the first approximate line L1 is used for fitting to data in a range where the temperature amplitude of the fundamental frequency component is not more than the boundary B (an example of a predetermined value according to the present disclosure).
- the second approximate line L2 is used for fitting to data in a range where the temperature amplitude of the fundamental frequency component is equal to or higher than the boundary B.
- x is the temperature amplitude of the fundamental frequency component.
- y is the temperature amplitude of the second harmonic component.
- a, b, c, d are coefficients (a, b, c, d ⁇ 0).
- the first approximate line L1 and the second approximate line L2 indicate the data range when the maximum degree of freedom adjusted determination coefficient is obtained among the degree of freedom adjusted determination coefficients for the respective approximate lines in the plurality of data ranges. It is required by using. Thereby, the fatigue limit stress can be obtained using appropriate data for calculation of the fatigue limit stress. Therefore, the accuracy of identifying the fatigue limit stress can be improved.
- the present disclosure provides fatigue for measuring a fatigue limit stress of a measurement object based on temperature fluctuations of the measurement object generated when the measurement object (test piece 1) is vibrated while increasing the load stepwise.
- a limit stress identification device is provided.
- the fatigue limit stress identification device includes an acquisition unit and a calculation unit.
- An acquisition part acquires the temperature fluctuation of a measuring object.
- the calculation unit analyzes the temperature fluctuation and measures the fatigue limit stress of the measurement object.
- the calculation unit obtains the relationship of the temperature amplitude of the second harmonic component with respect to the temperature amplitude of the component of the fundamental frequency of vibration from the temperature fluctuation, and the relationship is expressed by a first approximate line and a quadratic curve that are quadratic curves. Fitting with the second approximate line that is Then, the fatigue limit stress of the measurement object is obtained based on the intersection of the first approximate line L1 and the second approximate line L2.
- the relationship of the temperature amplitude of the second harmonic component to the temperature amplitude of the fundamental frequency component is fitted by the first approximate line L1 and the second approximate line L2 that are quadratic curves. The Therefore, the fatigue limit stress can be obtained with high accuracy.
- the present disclosure provides fatigue for measuring a fatigue limit stress of a measurement object based on temperature fluctuations of the measurement object generated when the measurement object (test piece 1) is vibrated while increasing the load stepwise.
- a method for determining the limit stress In this fatigue limit stress specifying method, the temperature variation of the measurement object to which the load is applied is acquired by repeatedly adding to the measurement object at a predetermined frequency while increasing the load stepwise. Then, a relationship between the temperature amplitude of the second harmonic component with respect to the temperature amplitude of the fundamental frequency component of vibration is obtained from the temperature fluctuation, and the relationship is expressed by a first approximate line L1 that is a quadratic curve and a second curve that is a quadratic curve. Fitting is performed by the second approximate line L2. Then, the fatigue limit stress of the measurement object is obtained based on the intersection of the first approximate line L1 and the second approximate line L2.
- the relationship of the temperature amplitude of the second harmonic component to the temperature amplitude of the fundamental frequency component is fitted by the first approximate line L1 and the second approximate line L2 which are quadratic curves. The Therefore, the fatigue limit stress can be obtained with high accuracy.
- the first embodiment has been described as an example of the technique disclosed in the present application.
- the technology in the present disclosure is not limited to this, and can also be applied to an embodiment in which changes, replacements, additions, omissions, and the like are appropriately performed.
- an infrared camera capable of acquiring a temperature distribution image is used as the temperature sensor.
- the pixel corresponding to the maximum stress concentration part was selected from the image image
- the temperature sensor in the present disclosure is not limited to the infrared camera.
- a contact-type or non-contact-type temperature sensor may be used to determine the fatigue limit stress based on the temperature fluctuation at a specific point.
- This disclosure can be applied to a fatigue limit stress identification system that can accurately measure the fatigue limit stress of an object to be measured.
- Test piece (measurement object) 10 Exciter 30 Infrared camera (temperature sensor) 50 Information processing equipment (fatigue limit stress identification device) 51 Controller (Calculation unit) 58 Device interface (acquisition part) 60 Monitor 100 Fatigue limit stress identification system L1 First approximate line L2 Second approximate line
Landscapes
- Physics & Mathematics (AREA)
- Health & Medical Sciences (AREA)
- Life Sciences & Earth Sciences (AREA)
- Chemical & Material Sciences (AREA)
- Analytical Chemistry (AREA)
- Biochemistry (AREA)
- General Health & Medical Sciences (AREA)
- General Physics & Mathematics (AREA)
- Immunology (AREA)
- Pathology (AREA)
- Investigating Strength Of Materials By Application Of Mechanical Stress (AREA)
Abstract
疲労限度応力特定システムは、測定対象物に対して荷重を繰り返し加える加振機と、測定対象物の温度変動を測定する温度センサと、温度センサにより測定した測定対象物の温度変動に基づき測定対象物の疲労限度応力を測定する情報処理装置と、を備える。情報処理装置は、温度センサが測定した温度変動を解析して、加振の基本周波数成分の温度振幅に対する第二高調波成分の温度振幅の関係を求め、その関係を二次曲線である第一の近似線(L1)と二次曲線である第二の近似線(L2)によりフィッティングし、第一の近似線(L1)と第二の近似線(L2)の交点に基づき測定対象物の疲労限度応力を算出する。
Description
本開示は、測定対象物の疲労限度応力を測定する疲労限度応力特定システム、疲労限度応力特定装置及び疲労限度応力特定方法に関する。
特許文献1は、繰り返し応力振幅を測定対象物に加えて、材料内部のエネルギー散逸によって生じる平均温度上昇量の一定領域内における分布を赤外線カメラによって測定する散逸エネルギー測定手段を用いた疲労限度応力特定システムを開示する。
特許文献1の疲労限度応力特定システムは、加振機と、赤外線カメラと、情報処理装置を備える。加振機は、測定対象物に対して荷重を繰り返し加える。赤外線カメラは、測定対象物の温度画像を得る。情報処理装置は、赤外線カメラから得た測定対象物の温度画像を処理するフーリエ変換手段を有する。情報処理装置は、散逸エネルギーを測定する散逸エネルギー測定工程と、散逸エネルギー測定工程から得られた測定結果から疲労限度応力を特定する疲労限度応力特定工程とを実施する。
散逸エネルギー測定工程は、赤外線カメラが撮影した温度画像より、加振の基本周波数成分および第二高調波成分の温度振幅画像を取得する。そして、第二高調波成分の温度振幅が最大を示す領域内において、基本周波数成分の温度振幅に対する荷重特性の傾きが最大であるピクセル領域の散逸エネルギーを抽出する。
疲労限度応力特定工程では、自由度調整済み決定係数およびGauss-Newton法によって求められる2本の近似線の交点から疲労限度応力を特定している。2本の近似線として、y=axn+b(n=2)で表される多項式と直線とが使用されている。
特許文献1の疲労限度応力特定装置システムによれば、応力集中を有する材料や部品の疲労限度応力を、主観的な判断に頼ることなく、客観的かつ正確に求めることができる。
本開示は、測定対象物の疲労限度応力を精度よく測定できる疲労限度応力特定システムを提供する。
本開示の第一の態様において、荷重を段階的に増加させながら測定対象物を加振したときに発生する測定対象物の温度変動に基づいて、測定対象物の疲労限度応力を測定する疲労限度応力特定システムを提供する。疲労限度応力特定システムは、加振機と、温度センサと、情報処理装置と、を備える。加振機は、測定対象物に対して各荷重を所定の周波数で繰り返して加える。温度センサは、荷重が加えられている測定対象物の温度変動を示す温度変動を得る。情報処理装置は、温度センサから得た温度画像に基づき測定対象物の疲労限度応力を求める。情報処理装置は、温度センサから得た温度変動から、測定対象物に関する、加振の基本周波数成分の温度振幅に対する第二高調波成分の温度振幅の関係を求める。その関係を二次曲線である第一の近似線と二次曲線である第二の近似線によりフィッティングし、第一の近似線と第二の近似線の交点に基づき測定対象物の疲労限度応力を求める。
本開示の第二の態様において、荷重を段階的に増加させながら測定対象物を加振したときに発生する測定対象物の温度変動に基づいて、測定対象物の疲労限度応力を測定する疲労限度応力特定装置を提供する。疲労限度応力特定装置は、取得部と、演算部とを備える。取得部は、測定対象物の温度変動を取得する。演算部は、温度変動を解析して測定対象物の疲労限度応力を測定する。演算部は、温度変動から、加振の基本周波数成分の温度振幅に対する第二高調波成分の温度振幅の関係を求め、その関係を二次曲線である第一の近似線と二次曲線である第二の近似線によりフィッティングし、第一の近似線と第二の近似線の交点に基づき測定対象物の疲労限度応力を求める。
本開示の第三の態様において、荷重を段階的に増加させながら測定対象物を加振したときに発生する測定対象物の温度変動に基づいて前記測定対象物の疲労限度応力を測定する疲労限度応力特定方法を提供する。疲労限度応力特定方法は、荷重を段階的に増加させながら所定の周波数で繰り返し測定対象物に加える。荷重が加えられている測定対象物の温度変動をし、温度変動から、加振の基本周波数成分の温度振幅に対する第二高調波成分の温度振幅の関係を求める。その関係を二次曲線である第一の近似線と二次曲線である第二の近似線によりフィッティングし、第一の近似線と第二の近似線の交点に基づき前記測定対象物の疲労限度応力を求める。
本開示によれば、基本周波数成分の温度振幅に対する第二高調波成分の温度振幅の関係を2つの二次曲線でフィッティングし、その2つの二次曲線の交点に基づき測定対象物の疲労限度応力を求める。これにより、精度良く測定対象物の疲労限度応力を求めることができる。
以下、適宜図面を参照しながら、実施の形態を詳細に説明する。但し、必要以上に詳細な説明は省略する場合がある。例えば、既によく知られた事項の詳細説明や実質的に同一の構成に対する重複説明を省略する場合がある。これは、以下の説明が不必要に冗長になるのを避け、当業者の理解を容易にするためである。
なお、発明者らは、当業者が本開示を十分に理解するために添付図面および以下の説明を提供するのであって、これらによって請求の範囲に記載の主題を限定することを意図するものではない。
(実施の形態1)
[1-1.構成]
以下、添付の図面を参照して本開示に係る疲労限度応力特定システムの実施の形態を説明する。以下の実施形態で説明する疲労限度応力特定システムは、試験片の疲労限度応力を算出するシステムである。
[1-1.構成]
以下、添付の図面を参照して本開示に係る疲労限度応力特定システムの実施の形態を説明する。以下の実施形態で説明する疲労限度応力特定システムは、試験片の疲労限度応力を算出するシステムである。
図1Aは、本開示の実施の形態における疲労限度応力特定システムを示した図である。疲労限度応力特定システム100は、加振機10と、赤外線カメラ30(本開示に係る温度センサの一例)と、情報処理装置50(本開示に係る疲労限度応力特定装置の一例)と、モニタ60とを備える。加振機10は、測定対象物である試験片1を加振する。赤外線カメラ30は、試験片1の温度画像(赤外画像)を撮影する。情報処理装置50は、温度画像を解析し、試験片1の疲労限度を算出する。具体的には、情報処理装置50は、散逸エネルギー測定工程21と、疲労限度応力特定工程22とを実施する(詳細は[1-2.動作]で後述する)。モニタ60は、所定の情報を表示する。
図1Bは、試験片1を加振機10に固定した状態を示した図である。加振機10は、試験片1に対して所定の力を所定の周波数で加える装置である。
なお、以下の説明で参照する測定データは、加振機10として、油圧サーボ疲労試験機(株式会社島津製作所製,サーボパルサ,最大試験能力:10kN)を利用して測定したデータである。加振機10の荷重制御により、試験片1に対する引張荷重を0kN~8.5kNまで0.1kNずつ増加させながら、赤外線カメラ30により試験片1の温度画像の測定を行った。加振による基本周波数(1f)は25Hzとした。赤外線カメラ30としてCedip Infrared Systems社のSilver480Mを利用した。赤外線カメラ30のフレームレートは249Hzである。
赤外線カメラ30で測定した温度画像は、フーリエ変換機能を有する情報処理装置50でデータ処理される。情報処理装置50は、赤外線カメラ30により撮影された温度画像(赤外画像)を解析して試験片1の疲労限度応力を特定する。情報処理装置50にはモニタ60が接続されている。モニタ60は液晶ディスプレイ装置または有機ELディスプレイ装置である。
図2は、情報処理装置50の内部構成を説明したブロック図である。情報処理装置50は例えばパーソナルコンピュータである。情報処理装置50は、その全体動作を制御するコントローラ51と、ユーザが操作を行う操作部55と、データやプログラムを記憶するRAM56と、データ格納部57とを備える。
情報処理装置50はさらに、赤外線カメラ30(図1A)やモニタ60(図1A)等の外部機器に接続するための機器インタフェース58(本開示に係る取得部の一例)と、ネットワークに接続するためのネットワークインタフェース59(本開示に係る取得部の一例)とを含む。機器インタフェース58は、USB(Universal Serial Bus)、HDMI(登録商標)(High Definition Multimedia Interface)、IEEE1394等に準拠してデータ等の通信を行う通信モジュール(回路)である。ネットワークインタフェース59は、IEEE802.11、WiFi、Bluetooth(登録商標)等の規格に準拠してデータ通信を行う通信モジュール(回路)である。
コントローラ51(本開示に係る演算部の一例)はCPU(Central Processing Unit)やMPU(Micro Processing Unit)で構成され、データ格納部57に格納された所定の制御プログラム57aを実行することにより所定の機能を実現する。コントローラ51で実行される制御プログラムはネットワーク200を介して提供されてもよいし、CD-ROM等の記録媒体を介して提供されてもよい。
RAM56はプログラムやデータを一時的に格納する記憶素子であり、コントローラ51の作業領域として機能する。
データ格納部57は機能を実現するために必要なパラメータ、データ及びプログラムを記憶する記録媒体であり、コントローラ51で実行される制御プログラムや各種のデータを格納している。データ格納部57は、例えば、ハードディスクドライブ(HDD)、SSD(Solid State Drive)、光ディスク媒体で構成される。データ格納部57には制御プログラム57aがインストールされている。コントローラ51はこの制御プログラム57aを実行することで後述する機能を実現する。データ格納部57はコントローラ51の作業領域としても機能する。
図3は、測定対象物である試験片1を説明した図である。試験片1は、幅B、厚みtの短冊状部材であり、長さ方向の中央に両側から中心に向かって深くなるノッチ25が形成されている。ノッチ25の曲率半径はrh0である。ノッチ25の深さdは、応力集中部であるノッチ25の最小幅部分の幅の1/2の長さである。長さbは、ノッチ25の幅方向の中央からノッチの最も深い部分までの長さである。長さbはノッチ25の深さdと等しい。
[1-2.動作]
以上のように構成された疲労限度応力特定システム100の動作を以下に説明する。疲労限度応力特定システム100において、情報処理装置50(コントローラ51)は、散逸エネルギー測定工程21と、疲労限度応力特定工程22とを実施する。
以上のように構成された疲労限度応力特定システム100の動作を以下に説明する。疲労限度応力特定システム100において、情報処理装置50(コントローラ51)は、散逸エネルギー測定工程21と、疲労限度応力特定工程22とを実施する。
散逸エネルギー測定の原理について説明する。繰り返し負荷を受けた試験片1は、熱弾性効果によって、加振機10による加振周波数と同一周波数の繰り返し温度変化を生じる。それに加えて、繰り返し負荷を受けた試験片1は、材料内部のエネルギー散逸によって平均温度上昇を生じる。ただし、熱弾性効果による温度変化および散逸エネルギーによる平均温度上昇は、たとえば風や周囲の温度変化等の外的要因によって生じる温度変化に比べて小さい。このため試験片1の温度変化量ΔTを表すと下記(式1)のようになる。
ΔT=re-Tc+D+Te ・・・・・・ (1)
ΔT:温度変化量
re:外的要因(風や周囲の温度変化)
Tc:熱の伝導(温度の高い箇所と低い箇所が均一化を図る働き)
D :散逸エネルギー(繰り返しサイクルにおける温度上昇量)
Te:熱弾性効果
実際の散逸エネルギーの測定では、情報処理装置50は、赤外線カメラ30で試験片1の温度測定を行うと同時に、加振機10から制御信号である同期入力信号を取り込む。そして、情報処理装置50は、同期入力信号に基づく特定の周波数成分についてフーリエ変換による赤外線応力画像処理を行う。これにより、情報処理装置50は、加振周波数に対応する温度変化量成分を抽出することで外的要因の影響を除外して、試験片1を加振することによって生じた熱弾性効果による温度変化を測定する。
熱弾性効果による温度上昇と温度下降から、さらに小さな繰り返しサイクル毎の機械的現象に基づく材料内部の散逸エネルギーによる温度上昇量を分離して測定すると、繰り返しサイクルにおける温度上昇量の散逸エネルギーDの測定画像が得られる。散逸エネルギーDの測定画像から試験片1の疲労限度応力を算出する。
図4に示すフローチャートを用いて疲労限度応力の特定処理を説明する。本処理は主として情報処理装置50のコントローラ51により実行される。
コントローラ51は、まず、赤外線カメラ30で撮影した画像に基づき疲労限度応力を求める際に使用するピクセルを特定する(ステップS11)。以下、ステップS11の処理を具体的に説明する。
図5Aは、赤外線カメラ30で撮影した画像から得られる、試験片1の散逸エネルギーを測定するための画像を示す図である。図5Bは、図5Aの破線領域R1の部分を拡大して示した図である。図5A及び図5Bは、加振の基本周波数1fの2倍の周波数2f(以下「第二高調波」という)の成分(以下「第二高調波成分」という)の温度振幅(以下「第二高調波振幅」という)の画像を示す図である。
図5A及び図5Bを参照すると、試験片1のノッチ25付近に非常に第二高調波振幅が大きくなっている部分が見られる。コントローラ51は、第二高調波振幅が大きくなっている部分を含む領域R2内のピクセルを特定する。
そしてコントローラ51は、特定した領域R2内の各ピクセルに対して、荷重振幅に対する、加振における基本周波数の温度振幅(以下「基本波振幅」という)のグラフを作成し、グラフの傾きを求める。グラフの傾き(傾き=基本波振幅の変化量/荷重振幅の変化量)が最大となるピクセルが、主応力和の大きさが最大であり、最大応力集中部に対応するピクセルである。よって、第二高調波振幅が比較的大きい領域R2内のピクセルのうち、荷重振幅と加振による基本周波数の温度振幅(基本波振幅)のグラフの傾きが最大のピクセルを選択することにより、疲労損傷と応力集中の両方が発生している位置に対応するピクセルを選択できる。
この処理は、散逸エネルギー測定工程21においてコントローラ51により次のように処理される。
ステップ1:赤外線カメラ30で撮影した画像に基づき、各荷重振幅について第二高調波成分の温度振幅(第二高調波振幅)の分布画像を作成する。
ステップ2:試験片1の領域において第二高調波成分の温度振幅(第二高調波振幅)が比較的大きい領域である領域R2を特定する。
ステップ3:特定した領域R2内のすべてのピクセルにおいて、荷重振幅に対する加振周波数の温度振幅(基本波振幅)のグラフを作成する。
ステップ4:ステップ3で求めたグラフの傾きが最大となるピクセルを、疲労限度応力の特定に用いるピクセルとして決定する。
以上のようにして、ステップS11において疲労限度応力の特定に用いるピクセルを決定すると、コントローラ51は疲労限度応力特定工程22を実行する。具体的には、コントローラ51は、特定したピクセルについて、基本波振幅に対する第二高調波振幅のグラフ(図8C参照)を生成する(ステップS12)。以下、ステップS12の処理を具体的に説明する。
図6Aは、赤外線カメラ30の画像を解析して得られる、加振による試験片1の時間に対する温度変動を示した図である。図6Bは、図6Aの破線領域を拡大して示した図である。図6A及び図6Bは、切欠き半径rh0が5.0mmの試験片に対して、荷重振幅7.0kN、加振周波数25Hzで加振したときの測定結果を示している。
図6A及び図6Bに示すような時間に対する温度変動のデータをフーリエ変換することで、図7Aに示すような、温度振幅に対する周波数スペクトルを求めることができる。図7Bは、図7Aに示す破線領域を拡大して示した図である。この周波数スペクトルにおいて、基本周波数成分(1f)の温度振幅(基本波振幅)と、第二高調波成分(2f)の温度振幅(第二高調波振幅)に着目する。
複数の荷重振幅のそれぞれについて、基本波振幅(1f)と第二高調波振幅(2f)を求める。これにより、図8Aに示すような、荷重振幅に対する基本波振幅(1f)のグラフと、図8Bに示すような、荷重振幅に対する第二高調波振幅(2f)のグラフとを得る。そして、荷重振幅に対する基本波振幅のグラフ(図8A参照)と、荷重振幅に対する第二高調波振幅のグラフ(図8B参照)とから、図8Cに示すような基本波振幅に対する第二高調波振幅のグラフ(本開示に係る関係の一例)を生成する。
図4のフローチャートに戻り、コントローラ51は、基本波振幅に対する第二高調波振幅のグラフ(図8C参照)に対して2つの近似線を決定する(ステップS13)。すなわち、図9に示すように、基本波振幅に対する第二高調波振幅の関係をフィッティングする2つの近似線(第一の近似線L1及び第二の近似線L2)を求める。ステップS13の処理の詳細については後述する。
第一の近似線L1及び第二の近似線L2が決定されると、コントローラ51は、第一の近似線L1と第二の近似線L2の交点を算出する(ステップS14)。その交点に基づいて疲労限度応力を決定する(ステップS15)。ステップS14およびステップS15の処理の詳細については後述する。以上のようにして試験片1の疲労限度応力が求められる。
以下、上記のステップS13~ステップS15の処理の詳細について説明する。
まず、ステップS13の処理を詳細に説明する。本実施形態では、図9に示すように、基本波振幅の領域において境界Bを設定し、境界B以下の領域と境界B以上の領域において第一の近似線L1及び第二の近似線L2を設定する。ここで、第一の近似線L1及び第二の近似線L2は次式のように二次曲線(二次関数)で表される。
第一の近似線L1(境界B以下の範囲):y=ax2+b (2)
第二の近似線L2(境界B以上の範囲):y=ax2+cx+d (3)
ここで、xは基本波振幅であり、yは第二高調波振幅である。また、a、b、c、d≠0である。
第二の近似線L2(境界B以上の範囲):y=ax2+cx+d (3)
ここで、xは基本波振幅であり、yは第二高調波振幅である。また、a、b、c、d≠0である。
境界B以下の範囲に対する第一の近似線L1は、基本波振幅の二次の項と定数項からなり、一次の項は含まない多項式である。一方、境界B以上の範囲に対する第二の近似線L2は、基本波振幅の二次の項,一次の項および定数項からなる多項式である。第二の近似線L2は、境界B以下の範囲で第一の近似線L1(y=ax2+b)によって定まった定数aを用いて、境界B以上の範囲で近似線L2(y=ax2+cx+d)をフィッティングさせてcとdを求めることによって定まる。あるいは、境界B以上の範囲のデータから第一の近似線L1の延長線(y=ax2+b)の値を差し引いたデータに対して、境界B以上の範囲で直線(y=cx+d’)をフィッティングさせてcとd’を求めることによって定めてもよい(y=ax2+cx+b+d’=ax2+cx+d)。
本願発明者らは、荷重振幅制御において、ロードセル、アクチェエータ及びひずみゲージから出力される荷重信号、変位信号及びひずみ信号について調査したところ、荷重信号に第二高調波成分が含まれていることがわかった。このことから、本願発明者らは、試験片1には必ずしも完全な正弦波の荷重波形が付加されておらず、荷重を制御する過程で荷重波形に歪みが生じていると考えた。また、変位信号とひずみ信号においても第二高調波成分が含まれていることが確認された。これは荷重信号に含まれる第二高調波成分による影響であると考えられる。さらに、第二高調波成分には、赤外線カメラのセンサから生じる暗電流や周囲環境からのノイズに起因するものもあると考えられる。本願発明者らは、温度の第二高調波成分には、以上のような原因によって発生する第二高調波成分(第一の近似線L1及びその延長線)が含まれていると考えた。このような知見に基づき本願発明者らは、式(2)、(3)に示すように二次曲線(二次関数)である第一の近似線L1及び第二の近似線L2によりフィッティングを行ったところ、疲労限度応力を精度良く求めることができた。
図10のフローチャートを参照し、基本波振幅に対する第二高調波振幅のグラフ(図8C参照)から第一の近似線L1及び第二の近似線L2を決定する処理を説明する。
コントローラ51(図2参照)は、まず、境界B(図9参照)を開始点に設定する(ステップS21)。そして、全範囲の測定データを用いて、設定された境界Bで第一の近似線L1及び第二の近似線L2を求める(ステップS22)。具体的には、図11Aに示すように境界B以下の領域のデータについて第一の近似線L1でフィッティングし、境界B以上の領域のデータについて第二の近似線L2でフィッティングし、測定値と計算値との残差二乗和が最小となるよう第一の近似線L1及び第二の近似線L2の係数を求める。
境界Bを移動させる範囲は事前に設定されている。事前に設定された所定の範囲内全域で境界Bの移動が終了するまで、コントローラ51は、図9に示すように境界Bの位置を段階的に変化させながら(ステップS23でNO、ステップS30)、各境界に対して第一の近似線L1及び第二の近似線L2を求めていく(ステップS22)。事前に設定された所定の範囲内全域で境界Bの移動が終了すると(ステップS23でYES)、各境界で得られた第一の近似線L1及び第二の近似線L2に対して算出された残差二乗和が最小となる一つの境界を特定する(ステップS24)。これにより、第一の近似線L1が適用されるデータ範囲と第二の近似線L2が適用されるデータ範囲の境界が特定される。
図11Bは、各境界に対して算出された残差二乗和を示した図である。横軸は、境界を示す境界番号であり、境界番号は境界の位置に比例した値をとる。図11Bのグラフの例では、境界番号が「92」の境界において残差二乗和が最小となっている。このため、境界番号「92」に対応する基本波振幅の位置が境界として特定される。
図10のフローチャートに戻り、境界が決定されると、コントローラ51は、疲労限度応力の算出に使用するデータの適切な範囲(上限)を決定する(ステップS25~ステップS28、ステップS31)。
荷重振幅が大きい範囲では、測定データにおいて、図12A及び図12Bの破線領域R11及び破線領域R12に示すように、疲労限度応力の算出に使用するのに不適切なデータが含まれる。この原因としては微小亀裂の発生や進展、ひずみ誘起マルテンサイト変態の発生などが考えられる。そこで、本実施の形態では、破線領域R11および破線領域R12に含まれるデータのような、疲労限度応力の算出に使用するのに不適切なデータを除去するため、自由度調整済み決定係数を使用してデータ範囲の上限を設定する。
このため、コントローラ51はまず、データ範囲の上限を最大値に設定する(ステップS25)。すなわち、データ範囲を全データを含むように設定する。そして、設定されたデータ範囲内のデータを用いて、先に特定した境界に基づき第一の近似線L1及び第二の近似線L2を算出する(ステップS26)。すなわち、設定されたデータ範囲内のデータを用いて残差二乗和が最小となる第一の近似線L1及び第二の近似線L2を算出する。
次に、コントローラ51は、算出した第一の近似線L1及び第二の近似線L2に対する自由度調整済み決定係数を算出する(ステップS27)。自由度調整済み決定係数は図12Cに示す式により算出される。
ここで、データ範囲の上限を変更する範囲は予め決められている。予め決められた範囲内でデータ範囲の上限の変更が終了するまで、データ範囲の上限を変更する(ステップS28でNO、ステップS31)。そして新たなデータ範囲について第一の近似線L1及び第二の近似線L2を求める(ステップS26)。さらに第一の近似線及び第二の近似線L2に対する自由度調整済み決定係数を算出する(ステップS27)。データ範囲の上限の変更は、データ範囲を狭めるように、データ範囲の上限を第二高調波振幅の高い側から1つずつ低い方にシフトしていくことにより行われる。
図13Aから図13Hは、データ範囲の上限を1データずつ変更しながら算出された第一の近似線L1、第二の近似線L2および自由度調整済み決定係数の変化を示した図である。図13Aは、データ範囲の上限を最大に設定したときの全データ(N個分のデータ)に対する近似線のフィッティング結果と自由度調整済み決定係数の値を示した図である。図13Bは、上限を全データの場合から1データ分シフトしたとき、すなわち、N-1個分のデータに対する近似線のフィッティング結果と自由度調整済み決定係数の値を示した図である。図13Cは、上限を2データ分シフトしたとき、すなわち、N-2個分のデータに対する近似線のフィッティング結果と自由度調整済み決定係数の値を示した図である。図13D~図13Hは、同様にデータ範囲の上限を1つずつ変更しながら求めた近似線のフィッティング結果と自由度調整済み決定係数を順次示している。
予め決められた範囲内でデータ範囲の上限の変更が完了すると(ステップS28でYES)、コントローラ51は、自由度調整済み決定係数が最大となるときのデータ範囲の上限を特定し、その特定したデータ範囲の上限の範囲で算出された第一の近似線L1及び第二の近似線L2を特定する(ステップS29)。図13A~図13Hに示す例では、図13Gに示すケースが、自由度調整済み決定係数が最大(R2=0.849057)となっている。よって、全データの場合から6データ分シフトした位置をデータ範囲の上限とし、第一の近似線L1a及び第二の近似線L2aが特定される。
以上のようにして、基本波振幅に対する第二高調波振幅のグラフ(図8C参照)から第一の近似線L1及び第二の近似線L2を求めることができる。
次に、ステップS14およびステップS15の処理を詳細に説明する。コントローラ51は、第一の近似線L1及び第二の近似線L2の交点に基づき、次のようにして、疲労限度応力を算出する。図14Aに示すように第一の近似線L1及び第二の近似線L2が求められると、第一の近似線L1と第2の近似線L2の交点が求められる。図14Aの例では、第一の近似線L1と第二の近似線L2の交点の基本波振幅の値として0.42[K]が求められる(ステップS14)。そして、コントローラ51は、荷重振幅に対する基本波振幅のグラフ(図14B参照)を参照し、交点の基本波振幅値0.42[K]に基づいて荷重振幅値6.266[N]を求め、この値を疲労限度応力とする(ステップS15)。
以上のようにして、試験片1の疲労限度応力を求めることができる。
図15~図17は、実施の形態1の方法により求めた疲労限度応力と、従来の方法により求めた疲労限度応力とを比較した図である。実施の形態1の方法では、第一の近似線及び第二の近似線の双方を二次曲線(二次関数)としている。これに対して、従来の方法では、第一の近似線を二次曲線(二次関数)とし、第二の近似線を直線としている。
図15は、切欠き半径が5.0mmである5個の試験片1について、実施の形態1の方法(図15において「二次曲線と二次曲線」と示す)により求めた疲労限度応力と従来の方法(図15において「二次曲線と直線」と示す)により求めた疲労限度応力値の比較を示す。同じ条件の試験片1に対して疲労試験から求めた疲労限度応力の測定値は、6.4kNであった。図16は、切欠き半径が2.0mmである5個の試験片1について、実施の形態1の方法(図16において「二次曲線と二次曲線」と示す)と従来の方法(図16において「二次曲線と直線」と示す)とにより求めた疲労限度応力値を示す。同じ条件の試験片1に対して疲労試験から求めた疲労限度応力の測定値は、5.7kNであった。そして、図17は、実施の形態1の方法により求めた疲労限度応力と、従来の方法により求めた疲労限度応力との比較を示す図である。
図15~図17を参照すると、切欠き半径が5.0mmの場合(図15)も2.0mmの場合(図16)も、二次曲線と二次曲線でフィッティングした場合(実施の形態1の方法)の方が、二次曲線と直線でフィッティングした場合(従来の方法)よりも、疲労試験から得られた値により近い疲労限度応力の値が得られている。
以上のようにして、情報処理装置50は、荷重を段階的に増加しながら各荷重を所定の周波数で付加した測定対象物の温度画像から試験片1の疲労限度応力を求めることができる。
[1-3.効果等]
以上のように、本実施の形態の疲労限度応力特定システム100は、試験片1(本開示に係る測定対象物の一例)に作用させる荷重を段階的に増加させながら測定された各段の荷重に対して発生する温度振幅に基づいて試験片1の疲労限度応力を測定する。疲労限度応力特定システム100は、加振機10と、赤外線カメラ30(本開示に係る温度センサの一例)と、情報処理装置50と、を備える。加振機10は、試験片1に対して荷重を所定の周波数で繰り返し加える。赤外線カメラ30は、試験片1の温度変動を取得する。情報処理装置50は、赤外線カメラ30から取得した試験片1の温度変動に基づき試験片1の疲労限度応力を求める。情報処理装置50は、赤外線カメラ30から取得した温度変動から、試験片1に関する、加振の基本周波数成分の温度振幅に対する第二高調波成分の温度振幅の関係(図9のグラフ)を求める。情報処理装置50は、その関係を、二次曲線である第一の近似線L1と二次曲線である第二の近似線L2によりフィッティングし、第一の近似線L1と第二の近似線L2の交点に基づき測定対象物の疲労限度応力を求める。
以上のように、本実施の形態の疲労限度応力特定システム100は、試験片1(本開示に係る測定対象物の一例)に作用させる荷重を段階的に増加させながら測定された各段の荷重に対して発生する温度振幅に基づいて試験片1の疲労限度応力を測定する。疲労限度応力特定システム100は、加振機10と、赤外線カメラ30(本開示に係る温度センサの一例)と、情報処理装置50と、を備える。加振機10は、試験片1に対して荷重を所定の周波数で繰り返し加える。赤外線カメラ30は、試験片1の温度変動を取得する。情報処理装置50は、赤外線カメラ30から取得した試験片1の温度変動に基づき試験片1の疲労限度応力を求める。情報処理装置50は、赤外線カメラ30から取得した温度変動から、試験片1に関する、加振の基本周波数成分の温度振幅に対する第二高調波成分の温度振幅の関係(図9のグラフ)を求める。情報処理装置50は、その関係を、二次曲線である第一の近似線L1と二次曲線である第二の近似線L2によりフィッティングし、第一の近似線L1と第二の近似線L2の交点に基づき測定対象物の疲労限度応力を求める。
このような疲労限度応力特定システム100によれば、フィッティングに使用する2つの近似線(第一の近似線L1および第二の近似線L2)に二次曲線を用いる。これにより、フィッティング過程において、加振の制御過程で生じる荷重の波形の歪みや試験片に生じる歪み、外乱ノイズ等の影響を加味した近似線を得ることができる。そのため、精度よく疲労限度応力を求めることができる。
第一の近似線L1は、基本周波数成分の温度振幅が境界B(本開示に係る所定値の一例)以下の範囲のデータに対するフィッティングに使用される。第二の近似線L2は、基本周波数成分の温度振幅が境界B以上の範囲のデータに対するフィッティングに使用される。
第一の近似線L1はy=ax2+bで表される。第二の近似線L2はy=ax2+cx+dで表される。xは基本周波数成分の温度振幅である。yは第二高調波成分の温度振幅である。a、b、c、dは係数(a、b、c、d≠0)である。
第一の近似線L1及び第二の近似線L2は、複数のデータ範囲におけるそれぞれの近似線に対する自由度調整済み決定係数の中で最大の自由度調整済み決定係数が得られる場合のデータ範囲を用いることによって求められる。これにより、疲労限度応力の算出のために、適切なデータを用いて疲労限度応力を求めることができる。そのため、疲労限度応力の特定精度を向上できる。
また、本開示は、荷重を段階的に増加させながら測定対象物(試験片1)を加振したときに発生する測定対象物の温度変動に基づいて測定対象物の疲労限度応力を測定する疲労限度応力特定装置を提供する。この疲労限度応力特定装置は、取得部と、演算部とを備える。取得部は、測定対象物の温度変動を取得する。演算部は、温度変動を解析して測定対象物の疲労限度応力を測定する。演算部は、温度変動から、加振の基本周波数の成分の温度振幅に対する第二高調波成分の温度振幅の関係を求め、その関係を、二次曲線である第一の近似線と二次曲線である第二の近似線によりフィッティングする。そして、第一の近似線L1と第二の近似線L2の交点に基づき測定対象物の疲労限度応力を求める。
このような疲労限度応力特定装置によっても、基本周波数成分の温度振幅に対する第二高調波成分の温度振幅の関係が二次曲線である第一の近似線L1及び第二の近似線L2によってフィッティングされる。そのため、精度よく疲労限度応力を求めることができる。
また、本開示は、荷重を段階的に増加させながら測定対象物(試験片1)を加振したときに発生する測定対象物の温度変動に基づいて測定対象物の疲労限度応力を測定する疲労限度応力特定方法を提供する。この疲労限度応力特定方法では、荷重を段階的に増加させながら所定の周波数で繰り返し測定対象物に加え、荷重が加えられている測定対象物の温度変動を取得する。そして、温度変動から、加振の基本周波数成分の温度振幅に対する第二高調波成分の温度振幅の関係を求め、その関係を二次曲線である第一の近似線L1と二次曲線である第二の近似線L2によりフィッティングする。そして、第一の近似線L1と第二の近似線L2の交点に基づき測定対象物の疲労限度応力を求める。
このような疲労限度応力特定方法によっても、基本周波数成分の温度振幅に対する第二高調波成分の温度振幅の関係が二次曲線である第一の近似線L1及び第二の近似線L2によってフィッティングされる。そのため、精度よく疲労限度応力を求めることができる。
(他の実施の形態)
以上のように、本出願において開示する技術の例示として、実施の形態1を説明した。しかしながら、本開示における技術は、これに限定されず、適宜、変更、置き換え、付加、省略などを行った実施の形態にも適用可能である。また、上記実施の形態1で説明した各構成要素を組み合わせて、新たな実施の形態とすることも可能である。
以上のように、本出願において開示する技術の例示として、実施の形態1を説明した。しかしながら、本開示における技術は、これに限定されず、適宜、変更、置き換え、付加、省略などを行った実施の形態にも適用可能である。また、上記実施の形態1で説明した各構成要素を組み合わせて、新たな実施の形態とすることも可能である。
以上のように、本開示における技術の例示として、実施の形態を説明した。そのために、添付図面および詳細な説明を提供した。
したがって、添付図面および詳細な説明に記載された構成要素の中には、課題解決のために必須な構成要素だけでなく、上記技術を例示するために、課題解決のためには必須でない構成要素も含まれ得る。そのため、それらの必須ではない構成要素が添付図面や詳細な説明に記載されていることをもって、直ちに、それらの必須ではない構成要素が必須であるとの認定をするべきではない。
また、上述の実施の形態は、本開示における技術を例示するためのものであるから、特許請求の範囲またはその均等の範囲において種々の変更、置き換え、付加、省略などを行うことができる。
上述の実施の形態においては、温度センサとして温度分布画像を取得することができる赤外線カメラを使用した。そして、赤外線カメラによって撮影した画像から最大応力集中部に対応するピクセルを選択し、選択したピクセルの温度変動に基づいて疲労限度応力を求めた。しかし、本開示における温度センサは、赤外線カメラに限定されない。たとえば、測定対象物の最大応力集中部があらかじめ特定できている場合には、接触式または非接触式の温度センサを用い、特定の点の温度変動に基づいて疲労限度応力を求めてもよい。
本開示は、測定対象物の疲労限度応力を精度よく測定できる疲労限度応力特定システムに適用できる。
1 試験片(測定対象物)
10 加振機
30 赤外線カメラ(温度センサ)
50 情報処理装置(疲労限度応力特定装置)
51 コントローラ(演算部)
58 機器インタフェース(取得部)
60 モニタ
100 疲労限度応力特定システム
L1 第一の近似線
L2 第二の近似線
10 加振機
30 赤外線カメラ(温度センサ)
50 情報処理装置(疲労限度応力特定装置)
51 コントローラ(演算部)
58 機器インタフェース(取得部)
60 モニタ
100 疲労限度応力特定システム
L1 第一の近似線
L2 第二の近似線
Claims (6)
- 荷重を段階的に増加させながら測定対象物を加振したときに発生する測定対象物の温度変動に基づいて前記測定対象物の疲労限度応力を測定する疲労限度応力特定システムであって、
測定対象物に対して各荷重を所定の周波数で繰り返して加える加振機と、
荷重が加えられている測定対象物の温度変動を取得する温度センサと、
前記温度センサから取得した前記温度変動に基づき前記測定対象物の疲労限度応力を求める情報処理装置と、を備え、
前記情報処理装置は、
前記温度センサから取得した温度変動から、前記測定対象物に関する、加振の基本周波数成分の温度振幅に対する第二高調波成分の温度振幅の関係を求め、
前記関係を、二次曲線である第一の近似線と二次曲線である第二の近似線によりフィッティングし、
前記第一の近似線と前記第二の近似線の交点に基づき前記測定対象物の疲労限度応力を求める、
疲労限度応力特定システム。 - 前記第一の近似線は、前記基本周波数成分の温度振幅が所定値以下の範囲のデータに対するフィッティングに使用され、
前記第二の近似線は、前記基本周波数成分の温度振幅が前記所定値以上の範囲のデータに対するフィッティングに使用される、
請求項1に記載の疲労限度応力特定システム。 - 前記第一の近似線はy=ax2+bで表され、
前記第二の近似線はy=ax2+cx+dで表され、
xは前記基本周波数成分の温度振幅であり、yは前記第二高調波成分の温度振幅であり、a、b、c、dは係数である、
請求項2に記載の疲労限度応力特定システム。 - 前記第一の近似線及び前記第二の近似線は、複数のデータ範囲における前記第一の近似線及び前記第二の近似線に対する自由度調整済み決定係数の中で最大の自由度調整済み決定係数が得られる場合のデータ範囲を用いることによって求められる、
請求項1から3のいずれか1項に記載の疲労限度応力特定システム。 - 荷重を段階的に増加させながら測定対象物を加振したときに発生する測定対象物の温度変動に基づいて前記測定対象物の疲労限度応力を測定する疲労限度応力特定装置であって、
前記測定対象物の温度変動を取得する取得部と、
前記温度変動を解析して前記測定対象物の疲労限度応力を測定する演算部と、を備え、
前記演算部は、
前記温度変動から、加振の基本周波数の成分の温度振幅に対する第二高調波成分の温度振幅の関係を求め、
前記関係を、二次曲線である第一の近似線と二次曲線である第二の近似線によりフィッティングし、
前記第一の近似線と前記第二の近似線の交点に基づき前記測定対象物の疲労限度応力を求める、
疲労限度応力特定装置。 - 荷重を段階的に増加させながら測定対象物を加振したときに発生する測定対象物の温度変動に基づいて前記測定対象物の疲労限度応力を測定する疲労限度応力特定方法であって、
荷重を段階的に増加させながら所定の周波数で繰り返し測定対象物に加え、
前記荷重が加えられている測定対象物の温度変動を取得し、
前記温度変動から、加振の基本周波数成分の温度振幅に対する第二高調波成分の温度振幅の関係を求め、
前記関係を、二次曲線である第一の近似線と二次曲線である第二の近似線によりフィッティングし、
前記第一の近似線と前記第二の近似線の交点に基づき前記測定対象物の疲労限度応力を求める、
疲労限度応力特定方法。
Priority Applications (3)
| Application Number | Priority Date | Filing Date | Title |
|---|---|---|---|
| CN201780079633.8A CN110100164A (zh) | 2016-12-26 | 2017-08-22 | 疲劳限度应力确定系统、疲劳限度应力确定装置以及疲劳限度应力确定方法 |
| EP17888692.5A EP3546919A4 (en) | 2016-12-26 | 2017-08-22 | FATIGUE LIMIT CONSTRAINT SPECIFICATION SYSTEM, FATIGUE LIMIT CONSTRAINT SPECIFICATION DEVICE AND FATIGUE LIMIT CONSTRAINT SPECIFICATION METHOD |
| US16/449,777 US11275005B2 (en) | 2016-12-26 | 2019-06-24 | Fatigue limit stress specification system, fatigue limit stress specification device, and fatigue limit stress specification method |
Applications Claiming Priority (2)
| Application Number | Priority Date | Filing Date | Title |
|---|---|---|---|
| JP2016-251885 | 2016-12-26 | ||
| JP2016251885A JP6735508B2 (ja) | 2016-12-26 | 2016-12-26 | 疲労限度応力特定システム及び疲労限度応力特定方法 |
Related Child Applications (1)
| Application Number | Title | Priority Date | Filing Date |
|---|---|---|---|
| US16/449,777 Continuation US11275005B2 (en) | 2016-12-26 | 2019-06-24 | Fatigue limit stress specification system, fatigue limit stress specification device, and fatigue limit stress specification method |
Publications (1)
| Publication Number | Publication Date |
|---|---|
| WO2018123129A1 true WO2018123129A1 (ja) | 2018-07-05 |
Family
ID=62707084
Family Applications (1)
| Application Number | Title | Priority Date | Filing Date |
|---|---|---|---|
| PCT/JP2017/029846 WO2018123129A1 (ja) | 2016-12-26 | 2017-08-22 | 疲労限度応力特定システム、疲労限度応力特定装置及び疲労限度応力特定方法 |
Country Status (5)
| Country | Link |
|---|---|
| US (1) | US11275005B2 (ja) |
| EP (1) | EP3546919A4 (ja) |
| JP (1) | JP6735508B2 (ja) |
| CN (1) | CN110100164A (ja) |
| WO (1) | WO2018123129A1 (ja) |
Cited By (1)
| Publication number | Priority date | Publication date | Assignee | Title |
|---|---|---|---|---|
| EP3919880A4 (en) * | 2019-03-08 | 2022-04-20 | Panasonic Intellectual Property Management Co., Ltd. | MEASUREMENT METHOD, MEASUREMENT DEVICE AND MEASUREMENT SYSTEM FOR VOLTAGE PROPERTIES |
Families Citing this family (2)
| Publication number | Priority date | Publication date | Assignee | Title |
|---|---|---|---|---|
| JP6796813B2 (ja) * | 2017-02-10 | 2020-12-09 | パナソニックIpマネジメント株式会社 | 応力測定システムおよび応力測定方法 |
| JP7229731B2 (ja) * | 2018-11-16 | 2023-02-28 | 株式会社豊田中央研究所 | 疲労限度推定装置、疲労限度推定方法及び疲労限度推定プログラム |
Citations (5)
| Publication number | Priority date | Publication date | Assignee | Title |
|---|---|---|---|---|
| JP2006250683A (ja) * | 2005-03-10 | 2006-09-21 | Toyota Motor Corp | 疲労破壊特定システムおよび疲労破壊特定方法 |
| JP2010223957A (ja) * | 2009-02-25 | 2010-10-07 | Panasonic Corp | 疲労限度特定システム、疲労破壊箇所特定方法および疲労限度特定方法 |
| JP2012163420A (ja) * | 2011-02-04 | 2012-08-30 | Panasonic Corp | 疲労限度特定システムおよび疲労限度特定方法 |
| JP2016024056A (ja) | 2014-07-22 | 2016-02-08 | パナソニック株式会社 | 疲労限度応力特定システムおよび疲労限度応力特定方法 |
| JP2016197080A (ja) * | 2015-04-06 | 2016-11-24 | 三菱重工業株式会社 | 切欠き係数推定方法、切欠き係数推定システム及び切欠き係数推定装置 |
Family Cites Families (7)
| Publication number | Priority date | Publication date | Assignee | Title |
|---|---|---|---|---|
| JP3032381B2 (ja) | 1992-07-06 | 2000-04-17 | 日本電子株式会社 | 応力画像システム |
| JP3945496B2 (ja) * | 2004-06-09 | 2007-07-18 | いすゞ自動車株式会社 | ターボチャージャの疲労故障診断方法及び装置 |
| JP4610955B2 (ja) | 2004-07-15 | 2011-01-12 | ▲隆▼英 阪上 | 塑性変形による熱的影響度の測定方法及び装置 |
| US20090000382A1 (en) * | 2006-07-31 | 2009-01-01 | University Of Dayton | Non-contact acousto-thermal method and apparatus for detecting incipient damage in materials |
| US9243985B2 (en) * | 2009-10-05 | 2016-01-26 | Board Of Supervisors Of Louisiana State University And Agricultural And Mechanical College | Fracture fatigue entropy determination |
| JP5059224B2 (ja) * | 2010-11-09 | 2012-10-24 | 新日本製鐵株式会社 | 部品の疲労破壊評価装置、部品の疲労破壊評価方法、及びコンピュータプログラム |
| CN103323352B (zh) * | 2013-06-07 | 2015-04-08 | 中国石油天然气股份有限公司 | 天然气水合物沉积物动三轴力学-声学-电学同步测试的实验装置及方法 |
-
2016
- 2016-12-26 JP JP2016251885A patent/JP6735508B2/ja active Active
-
2017
- 2017-08-22 EP EP17888692.5A patent/EP3546919A4/en active Pending
- 2017-08-22 WO PCT/JP2017/029846 patent/WO2018123129A1/ja unknown
- 2017-08-22 CN CN201780079633.8A patent/CN110100164A/zh active Pending
-
2019
- 2019-06-24 US US16/449,777 patent/US11275005B2/en active Active
Patent Citations (5)
| Publication number | Priority date | Publication date | Assignee | Title |
|---|---|---|---|---|
| JP2006250683A (ja) * | 2005-03-10 | 2006-09-21 | Toyota Motor Corp | 疲労破壊特定システムおよび疲労破壊特定方法 |
| JP2010223957A (ja) * | 2009-02-25 | 2010-10-07 | Panasonic Corp | 疲労限度特定システム、疲労破壊箇所特定方法および疲労限度特定方法 |
| JP2012163420A (ja) * | 2011-02-04 | 2012-08-30 | Panasonic Corp | 疲労限度特定システムおよび疲労限度特定方法 |
| JP2016024056A (ja) | 2014-07-22 | 2016-02-08 | パナソニック株式会社 | 疲労限度応力特定システムおよび疲労限度応力特定方法 |
| JP2016197080A (ja) * | 2015-04-06 | 2016-11-24 | 三菱重工業株式会社 | 切欠き係数推定方法、切欠き係数推定システム及び切欠き係数推定装置 |
Non-Patent Citations (1)
| Title |
|---|
| See also references of EP3546919A4 |
Cited By (1)
| Publication number | Priority date | Publication date | Assignee | Title |
|---|---|---|---|---|
| EP3919880A4 (en) * | 2019-03-08 | 2022-04-20 | Panasonic Intellectual Property Management Co., Ltd. | MEASUREMENT METHOD, MEASUREMENT DEVICE AND MEASUREMENT SYSTEM FOR VOLTAGE PROPERTIES |
Also Published As
| Publication number | Publication date |
|---|---|
| CN110100164A (zh) | 2019-08-06 |
| JP6735508B2 (ja) | 2020-08-05 |
| US11275005B2 (en) | 2022-03-15 |
| EP3546919A4 (en) | 2020-01-15 |
| US20190310174A1 (en) | 2019-10-10 |
| JP2018105709A (ja) | 2018-07-05 |
| EP3546919A1 (en) | 2019-10-02 |
Similar Documents
| Publication | Publication Date | Title |
|---|---|---|
| Balaji et al. | Traction-based multi-scale nonlinear dynamic modeling of bolted joints: Formulation, application, and trends in micro-scale interface evolution | |
| WO2018123129A1 (ja) | 疲労限度応力特定システム、疲労限度応力特定装置及び疲労限度応力特定方法 | |
| KR101935148B1 (ko) | 선형 안내 홈에 가해진 선-하중의 편차를 추정하는 방법 | |
| JP6796813B2 (ja) | 応力測定システムおよび応力測定方法 | |
| Blanche et al. | Dissipation assessments during dynamic very high cycle fatigue tests | |
| JP6077042B2 (ja) | 切欠き係数推定方法、切欠き係数推定システム及び切欠き係数推定装置 | |
| JP6142074B2 (ja) | 疲労試験装置 | |
| JP2007147634A (ja) | 振動解析の方法および装置ならびにコンピュータ読み取り可能な記録媒体 | |
| JP6397678B2 (ja) | 疲労限度応力特定システムおよび疲労限度応力特定方法 | |
| KR20160097524A (ko) | 동특성 분석에 의한 사장교 케이블의 손상추정방법 | |
| JP2016144292A (ja) | 実験モード解析により機械の潤滑特性を計測するサーボ制御装置 | |
| JP4610955B2 (ja) | 塑性変形による熱的影響度の測定方法及び装置 | |
| JP7122670B2 (ja) | 疲労限度応力特定システム、疲労限度応力特定装置及び疲労限度応力特定方法 | |
| JP6477411B2 (ja) | 解析プログラム | |
| Morlier et al. | Virtual vibration measurement using KLT motion tracking algorithm | |
| JP6408564B2 (ja) | アクティブ制振装置および設計方法 | |
| TW201822948A (zh) | 偵測工具機的線性滑軌預壓值變化的方法 | |
| Huang | Electromechanical coupling efficiency of transverse vibration in piezoelectric plates according to electrode configuration | |
| JP7469660B2 (ja) | スポット溶接継手の内面応力評価方法及び熱弾性応力測定法の評価方法 | |
| Berke et al. | Stereo-DIC measurements of thermal gradient effects on the vibratory response of metals | |
| Kolhatkar | Nonlinear dynamic interactions between a rigid attachment bolted to a thin-walled sheet metal structure | |
| Drvárová et al. | Effect of accelerometer mass on the natural frequencies of the measured structure | |
| JP2015158400A (ja) | 応力測定方法 | |
| JP2023044390A (ja) | 材料試験機 | |
| JP2022135444A (ja) | 疲労限度特定装置及び疲労限度特定方法 |
Legal Events
| Date | Code | Title | Description |
|---|---|---|---|
| 121 | Ep: the epo has been informed by wipo that ep was designated in this application |
Ref document number: 17888692 Country of ref document: EP Kind code of ref document: A1 |
|
| NENP | Non-entry into the national phase |
Ref country code: DE |
|
| ENP | Entry into the national phase |
Ref document number: 2017888692 Country of ref document: EP Effective date: 20190625 |